Quasars in the 4D eigenvector 1 context: a stroll down memory lane
 Jack W. Sulentic
 Paola Marziani
- 1Instituto de Astrofísica de Andalucía-Consejo Superior de Investigaciones Científicas, Granada, Spain
- 2Istituto Nazionale di Astrofisica, Osservatorio Astronomico di Padova, Padova, Italy
Recently some pessimism has been expressed about our lack of progress in understanding quasars over the 50+ year since their discovery (Antonucci, 2013). It is worthwhile to look back at some of the progress that has been made—but still lies under the radar—perhaps because few people are working on optical/UV spectroscopy in this field. Great advances in understanding quasar phenomenology have emerged using eigenvector techniques. The 4D eigenvector 1 context provides a surrogate H-R Diagram for quasars with a source main sequence driven by Eddington ratio convolved with line-of-sight orientation. Appreciating the striking differences between quasars at opposite ends of the main sequence (so-called population A and B sources) opens the door toward a unified model of quasar physics, geometry and kinematics. We present a review of some of the progress that has been made over the past 15 years, and point out unsolved issues.
1. Introduction
The first 50 years of research on quasars has lead us to a paradigm involving three main (unresolved) components: (1) a supermassive black hole (SMBH; Salpeter, 1964; Zel'Dovich and Novikov, 1965), (2) an emitting accretion disk (AD; Shields, 1978; Malkan and Sargent, 1982), and (3) an obscuring torus (Antonucci and Miller, 1985). Component 3 arises from attempts to unify type-1 and 2 sources on the basis of orientation, and it is now being partially resolved in the nearest active nuclei thanks to the new generation of IR interferometers (Jaffe et al., 2004; Tristram et al., 2009; Burtscher et al., 2013, and references therein). A 4th component would involve narrow line emission and sometimes radio-jets extending on scales of parsecs, kpc or even Mpc along the rotation axis of the disk, resolved or partially resolved in the nearest sources (Capetti et al., 1996; Falcke et al., 1998). The AD may contribute to broad line emission and as such may be a constituent of the broad line region (BLR, Chen et al., 1989; Dumont and Collin-Souffrin, 1990; Eracleous and Halpern, 2003; Bon et al., 2007), while Component 4 involves only narrow-line region (NLR) emission unless the source is radio-loud. Cartoons showing the different components neatly aligned are likely too optimistic but we can hope it is often the case. Moving beyond this paradigm has not been easy leading to some expressions of frustration. Impediments to real progress involve lack of a clear definition of a quasar and the lack of any paradigm in which to contextualize source commonalities and differences. For a long time then we have been stuck with the paradigm as definition and the assumption that all quasars (or, better said, active galactic nuclei AGN) are the same.
During the past 15 years we have assembled a formalism designed to contextualize quasar diversity and identify the principal physical drivers of that diversity. This 4D Eigenvector 1 (4DE1) parameter space represents a surrogate H-R Diagram for type 1 AGN. We extend the definition of type-1 to include sources that show both broad-line emission from the principal optical and UV permitted lines and sources that show optical Fe II emission (Fe IIopt) and that are therefore expected to accrete at a moderate to high-rate (dimensionless accretion rates ≳10−3−10−2, Woo and Urry, 2002; Marziani et al., 2003c). 4DE1 was built upon pioneering studies of optical (Boroson and Green, 1992), UV (Gaskell, 1982), and X-ray (Wang et al., 1996) spectra. By the year 2000 enough data and ideas were in place to introduce the 4DE1 formalism and the idea of two quasar populations, A and B [Population A with FWHM(Hβ) ≤ 4000 km s−1; Population B(broader) with FWHM(Hβ) > 4000 km s−1, Sulentic et al., 2000a,b] to emphasize the many differences between high and low accreting type-1 sources. The populations may really represent two distinct quasar classes. Population A may be seen as the class that includes local Narrow Line Seyfert 1s (NLSy1s) as well as high accretors (Marziani and Sulentic, 2014), and Population B as the only class capable of radio-loudness (e.g., Zamfir et al., 2008), or else the two populations could be just the opposite extremes of a single quasar “main sequence” defined in the optical plane of the 4DE1 parameter space (Sulentic et al., 2011).
Developments in the statistical analysis before late 1999 of low-z quasar spectral properties are reviewed in Sulentic et al. (2000a). Here we retrace developments that came mainly afterwards, since the turn of the century, and that are associated with a better understanding and expansion of the original eigenvector 1 results. A recent work by Shen and Ho (2014, hereafter SH14) basically confirms many past results and hopefully reawakens interest in the subject. The aim of this paper is to review the main steps in the development and exploitation of 4DE1 mainly by the group of Sulentic and collaborators (Sections 3–6). We also review the “rediscovery” paper SH14 (Section 8) and mention its followup (Shen and Ho (2015). We maintain a loose chronological order (Sections 3–6) in an attempt to clarify which results can be considered established and which still lie on uncertain ground– therefore necessitating further study. We finally point out some major open issues (Section 9).
2. 2000: Formulation of an Eigenvector 1-based Parameter Space
The 4DE1 parameters introduced in 2000 involve:
1. full width half maximum (FWHM) of broad Hβ (HβBC);
2. equivalent width (or flux F) ratio of the optical FeIIλ4570 blue blend and broad Hβ (RFeII=W(FeIIλ4570)/W(Hβ) ≈ F(FeIIλ4570)/F(Hβ); see Figure 1). The choice of equivalent width was motivated by its widespread availability in low z (< 0.7) spectra. In more recent time we have preferred to use RFeII as defined from the intensity or flux ratio in order to avoid division by a continuum that is often steeply rising toward the blue;
3. profile shift at half maximum of high ionization line CIVλ1549 c();
4. soft X-ray photon index (Γsoft).
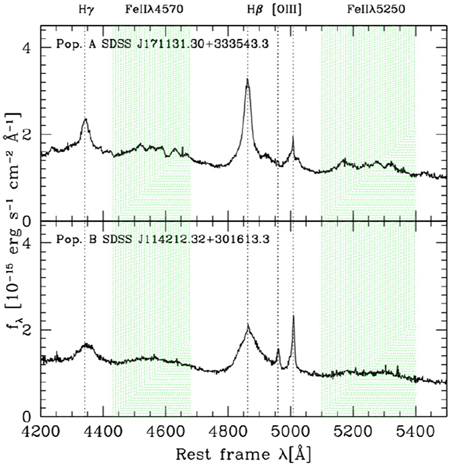
Figure 1. The Hβ spectral range of two SDSS sources of Pop. A (top) and Pop. B (bottom). Abscissa is rest frame wavelength in Å, ordinate is specific flux in units of 10−15 ergs s−1 cm−2 Å−1. The shaded areas indicate spectral regions where the main emission line contribution is due to Fe IIopt. On the blue side of Hβ the wavelength range of the shaded area defines FeIIλ4570 i.e., the Fe IIopt blended emission that is used to compute RFeII and to characterize Fe IIopt prominence along the quasar eigenvector-1 sequence.
The parameters are thought to be: (1) a measure of virialized motions in a low-ionization line emitting AD or flattened system of clouds that is considered an important virial estimator of black hole mass for large samples of quasars; (2) a sensitive diagnostic of ionization, and column density in BLR gas arising, as far as we can tell from shielded or outer parts of the BLR. The strength of Fe IIopt emission in many sources has been argued to support the AD origin for the emission (Collin-Souffrin et al., 1988; Dultzin-Hacyan et al., 1999; Joly et al., 2008) and a role for metallicity; (3) a strong diagnostic of winds/outflows in the higher ionization broad line gas; (4) a diagnostic measure of thermal emission likely connected with the accretion disk, and to the accretion state (e.g., Mineshige et al., 2000, although see Done et al., 2012, for a dissenting view). These measures were chosen because they were available for: (1) large numbers (100+) of low z quasars with (2) high S/N spectra (S/N > 20) and (3) because they showed statistically significant dispersion along the 4DE1 main sequence. They are Eigenvector 1 because they are strongly correlated and if parameters 3 and 4 had been included in the first principal component analysis (PCA) they would have contributed much of the power of Eigenvector 1. They are “orthogonal” in the sense that they involve parameters describing independent aspects of quasar phenomenology as well as different physical processes connected to the BLR.
One can mark 1998 as the year when theoretical attempts to model the BLR (of well-studied NGC 5548) were acknowledged to have failed at least in part (Dumont et al., 1998). We think the pessimism that followed is reflected in the incompatibility of measures for population A and B quasars (e.g., significantly different ionization parameter U and structure factor f, see page 18). After 1990, there has been a widening void between theory and observations, probably because the large diversity of quasar properties has not been taken into account as needed. Much more success is likely to arise from attempts at modeling Pop. A (e.g., I Zw 1) and B (NGC 5548) or individual spectral types (as defined by Sulentic et al., 2002; §4 below) separately. Two typical spectra of Pop. A and B sources are shown in Figure 1. Differences in line width, Fe IIopt prominence, Hβ line profile, as well as in [OIII]λλ4959,5007 strength are visually evident. Then the question of uniting the two solutions—or the need to invoke separate quasar populations (perhaps driven by a critical accretion rate, Marziani et al., 2014) can be addressed.
3. 2001: The Physical Drivers of 4DE1
After we proposed the 4DE1 contextualization we began to search for the physical drivers. We knew that, unlike stars, quasars are very unlikely to show the same spectroscopic properties at different viewing angles (Wills and Browne, 1986). Boroson and Green (1992) suggested L/LEdd as a possible physical driver by exclusion, as a “best guess.” Not source luminosity (an Eigenvector 2 parameter in their PCA), not simply orientation (the extreme range in FWHM alone Hβ precludes that) nor geometry –all were discussed much more. They were writing in the early 1990s using a sample of 87 quasars so their discussions are perhaps out of date from today's perspective. More than two measures would likely be needed to break the degeneracy between source orientation and physics. The following year we explored the physical drivers of source occupation along the optical “main sequence” (Marziani et al., 2001, Figure 2), and concluded that source orientation (θ) convolved with the ratio of quasar luminosity to black hole mass (L/MBH∝ Eddington ratio, as anticipated by Boroson and Green, 1992) could describe rather well source occupation in the optical plane of 4DE1. Figure 2 reproduces an overlay on our heterogeneous but high S/N sample (see also ESO Messenger for June 2001, Sulentic et al., 2001). The following year two of us considered the role of black hole mass over ≈ 8dex range (Zamanov and Marziani, 2002). This was accompanied by an attempt to estimate L/LEdd from L and MBH(Marziani et al., 2003c). MBH was also estimated from line width and scaling relations (Laor, 2000; Boroson, 2002).
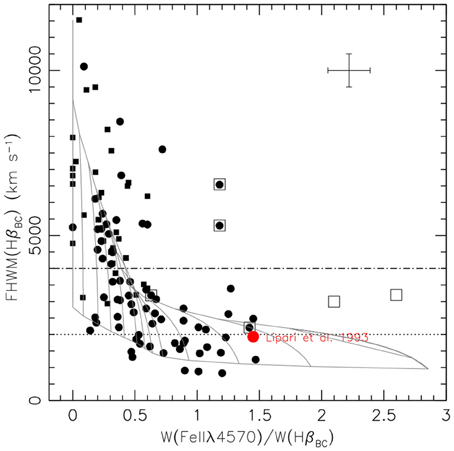
Figure 2. Simplified version of Figure 4 in Marziani et al. (2001). The 4DE1 optical plane shows sources from the Sulentic et al. (2000b) sample with a superposed grid of theoretical values of viewing angle i (10 ≤ i ≤ 40) and L/MBH, expressed in solar values, for 3.1 ≤ logL/MBH ≤ 4.5 (implying log L/LEdd ≈ 0), at steps of δlogL/MBH = 0.1. A value of logM ≈ 8 in solar units was assumed for U. Filled circles and squares represent RQ and RL sources, respectively. Boxes identify BAL QSOs (2 of them, Mark 231 and IRAS 0759+651 not in Sulentic et al., 2000b). The red spot mark the average for the strong FeII emitters of Lipari et al. (1993). Error bars in the upper right corner indicate typical 2σ uncertainties for a data point at FWHM ≈ 4000 km s−1 and RFeII ≈ 0.5. The dot-dashed line is the FWHM(Hβ) = 4000 km s−1 boundary between Pop. A and B, and the dotted lines at FWHM(Hβ) = 2000 km s−1 marks the FWHM limit of NLSy1s.
At this point it might be useful to compare the abstract of SH14 with that of Marziani et al. (2001). In one sense, SH14 is “one step forward and one step back.” The new paper uses a much larger sample of quasars drawn from SDSS (one step forward) but, most of the spectra that they use and measure (Shen et al., 2011) are unsuitable to produce an equal or greater description of the role for L/LEdd (one step back). SDSS is a gold mine but at the same time it is a minefield for the uninitiated user. Automated processing of these spectra is indeed a walk through a minefield. We have emphasized since 1996 the need for, and importance of, quasar spectra with high enough S/N and resolution to permit reliable spectroscopic parameter measures. That is why Boroson and Green (1992) was such a step forward and their measures are still used 25 years later.
Although it may sound disappointing, most low S/N quasar spectra are not suitable for useful spectroscopic measures. If this statement were untrue then, in the context of future quasar studies, most of the justification for 10 m class telescopes—beyond observing perhaps just obscured quasars—would be negated. Figure 3 shows a comparison of automated measures of SDSS quasars (Shen et al., 2011) used in the SH14 study with IRAF SPECFIT measures of Zamfir et al. (2010). The comparison involves the brightest quasars in SDSS-DR5 and therefore generally showing S/N > 20. Continuum S/N should not be confused with S/N computed in regions with strong emission lines. Surprisingly many of the FWHM Hβ measures used in this paper (Shen et al., 2011) are also strongly discordant with more detailed analysis presented a few years ago (Zamfir et al., 2010) for the 500 brightest DR5 quasars (Figure 3). This is especially true for so-called population B quasars with FWHM Hβ>4000 km s−1 as was shown in 2002 (Sulentic et al., 2002). Figure 3 in Marziani et al. (2003a) quantifies the dependence of FeII detectivity on S/N and FWHM Hβ. In Figure 3 of the present paper each Shen et al. (2011) measure is connected to the corresponding Zamfir measure. Taken at face value, automated measures can even mislead statistical analyses i.e., it is not that they fail occasionally, it is that they create categories of spurious classes of sources especially for large sample sizes. This is shown by the left panel of Figure 3 where the “outliers” in the optical plane of 4DE1 turn out to agree with the main sequence once more accurate measures are used. An additional problem is that HeIIλ4686 emission is apparently included as part of the FeII blue blend in the Shen et al. (2011) data. HeIIλ4686 measurements are not reported there. HeIIλ4686 is pernicious leading to overestimation of FeIIλ4570 strength, overestimation of Fe IIopt template width and claims of an Fe IIopt redshift relative to Hβ(Hu et al., 2008; Sulentic et al., 2012). This is shown by Figure 4 where the one FeII strong source is more straightforwardly interpreted in terms of weak FeII, and strong and very broad HeIIλ4686.
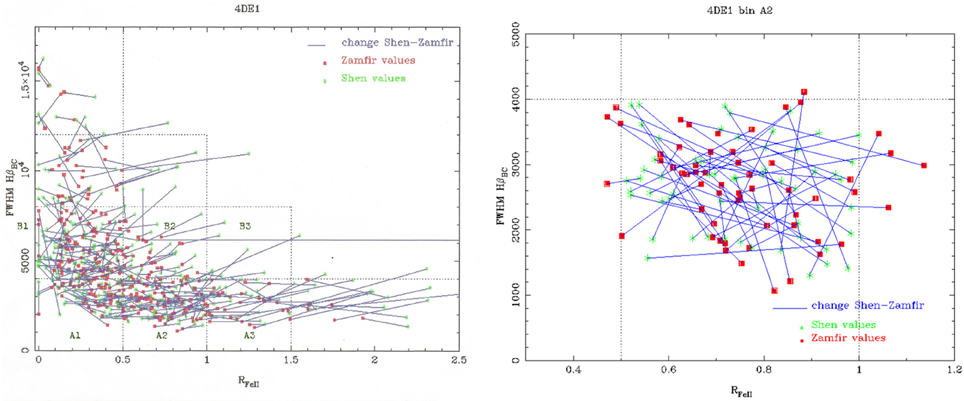
Figure 3. Left: a comparison between Shen et al. (2011) and Zamfir et al. (2010) in the optical plane of 4DE1 involving the FWHM of Hβ in km s−1 and the strength of optical FeII (RFeII parameter). The blue lines connect Zamfir et al. (2010) (green stars) with Shen et al. (2011) measurements for the same objects. Right: A2 and part of adjacent bins in the 4DE1 optical plane.
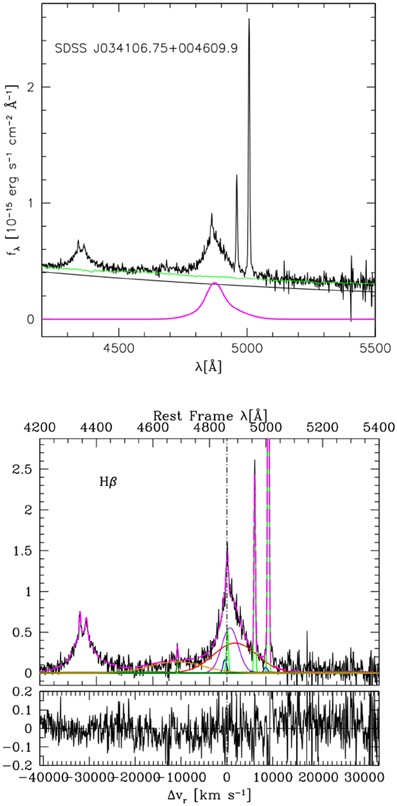
Figure 4. Top: The Hβ spectral range of source SDSS J034106.75+004609.9. Abscissa in rest-frame wavelength in Å, ordinate in specific flux in units of 10−15 ergs s−1 cm−2 Å−1. The black line traces the featureless continuum; the green line traces the total continuum that includes a contribution from the host galaxy. There is no detectable FeII emission. The magenta line traces the cleaned Hβ broad profile. Bottom: Hβ profile analysis. The excess on the blue side of Hβ (orange line) can be explained by significant HeIIλ4686 VBC emission. Hβ and Hγ are consistently fit with the same BC and VBC parameters [the BC (magenta) and VBC (red) decomposition is shown for Hβ only]. Narrow lines ([OIII]λλ4959,5007 and HβNC) have been modeled by a core and a (fainter) blue shifted component (blue line). The abscissæ are rest frame wavelength in Å radial velocity displacement from Hβ narrow component in km s−1 (lower panel), ordinate is specific flux normalized to fλ(5100 Å) ≈3.44·10−16 ergs s−1 cm−2 Å−1. The lower panel yields the residuals defined as observed minus model spectrum.
The new analysis might not have been “two steps back" if all quasar spectra were the same. Our work from 1989 to 2001 also emphasized the diversity of the spectroscopic (and other) properties of quasars. The concept of two quasar populations (A and B) was introduced to further emphasize this point—it is a simplified analog of the seven principal spectral types identified in the stellar H-R Diagram. Naturally low S/N spectra tend to diminish this diversity leading to the quite natural temptation to indiscriminately average many noisy spectra together in order to produce higher S/N composites. But without a context with which to average, these composites it confuses rather then clarifies the quasar phenomenology and raises an impediment to improved physical models. What would a composite of OBAFGKM stellar spectra give us?
Figure 1 of SH14 allows us to visualize the main E1 trend but it does not improve our understanding of the distribution of sources in the 4DE1 optical plane because the FeII blends, present in virtually all quasar spectra, cannot be properly detected, much less modeled, in 90–95% of the SDSS spectra. A continuum is likely fit on top of noisy FeII emission resulting in a zero, or too low, measure of FeII strength. A censored data analysis is appropriate in this context (Sulentic et al., 2002).
4. 2002—Eigenvector Binning and First Explorations of [OIII]λ5007
4.1. Defining Spectral Types
We are still speaking about pre-SDSS years. Further exploration/exploitation of 4DE1 required a larger sample but fewer then 200 quasars with moderate/high S/N spectra existed at this early time. While engaged in obtaining new data with 2 m class telescopes in Spain, Mexico, Italy and Chile we realized that another approach would be to bin the optical plane in order to better contrast quasars along the 4DE1 main sequence. Bin sizes were chosen so that all quasars within a given bin were statistically indistinguishable. If we were to bin stellar spectra we would bin by spectral type or even subtype since indiscriminate averaging will obscure any physical insights. Most of our papers showed that tremendous spectral diversity existed in the type-1 quasar population. We chose bins of equal size because we had at first no evidence that the physical drivers of 4DE1 source occupation correlate with measured properties in a way to justify unequal bins. We are not yet in a position to know for sure. SH14 rediscover binning but with bins of unequal size which seems to us a step back. Binning should be predefined rather than driven by a distribution in a parameter space defined using low S/N spectra. Our first paper showing average spectra of Hβ(Sulentic et al., 2002) revealed a clear change in the profile shape along the sequence with profiles for sources with lowest inferred Eddington ratio showing an extra very broad and redshifted component (VBC). This is not to say that the binning done by Sulentic et al. (2002) isolated sources that were scattering randomly around an average value in each bin: rather, the grid of Marziani et al. (2001) clearly shows that within each bin orientation and Eddington ratio trends were expected.
4.2. Very Broad Component and Very Broad Line Region
Striking differences motivated us however to separate quasars into two populations: population A, involving mostly radio-quiet (RQ) high accretors with symmetric Lorentz-like Hβ profiles, strong optical FeII emission, a CIVλ1549 blueshift / asymmetry and a soft X-ray excess. Population B sources are lower accretors including most of the classical radio-louds quasars (RL). They show composite double-Gaussian (BC+VBC) Hβ profiles, weaker optical FeII emission, unshifted (or redshifted?) CIVλ1549 and no soft X-ray excess. Some quasars show an unusually strong VBC component that dominates the Hβ profile, e.g., (PG 1416–129, Sulentic et al., 2000c). At first the BC + VBC decomposition was purely phenomenological, but extreme VBC sources give us a clearer insight into the shape of Hβ VBC. In most cases it was possible to reproduce Hβ for the overwhelming majority of population B sources and specifically the ones classified as AR,R or AR,B (i.e., redward asymmetric, AR, with red or blueshifted peak, Sulentic, 1989). A very broad line region (VBLR) has been postulated since the mid 1980s and was initially suggested to be due to optically thin gas in the innermost BLR (Peterson and Ferland, 1986; Morris and Ward, 1989; Zheng, 1992; Shields et al., 1995). Optical “thinness" has however strong implications for the maximum luminosity associated with a line: if the medium is optically thin the intensity of the same recombination line is governed by the volume and density of the emitting gas and is not directly related to the luminosity of the ionizing continuum (Marziani et al., 2006).
Earlier observational definitions were based mostly on the CIVλ1549 profile. Brotherton et al. (1994a) postulated the existence of a intermediate line region emitting most of CIVλ1549 of FWHM ≈ 2000 km s−1, and a broader component (the VBC) to account for the extended CIVλ1549 wings. Corbin (1995) interpreted the redshift often observed in the Hβ wings as gravitational redshift affecting the VBC. By 2002–2003 it was clear that the profile analysis of the CIVλ1549 profile was more ambiguous than the one of Hβ. While Hβ customarily shows a narrower component sharply separated from the broad component, the CIVλ1549 profile of Pop. B sources shows a prominent semi-broad core that merges smoothly with the line base. We already had suggested an interpretation in terms of density stratified NLR to account for the CIVλ1549 core profile (Marziani et al., 1996; Sulentic and Marziani, 1999).
No VBC is apparently present in FeII: we run several tests and we concluded that the VBC cannot be as strong in Hβ and, if present, is too weak to be appreciable. The BC and VBC decompositions therefore reflects the ionization stratification within the BLR, simplifying what is probably a continuous radial trend. Two main regions are identified: a higher ionization VBLR, associated with the VBC (i.e., line base and line wings), and a lower one associated with the BC, that emits most of all of FeII. The absence of FeII emission can be considered a defining property of the VBLR.
It was later shown that the VBC is strong in luminous quasars, and that its luminosity cannot be explained by optically thin gas (Marziani et al., 2009). Presently, the VBLR is understood as inner emitting region whose high ionization degree leads to a lower responsivity to continuum changes (Korista and Goad, 2004; Goad and Korista, 2014).
4.3. Blue Outliers: Linking Wind Signatures on Widely Different Spatial Scales?
During this year we also began exploration of [OIII]λ5007 as a diagnostic of the narrow line region. This kind of study requires very high resolution. In fact Boroson and Green (1992) expressed frustration with attempts to parameterize [OIII]λ5007 using standard measures like equivalent width. The reason for this was that even the very good spectra employed in Boroson and Green (1992) were too low resolution to allow realization that there are two distinct components of [OIII]λλ4959,5007. We obtained spectra at San Pedro Martir, Calar Alto and KPNO and identified a class of “blue outlier” sources (Zamanov et al., 2002), where the profile appeared with a blueshift >250 km s−1 in amplitude and the velocity separation between the two [OIII]λ5007 components (unshifted+ blueshifted) was largest. They appear to favor population A quasars (Figure 5) which also show large CIVλ1549 blueshifts, suggesting a kinematic linkage between the narrow and broad line regions. Additional examples were presented the next year (Marziani et al., 2003c), and the existence of large blueshifts and semi-broad [OIII]λλ4959,5007 emission has been confirmed in a number of studies (Aoki et al., 2005; Bian et al., 2005; Komossa et al., 2008; Zhang et al., 2011, 2013). Recent studies even find emission extended on galactic scales giving rise to an integrated semibroad profile (Cano-Díaz et al., 2012), although the original results of Zamanov et al. (2002) indicated that the semibroad [OIII]λλ4959,5007 component originated in a very compact NLR, ~ 1 pc in size. At that time and with our data the question mark on the BLR-NLR linkage was wise. Nowadays it seems that quasar outflows are linked from the BLR up to the circumnuclear regions, where molecular outflows are detected, at least in the extreme source Mrk 231 (Feruglio et al., 2015; Tombesi et al., 2015), a BAL QSO that was noted in our early analysis because of the abnormally large Hβ FWHM that placed the source outside the main sequence of 4DE1 (Marziani et al., 2001; Sulentic et al., 2006). It is unfortunate that the binning in SH14 was nonuniform because it damped out some of the [OIII]λ5007 profile diversity in their Figure 2. Bin size should not be motivated to maximize the number of quasars within a bin but rather to explore the diversity of type-1 spectroscopic properties within the parameter space. We have evidence that even our already rather fine subdivision should be made even finer. Given the complexity of Fe IIopt emission and weakness of [OIII]λλ4959,5007 in extreme population A sources one must be especially cautious interpreting results for these quasars.
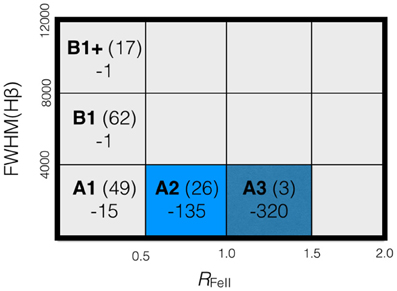
Figure 5. Average shift of [OIII]λ5007 (negative is blueshift) for spectral types in the optical plane of 4DE1. Numbers in parentheses indicate sources in each bin with the dataset available to us in late 2001.
The essential point that emerged in 2002/2003 is that [OIII]λλ4959,5007 shows two components. The narrower unshifted component apparently shows a strong change along the 4DE1 main sequence becoming very weak or absent in extreme Pop. A (highest L/LEdd) sources. A second semibroad and blueshifted component may be present in all sources but is most prominent in extreme population A where it shows blueshifts up to ~ 1000 km s−1 (I Zw 1 is a famous example of the so-called blue outliers). This is not a novelty of SH14, since this trends was discussed in Marziani et al. (2006) on the basis of the previous 2002–2003 papers. The semibroad component is difficult to study in many sources requiring spectra of very high S/N and resolution. In some of these spectra [OIII]λλ4959,5007 is at least partly resolved into two components (Grupe et al., 1999; Zhang et al., 2013). A further problem mentioned in some of the above references involves slit effects connected with extended emission line region (EELR) contaminating the spectrum.
5. 2003: An Useful, Uniform Dataset After Boroson and Green (1992)
5.1. A Physical Dichotomy between Pop. A and B?
This was “a very good year” when observations in Mexico, Spain, Italy, and Chile (ESO) enabled us to expand our sample to more than 200 low z quasars. This was a big deal on the eve of the SDSS. Even better we began to explore in more detail of role of black hole mass and Eddington ratio along the quasar main sequence. We were not the first but the 4DE1 approach allowed us to gain some insight, and to suggest that the separation between Pop. A and B occurred as a fairly well defined L/LEdd, ≈0.1 − 0.2 for a quasar with log MBH~8 (Marziani et al., 2003c). It is possible that this critical Eddington ratio may signal the transition to a slim disk from an optically thick, geometrically thin disk (Abramowicz et al., 1988).
Are population A and B simply extreme ends of a main sequence or do they represent two distinct quasar populations? This remains an open question as far as we are concerned, although there is now evidence that the A/B differences could be associated with an accretion mode transition, with higher L/LEdd sources accreting in an advection dominated accretion flow (ADAF, Marziani et al., 2014, and references therein). The gravitational explanation for the large redshift observed at the line base of Hβ was found to be too large to be consistent with the assumption of predominantly virial motion (Marziani et al., 2003c).
5.2. The RL/RQ Dichotomy
It was also the year when more detailed studies of the RQ—RL dichotomy were explored in the 4DE1 context, first with our own atlas (Sulentic et al., 2003) and later with the 500 brightest SDSS DR5 quasars (Zamfir et al., 2008). The strategy here was to explore the distribution along the 4DE1 main sequence of the most unambiguous class of RL quasars–those showing classical double-lobe (LD) radio morphology. They clearly show a strong concentration at the low L/LEdd (Population B) end of the main sequence. Almost all show a consistent absence of a soft X-ray excess and CIV blueshift. The restricted 4DE1 parameter space occupation of LD RL sources is perhaps the strongest evidence for a physical dichotomy between RL and RQ quasars (Figure 6)—if 4DE1 parameters reflect fundamental aspects of BLR structure and kinematics. The situation is much less clear for core-dominated RL—a few are interpreted as preferentially aligned LD sources but the majority especially those weaker than the LD sample lower limit (logP1.415GHz ≈ 31.6 ergs s−1Hz) have been attributed to diverse scenarios. If these scenarios reflect reality they imply that some CD sources below logL1.415GHz ≈ 31.6 ergs s−1Hz−1 may not be RL in the classical sense. They will rise out of the RQ population and many will become rapidly quenching radio sources (e.g., Fanti et al., 1995), or eventually cross the LD boundary producing LD morphology (as proposed for the compact steep spectrum (CSS) radio sources). It was shown in Zamfir et al. (2008) that CD sources in the range logL1.415GHz~ 30.0–31.6 ergs s−1Hz−1 distribute like RQ quasars and not LD RL. Looking at Figures 4, 5 of Zamfir et al. (2008) makes it obvious that 4DE1 has much to say about the RL-RQ dichotomy.
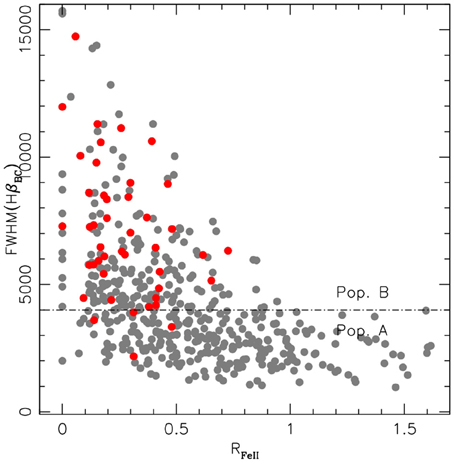
Figure 6. The 4DE1 optical plane involving the width of Hβ and the strength of optical FeII. The horizontal line marks the boundary between population A (lower half of the diagram) and B (upper half) sources. Source occupation is shown for the 470 brightest SDSS-DR5 quasars (z < 0.75) with highest S/N SDSS spectra (Zamfir et al., 2008). Gray and red dots represent RQ and lobe dominated LD RL quasars. The latter class shows a strong preference for the Population B zone.
6. 2004(+2007): interpreting the rest-frame UV spectrum and the CIVλ1549 profiles along 4DE1
Up to this point we were not in a position to explore the other 4DE1 parameters in much detail. Myriads of CIVλ1549 spectra existed by this time including the very good spectra from the Palomar surveys (e.g., Barthel et al., 1990) but we had no way to reliably estimate quasar rest frames. Since we knew that CIVλ1549 profile shifts showed large diversity along the 4DE1 main sequence we could not proceed. We could not use existing studies (Brotherton et al., 1994b) because their methods of CIVλ1549 profile decomposition were incompatible with ours and not physically justified (Sulentic and Marziani, 1999). We argued that a narrow component of CIVλ1549 must be cautiously subtracted and that it was stronger in population B quasars, with semi-broad profiles. Our approach was motivated by lack of a well defined critical density associated with CIVλ1549 (instead suppressing [OIII]λλ4959,5007 at density nH≳106 cm−3. The assumption of a density radial trend gave additional arguments that CIVλ1549 narrow component (NC) could be broader than [OIII]λλ4959,5007 by up to 3 times following the simple modelization of Netzer (1990). CIVλ1549 emission it favored at high ionization parameter, with a steep decrease toward lower ionization conditions. The emissivity of Hβ has instead a much flatter dependence on ionization parameter, and its volume integrated profile is weighted toward the outer emitting regions. Hence, the CIVλ1549 NC profile may merge smoothly with the BC, while the Hβ NC profiles stands out as an easily separable feature that is discontinuous from the BC. Since CIVλ1549NC is due mainly to the inner NLR, CIVλ1549NC blueshift within a few hundreds km s−1 per second are expected (Zamanov et al., 2002; Aoki et al., 2005; Bian et al., 2005; Boroson, 2005; Komossa et al., 2008).
We also gave a recipe for estimating if NC is present and how to subtract it. Obviously if one does not distinguish population A and B things look more confusing. If CIVλ1549 NC is present and you do not subtract then you measure CIVλ1549 too narrow, too strong and probably less shifted. Baskin and Laor (2005) made a NC subtraction although it was much lower for sources in common. In population B, where the NC merges smoothly with the BC, an NC definition is often operationally ambiguous. However, not subtracting the NC may introduce a significant bias lowering MBH mass estimates, and making them fortuitously consistent with the Hβ-derived ones (Sulentic et al., 2007).
Finally the number of low-z spectra with CIVλ1549 spectra in the HST archive passed 100 enabling us to produce binned spectra (Bachev et al., 2004; Sulentic et al., 2007). Binning (and rest frame estimation) came from previously obtained matching optical spectra of the Hβ region. Now it was very clear that CIVλ1549 blueshifts were a Population A phenomenon likely associated with a disk wind or outflows in these highest accretors (Figure 7).
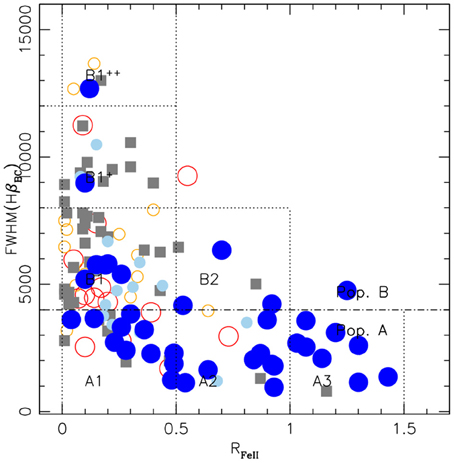
Figure 7. Optical plane of 4DE1 as in Figure 6, for all low-z quasars with measurable HST/FOS UV spectra (Sulentic et al., 2007). Different symbols represent the amplitude of the CIVλ1549 blueshift at half maximum normalized by FWHM(Hβ) (a measure of the virial broadening): dark blue circles: Δvr ≤ −0.1, pale blue: −0.1 < Δvr ≤ −0.05; gray (unshifted): −0.05 < Δvr ≤ +0.05, pale red: km s−1+0.05 < Δvr ≤ +0.1; red: Δvr≥ +0.1. Filled symbols: Pop. A, open symbols: Pop. B, squares: RL, circles RQ.
This year also saw the beginning of our study of high redshift quasars in the 4DE1 context. This required 8 m class telescope time because we were forced to follow Hβ + [OIII]λ5007 into the infrared in order to both assign high z sources to the correct bin and to obtain a reliable estimate of the rest frame. We used VLT-ISAAC to obtain spectra of unprecedented S/N for 52 high z sources. We could, for the first time, observe changes in 4DE1 source occupation and we could explore UV surrogates for estimating rest frame and black hole mass—lessening the need for IR spectra of large samples.
Equivalent measures for FWHM(Hβ) and RFeII (items 1 and 2 in §2) have been identified in the redshifted UV spectra of high-redshift quasars (Negrete et al., 2014a). In the simplest consideration of quasar diversity involving Population A and B sources (described below), virtually all multi-wavelength measures of quasars show differences (see Table 5 of Sulentic et al., 2007).
7. 2009
Until the mid 2000s our main results were based on the study of low-z, predominantly low luminosity sources. In 2009 we presented the largest instalment of IR spectra of Hamburg-ESO intermediate redshift quasars covering the Hβ spectra range (Marziani et al., 2009). In total, considering previous batches (Sulentic et al., 2004, 2006), we had data available for 52 very luminous quasars. Comparison with previous observations at lower L allowed as to start the analysis along the L dependent “eigenvector 2.” Perhaps the most remarkable result was the detection of the systematic increase in minimum-FWHM as a function of luminosity, a trend that is expected if: (1) the Hβ line profile is virially broadened; (2) L/LEdd = 1 is a physical limit; and (3) the BLR radius scales as L∝rα with luminosity, with α≈0.5−0.65 (Kaspi et al., 2005; Bentz et al., 2013). We cannot find high luminosity narrow line sources if these assumptions are valid. Negrete et al. (2012) and Marziani and Sulentic (2014) have shown the equivalence of broader-lined sources with the prototype NLSy1 I Zw 1. This implies that the limit at FWHM = 2000 km s−1 for defining NLSy1 sources makes sense only at low luminosity. Relaxing this limit would allow to appreciate that there are sources which are analogous to local FeII-strong NLSy1s in terms of physical conditions but simply with broader lines. A more physically oriented criterion could attempt to isolate sources at L/LEdd → (1), which means applying the empirical criterion RFeII≳1 (i.e., to isolate the sources we called extreme accretors, xA, in Marziani and Sulentic, 2014). A second intriguing result was the high frequency of blueshifted, low equivalent width [OIII]λ5007 profiles.
8. 2014, or the Year of the Final Rediscovery
8.1. Results Involving [OIII]λλ4959,5007
SH14 establish in a firmer way the sequence of [OIII]λλ4959,5007 profile behavior, something also described much earlier (Zamanov et al., 2002; Marziani et al., 2003b, 2006; Marziani and Sulentic, 2012). Figure 5 supports the trend concerning shifts of [OIII]λ5007 shown in their Extended Data Figure 2. Its significance was discussed in the above references and also by Bian et al. (2005), Hu et al. (2008), and Komossa et al. (2008). These finding may support, especially at low z and luminosity, an evolutionary interpretation of E1 (Dultzin-Hacyan et al., 2007; Marziani et al., 2014): at the extreme Pop. A end, small MBH black holes accreting at high rate, with evidence of circumnuclear star formation (e.g., Sani et al., 2010); at the end of population B, mostly very massive quasars associated with low accretion rate and old structures like extended radio-lobes of Fanaroff-Riley II sources. The evolutionary interpretation seems straightforward for RQ quasars. However, while the properties of extreme population A and B are obviously different, and old radio sources are preferentially found at the extreme of population B (Zamfir et al., 2008), it is still not obvious which sources may be considered the radio loud progenitors of FRII in the 4DE1 sequence. A tantalizing possibility is that compact-steep sources (CSS) may evolve into FRII (van Breugel et al., 1984; Sulentic et al., 2015).
The panel SFI of SH14 shows the [OIII]λλ4959,5007 “Baldwin effect,” i.e., a systematic decrease of W([OIII]λλ4959,5007) with L. It has already been stressed (Netzer et al., 2004), and is consistent with the VLT data of Hamburg ESO quasars (Sulentic et al., 2004, 2006; Marziani et al., 2009). It is interesting that SH14 find a different trend for the [OIII]λλ4959,5007 blue wings—in the sense that wings remain prominent also at large luminosity, and shows little or no Baldwin effect (cf. Zhang et al., 2013). The absence of a Baldwin effect in the blueshifted line component is consistent with a nuclear origin of the outflow, as originally suggested by Zamanov et al. (2002).
8.2. Physical Interpretation of the Optical E1 Diagrams
SH14 adopt an approach that is at first as surprising as it is unconventional. They consider that quasars hosting massive black holes—associated with larger hosts—should form in denser environments. They conclude that quasars with higher RFeII are on average less massive because they form in less dense environments. The deduction is intriguing and, as presented, has a statistical value: it supports the idea that there is also a trend of mass with RFeII that may lead to a sequence of L/MBH if the L range is not large. This would account for a displacement in the horizontal direction i.e., RFeII, but not in the direction of FWHM. They then conclude that the spread in FWHM is not due to MBH and may largely be due to orientation. As a proof it is incomplete. Their approach also follows the hypothesis that it is not possible to have strong FeII in very massive sources. However, this is contradicted by our VLT–ISAAC observations of 52 high luminosity ESO-Hamburg quasars where we often find strong FeII(Sulentic et al., 2004, 2006; Marziani et al., 2009) that led to even suspect an “anti-Baldwin effect” for Fe IIopt. In our opinion, a more convincing proof is offered by the stellar velocity dispersion σ⋆ systematically decreasing with increasing FeII at fixed quasar luminosity. If MBH and host galaxy bulge mass are tightly correlated (Ferrarese and Merritt, 2000; Gebhardt et al., 2000), then FeII strength increases with the L/M ratio (Sun and Shen, 2015).
In order to test the effect of orientation SH14 consider the ratio between black hole mass (derived from the MBH–σ⋆ relation) and the virial product r FWHM2: = . The parameter is the inverse of the structure factor f as customarily defined. should be independent of line width if not influenced by viewing angle. A dependence on orientation is however expected from the assumption of a flattened, axially symmetric broad line region. SH14 indeed find a strong dependence and conclude that orientation strongly affects FWHM Hβ. The orientation effect has been extensively explored, and a strong dependence confirmed, using radio-loud quasars where orientation can be inferred from radio morphology (Wills and Browne, 1986; Sulentic et al., 2003; Jarvis and McLure, 2006; Zamfir et al., 2008; Runnoe et al., 2012, 2013). This result adds evidence to the hypothesis that orientation is indeed vertically displacing sources in the 4DE1 optical plane (as clearly also seen in Marziani et al., 2001). It leaves open the possibility that f is changing due to other effects (for example Eddington ratio, although it is reasonable to expect that the effect of L/LEdd is not as large as that due to orientation).
The next conclusion in SH14 is quite surprising: that orientation is driving the change in Balmer line profiles between Population B (broader) and Population A (narrower). A significant vertical displacement is expected from MBH (since FWHM ). Zamanov and Marziani (2002), in a paper that complemented Marziani et al. (2001) showed the effect of changing MBH on the optical plane. We also considered the hypothesis that orientation was the dominating factor in 4DE1 and that it was driving Pop. A and B differences. We concluded that this is very unlikely: there are differences not only in line profiles but also in diagnostic line ratios that cannot be reconciled with an orientation effect, and demand a change in physical conditions. The grid in Marziani et al. (2001)—derived also considering trends in diagnostic ratios—was computed for a fixed black hole mass. It showed that the effect of orientation is most important for sources with weak RFeII. If more luminous sources are included we find a vertical spread associated with increasing mass: i.e., large RFeII and large FWHM. A 4DE1 contextualization must therefore involve at least 3 dimensions in order to distinguish between the effects of orientation and mass. And the SH14 results still do not provide an estimation of viewing angle that is valid for individual sources.
Accepting at face values the results of Marziani et al. (2001) and SH14 the conclusion would be that spectral type A1 (RFeII ≤ 0.5, FWHM ≤ 4000 km s−1) is mainly due to face-on population B sources. An inspection of the sources in spectral bin A1 for the sample of Marziani et al. (2003c) indeed reveals a composite distribution. Bin A1 is populated by sources which could be Pop. B oriented pole-on (i.e., powerful CD radio-loud sources showing a relatively narrow BC and a faint VBC) but also by sources similar to A2 with lower RFeII. The latter type slightly outnumbered the type B sources in our samples (including the one of Zamfir et al., 2010), yielding a median A1 profile consistent with a Lorentzian function.
8.3. 4DE1 Parameters
Lowest W(CIVλ1549) sources colored black/blue are favoring the lower end of the main sequence in the RFeII vs FWHM Hβ plane. This rediscovered trend in SH14 SFIV was previously reported in Bachev et al. (2004) and Sulentic et al. (2007). Note that sources in Population bin A1 do show relatively large W(CIVλ1549). The CIVλ1549 equivalent width is especially useful for identifying spectral bin type of high redshift quasars. Negrete et al. (2014b) discuss UV identification criteria in the 4DE1 context showing that W(CIVλ1549) < ~ 50 Å is a sufficient criterion for identifying extreme Pop. A sources (bin types A2, A3 and A4—but not A1). CIVλ1549 as well as intermediate ionization line widths and profile shapes distinguish bin A1 from B1.
Early work resulted in the inclusion of Γsoft as a principal 4DE1 parameter. The presence of a hard X-ray power-law may represent the best “operational definition” unifying all AGN but it was found to show less intrinsic dispersion than the soft X-ray photon index (Brandt et al., 1997). There is a clear trend along the main sequence but SH14 can only rediscover in their SFVII what we have already learned (Wang et al., 1996; Sulentic et al., 2000b). It is the availability of X-ray spectra that limits our statistical analyses. The main sequence trend is clearest when comparing mean/median measures for the upper (Pop. A) and lower (Pop. B) ends. Spectral types A2–A4 show the largest soft X-ray excesses and Pop. B only show a hard power/law. A comparison of all available (up to 2006) XMM spectra (n = 20–40) for Pop. A and B sources (Sulentic et al., 2008) confirms the differences originally reported in Sulentic et al. (2000b) in the sense that only Pop. A quasars show a soft excess. A later analysis of 156 XMM sources consistently revealed a highly significant anti-correlation between Γsoft and FWHM(Hβ) (Bianchi et al., 2009). SH14 show more Chandra/XMM data points than were available in 2006 and 2009 but it is unclear what filters have been applied to existing X-ray data (e.g., number of hard/soft X-ray photons detected).
8.4. RL/RQ Dichotomy
There has been considerable work seeking connections between 4D Eigenvector 1 parameters and radio properties both to use radio-loud sources as orientation indicators and to explore the RQ-RL dichotomy (Wills and Browne, 1986; Marziani et al., 2001; Rokaki et al., 2003; Sulentic et al., 2003; Zamfir et al., 2008). SH14 wisely distinguish between core and lobe dominant RL sources in their SFIX. The problem with this “rediscovery” and a step backwards comes from their adopted definition of radio-loudness. A widely used criterion sees as RL all sources with radio/optical flux ratio RK > 10 (Kellermann et al., 1989). Our own work (Sulentic et al., 2003; Zamfir et al., 2008) has focussed on lobe-dominated (LD) RL sources as the parent population of classical RL quasars. LD sources show a well defined lower limit in radio to-optical power ratio (RK > 70) and radio power (logPν ≳ 31.6 [ergs s−1 Hz−1]) and a restricted occupation along the upper end of the 4DE1 main sequence. CD sources do not show these properties and those between RK = 10–70 distribute along the main sequence like the RQ quasar majority. Inclusion of these sources in a RL sample will tend to obscure differences (and dichotomy) between RQ and RL quasars. Perhaps ironically, a larger sample of the brightest 150 LD quasars from SDSS DR9 confirms our original lower radio power limit for these sources as well as their restricted 4DE1 population B occupation.
9. Important Open Issues
The previous sections outline an undeniable progress in the understanding of quasar multifrequency properties, with a successful contextualization in eigenvector 1 based schemes. We think that there are however some open issues that should be faced openly to set eigenvector 1 studies on a firmer ground. The first one is the formation of Fe IIopt and FEIIUV lines. Current photoionization calculations do not allow to reproduce sources with RFeII≳1, and it is still unclear whether this is a shortcoming of photoionization codes that, being based on a mean escape probability formalism for the treatment of radiation transfer, are not suited to consider low ionization line formation in the extended partially ionized zone where absorption processes are mainly non-local. On the one hand a study of other low ionization lines like the CaII IR triplet indicate that a dense, low ionization photoionizing medium can reproduce their total emission even in the most luminous sources (Matsuoka et al., 2007; Loli Martínez-Aldama et al., 2015). On the other hand, extreme Pop. A sources with RFeII≳1 are still poorly understood. They are most likely affected by a strong wind that may lead to shielding of the continuum (e.g., Elvis, 2000; Leighly and Moore, 2004; Leighly et al., 2007) or to mechanical heating of the line emitting gas. The relatively old paper by Marziani et al. (2001) estimated a decrease in ionization parameter U with increasing L/LEdd, but connect U and FeII prominence on an empirical relation and on crude scaling assumptions. Another aspect, that is severely constrained by data availability, is the interpretation of the Γsoft that may complicated by the presence of the warm absorber (Chakravorty et al., 2012; Done et al., 2012). Last, we have to mention that not all workers agree that the CIVλ1549 blueshift can be interpreted in terms of an outflow (Gaskell and Goosmann, 2013), and that the best approach to extract a virial broadening indicator from the line width of Hβ, especially in Pop. B, is still a debated issue (e.g., Collin et al., 2006; Marziani and Sulentic, 2012; Shen, 2013). In this context, it remains important to ascertain the nature of the redward displacement of the VBC in Pop. B sources.
10. Conclusion
The efforts reviewed in this paper consistently point toward an increasing ability to systematically organize quasar properties. Over the last 15 years, most main spectral energy distribution and spectrophotometric parameters have been investigated in a eigenvector-1 context. Physical parameters that were found to be most relevant in the interpretation are Eddington ratio and black hole mass. Aspect also plays an important role, as several properties such as line width appear to be orientation-dependent. An important physical parameter whose relevance still needs to be assessed is black hole spin. Since the jet power depends on the square (or even to a larger power) of the black hole angular velocity (Blandford and Znajek, 1977; Tchekhovskoy et al., 2010), the black hole spin is considered a prime factor to account for the radio-loud radio-quiet dichotomy. What we also miss is a characterization of morphology and surrounding environment along the eigenvector-1 sequence. At least some NLSy1 nuclei reside in disk-dominated galaxies that are characterized by pseudo-bulges, not real bulges (Orban de Xivry et al., 2011). On the other hand, powerful RL sources are mainly host in elliptical galaxies (e.g., Gürkan et al., 2014). An analysis following the eigenvector 1 criteria may connect evolution of nuclear activity and evolution of host galaxies.
SH14 and Sun and Shen (2015) confirm several empirical trends that were discovered earlier. Among them the ones involving [OIII]λλ4959,5007, distributional differences of RL/RQ sources in 4DE1, Hβ profile properties as well as soft X-ray and CIVλ1549 measures. SH14 add an empirical verification that orientation effects matter also for RQ sources—something missing from earlier papers that used the FWHM dependence on orientation derived from RL samples. It does not clarify the physical factors driving the location of sources in the 4DE1 optical plane. Only a multidimensional approach involving at least MBH, L/LEdd and orientation (cf. Laor, 2000; Marziani et al., 2001; Zamanov et al., 2002) can lead to a final clarification of these issues and successful development of a physical model.
Conflict of Interest Statement
The authors declare that the research was conducted in the absence of any commercial or financial relationships that could be construed as a potential conflict of interest.
Acknowledgments
A special thank you to Chony del Olmo for the production of Figure 3. We also wish to thank the many collaborators, post-docs and former students that, over almost two decades, have contributed to the development of the eigenvector 1 conceptualization: Deborah Dultzin, Tomaž Zwitter, Giovanna M. Stirpe, Alenka Negrete, Radoslav Zamanov, Chony del Olmo, Geli Martínez-Carballo, Mauro D'Onofrio, Rumen Bachev, Massimo Calvani, Patrizia Romano, Mary Loli Martínez Aldama, Ilse Plauchu-Frayn.
References
Abramowicz, M. A., Czerny, B., Lasota, J. P., and Szuszkiewicz, E. (1988). Slim accretion disks. Astrophys. J. 332, 646–658. doi: 10.1086/166683
Antonucci, R. (2013). Astrophysics: quasars still defy explanation. Nature 495, 165–167. doi: 10.1038/495165a
Antonucci, R. R. J., and Miller, J. S. (1985). Spectropolarimetry and the nature of NGC 1068. Astrophys. J. 297, 621–632. doi: 10.1086/163559
Aoki, K., Kawaguchi, T., and Ohta, K. (2005). The largest blueshifts of the [O III] emission line in two narrow-line quasars. Astrophys. J. 618, 601–608. doi: 10.1086/426075
Bachev, R., Marziani, P., Sulentic, J. W., Zamanov, R., Calvani, M., and Dultzin-Hacyan, D. (2004). Average ultraviolet quasar spectra in the context of eigenvector 1: a baldwin effect governed by the eddington ratio?. Astrophys. J. 617, 171–183. doi: 10.1086/425210
Barthel, P. D., Tytler, D. R., and Thomson, B. (1990). Optical spectra of distant radio loud quasars. I - data: spectra of 67 quasars. Astron. Astrophys. Suppl. Ser. 82, 339–389.
Baskin, A., and Laor, A. (2005). What controls the CIV line profile in active galactic nuclei? Mon. Not. R. Astron. Soc. 356, 1029–1044. doi: 10.1111/j.1365-2966.2004.08525.x
Bentz, M. C., Denney, K. D., Grier, C. J., Barth, A. J., Peterson, B. M., Vestergaard, M., et al. (2013). The low-luminosity end of the radius-luminosity relationship for active galactic nuclei. Astrophys. J. 767:149. doi: 10.1088/0004-637X/767/2/149
Bian, W., Yuan, Q., and Zhao, Y. (2005). The blueshift of the [OIII] emission line in narrow-line Seyfert 1 galaxies. Mon. Not. R. Astron. Soc. 364, 187–194. doi: 10.1111/j.1365-2966.2005.09552.x
Bianchi, S., Bonilla, N. F., Guainazzi, M., Matt, G., and Ponti, G. (2009). CAIXA: a catalogue of AGN in the XMM-Newton archive. II. Multiwavelength correlations. Astron. Astrophys. 501, 915–924. doi: 10.1051/0004-6361/200911905
Blandford, R. D., and Znajek, R. L. (1977). Electromagnetic extraction of energy from Kerr black holes. Mon. Not. R. Astron. Soc. 179, 433–456. doi: 10.1093/mnras/179.3.433
Bon, E., Popović, L. Č., and Gavrilović, N. (2007). “The hidden disk emission in the single peaked Sy1 balmer emission lines,” in Proceedings of the VI Serbian Conference on Spectral Line Shapes in Astrophysics, American Institute of Physics Conference Series, Vol. 938, eds L. C. Popovic and M. S. Dimitrijevic (Sremski Karlovci), 59–64.
Boroson, T. (2005). Blueshifted [O III] emission: indications of a dynamic narrow-line region. Astrophys. J. 130, 381–386. doi: 10.1086/431722
Boroson, T. A. (2002). Black hole mass and eddington ratio as drivers for the observable properties of radio-loud and radio-quiet QSOs. Astrophys. J. 565, 78–85. doi: 10.1086/324486
Boroson, T. A., and Green, R. F. (1992). The emission-line properties of low-redshift quasi-stellar objects. Astrophys. J. Suppl. Ser. 80, 109–135. doi: 10.1086/191661
Brandt, W. N., Mathur, S., and Elvis, M. (1997). A comparison of the hard ASCA spectral slopes of broad- and narrow-line Seyfert 1 galaxies. Mon. Not. R. Astron. Soc. 285, L25–L30. doi: 10.1093/mnras/285.3.l25
Brotherton, M. S., Wills, B. J., Francis, P. J., and Steidel, C. C. (1994a). The intermediate line region of QSOs. Astrophys. J. 430, 495–504. doi: 10.1086/174425
Brotherton, M. S., Wills, B. J., Steidel, C. C., and Sargent, W. L. W. (1994b). Statistics of QSO broad emission-line profiles. 2: the C IV wavelength 1549, C III) wavelength 1909, and MG II wavelength 2798 lines. Astrophys. J. 423, 131–142. doi: 10.1086/173794
Burtscher, L., Meisenheimer, K., Tristram, K. R. W., Jaffe, W., Hönig, S. F., Davies, R. I., et al. (2013). A diversity of dusty AGN tori. Data release for the VLTI/MIDI AGN large program and first results for 23 galaxies. Astron. Astrophys. 558, A149. doi: 10.1051/0004-6361/201321890
Cano-Díaz, M., Maiolino, R., Marconi, A., Netzer, H., Shemmer, O., and Cresci, G. (2012). Observational evidence of quasar feedback quenching star formation at high redshift. Astron. Astrophys. 537, L8. doi: 10.1051/0004-6361/201118358
Capetti, A., Axon, D. J., Macchetto, F., Sparks, W. B., and Boksenberg, A. (1996). Radio outflows and the origin of the narrow-line region in seyfert galaxies. Astrophys. J. 469, 554. doi: 10.1086/177804
Chakravorty, S., Misra, R., Elvis, M., Kembhavi, A. K., and Ferland, G. (2012). The influence of soft spectral components on the structure and stability of warm absorbers in active galactic nuclei. Mon. Not. R. Astron. Soc. 422, 637–651. doi: 10.1111/j.1365-2966.2012.20641.x
Chen, K., Halpern, J. P., and Filippenko, A. V. (1989). Kinematic evidence for a relativistic Keplerian disk - ARP 102B. Astrophys. J. 339, 742–751. doi: 10.1086/167332
Collin, S., Kawaguchi, T., Peterson, B. M., and Vestergaard, M. (2006). Systematic effects in measurement of black hole masses by emission-line reverberation of active galactic nuclei: eddington ratio and inclination. Astron. Astrophys. 456, 75–90. doi: 10.1051/0004-6361:20064878
Collin-Souffrin, S., Dyson, J. E., McDowell, J. C., and Perry, J. J. (1988). The environment of active galactic nuclei. I - A two-component broad emission line model. Mon. Not. R. Astron. Soc. 232, 539–550. doi: 10.1093/mnras/232.3.539
Corbin, M. R. (1995). QSO broad emission line asymmetries: evidence of gravitational redshift? Astrophys. J. 447, 496. doi: 10.1086/175894
Done, C., Davis, S. W., Jin, C., Blaes, O., and Ward, M. (2012). Intrinsic disc emission and the soft X-ray excess in active galactic nuclei. Mon. Not. R. Astron. Soc. 420, 1848–1860. doi: 10.1111/j.1365-2966.2011.19779.x
Dultzin-Hacyan, D., Marziani, P., Negrete, C. A., and Sulentic, J. W. (2007). “Quasar evolution: black hole mass and accretion rate determination,” in IAU Symposium, Vol. 238, eds V. Karas and G. Matt (Prague), 83–86.
Dultzin-Hacyan, D., Taniguchi, Y., and Uranga, L. (1999). “Where is the Ca II triplet emitting region in AGN?,” in Structure and Kinematics of Quasar Broad Line Regions, Astronomical Society of the Pacific Conference Series; Proceedings of a Meeting Held in Lincoln, Vol. 175, eds C. M. Gaskell, W. N. Brandt, M. Dietrich, D. Dultzin-Hacyan, and M. Eracleous (Nebraska), 303.
Dumont, A. M., and Collin-Souffrin, S. (1990). Line and continuum emission from the outer regions of accretion discs in active galactic nuclei - part IV - line emission. Astron. Astrophys. 229, 313.
Dumont, A.-M., Collin-Souffrin, S., and Nazarova, L. (1998). NGC 5548, a case study for active galactic nuclei. Inconsistencies of photoionized models for the BLR. Astron. Astrophys. 331, 11–33.
Eracleous, M., and Halpern, J. P. (2003). Completion of a survey and detailed study of double-peaked emission lines in radio-loud active galactic nuclei. Astrophys. J. 599, 886–908. doi: 10.1086/379540
Falcke, H., Wilson, A. S., and Simpson, C. (1998). Hubble space telescope and VLA observations of Seyfert 2 galaxies: the relationship between radio ejecta and the narrow-line region. Astrophys. J. 502, 199–217. doi: 10.1086/305886
Fanti, C., Fanti, R., Dallacasa, D., Schilizzi, R. T., Spencer, R. E., and Stanghellini, C. (1995). Are compact steep-spectrum sources young? Astron. Astrophys. 302, 317.
Ferrarese, L., and Merritt, D. (2000). A fundamental relation between supermassive black holes and their host galaxies. Astrophys. J. 539, L9–L12. doi: 10.1086/312838
Feruglio, C., Fiore, F., Carniani, S., Piconcelli, E., Zappacosta, L., Bongiorno, A., et al. (2015). AGN-driven winds on all scales in markarian 231: from hot nuclear ultra-fast up to kpc-extended molecular outflow. Astron. Astrophys. arXiv:1503.01481v1.
Grupe, D., Beuermann, K., Mannheim, K., and Thomas, H.-C. (1999). New bright soft X-ray selected ROSAT AGN. II. Optical emission line properties. Astron. Astrophys. 350, 805–815.
Gürkan, G., Hardcastle, M. J., and Jarvis, M. J. (2014). The wide-field Infrared survey explorer properties of complete samples of radio-loud active galactic nucleus. Mon. Not. R. Astron. Soc. 438, 1149–1161. doi: 10.1093/mnras/stt2264
Gaskell, C. M. (1982). A redshift difference between high and low ionization emission-line regions in QSOs - Evidence for radial motions. Astrophys. J. 263, 79–86. doi: 10.1086/160481
Gaskell, C. M., and Goosmann, R. W. (2013). Line shifts, broad-line region inflow, and the feeding of AGNs. Astrophys. J. 769:30. doi: 10.1088/0004-637X/769/1/30
Gebhardt, K., Bender, R., Bower, G., Dressler, A., Faber, S. M., Filippenko, A. V., et al. (2000). A relationship between nuclear black hole mass and alaxy velocity dispersion. Astrophys. J. 539, L13–L16. doi: 10.1086/312840
Goad, M. R., and Korista, K. T. (2014). Interpreting broad emission-line variations - I. Factors influencing the emission-line response. Mon. Not. R. Astron. Soc. 444, 43–61. doi: 10.1093/mnras/stu1456
Hu, C., Wang, J.-M., Ho, L. C., Chen, Y.-M., Bian, W.-H., and Xue, S.-J. (2008). Hβ profiles in quasars: evidence for an intermediate-Line region. Astrophys. J. 683, L115–L118. doi: 10.1086/591848
Jaffe, W., Meisenheimer, K., Röttgering, H. J. A., Leinert, C., Richichi, A., Chesneau, O., et al. (2004). The central dusty torus in the active nucleus of NGC 1068. Nature 429, 47–49. doi: 10.1038/nature02531
Jarvis, M. J., and McLure, R. J. (2006). Orientation dependency of broad-line widths in quasars and consequences for black hole mass estimation. Mon. Not. R. Astron. Soc. 369, 182–188. doi: 10.1111/j.1365-2966.2006.10295.x
Joly, M., Véron-Cetty, M., and Véron, P. (2008). “Fe II emission in AGN,” in Revista Mexicana de Astronomia y Astrofisica Conference Series, Vol. 32, Proceedings of a Meeting Held in Huatulco, Mexico (Huatulco), 59–61.
Kaspi, S., Maoz, D., Netzer, H., Peterson, B. M., Vestergaard, M., and Jannuzi, B. T. (2005). The relationship between luminosity and broad-line region size in active galactic nuclei. Astrophys. J. 629, 61–71. doi: 10.1086/431275
Kellermann, K. I., Sramek, R., Schmidt, M., Shaffer, D. B., and Green, R. (1989). VLA observations of objects in the palomar bright quasar survey. Astrophys. J. 98, 1195–1207. doi: 10.1086/115207
Komossa, S., Xu, D., Zhou, H., Storchi-Bergmann, T., and Binette, L. (2008). On the nature of seyfert galaxies with high [O III] λ5007 blueshifts. Astrophys. J. 680, 926–938. doi: 10.1086/587932
Korista, K. T., and Goad, M. R. (2004). What the optical recombination lines can tell us about the broad-Line regions of active galactic nuclei. Astrophys. J. 606, 749–762. doi: 10.1086/383193
Laor, A. (2000). On black hole masses and radio loudness in active galactic nuclei. Astrophys. J. 543, L11–L114. doi: 10.1086/317280
Leighly, K. M., Halpern, J. P., Jenkins, E. B., Grupe, D., Choi, J., and Prescott, K. B. (2007). The intrinsically X-ray weak quasar PHL 1811. I. X-ray observations and spectral energy distribution. Astrophys. J. 663, 103–117. doi: 10.1086/518017
Leighly, K. M., and Moore, J. R. (2004). Hubble space telescope STIS ultraviolet spectral evidence of outflow in extreme narrow-line Seyfert 1 galaxies. I. Data and analysis. Astrophys. J. 611, 107–124. doi: 10.1086/422088
Lipari, S., Terlevich, R., and Macchetto, F. (1993). Extreme optical Fe II emission in luminous IRAS active galactic nuclei. Astrophys. J. 406, 451–456. doi: 10.1086/172456
Loli Martínez-Aldama, M., Dultzin, D., Marziani, P., Sulentic, J. W., Bressan, A., Chen, Y., et al. (2015). O I and Ca II observations in intermediate redshift quasars. Astrophys. J. Suppl. Ser. 217:3. doi: 10.1088/0067-0049/217/1/3
Malkan, M. A., and Sargent, W. L. W. (1982). The ultraviolet excess of Seyfert 1 galaxies and quasars. Astrophys. J. 254, 22–37. doi: 10.1086/159701
Marziani, P., Dultzin-Hacyan, D., and Sulentic, J. W. (2006). “Accretion onto supermassive black holes in quasars: learning from optical/UV observations,” in New Developments in Black Hole Research, ed V. Kreitler (New York, NY: Nova Press), 123–183.
Marziani, P., and Sulentic, J. W. (2012). Estimating black hole masses in quasars using broad optical and UV emission lines. New Astron. Rev. 56, 49–63. doi: 10.1016/j.newar.2011.09.001
Marziani, P., and Sulentic, J. W. (2014). Highly accreting quasars: sample definition and possible cosmological implications. Mon. Not. R. Astron. Soc. 442, 1211–1229. doi: 10.1093/mnras/stu951
Marziani, P., Sulentic, J. W., Dultzin-Hacyan, D., Calvani, M., and Moles, M. (1996). Comparative analysis of the high- and low-ionization lines in the broad-line region of active galactic nuclei. Astrophys. J. Suppl. Ser. 104, 37. doi: 10.1086/192291
Marziani, P., Sulentic, J. W., Negrete, C. A., Dultzin, D., D'Onofrio, M., Del Olmo, A., et al. (2014). Low- and high-z highly accreting quasars in the 4D eigenvector 1 context. Astron. Rev. 9, 6–25.
Marziani, P., Sulentic, J. W., Stirpe, G. M., Zamfir, S., and Calvani, M. (2009). VLT/ISAAC spectra of the Hβ region in intermediate-redshift quasars. III. Hβ broad-line profile analysis and inferences about BLR structure. Astron. Astrophys. 495, 83–112. doi: 10.1051/0004-6361:200810764
Marziani, P., Sulentic, J. W., Zamanov, R., Calvani, M., Dultzin-Hacyan, D., Bachev, R., et al. (2003a). An optical spectroscopic atlas of low-redshift active galactic nuclei. Astrophys. J. Suppl. Ser. 145, 199–211. doi: 10.1086/346025
Marziani, P., Sulentic, J. W., Zwitter, T., Dultzin-Hacyan, D., and Calvani, M. (2001). Searching for the physical drivers of the eigenvector 1 correlation space. Astrophys. J. 558, 553–560. doi: 10.1086/322286
Marziani, P., Zamanov, R. K., Sulentic, J. W., and Calvani, M. (2003c). Searching for the physical drivers of eigenvector 1: influence of black hole mass and Eddington ratio. Mon. Not. R. Astron. Soc. 345, 1133–1144. doi: 10.1046/j.1365-2966.2003.07033.x
Marziani, P., Zamanov, R. K., Sulentic, J. W., Calvani, M., and Dultzin-Hacyan, D. (2003b). High ionization winds in the narrow line region of active galactic nuclei. Mem. Della Soc. Astron. Ital. 74, 492.
Matsuoka, Y., Oyabu, S., Tsuzuki, Y., and Kawara, K. (2007). Observations of O I and Ca II emission lines in quasars: implications for the site of Fe II line emission. Astrophys. J. 663, 781–798. doi: 10.1086/518399
Mineshige, S., Kawaguchi, T., Takeuchi, M., and Hayashida, K. (2000). Slim-disk model for soft X-ray excess and variability of narrow-line Seyfert 1 galaxies. Publ. Astron. Soc. Jpn. 52, 499–508. doi: 10.1093/pasj/52.3.499
Morris, S. L., and Ward, M. J. (1989). Optically thin gas in the broad-line region of seyfert galaxies. Astrophys. J. 340, 713–728. doi: 10.1086/167432
Negrete, A., Dultzin, D., Marziani, P., and Sulentic, J. (2012). BLR physical conditions in extreme population a quasars: a method to estimate central black hole mass at high redshift Astrophys. J. 757, 62. doi: 10.1088/0004-637X/757/1/62
Negrete, C. A., Dultzin, D., Marziani, P., and Sulentic, J. W. (2014a). A photoionization method for estimating BLR “size” in quasars. Adv. Space Res. 54, 1355–1361. doi: 10.1016/j.asr.2013.11.037
Negrete, C. A., Dultzin, D., Marziani, P., and Sulentic, J. W. (2014b). A new method to obtain the broad line region size of high redshift quasars. Astrophys. J. 794:95. doi: 10.1088/0004-637X/794/1/95
Netzer, H. (1990). “AGN emission lines,” in Active Galactic Nuclei, eds R. D. Blandford, H. Netzer, L. Woltjer, T. J.-L. Courvoisier, and M. Mayor (Berlin: Springer), 57–160.
Netzer, H., Shemmer, O., Maiolino, R., Oliva, E., Croom, S., Corbett, E., et al. (2004). Near-infrared spectroscopy of high-redshift active galactic nuclei. II. Disappearing narrow-line regions and the role of accretion Astrophys. J. 614, 558–567. doi: 10.1086/423608
Orban de Xivry, G., Davies, R., Schartmann, M., Komossa, S., Marconi, A., Hicks, E., et al. (2011). The role of secular evolution in the black hole growth of narrow-line Seyfert 1 galaxies. Mon. Not. R. Astron. Soc. 417, 2721–2736. doi: 10.1111/j.1365-2966.2011.19439.x
Peterson, B. M., and Ferland, G. J. (1986). An accretion event in the seyfert galaxy NGC 5548. Nature 324, 345–347. doi: 10.1038/324345a0
Rokaki, E., Lawrence, A., Economou, F., and Mastichiadis, A. (2003). Is there a disc in the superluminal quasars? Mon. Not. R. Astron. Soc. 340, 1298–1308. doi: 10.1046/j.1365-8711.2003.06414.x
Runnoe, J. C., Brotherton, M., Shang, Z., Wills, B., and DiPompeo, M. (2012). “The orientation dependence of quasar single-epoch black hole mass scaling relationships,” in Proceedings of Nuclei of Seyfert Galaxies and QSOs - Central Engine and Conditions of Star Formation (Seyfert 2012) (Bonn: Max-Planck-Insitut für Radioastronomie). doi: 10.1093/mnras/sts322
Runnoe, J. C., Shang, Z., and Brotherton, M. S. (2013). The orientation dependence of quasar spectral energy distributions. Mon. Not. R. Astron. Soc. 435, 3251–3261. doi: 10.1093/mnras/stt1528
Salpeter, E. E. (1964). Accretion of interstellar matter by massive objects. Astrophys. J. 140, 796–800. doi: 10.1086/147973
Sani, E., Lutz, D., Risaliti, G., Netzer, H., Gallo, L. C., Trakhtenbrot, B., et al. (2010). Enhanced star formation in narrow-line Seyfert 1 active galactic nuclei revealed by Spitzer. Mon. Not. R. Astron. Soc. 403, 1246–1260. doi: 10.1111/j.1365-2966.2009.16217.x
Shen, Y., and Ho, L. C. (2014). The diversity of quasars unified by accretion and orientation. Nature 513, 210–213. doi: 10.1038/nature13712
Shen, Y., Richards, G. T., Strauss, M. A., Hall, P. B., Schneider, D. P., Snedden, S., et al. (2011). A catalog of quasar properties from sloan digital sky survey data release 7. Astrophys. J. Suppl. Ser. 194:45. doi: 10.1088/0067-0049/194/2/45
Shields, G. A. (1978). Thermal continuum from acretion disks in quasars. Nature 272, 706–708. doi: 10.1038/272706a0
Shields, J. C., Ferland, G. J., and Peterson, B. M. (1995). Optically thin broad-line clouds in active galactic nuclei. Astrophys. J. 441, 507–520. doi: 10.1086/175378
Sulentic, J., Marziani, P., and Zamfir, S. (2011). The case for two quasar populations. Balt. Astron. 20, 427–434.
Sulentic, J. W. (1989). Toward a classification scheme for broad-line profiles in active galactic nuclei Astrophys. J. 343, 54–65. doi: 10.1086/167684
Sulentic, J. W., Bachev, R., Marziani, P., Negrete, C. A., and Dultzin, D. (2007). C IV λ1549 as an eigenvector 1 parameter for ctive alactic nuclei. Astrophys. J. 666, 757–777. doi: 10.1086/519916
Sulentic, J. W., Martínez-Carballo, M. A., Marziani, P., del Olmo, A., Stirpe, G. M., Zamfir, S., et al. (2015). 3C 57 as an atypical radio-loud quasar: implications for the radio-loud/radio-quiet dichotomy. Mon. Not. Royal Astron. Soc. 450, 1916–1925. doi: 10.1093/mnras/stv710
Sulentic, J. W., and Marziani, P. (1999). The intermediate-line region in active galactic nuclei: a region “Præter Necessitatem”? Astrophys. J. 518, L9–L12. doi: 10.1086/312060
Sulentic, J. W., Marziani, P., and Calvani, M. (2001). An H-R diagram for AGN? X-Ray Astron. 599, 963–966. doi: 10.1063/1.1434785
Sulentic, J. W., Marziani, P., and Dultzin-Hacyan, D. (2000a). Phenomenology of broad emission lines in active galactic nuclei. Ann. Rev. Astron. Astrophys. 38, 521–571. doi: 10.1146/annurev.astro.38.1.521
Sulentic, J. W., Marziani, P., Zamanov, R., Bachev, R., Calvani, M., and Dultzin-Hacyan, D. (2002). Average quasar spectra in the context of eigenvector 1. Astrophys. J. 566, L71–L75. doi: 10.1086/339594
Sulentic, J. W., Marziani, P., Zamfir, S., and Meadows, Z. A. (2012). No evidence for a systematic Fe II emission line redshift in type 1 active galactic nuclei. Astrophys. J. 752:L7. doi: 10.1088/2041-8205/752/1/L7
Sulentic, J. W., Marziani, P., Zwitter, T., Dultzin-Hacyan, D., and Calvani, M. (2000b). The demise of the classical broad-line region in the luminous quasar PG 1416-129. Astrophys. J. 545, L15–L18. doi: 10.1086/317330
Sulentic, J. W., Repetto, P., Stirpe, G. M., Marziani, P., Dultzin-Hacyan, D., and Calvani, M. (2006). VLT/ISAAC spectra of the Hβ region in intermediate-redshift quasars. II. Black hole mass and eddington ratio. Astron. Astrophys. 456, 929–939. doi: 10.1051/0004-6361:20054153
Sulentic, J. W., Stirpe, G. M., Marziani, P., Zamanov, R., Calvani, M., and Braito, V. (2004). VLT/ISAAC spectra of the Hβ region in intermediate redshift quasars. Astron. Astrophys. 423, 121–132. doi: 10.1051/0004-6361:20035912
Sulentic, J. W., Zamfir, S., Marziani, P., Bachev, R., Calvani, M., and Dultzin-Hacyan, D. (2003). Radio-loud active galactic nuclei in the context of the eigenvector 1 parameter space. Astrophys. J. 597, L17–L20. doi: 10.1086/379754
Sulentic, J. W., Zamfir, S., Marziani, P., and Dultzin, D. (2008). “Our search for an H-R diagram of quasars,” in Revista Mexicana de Astronomia y Astrofisica Conference Series, Vol. 32, Proceedings of a Meeting Held in Huatulco, Mexico (Huatulco), 51–58.
Sulentic, J. W., Zwitter, T., Marziani, P., and Dultzin-Hacyan, D. (2000c). Eigenvector 1: an optimal correlation space for active galactic nuclei. Astrophys. J. 536, L5–L9. doi: 10.1086/312717
Sun, J., and Shen, Y. (2015). Dissecting the quasar main sequence: insight from host galaxy properties. Astrophys. J. Lett. 804:L15. doi: 10.1088/2041-8205/804/1/L15
Tchekhovskoy, A., Narayan, R., and McKinney, J. C. (2010). Black hole spin and the radio loud/quiet dichotomy of active galactic nuclei. Astrophys. J. 711, 50–63. doi: 10.1088/0004-637X/711/1/50
Tombesi, F., Melendez, M., Veilleux, S., Reeves, J. N., Gonzalez-Alfonso, E., and Reynolds, C. S. (2015). Wind from the black-hole accretion disk driving a molecular outflow in an active galaxy. Nature 519, 436–438. doi: 10.1038/nature14261
Tristram, K. R. W., Raban, D., Meisenheimer, K., Jaffe, W., Röttgering, H., Burtscher, L., et al. (2009). Parsec-scale dust distributions in seyfert galaxies. Results of the MIDI AGN snapshot survey. Astron. Astrophys. 502, 67–84. doi: 10.1051/0004-6361/200811607
van Breugel, W., Miley, G., and Heckman, T. (1984). Studies of kiloparsec-scale, steep-spectrum radio cores. I VLA maps. Astrophys. J. 89, 5–22. doi: 10.1086/113480
Wang, T., Brinkmann, W., and Bergeron, J. (1996). X-ray properties of active galactic nuclei with optical FeII emission. Astron. Astrophys. 309, 81–96.
Wills, B. J., and Browne, I. W. A. (1986). Relativistic beaming and quasar emission lines. Astrophys. J. 302, 56–63. doi: 10.1086/163973
Woo, J.-H., and Urry, C. M. (2002). The Independence of active galactic nucleus black hole mass and radio loudness. Astrophys. J. 581, L5–L7. doi: 10.1086/342878
Zamanov, R., and Marziani, P. (2002). Searching for the physical drivers of eigenvector 1: from quasars to nanoquasars. Astrophys. J. 571, L77–L80. doi: 10.1086/341367
Zamanov, R., Marziani, P., Sulentic, J. W., Calvani, M., Dultzin-Hacyan, D., and Bachev, R. (2002). Kinematic Linkage between the broad- and narrow-line-emitting gas in active galactic nuclei. Astrophys. J. 576, L9–L13. doi: 10.1086/342783
Zamfir, S., Sulentic, J. W., and Marziani, P. (2008). New insights on the QSO radio-loud/radio-quiet dichotomy: SDSS spectra in the context of the 4D eigenvector1 parameter space. Mon. Not. R. Astron. Soc. 387, 856–870. doi: 10.1111/j.1365-2966.2008.13290.x
Zamfir, S., Sulentic, J. W., Marziani, P., and Dultzin, D. (2010). Detailed characterization of Hβ emission line profile in low-z SDSS quasars. Mon. Not. R. Astron. Soc. 403, 1759. doi: 10.1111/j.1365-2966.2009.16236.x
Zel'Dovich, Y. B., and Novikov, I. D. (1965). Mass of quasi-stellar objects. Sov. Phys. Dokl. 9, 834.
Zhang, K., Dong, X.-B., Wang, T.-G., and Gaskell, C. M. (2011). The blueshifting and baldwin effects for the [O III] λ5007 emission line in type 1 active galactic nuclei. Astrophys. J. 737:71. doi: 10.1088/0004-637X/737/2/71
Zhang, K., Wang, T.-G., Gaskell, C. M., and Dong, X.-B. (2013). The baldwin effect in the narrow emission lines of active galactic nuclei. Astrophys. J. 762:51. doi: 10.1088/0004-637X/762/1/51
Keywords: extragalactic astronomy, galaxies, active galactic nuclei, black holes, high redshift, quasars, emission lines
Citation: Sulentic JW and Marziani P (2015) Quasars in the 4D eigenvector 1 context: a stroll down memory lane. Front. Astron. Space Sci. 2:6. doi: 10.3389/fspas.2015.00006
Received: 12 June 2015; Accepted: 22 September 2015;
Published: 13 October 2015.
Edited by:
Jirong Mao, RIKEN, JapanReviewed by:
Milan S. Dimitrijevic, Astronomical Observatory Belgrade, SerbiaStefano Bianchi, Università Degli Studi Roma Tre, Italy
Copyright © 2015 Sulentic and Marziani. This is an open-access article distributed under the terms of the Creative Commons Attribution License (CC BY). The use, distribution or reproduction in other forums is permitted, provided the original author(s) or licensor are credited and that the original publication in this journal is cited, in accordance with accepted academic practice. No use, distribution or reproduction is permitted which does not comply with these terms.
*Correspondence: Paola Marziani, Istituto Nazionale di Astrofisica, Osservatorio Astronomico di Padova, Vicolo dell Osservatorio 5, Padova 35122, Italy, paola.marziani@oapd.inaf.it