Baldwin Effect and Additional BLR Component in AGN with Superluminal Jets
 Víctor M. Patiño-Álvarez1
  Janet Torrealba1
  Vahram Chavushyan1*
  Irene Cruz-González2
  Tigran Arshakian3,4,5 Jonathan León-Tavares1 Luka Popović6
- 1Instituto Nacional de Astrofísica, Óptica y Electrónica, Puebla, Mexico
- 2Instituto de Astronomía, Universidad Nacional Autónoma de México, Mexico City, Mexico
- 3Physikalisches Institut, Universität zu Köln, Köln, Germany
- 4Byurakan Astrophysical Observatory, Byurakan, Armenia
- 5Isaac Newton Institute of Chile in Estern Europe and Eurasia, Armenian Branch, Santiago, Chile
- 6Astronomical Observatory, Belgrade, Serbia
We study the Baldwin Effect (BE) in 96 core-jet blazars with optical and ultraviolet spectroscopic data from a radio-loud AGN sample obtained from the MOJAVE 2 cm survey. A statistical analysis is presented of the equivalent widths (Wλ) of emission lines Hβ λ4861, Mg II λ2798, C IV λ1549, and continuum luminosities at 5100 Å, 3000 Å, and 1350 Å. The BE is found statistically significant (with confidence level c.l.≥ 95%) in Hβ and C IV emission lines, while for Mg II the trend is slightly less significant (c.l. = 94.5%). The slopes of the BE in the studied samples for Hβ and Mg II are found steeper and with statistically significant difference than those of a comparison radio-quiet sample. We present simulations of the expected BE slopes produced by the contribution to the total continuum of the non-thermal boosted emission from the relativistic jet, and by variability of the continuum components. We find that the slopes of the BE between radio-quiet and radio-loud AGN should not be different, under the assumption that the broad line is only being emitted by the canonical broad line region around the black hole. We discuss that the BE slope steepening in radio AGN is due to a jet associated broad-line region.
1. Introduction
Baldwin (1977) discovered that quasars follow a relation between the rest frame equivalent widths for the ultraviolet lines (e.g., C IV, Lyα, etc.) and the continuum luminosity at 1350 Å (L1350), known as the Baldwin Effect (Carswell and Smith, 1978), hereafter BE. This relation became quite important and has been the subject of many investigations because it allows to study the physics of the diverse emitting regions present in active galactic nuclei (AGN). The BE is well established for broad emission lines in the ultraviolet and optical regions (e.g., Shields, 2007), and it is also found that steepens with increasing ionization potential (Zheng and Malkan, 1993; Dietrich et al., 2002). Most recently, the BE has also been found in narrow emission lines (e.g., Croom et al., 2002; Dietrich et al., 2002; Netzer et al., 2004, 2006; Netzer and Trakhtenbrot, 2007; Kovačević et al., 2010; Popović and Kovačević, 2011; Zhang et al., 2013). It has been suggested that the BE could be used to probe the model predictions of the spectral energy distributions (SED) as a function of luminosity (Dietrich et al., 2002), or to test cosmological models at high redshifts (Shields, 2007).
Despite the advances made in this subject during the last three decades, the physical mechanisms driving the observed BE remain unclear (see Shields, 2007, and references therein for a complete review on the BE). The most widely accepted driving mechanism is that the ionization continuum softens as the luminosity increases (e.g., Zheng and Malkan, 1993), so that high-luminosity AGN decrease the fraction of ionizing photons for broad emission line formation. This is consistent with Scott et al. (2004) that the low-luminosity AGN show harder spectral continuum in the extreme-UV. Some theoretical studies support that the BE is driven, at least in part, on both the continuum shape and the metallicity of the gas (e.g., Korista et al., 1998).
Other fundamental parameters have been proposed as the principal drivers of the BE: the Eddington ratio (Baskin and Laor, 2004; Bachev et al., 2004; Dong et al., 2009), or the black hole mass (e.g., Warner et al., 2003; Xu et al., 2008). Nevertheless, a consensus on these issues has not yet emerged.
Moreover, it is now well established that emission lines originated from higher ionization species display steeper slopes in the Wλ − Lc diagram. This means that the intensity of the correlation, traced by the slope, seems to be dependent on the emission line ionizing energy, as was shown by several authors (e.g., Zheng and Malkan, 1993; Zheng et al., 1995; Espey and Andreadis, 1999; Dietrich et al., 2002).
The aim of this paper is to investigate the BE in radio-loud AGN possessing relativistic jets. This is of great interest because, through the past decades, several studies have shown that AGN spectral properties differentiate depending on radio-loudness1. For example, Brotherton et al. (2001, and references therein) found that the composite spectrum of radio loud (RL; logR > 1) AGN, compared to that of radio-quiet (RQ) AGN, shows a redder SED, broader Balmer lines, stronger [O III] emission, and stronger red wing/weaker blue wing asymmetry of the C IV λ1549 emission line. Other authors found that RL and RQ AGN have remarkably similar low-ionization emission lines (Mg II and C III]), while high-ionization lines are clearly stronger in RL composite spectrum (e.g., C IV, Francis et al., 1993; Zheng et al., 1997). Motivated by these spectral differences in RL and RQ AGN, in this work the authors investigate the difference of the BE between the population of RL AGN having the beamed continuum emission due to relativistic jet and the sample of RQ AGN.
The paper is presented as follows. The characteristics of the RL AGN sample and spectroscopic observational data are presented in Section 2. The comparison sample of RQ AGN is described in Section 3. The BE and simulations of the contribution of non-thermal emission to the BE is presented in Section 4. The statistical results and comparison with the RQ samples are presented in Section 5, including line-luminosity relations, and BE slope differences. The jet contribution to the total non-thermal continuum emission and the non-thermal dominance dependence on viewing angle and equivalent width for Flat Spectrum Radio Quasars (FSRQ) is discussed in Section 6. Finally, discussion and conclusions are presented in Section 7.
Throughout the paper a flat cosmology model is used with parameters Ωm = 0.3 (ΩΛ + Ωm = 1) and H0 = 70 km s−1 Mpc−1.
2. Sample and Spectroscopic Data of Radio-Loud AGN
2.1. Sample
The sample of 96 RL AGN studied here is a part of 250 compact extragalactic sources with radio jets (15 GHz) compiled and described by Kovalev et al. (2005), that comprises blazars (BL Lacs and flat-spectrum radio quasars), radio galaxies, and few sources unclassified in the optical regime. AGN of this sample have a core–jet structure on miliarcsecond scales, where the radio jet is aligned close to the line-of-sight. These sources are observed with VLBA at 2 cm (Kellermann et al., 1998, 2004; Zensus et al., 2002), and roughly half of the sample is part of the MOJAVE 2 (“Monitoring of Jets in AGN with VLBA Experiments”; see Lister et al., 2009) program. Most of the sources in the sample have flat radio spectra (α > − 0.5, F ~ ν+α, for ν > 500 MHz; Kovalev et al., 1999, 2000), their total flux density at 15 GHz (obtained in the period 1994–2003) is > 1.5 Jy for Northern hemisphere sources (δ > 0°) and > 2 Jy for sources with −20° < δ < 0°.
Given that 97% of the sample is comprised by AGN with flat radio spectrum, and broad lines typical of quasars, hereafter the RL AGN sample will be referred to as Flat Spectrum Radio Quasars (FSRQ).
The range in radio-loudness of the FSRQ is 1.2≤ log R ≤4.5 with an average value of log R = 3.5.
The core–jet structure of the 96 FSRQ makes it a unique sample to study via spectroscopic observations the influence of the jet beaming effects on the broad and narrow emission line regions (BLR and NLR), and in particular to study the BE in RL AGN.
2.2. Spectroscopic data
Optical and ultraviolet spectroscopic data of blazars are presented in full detail in the accompanying spectral atlas3 (Torrealba et al., 2012). Spectra are available for 123 sources from the MOJAVE/2cm sample (see Torrealba et al., 2014), but for the BE analysis presented here, the sample was restricted to AGN with S∕N > 10 spectra which involves a sample of 96 FSRQ, which are about half of the AGN in the MOJAVE sample.
As is mentioned in the spectroscopic atlas, the observations were acquired at two 2.1 m Mexican telescopes in OAGH4 and OAN-SPM5. In few cases, the spectra were complemented with available databases (HST, SDSS, etc.). Our database is homogeneous in the sense that the same spectral analysis procedures are used for fitting the emission lines, de-blending of the Fe II emission and emission-line local continuum fitting. To strengthen the analysis results, the flux, line equivalent width, and continuum luminosity measurements have not been mixed with data obtained from literature.
Three subsamples of FSRQ were defined:
• The Hβ subsample comprises 18 quasars and 3 radio galaxies. The narrow-line sources with FWHM Hβ ≲ 1000kms−1 were excluded. The redshift range is 0.033–0.751 with optical magnitude between 13.6 < BJ < 18.5.
• The Mg II λ2798 subsample is the largest data set which comprises 69 quasars. In this case, the redshift range is 0.295–2.118 with magnitude between 14.5 < BJ < 20.6.
• The C IV λ1549 subsample comprises 31 quasars. The redshift range is 0.295–3.396 with magnitude between 15.1 < BJ < 20.9.
It is important to mention that due to the redshift, more than one emission line was available for some sources.
2.3. Continuum and Emission Line Parameters
The same spectral analysis procedure was used to measure spectral line parameters (flux and equivalent width) and continuum emission for all AGN in our sample. Procedures to obtain the continuum emission and the subtraction of the Fe II contribution are described in detail in Section 6 of Torrealba et al. (2012). The emission line parameters are measured after subtracting the contribution of Fe II emission and a power-law of the local continuum. The spectral range of the data only allows to fit the local continuum with a power-law, by selecting regions free of emission or absorption lines. The total emission line flux was measured by Gaussian decomposition of the spectra. The decomposition was performed using the task MPFITEXPR from the MPFIT IDL package (Markwardt, 2009).
The uncertainty of the emission-line flux is estimated from the formula given in Tresse et al. (1999) and on the average is about 15%. The continuum flux is measured from the iron free spectrum for each AGN in the range of ±50 Å. Then the monochromatic continuum luminosities were calculated Lc ≡ λLλ at 5100 Å, 3000 Å, or 1350 Å for the three AGN subsamples.
The luminosity results of FSRQ samples are:
• Ranges of continuum luminosities: 44.1 ≤ log L5100 ≤ 46.8 and 45.6 ≤ log L3000 ≤ 48, and 46.3 ≤ log L1350 ≤ 48.8.
• Mean continuum luminosities: log L5100 = 45.7 ± 0.8, log L3000 = 46.7 ± 0.5, and log L1350 = 47.6 ± 0.9.
• Average uncertainty for Lc: 11, 10, and 17% for L5100, L3000, and L1350, respectively.
• Mean total line luminosities: log LHβ = 43.8 ± 0.8, log LMgII = 44.8 ± 0.5, and log LCIV = 45.8 ± 0.7.
The equivalent width for each emission line was calculated using the ratio of the total line luminosity (Lline) and monochromatic continuum multiplying by the wavelength associated with the corresponding continuum, Wλ = (Lline∕Lc) × λ. The Wλ uncertainties are about 30–35 % depending on the mean signal-to-noise ratio of the spectrum.
Uncertainties of the equivalent widths Wλ for the emission lines near 5100 Å with mean spectral S∕N ~ 15 lie in the range 10–15%. Near the 3000 Å region, the uncertainties are roughly 12% with S/N ~ 20, and for Wλ(C IV) the average uncertainty is ~14% with S/N ~ 15.
The mean Wλ and its standard deviation of Hβ, Mg II, and C IV emission lines are (76.6 ± 23.8) Å, (42.4 ± 21.8) Å, and (27.0 ± 14.4) Å, respectively.
3. Samples of Radio-Quiet AGN
To compare the BE in our FSRQ sample, two samples of RQ AGN were selected. For Hβ the sample used comes from Greene and Ho (2005) while for Mg II and C IV the sample comes from Shen et al. (2011). This control sample was compared to the BE in FSRQ. Both samples of RQ AGN were selected from the Sloan Digital Sky Survey (SDSS, York et al., 2000).
The RQ control sample for Hβ emission consists of 229 RQ AGN from the Third Data Release (DR3, Abazajian et al., 2005) with z ≤ 0.35. The second sample is taken from The Seventh Data Release (DR7, Abazajian et al., 2009) with 44,000 quasars having the Mg II emission line (0.35≤ z ≤2.25), and 10,000 quasars with C IV emission line (1.5≤ z ≤4.95). Both samples are assumed to be dominated by a population of RQ AGN (e.g., Shaw et al., 2012).
Greene and Ho (2005) and Shen et al. (2011) use the following procedure to measure the spectral line and continuum characteristics. They decompose the spectrum for each source by simultaneous fitting of two-component model consisting of featureless continuum and the empirical Fe II template from Boroson and Green (1992, Hβ region) and Vestergaard and Wilkes 2001, Mg II region). Shen et al. (2011) fitted the local continuum with a single power-law in the wavelength intervals between 2200 and 2700 Å and 2900–3090 Å near the Mg II line and 1445–1465 Å and 1700–1705 Å near the C IV emission line. The featureless continuum in the region of Hβ line was approximated by a double power-law broken at 5000 Å under the requirement that the combined flux of the two components at ~5600 Å (near Hβ) be equal to the observed flux at that point (Greene and Ho, 2005). Shen et al. (2011) measured the C IV line flux without iron subtraction which may lead to an overestimation of Wλ by ~0.05 dex on average. In the RQ samples, the emission line profile is modeled as a multicomponent Gaussian taking into account both the broad and narrow components.
4. Baldwin Effect
4.1. Wλ vs. Lc
The relation between the emission line equivalent width (Wλ) and the continuum emission luminosity (Lc) is given by Baldwin (1977),
The slope β is found to be negative for RQ AGN (Baldwin, 1977; Shields, 2007), i.e., the equivalent width of the emission line (or the contrast between the line and continuum luminosities) decreases toward large continuum luminosities.
Equation (1) can be transformed to a relation between the total line luminosity Lline and the monochromatic continuum luminosity λLλ ≡ Lc measured at a certain wavelength λ,
by replacing α and β with,
and considering that Wλ ≃ Lline∕Lλ.
4.2. Contribution of Non-thermal Emission to the Baldwin Effect
The optical continuum emission in RQ AGN is assumed to be isotropic and generated in the accretion disk, so that the continuum luminosity is . On the other hand, for FSRQ the optical continuum emission has two components, the thermal emission from the disk () and the beamed non-thermal emission from the relativistic jet (Ljet), i.e., . It was assumed that the main contribution to the broad line emission is attributed to the disk thermal emission, while the beamed emission from the jet is produced beyond the BLR and, hence, has no contribution to the Broad Line (BL) emission.
A simulation was performed in order to estimate the statistical properties of the RQ samples studied by Greene and Ho (2005) and Shen et al. (2011). The purpose is to compare them to the RL sample presented in this paper. First. a distribution of continuum luminosity was taken (see Figure 1), based on the luminosity distributions observed for our sample of FSRQ. For all three lines a gaussian distribution represents well the data. Then, using the line luminosity - continuum luminosity relations described in the afore mentioned papers, and the scatter obtained for these relationships, representative line luminosities of the sample of RQ AGN were generated. Using these line luminosities and the assumed distribution of continuum luminosities, the equivalent widths for the simulated RQ sample were calculated. The number of simulated values in each case is equal to the number of data points in the original RQ samples. Figure 2 shows the simulation results for the Hβ, Mg II, and CIV lines.
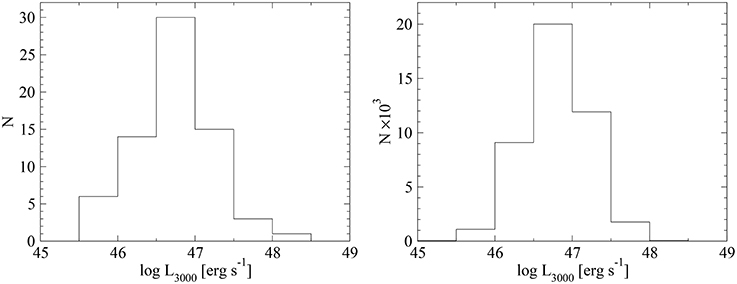
Figure 1. Distributions of continuum luminosity at 3000 Å obtained for the observed FSRQ sample (left panel); and for the simulated RQ sample (right panel).
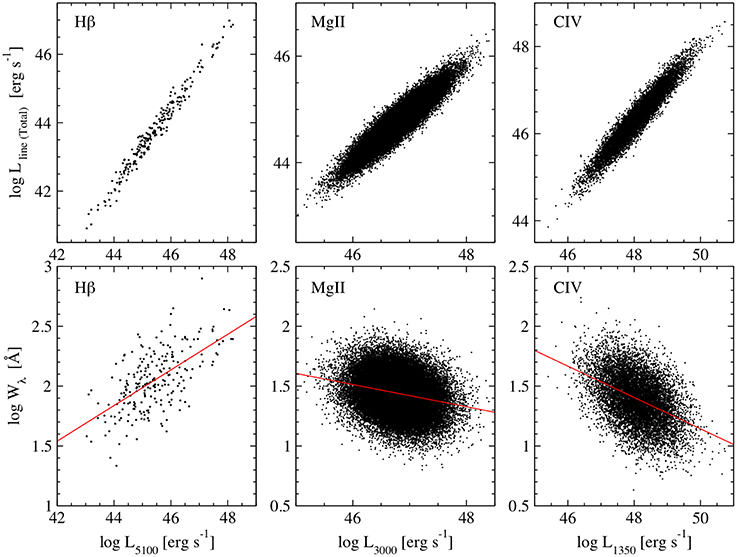
Figure 2. Relations obtained for the Hβ (left panel), Mg II (middle panel), and CIV (right panel) emission lines. Top row: Lline-Lc plot with simulated data. Bottom row: EW-Lc plot with simulated data.
After generating the data, it was separated in order to match the continuum luminosity range on our sample of FSRQ. Using the simulated data that fall in our observed range, the mean and standard deviation of the equivalent width for the three lines Hβ, C IV and Mg II, were calculated. It is worth mentioning that for C IV and Mg II, all the simulated data fall inside the desired continuum luminosity ranges.
Then, a linear least-squares algorithm in one dimension was applied, using the IDL task FITEXY6, to perform a linear fitting to the Lc - Wλ relation to obtain the Baldwin Effect of the RQ sample.
From these simulations, the next conclusions were drawn:
• The slope and uncertainty on the simulated Lc - Wλ relation remains unchanged, regardless of the input continuum luminosity distribution used.
• The changes on the intercept and uncertainty on the simulated Lc - Wλ relation, with changes on the input continuum luminosity distribution are negligible.
• The mean and standard deviation of the simulated equivalent widths can change drastically, depending on the continuum luminosity distribution used as input.
5. Statistical Analysis
To understand the effect of a non-thermal emission in the BE for blazars, it is necessary to analyze the difference in the Lline − Lc and Wλ − Lc relations between the samples of FSRQ and RQ AGN.
5.1. Comparison of Line-Luminosity Relations
The relation between the line luminosity and the continuum luminosity of RQ AGN are derived for Hβ by Greene and Ho (2005), and for Mg II and C IV by Shen et al. (2011), using the weighted linear fitting of binned data for the total flux of the emission lines Hβ, Mg II, and C IV, and their respective continuum luminosities at 5100 Å 3000 Å, and 1350 Å (dashed lines in Figure 3). The slope and intercept of their fittings are presented in the top part of Table 1.
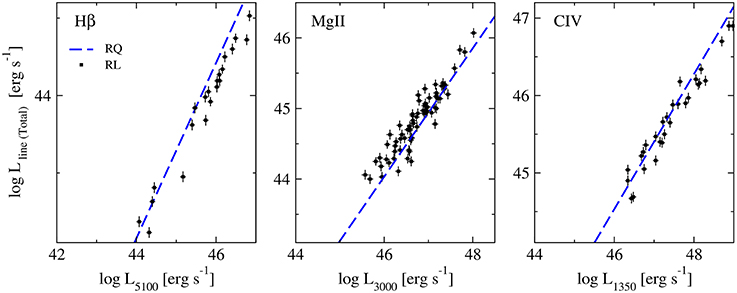
Figure 3. Emission line luminosity against continuum luminosity of FSRQ (squares): LHβ vs. L5100 (left panel), LMg II vs. L3000 (middle panel), and LC IV vs. L1350 (right panel). The dashed line reproduces the relations LHβ − L5100 (left panel) from Greene and Ho (2005), LMgII − L3000 and LCIV − L1350 (middle and right panels) from Shen et al. (2011).
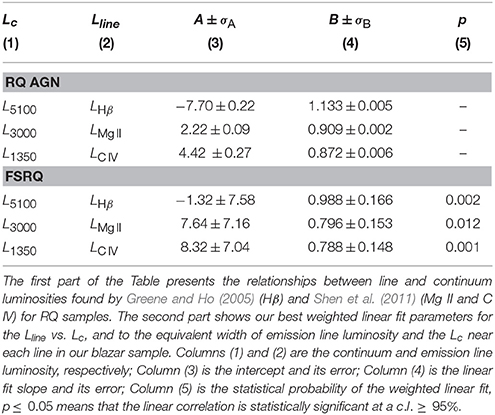
Table 1. Parameters of weighted linear fitting for line and continuum luminosities (logLline = A + BlogLc).
The emission line and the corresponding continuum luminosity data of FSRQ are shown for Hβ, Mg II, and C IV emission lines in Figure 3. The same fitting procedure as in Greene and Ho (2005) and Shen et al. (2011) were followed, and the relation defined in Section 2.2 between the line luminosity and the continuum luminosity for each subsample of FSRQ (straight lines in top panels of Figure 4) was derived. Fitting parameters of our subsamples and significance of correlations between line and continuum luminosities are presented in the lower part of Table 1.
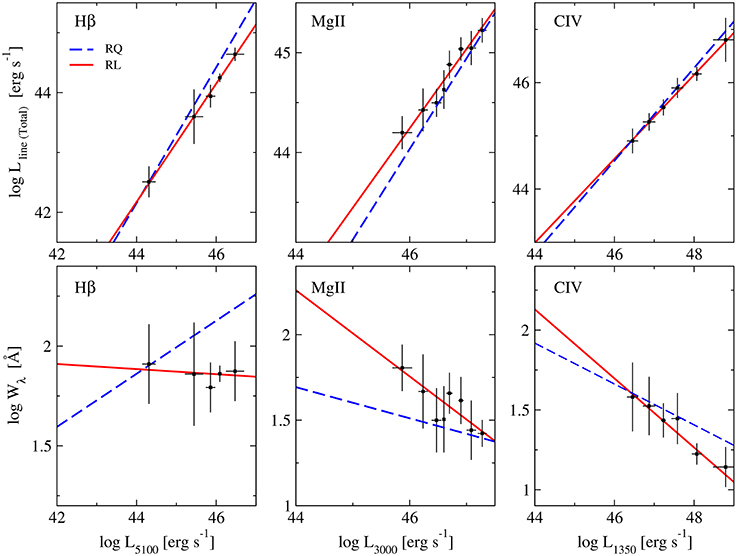
Figure 4. The top panels show the continuum luminosity associated to each line (Lc) and the total line luminosity Lline for our binned data. The bottom panels show Lc and the equivalent widths (Wλ) estimated from the data in the former panels. The red solid lines represent the best weighted linear fits to our data. The blue dashed lines are derived from the simulations described in Section 4.2 using the relations LHβ−L5100 from Greene and Ho (2005), LMgII−L3000 and LCIV−L1350 from Shen et al. (2011) to derive the corresponding line luminosities and equivalent widths.
Significant correlations for all line luminosities at the confidence level of ≥ 98.8% were found. It is noticeable that the slopes B of line-continuum luminosity relations measured for FSRQ have a tendency to be shallower for the three ions Hβ, Mg II, and C IV, than those found for RQ AGN, see Figure 4 (top panels) and Table 2. In order to quantify the significance of the difference in the slopes of the Lc-Lline relations for RQ and FSRQ; an unpaired t-test7 was applied. For the Hβ line, the two-tailed P-value is 0.0057, corresponding to a statistically significant difference. For the Mg II line, the two-tailed P-value is 0.0263, corresponding also to a statistically significant difference. However, for the C IV line, the two-tailed P-value is 0.4370, corresponding to a non-statistically significant difference. The authors suggest that the differences found for Mg II and Hβ are indicating the contribution of an extra emission line component, possibly related to the jet.
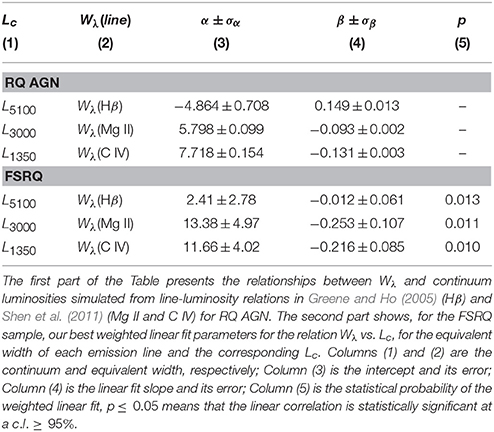
Table 2. Parameters of weighted linear fitting for the Baldwin Effect (logWλ = α + βlogLc).
5.2. Baldwin Effect Comparison
The Baldwin Effect of FSRQ is derived by a weighted linear fitting to the binned data, taking into account uncertainties in both axes using the IDL task FITEXY. Bins of the data were set along the Lc and measure the mean and standard deviation of Wλ in each bin. It should be noted that an adaptive data bin was used, in order to get the same number of measurements in each bin. The weighted fit lines for each Hβ, Mg II, and C IV lines are presented in Figure 4 (full lines in the lower panels) and their fitted parameters are listed at the bottom part of Table 2.
For each emission line, simulated values of Wλ and Lc for RQ AGN (see Figure 2) are used to generate the data set, which is then fitted by the weighted linear method described above (dashed lines in bottom panels of Figure 4). The slope, intercept, and uncertainties for each line, are presented in the top part of Table 2.
There is a difference in the slopes for the BE for the simulated RQ sample and the observed FSRQ sample; as can be seen in the bottom panels of Figure 4. The significance of these differences is tested by means of an unpaired t-test. For Hβ the test results in a statistically significant difference, with a P-value of 0.0007. For Mg II, the test also results in a statistically significant difference, with a P-value of 0.0016. However, for C IV, the test results in a non-statistically significant difference, with a P-value of 0.1161.
In order to explain the differences between the slopes in both the relations Lcont − Lline and Lcont − Wλ of the RQ (Greene and Ho, 2005; Shen et al., 2011) and the FSRQ (our sample), a simulation was designed showing the behavior of the Baldwin Effect under the accepted paradigm of RQ and RL AGN. The simulation results for three different scenarios are listed:
• First a RQ system was simulated, using as base the RQ relations for the three lines published by the above authors (solid line in Figure 5).
• Then a continuum component (simulating the jet) was added of the same luminosity as the disk component. The emission line is calculated using only the continuum component from the accretion disk (dashed line in Figure 5).
• Then both continuum components were decreased, each by a different a factor. This with the aim of probing if the differences in variation amplitudes of the disk and the jet, are responsible for the differences observed in the slopes. Many different variability factors were simulated, however, all of them just result in a Y-axis shift of the model. Again, the emission line is calculated using only the continuum component from the accretion disk (dot-dashed line in Figure 5).
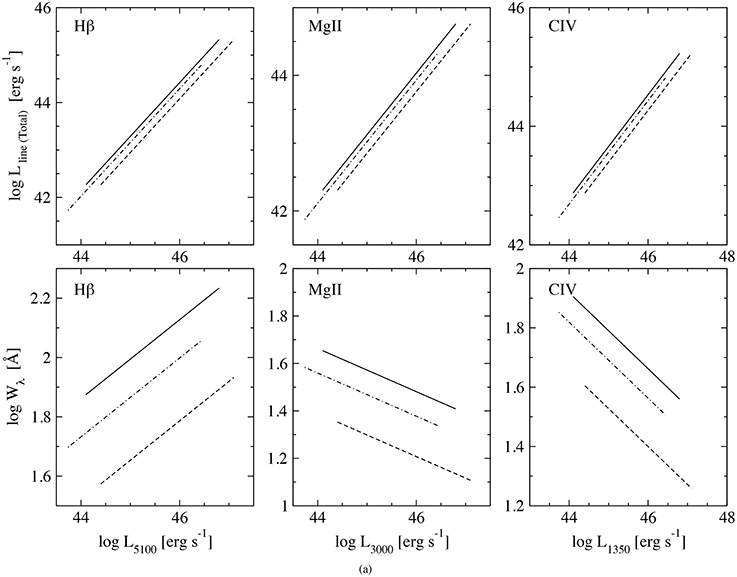
Figure 5. Simulations of Lline-Lc relation (top panels) and Wλ-Lc relation (bottom panels) for the Hβ (left columns), Mg II (middle columns), and C IV (right columns) emission lines for three different scenarios: RQ (solid line), with radio jet component (dashed line), jet and disk components decreased, each by a different factor (dot-dashed line).
The simulation results for the Hβ, Mg II, and C IV lines are shown in Figure 5.
As evidenced by the simulations presented above, the presence of an additional continuum component produced by the jet, does not explain the BE slope difference found between FSRQ and RQ AGN; the change produced is only a parallel Y-axis shift and not a change in slope.
6. Non-Thermal Contribution to the Continuum Emission
6.1. Non-thermal Dominance for FSRQ
To quantify the contribution of the jet emission to the total optical/UV emission, the non-thermal dominance (NTD) introduced in Shaw et al. (2012), was estimated. They defined the NTD as
where Lobs is the observed continuum luminosity and Lp is the predicted continuum luminosity estimated from the emission-line luminosity for a non-blazar sample. It is assumed that the broad-line emission reflects the thermal power of the accretion disk.
In this work, the authors define an alternative NTD for FSRQ:
where Lobs is the observed continuum luminosity, Lp is the predicted disk continuum luminosity estimated from the emission line, Ldisk is the continuum luminosity emitted by the accretion disk, and Ljet is the jet contribution to the continuum luminosity. If the emission line is only affected by the disk Lp = Ldisk, so that
which shows that NTD ≥ 1. Note that NTD = 1 means that the continuum is due only to thermal emission, NTD > 1 shows that a superluminal jet exists that contributes to the continuum luminosity, and NTD > 2 means that Ljet > Ldisk.
The emission line luminosity vs. the observed continuum luminosity for the three subsamples is presented in the top panels of Figure 4. It was found that the majority of blazars from the Hβ (81%) and C IV (84%) subsamples are located below the fiducial relations found by Greene and Ho (2005) and Shen et al. (2011) presented as dashed lines. Thus, these FSRQ must have a significant non-thermal contribution in the optical and UV bands, i.e., NTD > 1 for most sources. The excess emission is likely to be a boosted optical/UV emission from the relativistic jets, and it was expected that all quasars in our subsamples should have NTD > 1.
Figure 6 shows the distribution of NTD values obtained for the three emission lines of our study; it is noticeable that the peak is around NTD = 0.5 − 1.0. Further results concerning the NTD are discussed in the next section. Instead of the expectation, the NTD obtained for our sample of FSRQ shown in the vertical axis of Figure 7 spans values in the regions NTD > 2, where Ljet > Ldisk in Equation (7). Few sources have NTD > 2. On the other hand the region NTD > 1 is populated by a large number of sources, where the superluminal jet contributes to the continuum luminosity, and a number of sources have NTD < 1.
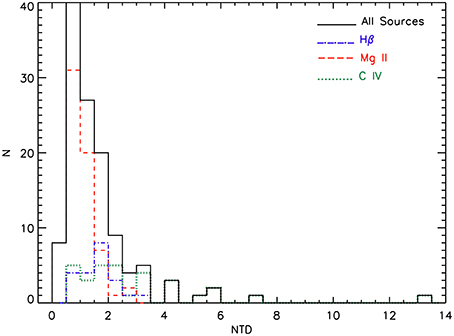
Figure 6. Histogram of the values obtained for the non-thermal dominance (NTD). The different emission lines are indicated in different colors and line styles. Hβ in blue (dot-dashed), Mg II in red (dashed), C IV in green (dotted). The black solid line represents the sum of the three emission lines.
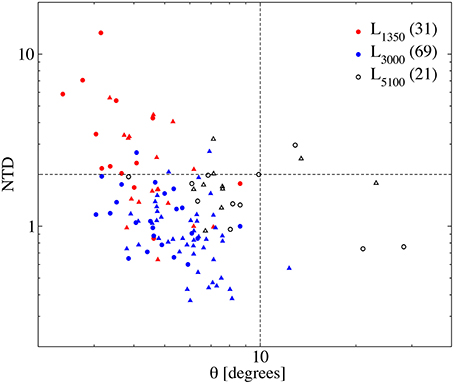
Figure 7. Non-thermal dominance (ratio between the observed and the predicted continuum emission) vs. viewing angle of the jet. The colors refer to blazars observed at 1350 Å (red; C IV), 3000 Å (blue; Mg II), and 5100 Å (empty; Hβ). The circles refers to blazars with θ calculated using measurements of βapp and δvar, while the triangles are blazars with θ calculated through Equation (11). Vertical and horizontal dashed lines mark the jet viewing angle of θ = 10° and NTD = 2, respectively.
It was found that 56% of the Mg II subsample (filled dots in Figure 7) have NTD < 1, while only 19% of Hβ (empty squares in Figure 7) and 16% of C IV sources (filled triangles in Figure 7) have NTD < 1. Values of NTD < 1, were found as well by Shaw et al. (2012). This result probably means that, not only an additional component of the BLR (BLR2) exists together with the canonical BLR, which can be related to or activated by the jet [c.f. Lp(BLR2) in Equation 9]; but also that it scales differently with the continuum luminosity than the canonical BLR component (Lp(BLR2) > Ljet). The reason why this affects more the Mg II subsample is unclear, but could be due to a larger sample than the other two ion subsamples, or a possible ion stratification in the BLR where Mg II zones are closer to the ionization source in the inner part of the jet. Observational evidence for the presence of BLR material located at parsec scales down to the radio core has been found by coordinated spectroscopic and VLBI monitoring studies. More specifically, Arshakian et al. (2010a) and León-Tavares et al. (2010) found evidence for BLR material around the radio core for the radiogalaxies 3C 390.3 and 3C 120, respectively.
In order to explore this possibility, it was assumed that there exists an emission line component related to the jet then Lp > Ldisk therefore:
If the predicted continuum luminosity obtained from the emission line component related to the disk is called Lp(BLR1), and the predicted continuum luminosity obtained from the emission line component related to the jet is called Lp(BLR2), then:
where Lp(BLR1) = Ldisk. If Lp(BLR2) > Ljet then it is possible to obtain values of NTD < 1.
The finding of values NTD < 1, most specially in Mg II (56% of FSRQ), seems to support the idea of a BLR component related to the jet. This analysis also suggests that the emission line component related to the jet scales differently with the continuum, than the canonical broad line region scaling.
Arshakian et al. (2010b) and Torrealba et al. (2011) showed that, for the MOJAVE blazars, optical (5100 Å) and radio VLBA total emission at 15 GHz (LVLBA) are correlated on milliarcsecond scales. They suggest a synchrotron origin of radio and optical emission for quasars and BL Lacs which is boosted by the relativistic jet.
Application of partial Kendall's τp statistical analysis8 to the Mg II subsample shows that L3000 and LVLBA are correlated at a c.l. = 99.9% (τp = 0.27). While, for the C IV subsample, the correlation between L1350 and LVLBA is not significant (τp = 0.21and c.l. = 91.4%), but the correlation recovers for the relation between L1350 and jet luminosity with τp = 0.20 and c.l. = 97.3%. Note that Ljet is equal to the difference between total VLBA and radio core luminosities (see Arshakian et al., 2010b). These correlations indicate also that the bulk of the UV emission is non-thermal and, most likely, produced in the jet, which also supports the contribution of a jet-BLR component to the continuum luminosity.
Other evidence for a non-thermal origin of the variable optical emission comes from the link between the jet kinematics on sub-parsec scales and optical continuum flares on scales from few months to few years (Pérez et al., 1989; Arshakian et al., 2010a; León-Tavares et al., 2010, 2013). These findings suggested that the source of the non-thermal variable optical emission is located in the innermost part of the sub-parsec scale jet, which is a region that may be close to the BLR clouds and thus possibly affecting and activating it.
6.2. Dependence of Non-thermal Contribution on Jet Viewing Angle
The viewing angle of the jet (θvar) was estimated using the variability Doppler factor (δvar) and apparent speed of the jet βa (in units of the speed of the light; e.g., Lähteenmäki and Valtaoja, 1999):
Recent values of βa are taken from the MOJAVE website9 and δvar from Hovatta et al. (2009). The latter parameter is available for 35 sources from the sample of 96 AGN. For the remaining objects, the empirical relation between the jet viewing angle (θj) and the total radio luminosity at 15 GHz was used (LVLBA) obtained for 62 blazars from the statistically complete MOJAVE-1 sample, c.f. Equation (11) in Arshakian et al. (2010b):
Note that the range of LVLBA of our sample (42.1 ≤ log LVLBA ≤ 46.0) is similar to the one in Arshakian et al. (2010b).
Viewing angles θvar of 71 blazars from the MOJAVE/2cm were estimated by Hovatta et al. (2009) using the variability Doppler factors and apparent speeds of the jets. Note that errors of viewing angles cannot be estimated because of difficulties and significant uncertainties in Doppler factor values (δvar) associated with each source (Arshakian et al., 2010b).
Seventy one values of θj from Equation (11) were computed and compared with independent measurements of θvar in Equation (10). The Spearman rank correlation between the two samples is ρ = 0.56 with c.l. > 99.99% (P = 3×10⁻⁷), indicating that the measurements of θj are statistically reliable for viewing angles larger than ~1 degree.
The viewing angles θj of 96 FSRQ were used to analyze the NTD−θ relation plane presented in Figure 7. There is a negative trend between NTD and viewing angle of the jet for the majority of blazars with viewing angles less than 10°. For these sources, the Kendall's partial correlation is τp = −0.05 with probability P = 7.6 × 10⁻⁵ (c.l. of 99.99%) indicating for a significant negative correlation between jet viewing angle and NTD. This correlation is mainly due to quasars of the Mg II subsample. No significant correlation is found for the Hβ and C IV subsamples, most likely, because of their smaller sampling.
In this work, the authors conclude that the Mg II subsample shows that the non-thermal dominance NTD of the optical and UV continuum emission decreases with viewing angles of the jet, in agreement with the prediction of the relativistic beaming theory.
6.3. Dependence of Equivalent Width on Jet Viewing Angle
Boosting of the continuum emission at smaller viewing angles should lead to a decrease of emission line equivalent widths as a result of the increase of the line-continuum contrast. Wλ and the jet viewing angle θ was compared in Figure 8 for all three subsamples. A significant positive correlation was found between Wλ and θ for Mg II with r = 0.25 and c.l. = 96.6%, while the other lines do not show statistically significant results. It is worth noting that this correlation appears to be dominated by the points with NTD < 1.
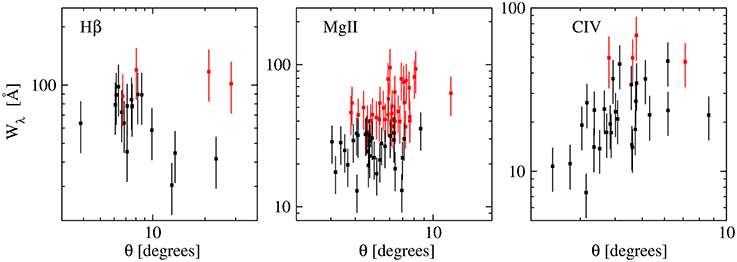
Figure 8. Equivalent width vs. viewing angle of the jet. Red dots indicate sources with NTD < 1. The Mg II emission line shows a significant correlation at confidence level ≥ 96%. For the other lines there is no statistically significant correlation.
In this work, the authors conclude that the equivalent width of Mg II is correlated with the jet viewing angle in the sense that increasing viewing angles produce larger values of Wλ, which is reasonable since larger viewing angles would mean less continuum boosting.
7. Discussion and Conclusions
We investigate the Baldwin effect of 96 FSRQ for which spectroscopic data are available from Torrealba et al. (2012, 2014). Our main results are the following:
• We report that a significant Baldwin Effect was found in FSRQ, shown by significant anticorrelations (at the confidence level of ≥ 95%) between equivalent widths of the Hβ, Mg II and C IV emission lines and corresponding continuum luminosities.The slopes of the BE in FSRQ seem to be steeper than those in samples dominated by RQ quasars. Larger sampling of FSRQ is needed to confirm this result.
• The simulated toy model, shows that the difference we find in the slopes of the Baldwin Effect for RQ and FSRQ, cannot be explained by the addition of a non-thermal component to the continuum luminosity, nor by variability of the continuum components; which suggests that an extra emission line component is responsible for steepening the BE.
• We found that roughly 80% of FSRQ have a significant non-thermal contribution in optical/UV bands, i.e., NTD > 1, as was expected for AGN having relativistic jets. In particular, we reported that the bulk of UV emission is non-thermal and produced in the jet itself. The same evidence is corroborated for the optical continuum emission.
• We found values of NTD < 1 for several FSRQ, and argue that this result cannot be explained by a canonical BLR ionized only by the accretion disk, requiring the existence of an additional BLR component activated by the superluminal jet at parsec scales down to the radio-core. Probably due to their larger sampling, this is shown by sources (57%) with Mg II emission, and not in Hβ and C IV samples.
• In both optical and UV emission NTD increases at smaller viewing angles of the jet (θ ≤ 10°), which is in agreement with the prediction of the relativistic beaming theory.
• A positive correlation was found between the equivalent width Wλ and the viewing angle of the jet θ for Mg II, which is due to beaming of the continuum emission happening at small view angles that leads to a decrease in Wλ as a result of the continuum-line contrast.
It is well known that the SED of blazars are best described by beamed synchrotron emission from radio to X-ray frequencies, while the inverse Compton emission describes the SED of high frequency photons from the X-ray to TeV bands. The boosted synchrotron emission from the jet may dominate the low energy segment of the electromagnetic spectrum (radio to UV) in BL Lacs and FSRQ; while for radio galaxies (viewed at larger angles with respect to the jet) the emission from both the jet and accretion disk may significantly contribute to the total emission in optical, UV, and X-ray bands (cf. Blandford and Rees, 1978; Maraschi and Rovetti, 1994; Urry and Padovani, 1995). The thermal emission from the accretion disk may dominate during the lower state of the jet activity (when the jet power is at minimum), and vice versa, the non-thermal emission of the jet would be dominant during the high states of the jet activity (see Figure 4 in Arshakian et al., 2008).
This explains our findings presented earlier in Section 6 above, that about 10 to 25% of the MOJAVE blazars from the Hβ and C IV subsamples have a dominant thermal emission (NTD < 1). We would expect that roughly the same percentage of FSRQ from the Mg II subsample are thermally dominated, in disagreement with our finding that about 50% of sources have a thermal excess. For these quasars, the flux at 3000 Å coincides with the peak of the blue bump and the thermal luminosity at this frequency is higher than the luminosities at 1350 Å and 5100 Å by about 0.1 dex. This difference in luminosity is too small to reconcile the disagreement. Alternatively, the difference can be understood if there are two sources exciting the Mg II clouds, one is the thermal emission from the disk exciting the virialized Mg II clouds, and the other is the non-thermal jet emission which may excite both the virialized Mg II clouds and/or Mg II clouds outflowing along the jet (Pérez et al., 1989; Arshakian et al., 2010a; León-Tavares et al., 2010, 2013).
In this scenario, the observed Mg II emission is reflecting the contribution from both the jet and accretion disk, and, hence, the predicted emission line luminosity cannot only be attributed to the accretion disk in radio-loud blazars. This inevitably leads to values of NTD < 1 even for strongly non-thermal dominated sources. But the reason why only the Mg II line is affected by boosted jet emission remains unclear.
In the case of RQ AGN, the continuum emission radiation that ionizes the emitting gas regions comes from the thermal radiation of the accretion disk. While for FSRQ, the continuum emission also has a significant contribution from the non-thermal boosted radiation that arises from the relativistic jet (e.g., D'Arcangelo et al., 2007; Marscher et al., 2008). If the steepening of the Baldwin effect slope is inherent to FSRQ, this result could be directly related with the Doppler boosting of the continuum. If we could correct by Doppler boosting factor the continuum luminosity for all of our sources, we may find that the BE slope becomes flatter. But we need more data to do this analysis. Also a larger sample of FSRQ with optical and ultraviolet spectra is needed to confirm the BE slope steepening.
Our results listed above show that the non-thermal continuum of the jet contributes to the total continuum emission. Thus, the steep slopes of BE in blazars can be a signature of the contribution of the jet emission to the total continuum and line emission.
There is an observational evidence that optical flares and kinematics of the jet on sub-parsec scales are closely correlated: optical flare rises when superluminal component emerges into the jet. To explain the link between jet kinematics, optical continuum and emission line variability it was suggested the existence of the jet-excited BLR outflowing down the jet (Arshakian et al., 2010a; León-Tavares et al., 2010).
León-Tavares et al. (2013) reported a flare-like event of the Mg II emission line during a γ-ray outburst in 3C 454.3. They found that the highest levels of the emission line flux coincide with a superluminal jet component traversing through the radio core, which was confirmed in consequent studies by Isler et al. (2013). This is a direct observational evidence for a response of the broad emission lines to changes of the non-thermal continuum emission of the jet and, hence, the presence of the BLR material surrounding the radio core. The authors proposed an outflowing BLR which can arise from the accretion disk wind. This possibility is supported and was previously suggested by Pérez et al. (1989), and also for specific sources like 3C 273 (Paltani and Türler, 2003) and 3C 454. 3 (Finke and Dermer, 2010; León-Tavares et al., 2013).
From these previous findings combined with our results, we suggest the possibility that the jet emission greatly affects the gas that produces the emission lines and so, has an important contribution to the Baldwin Effect found in radio-loud compact AGN with superluminal jets. As a consequence, we can conclude that the relativistic plasma is tightly connected with the emitting line gas regions. The scenario we propose to explain the values of NTD< 1 and the difference in slopes of the Baldwin Effect in RQ AGN and FSRQ (steeper in RQ) consists on a second component of the Broad Line Region that is related to the jet, probably in the form of an outflow. Further work is needed aiming to quantify the contribution of the jet emission to the total continuum emission, and as well, to find out the real distribution of the gas emitting region in blazar type AGN.
Author Contributions
All the authors have then contributed to its design, acquisition, interpretation of the data, and writing of the paper.
Conflict of Interest Statement
The authors declare that the research was conducted in the absence of any commercial or financial relationships that could be construed as a potential conflict of interest.
Acknowledgments
This work is based on observations acquired at the Observatorio Astronómico Nacional in the Sierra San Pedro Mártir (OAN–SPM), Baja California, México, and at the Observatorio Astrofísico Guillermo Haro (OAGH), in Cananea, Sonora, México. This work is supported by CONACyT basic research grants 48484-F, 54480, and 151494 (Mexico). VA acknowledges support from the CONACyT program for Ph.D. studies. ICG acknowledges DGAPA (UNAM, Mexico) for a sabbatical scholarship and the Harvard-Smithsonian Center for Astrophysics for support as a visiting scholar. TA acknowledges support by DFG project number Os 177/2-1. LC is supported by the Ministry of Education and Science of R. Serbia through the project Astrophysical Spectroscopy of Extragalactic Objects (176001). The MOJAVE project is supported under National Science Foundation grant 0807860-AST and NASA-Fermi grant NNX08AV67G.
Footnotes
1. ^Radio-loudness classic criteria R: the ratio between the radio (5 GHz) and optical (4400 Å) flux densities R = F5GHz∕Fo4400A (Kellermann et al., 1989).
2. ^http://www.physics.purdue.edu/astro/MOJAVE/index.html.
3. ^http://vizier.cfa.harvard.edu/viz-bin/VizieR?-source=J/other/RMxAA/48.9.
4. ^Observatorio Astrofísico Guillermo Haro, in Cananea, Sonora, Mexico.
5. ^Observatorio Astronómico Nacional in San Pedro Mártir, Baja California, Mexico.
6. ^http://user.astro.columbia.edu/~williams/mpfitexy/
7. ^http://graphpad.com/quickcalcs/ttest1/
8. ^Partial Kendall's τp rank correlation removes the common dependence of luminosities on redshift.
References
Abazajian, K. N., Adelman-McCarthy, J. K., Agüeros, M. A., Allam, S. S., Anderson, K. S. J., Anderson, S. F., et al. (2005). The third data release of the sloan digital sky survey. Astronom. J. 129, 1755–1759. doi: 10.1086/427544
Abazajian, K. N., Adelman-McCarthy, J. K., Agüeros, M. A., Allam, S. S., Prieto, A. C., An, D., et al. (2009). The seventh data release of the sloan digital sky survey. Astrophys. J. Suppl. 182, 543–558. doi: 10.1088/0067-0049/182/2/543
Arshakian, T. G., León-Tavares, J., Lobanov, A. P., Chavushyan, V. H., Popovic, L., Shapovalova, A. I., et al. (2008). Jet-BLR connection in the radio galaxy 3C 390.3. Mem. Soc. Astronom. Italiana 79, 1022.
Arshakian, T. G., León-Tavares, J., Lobanov, A. P., Chavushyan, V. H., Shapovalova, A. I., Burenkov, A. N., et al. (2010a). Observational evidence for the link between the variable optical continuum and the subparsec-scale jet of the radio galaxy 3C 390.3. Month. Notices R. Astronom. Soc. 401, 1231–1239. doi: 10.1111/j.1365-2966.2009.15714.x
Arshakian, T. G., Torrealba, J., Chavushyan, V. H., Ros, E., Lister, M. L., Cruz-González, I., et al. (2010b). Radio-optical scrutiny of compact AGN: correlations between properties of pc-scale jets and optical nuclear emission. Astronom. Astrophys. 520, A62. doi: 10.1051/0004-6361/201014418
Bachev, R., Marziani, P., Sulentic, J. W., Zamanov, R., Calvani, M., and Dultzin-Hacyan, D. (2004). Average ultraviolet quasar spectra in the context of eigenvector 1: a baldwin effect governed by the eddington ratio? Astrophys. J. Suppl. 617, 171–183. doi: 10.1086/425210
Baldwin, J. A. (1977). Luminosity indicators in the spectra of quasi-stellar objects. Astrophys. J. 214, 679–684. doi: 10.1086/155294
Baskin, A., and Laor, A. (2004). On the origin of the C IV Baldwin effect in active galactic nuclei. Month. Notices R. Astronom. Soc. 350, L31–L35. doi: 10.1111/j.1365-2966.2004.07833.x
Blandford, R. D., and Rees, M. J. (1978). “Some comments on radiation mechanisms in Lacertids,” in BL Lac Objects, Vol. 17, ed A. M. Wolfe (Copenhagen: Physica Scripta), 265–274.
Boroson, T. A., and Green, R. F. (1992). The emission-line properties of low-redshift quasi-stellar objects. Astrophys. J. 80, 109–135. doi: 10.1086/191661
Brotherton, M. S., Tran, H. D., Becker, R. H., Gregg, M. D., Laurent-Muehleisen, S. A., and White, R. L. (2001). Composite spectra from the FIRST bright quasar survey. Astrophys. J. 546, 775. doi: 10.1086/318309
Carswell, R. F., and Smith, M. G. (1978). Is the apparent redshift cut-off in the Tololo deep survey real? Month. Notices R. Astronom. Soc. 185, 381–388. doi: 10.1093/mnras/185.2.381
Croom, S. M., Rhook, K., Corbett, E. A., Boyle, B. J., Netzer, H., Loaring, N. S., et al. (2002). The correlation of line strength with luminosity and redshift from composite quasi-stellar object spectra. Month. Notices R. Astronom. Soc. 337, 275–292. doi: 10.1046/j.1365-8711.2002.05910.x
D'Arcangelo, F. D., Marscher, A. P., Jorstad, S. G., Smith, P. S., Larionov, V. M., Hagen-Thorn, V. A., et al. (2007). Rapid multiwaveband polarization variability in the quasar PKS 0420-014: optical emission from the compact radio jet. Astrophys. J. 659, L107–L110. doi: 10.1086/517525
Dietrich, M., Hamann, F., Shields, J. C., Constantin, A., Vestergaard, M., Chaffee, F., et al. (2002). Continuum and emission-line strength relations for a large active galactic nuclei sample. Astrophys. J. 581, 912–924. doi: 10.1086/344410
Dong, X., Wang, T., Wang, J., Fan, X., Wang, H., Zhou, H., et al. (2009). Eddington ratio governs the equivalent width of Mg II emission line in active galactic nuclei. Astrophys. J. 703, L1–L5. doi: 10.1088/0004-637X/703/1/L1
Espey, B., and Andreadis, S. (1999). “Observational evidence for an ionization-dependent baldwin effect,” in Quasars and Cosmology, Vol. 162 of Astronomical Society of the Pacific Conference Series, eds G. Ferland and J. Baldwin (San Francisco, CA: Astronomical Society of the Pacific), 351.
Finke, J. D., and Dermer, C. D. (2010). On the Break in the Fermi-Large Area Telescope Spectrum of 3C 454.3. Astrophys. J. 714, L303–L307. doi: 10.1088/2041-8205/714/2/L303
Francis, P. J., Hooper, E. J., and Impey, C. D. (1993). The ultraviolet spectra of radio-loud and radio-quiet quasars. Astronom. J. 106, 417–425. doi: 10.1086/116651
Greene, J. E., and Ho, L. C. (2005). Estimating Black Hole Masses in Active Galaxies Using the Hα Emission Line. Astrophys. J. 630, 122–129. doi: 10.1086/431897
Hovatta, T., Valtaoja, E., Tornikoski, M., and Lähteenmäki, A. (2009). Doppler factors, Lorentz factors and viewing angles for quasars, BL Lacertae objects and radio galaxies. Astronom. Astrophys. 494, 527–537. doi: 10.1051/0004-6361:200811150
Isler, J. C., Urry, C. M., Coppi, P., Bailyn, C., Chatterjee, R., Fossati, G., et al. (2013). A time-resolved study of the broad-line region in blazar 3C 454.3. Astrophys. J. 779, 100. doi: 10.1088/0004-637X/779/2/100
Kellermann, K. I., Lister, M. L., Homan, D. C., Vermeulen, R. C., Cohen, M. H., Ros, E., et al. (2004). Sub-milliarcsecond imaging of quasars and active galactic nuclei. III. Kinematics of parsec-scale radio jets. Astrophys. J. 609, 539. doi: 10.1086/421289
Kellermann, K. I., Sramek, R., Schmidt, M., Shaffer, D. B., and Green, R. (1989). VLA observations of objects in the Palomar Bright Quasar Survey. Astronom. J. 98, 1195. doi: 10.1086/115207
Kellermann, K. I., Vermeulen, R. C., Zensus, J. A., and Cohen, M. H. (1998). Sub-milliarcsecond imaging of quasars and active galactic nuclei. Astronom. J. 115, 1295. doi: 10.1086/300308
Korista, K., Baldwin, J., and Ferland, G. (1998). Quasars as cosmological probes: the ionizing continuum, gas metallicity, and the W_lambda-L relation. Astrophys. J. 507, 24–30. doi: 10.1086/306321
Kovalev, Y. A., Kovalev, Y. Y., and Nizhelsky, N. A. (2000). “Instantaneous 1-22 GHz spectra of 214 VSOP survey sources,” in Astrophysical Phenomena Revealed by Space VLBI, Vol. 52, eds H. Hirabayashi, P. G. Edwards, and D. W. Murphy (Moscow: Publications of the Astronomical Society of Japan), L1027–L1036.
Kovalev, Y. Y., Kellermann, K. I., Lister, M. L., Homan, D. C., Vermeulen, R. C., Cohen, M. H., et al. (2005). Sub-milliarcsecond imaging of quasars and active galactic nuclei. IV. Fine-scale structure. Astronom. J. 130, 2473. doi: 10.1086/497430
Kovalev, Y. Y., Nizhelsky, N. A., Kovalev, Y. A., Berlin, A. B., Zhekanis, G. V., Mingaliev, M. G., et al. (1999). Survey of instantaneous 1-22 GHz spectra of 550 compact extragalactic objects with declinations from −30° to +43°. Astronom. Astrophys. Suppl. 139, 545. doi: 10.1051/aas:1999406
Kovačević, J., Popović, L. Č., and Dimitrijević, M. S. (2010). Analysis of optical Fe II emission in a sample of active galactic nucleus spectr a. Astrophys. J. Suppl. Ser. 189, 15–36. doi: 10.1088/0067-0049/189/1/15
Lähteenmäki, A., and Valtaoja, E. (1999). Total flux density variations in extragalactic radio sources. III. Doppler boosting factors, lorentz factors, and viewing angles for active galactic nuclei. Astrophys. J. 521, 493–501. doi: 10.1086/307587
León-Tavares, J., Chavushyan, V., Patiño-Álvarez, V., Valtaoja, E., Arshakian, T. G., Popović, L. Č., et al. (2013). Flare-like Variability of the Mg II λ2800 Emission Line in the Γ-Ray Blazar 3C 454.3. Astrophys. J. 763:L36. doi: 10.1088/2041-8205/763/2/L36
León-Tavares, J., Lobanov, A. P., Chavushyan, V. H., Arshakian, T. G., Doroshenko, V. T., Sergeev, S. G., et al. (2010). Relativistic plasma as the dominant source of the optical continuum emission in the broad-line radio galaxy 3C 120. Astrophys. J. 715, 355. doi: 10.1088/0004-637X/715/1/355
Lister, M. L., Cohen, M. H., Homan, D. C., Kadler, M., Kellermann, K. I., Kovalev, Y. Y., et al. (2009). MOJAVE: monitoring of jets in active galactic nuclei with VLBA experiments. VI. kinematics analysis of a complete sample of blazar jets. Astronom. J. 138, 1874. doi: 10.1088/0004-6256/138/6/1874
Maraschi, L., and Rovetti, F. (1994). A unified relativistic beaming model for BL Lacertae objects and flat spectrum radio quasars. Astrophys. J. 436, 79–88. doi: 10.1086/174882
Markwardt, C. B. (2009). Astronomical Science of the Pacific Conference Series. Québec City, QC: Astronomical Society of the Pacific.
Marscher, A. P., Jorstad, S. G., D'Arcangelo, F. D., Smith, P. S., Williams, G. G., Larionov, V. M., et al. (2008). The inner jet of an active galactic nucleus as revealed by a radio-to-γ-ray outburst. Nature 452, 966–969. doi: 10.1038/nature06895
Netzer, H., Mainieri, V., Rosati, P., and Trakhtenbrot, B. (2006). The correlation of narrow line emission and X-ray luminosity in active galactic nuclei. Astronom. Astrophys. 453, 525–533. doi: 10.1051/0004-6361:20054203
Netzer, H., Shemmer, O., Maiolino, R., Oliva, E., Croom, S., Corbett, E., et al. (2004). Near-infrared spectroscopy of high-redshift active galactic nuclei. II. Disappearing narrow-line regions and the role of accretion. Astrophys. J. 614, 558–567. doi: 10.1086/423608
Netzer, H., and Trakhtenbrot, B. (2007). Cosmic evolution of mass accretion rate and metallicity in active galactic nuclei. Astrophys. J. 654, 754–763. doi: 10.1086/509650
Paltani, S., and Türler, M. (2003). Dynamics of the Lyα and C IV Emitting Gas in 3C 273. Astrophys. J. 583, 659–669. doi: 10.1086/345421
Pérez, E., Penston, M. V., and Moles, M. (1989). Spectrophotometric monitoring of high luminosity active galactic nuclei - ii. first results. Month. Notices R. Astronom. Soc. 239, 75–90. doi: 10.1093/mnras/239.1.75
Popović, L. Č., and Kovačević, J. (2011). Optical emission-line properties of a sample of the broad-line active galactic nuclei: the baldwin effect and eigenvector 1. Astrophys. J. 738, 68. doi: 10.1088/0004-637X/738/1/68
Scott, J. E., Kriss, G. A., Brotherton, M., Green, R. F., Hutchings, J., Shull, J. M., et al. (2004). A composite extreme-ultraviolet QSO spectrum from FUSE. Astrophys. J. 615, 135–149. doi: 10.1086/422336
Shaw, M. S., Romani, R. W., Cotter, G., Healey, S. E., Michelson, P. F., Readhead, A. C. S., et al. (2012). Spectroscopy of Broad-line Blazars from 1LAC. Astrophys. J. 748, 49. doi: 10.1088/0004-637X/748/1/49
Shen, Y., Richards, G. T., Strauss, M. A., Hall, P. B., Schneider, D. P., Snedden, S., et al. (2011). A catalog of quasar properties from sloan digital sky survey data release 7. Astrophys. J. Suppl. 194, 45. doi: 10.1088/0067-0049/194/2/45
Shields, J. C. (2007). “Emission-line versus continuum correlations in active galactic nuclei,” in The Central Engine of Active Galactic Nuclei, Vol. 373 of Astronomical Society of the Pacific Conference Series, eds L. C. Ho and J.-W. Wang (Astronomical Society of the Pacific), 355.
Torrealba, J., Arshakian, T. G., Chavushyan, V., and Cruz-González, I. (2011). “Correlations between radio emission of the parsec-scale jet and optical nuclear emission of host AGN,” in XIII Latin American Regional IAU Meeting, Vol. 40 of Revista Mexicana de Astronomía y Astrofísica, (Serie de Conferencias), eds W. J. Henney and S. Torres-Peimbert (Universidad Nacional Autónoma de México), 98–99.
Torrealba, J., Chavushyan, V., Cruz-González, I., Arshakian, T. G., Bertone, E., and Rosa-González, D. (2012). Optical Spectroscopic Atlas of the MOJAVE/2cm AGN Sample. Rev. Mex. Astron. Astrofis. 48, 9–40.
Torrealba, J., Chavushyan, V., Cruz-Gonzalez, I., Arshakian, T. G., Bertone, E., and Rosa-Gonzalez, D. (2014). VizieR online data catalog: mOJAVE/2cm AGN sample opt. spectros. atlas (Torrealba+, 2012). VizieR Online Data Catalog 80, 4802.
Tresse, L., Maddox, S., Loveday, J., and Singleton, C. (1999). Spectral analysis of the Stromlo-APM Survey - I. Spectral properties of galaxies. Month. Notices R. Astronom. Soc. 310, 262–280. doi: 10.1046/j.1365-8711.1999.02977.x
Urry, C. M., and Padovani, P. (1995). Unified Schemes for Radio-Loud Active Galactic Nuclei. Publ. Astronom. Soc. Pacific 107, 803. doi: 10.1086/133630
Vestergaard, M., and Wilkes, B. J. (2001). An empirical ultraviolet template for iron emission in quasars as derived from I Zwicky 1. Astrophys. J. Suppl. 134, 1–33. doi: 10.1086/320357
Warner, C., Hamann, F., and Dietrich, M. (2003). A Relation between Supermassive Black Hole Mass and Quasar Metallicity? Astrophys. J. 596, 72–84. doi: 10.1086/377710
Xu, Y., Bian, W.-H., Yuan, Q.-R., and Huang, K.-L. (2008). The origin and evolution of CIV Baldwin effect in QSOs from the Sloan Digital Sky Survey. Month. Notices R. Astronom. Soc. 389, 1703–1708. doi: 10.1111/j.1365-2966.2008.13545.x
York, D. G., Adelman, J., Anderson, J. E. Jr, Anderson, S. F., Annis, J., Bahcall, N. A., et al. (2000). The sloan digital sky survey: technical summary. Astronom. J. 120, 1579–1587. doi: 10.1086/301513
Zensus, J. A., Ros, E., Kellermann, K. I., Cohen, M. H., Vermeulen, R. C., and Kadler, M. (2002). Sub-milliarcsecond imaging of quasars and active galactic nuclei. II. Additional sources. Astronom. J. 124, 662. doi: 10.1086/341585
Zhang, K., Wang, T.-G., Gaskell, C. M., and Dong, X.-B. (2013). The baldwin effect in the narrow emission lines of active galactic nuclei. Astrophys. J. 762, 51. doi: 10.1088/0004-637X/762/1/51
Zheng, W., Kriss, G. A., and Davidsen, A. F. (1995). Relation between O VI Emission and X-Ray Intensity in Active Galactic Nuclei. Astrophys. J. 440, 606. doi: 10.1086/175299
Zheng, W., Kriss, G. A., Telfer, R. C., Grimes, J. P., and Davidsen, A. F. (1997). A Composite HST Spectrum of Quasars. Astrophys. J. 475, 469. doi: 10.1086/303560
Keywords: galaxies:active, galaxies:jets, quasars:emission lines
Citation: Patiño-Álvarez VM, Torrealba J, Chavushyan V, Cruz-González I, Arshakian T, León-Tavares J and Popović L (2016) Baldwin Effect and Additional BLR Component in AGN with Superluminal Jets. Front. Astron. Space Sci. 3:19. doi: 10.3389/fspas.2016.00019
Received: 08 March 2016; Accepted: 09 May 2016;
Published: 02 June 2016.
Edited by:
Jirong Mao, RIKEN, JapanReviewed by:
Daniela Bettoni, INAF - Osservatorio Astronomico di Padova, ItalyGiovanna Maria Stirpe, INAF - Osservatorio Astronomico di Bologna, Italy
Copyright © 2016 Patiño-Álvarez, Torrealba, Chavushyan, Cruz-González, Arshakian, León-Tavares and Popović. This is an open-access article distributed under the terms of the Creative Commons Attribution License (CC BY). The use, distribution or reproduction in other forums is permitted, provided the original author(s) or licensor are credited and that the original publication in this journal is cited, in accordance with accepted academic practice. No use, distribution or reproduction is permitted which does not comply with these terms.
*Correspondence: Vahram Chavushyan, chavushyanv@gmail.com