Medical Research Council Cognition and Brain Sciences Unit, Cambridge, UK
Perceptual and cognitive content is thought to be represented in the brain by patterns of activity across populations of neurons. In order to test whether a computational model can explain a given population code and whether corresponding codes in man and monkey convey the same information, we need to quantitatively relate population-code representations. Here I give a brief introduction to representational similarity analysis, a particular approach to this problem. A population code is characterized by a representational dissimilarity matrix (RDM), which contains a dissimilarity for each pair of activity patterns elicited by a given stimulus set. The RDM encapsulates which distinctions the representation emphasizes and which it deemphasizes. By analyzing correlations between RDMs we can test models and compare different species. Moreover, we can study how representations are transformed across stages of processing and how they relate to behavioral measures of object similarity. We use an example from object vision to illustrate the method’s potential to bridge major divides that have hampered progress in systems neuroscience.
Two major challenges facing systems neuroscience today are (1) to relate computational brain theory with its notions of parallel computation and population-code representation to the massive amounts of spatiotemporal brain-activity data that can be acquired with modern techniques including functional magnetic resonance imaging (fMRI) and invasive electrophysiological recording and (2) to relate brain representations in animal models (including nonhuman primates) to human brain representations.
Perceptual and cognitive content is thought to be represented in the brain by patterns of activity across populations of neurons. Because population codes
are combinatorial by nature, we need multivariate pattern-information analysis
to summarize the distributed evidence (across neurons, sites, voxels, or sensors) and reveal the information the code carries. Pattern-information analysis has recently gained momentum in fMRI and electrophysiology (e.g., Haxby et al., 2001
; Spiridon and Kanwisher, 2002
; Carlson et al., 2003
; Cox and Savoy, 2003
; Hanson et al., 2004
; Kriegeskorte, 2004
; Mitchell et al., 2004
; Haynes and Rees, 2005
; Hung et al., 2005
; Kamitani and Tong, 2005
; LaConte et al., 2005
; Mourao-Miranda et al., 2005
; Polyn et al., 2005
; Kamitani and Tong, 2006
; Kriegeskorte et al., 2006
; Tsao et al., 2006
; Kiani et al., 2007
; Kriegeskorte et al., 2007
; Serences and Boynton, 2007
; for reviews see Haynes and Rees, 2006
; Norman et al., 2006
; Kriegeskorte and Bandettini, 2007
). However, the popular approach of pattern classification, a specific variant of pattern-information analysis, requires the a priori definition of stimulus categories to be “decoded” from the response patterns. Above-chance decoding accuracy indicates category information carried by the population code. While this approach is very sensitive to small amounts of information about membership in the predefined categories, it does not address the two challenges of testing computational network models with brain-activity data and relating representations between different species. Moreover, because the categories are predefined, this approach does not allow us to discover the stimulus dimensions that are best distinguished by a population code.
Here I review an alternative pattern-information technique that addresses these challenges. The technique is called representational similarity analysis
(RSA; Kriegeskorte et al., 2008a
), because it uses a continuous pattern-similarity measure to assess the similarity structure of the stimuli in a given population code. In contrast to pattern-classifier analysis, it can relate brain representations to other brain representations, as well as to computational models and arbitrary multivariate stimulus descriptions, with sensitivity to both linear and nonlinear relationships. In contrast to more general methods of estimating mutual information between stimulus and response patterns (Kraskov et al., 2004
), it works well for small numbers of stimulus repetitions (the typical scenario in primate studies) and is mathematically and computationally very simple.
RSA starts by characterizing a given brain representation by a dissimilarity matrix of stimulus-evoked activity patterns. For each pair of stimuli, the representational dissimilarity matrix
(RDM) contains an entry reflecting the dissimilarity of the activity patterns associated with the two stimuli (Figure 1
). Intuitively, an RDM describes which distinctions between stimuli are emphasized and which are deemphasized in a representation. The dissimilarity structure can be visualized by arranging the stimuli according to response pattern dissimilarity, such that stimuli are placed close together if they elicited similar response patterns, and far apart if they elicited dissimilar patterns. A technique that computes this type of representation is multidimensional scaling.
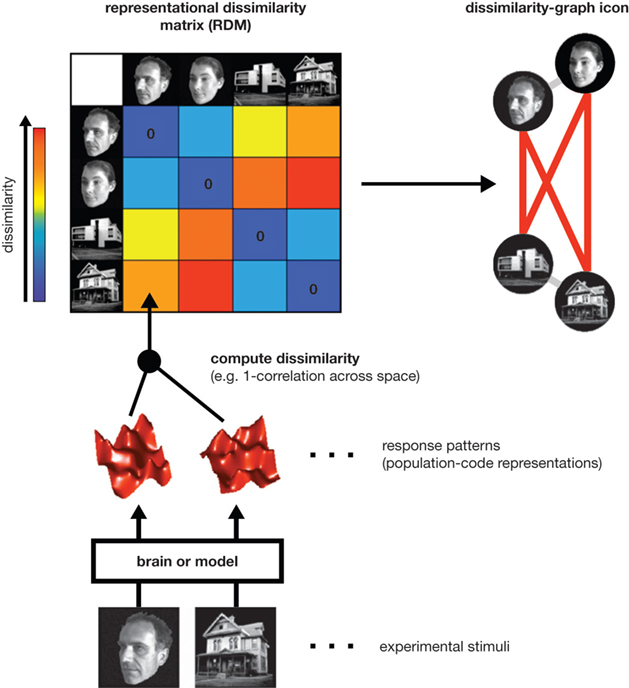
Figure 1. Computation of a representational dissimilarity matrix. For each pair of experimental stimuli, the response patterns elicited in a brain region or model representation are compared to determine the stimuli’s representational dissimilarity. The dissimilarity between two patterns can be measured as 1 minus the correlation (0 for perfect correlation, 1 for no correlation, 2 for perfect anticorrelation). These dissimilarities for all pairs of stimuli are assembled in the representational dissimilarity matrix (RDM). Each cell of the matrix then compares the response patterns elicited by two images and the matrix is symmetric about a diagonal of zeroes. To visualize the representation, we can arrange the stimuli according to response-pattern dissimilarity, such that stimuli are placed close together if they elicited similar response patterns and far apart if they elicited dissimilar response patterns. The color of each connection line here indicates whether the response-pattern difference was significant (red: p < 0.01; light gray: p ≥ 0.05).
RDMs can equally be computed from measured brain activity patterns (irrespective of the species and measurement technique) and from activity patterns in computational network models. Using the RDM as the signature of each representation allows quantitative comparisons between representations (Figure 2
) without the need for a spatial correspondency mapping (defining, for example, which neuron corresponds to which unit of a computational model). We can correlate RDMs to assess to what degree two representations are related. This allows us, for example, to assess which of a range of computational network models best fits the representation in a given brain region. We can also relate representations between different brain regions, as well as between different individuals and species. Moreover, we can relate different modalities of brain activity measurement (e.g., single-cell recording and fMRI) for a given brain representation.
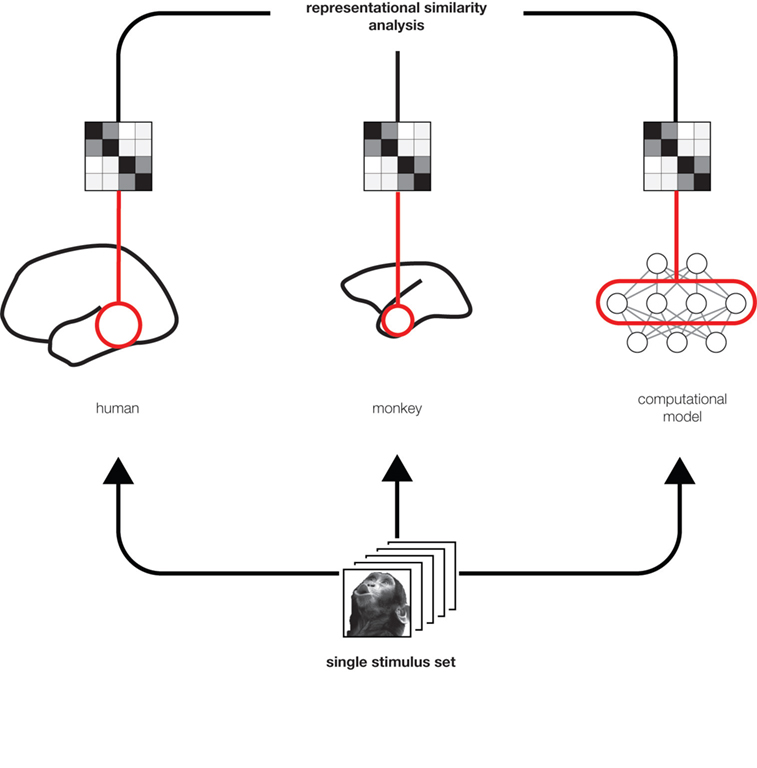
Figure 2. Integrated analysis of population codes in man, monkey and models. Humans, monkeys, and computational models are presented with the same particular stimulus images so as to obtain representational dissimilarity matrices (Figure 1
). This allows us to compare the representations between putative functionally homologous regions and to test which computational models can explain each brain region’s representation.
RSA provides a multivariate statistical framework for visualizing and statistically comparing dissimilarity matrices, thus quantitatively relating complex representations between species and between brains and models (Figure 2
), while treating each stimulus and each response channel as a unique entity. Computational models in this technique form an integral component of the analysis of brain-activity data. RDMs can be tested for relatedness and distinctness using randomization and bootstrap techniques (Kriegeskorte et al., 2008a
). A set of RDMs characterizing brain regions and various model representations can be simultaneously related via second-level application of multidimensional scaling (Fig. 9B in Kriegeskorte et al., 2008a
).
RSA is an extension of pattern-information analysis. From pattern-information analysis, RSA inherits a sensitivity to fine-grained activity patterns and the information they carry. Unlike conventional pattern-information analysis, RSA can handle complex stimulus sets without the need to average across or group the stimuli. RSA enables us to perform experiments with many stimuli, while treating each stimulus as a unique entity.
Related Approaches in the Literature
RSA is deeply rooted in the similarity analyses of mathematical psychology (e.g., Shepard and Chipman, 1970
; for an introduction, see Edelman, 1998
). A key technique is multidimensional scaling (Torgerson, 1958
; Kruskal and Wish, 1978
; Shepard, 1980
). Laakso and Cottrell (2000)
compared representations in hidden units of connectionist networks by correlating the dissimilarity structures of their activity patterns. A number of studies have applied similarity analyses to brain activity patterns (e.g., Edelman et al., 1998
; Tagaris et al., 1998
; Hanson et al., 2004
; O’Toole et al., 2005
; Bressler et al., 2007
; Kiani et al., 2007
; Lehky and Sereno, 2007
; Formisano et al., 2008
; Kay et al., 2008
; Tzagarakis et al., 2009
). While many early studies used similarity analyses as a data-driven approach to discover the inherent dimensions of behavioral and neural data, some more recent studies have used similarity-based methods in more hypothesis driven ways to relate brain, behavior, and models (e.g., Op de Beeck et al., 2001
; Kayaert et al., 2005
; Aguirre, 2007
; Haushofer et al., 2008
; Kriegeskorte et al., 2008a
,b
). We have proposed that RSA can serve as a general framework for testing computational and conceptual models and relating population-codes between species and measurement modalities (Kriegeskorte et al., 2008a
).
Revealing the Forest, while Honoring the Trees
A large proportion of neurophysiological studies has focused on either single-cell electrophysiological or regional-average fMRI responses. This approach is not optimally suited for revealing the information content of population codes, which are inherently combinatorial and multivariate. While single-cell analyses honor the trees (the individual neurons), they do not optimally reveal the forest in that they can miss weak widespread and combinatorially coded information. While regional-average responses reveal one aspect of the forest (the regional-average activation level), they do not honor the trees (the fine-grained pattern of activity) and therefore also fail to reveal combinatorially coded information. By comparing the patterns of activity for each stimulus pair, RSA combines information across multiple response channels (thus revealing the forest), but it does not require averaging of activity patterns across space or time (thus honoring the trees). RSA shares this feature with other pattern-information analyses.
Treating Each Individual Stimulus as a Unique Entity
Pattern-information analyses based on multivariate classifiers reveal population-code information by classifying response patterns according to a small number (usually 2) or predefined stimulus categories. The necessary predefinition of the stimulus classes implies assumptions that can bias the results. Classifier analyses shares this feature of predefined stimulus classes with the more conventional fMRI approach of analyzing the average responses for a small number of stimulus classes (typically two to five classes). RSA, in contrast, allows us to treat each of a large number of stimuli as a unique entity.
Exploiting Large Parameterized or Unparameterized Stimulus Sets
Although RSA can be applied to a wide range of conventional experimental designs, the benefits of RSA will be greatest for condition-rich experimental designs, i.e., designs that distinguish a fairly large number of experimental conditions. In perceptual experiments the conditions will typically correspond to stimuli. One way of enriching the stimulus set is by systematically varying one or a number of stimulus parameters. The more stimuli we include in the experiment, the fewer repeated measurements we will typically be able to perform for each stimulus. For large stimulus sets, the response estimate for any single stimulus will be very noisy. However, the relationship between stimulus parameters and brain activity can be stably estimated by combining evidence across stimuli: We simply correlate a brain region’s RDM with an RDM based on one or multiple stimulus parameters (or with an RDM predicted by a computational model), so as to obtain a single fit parameter, the correlation between the two RDMs. Note that this correlation combines the evidence across stimuli and across response channels (e.g., single neurons or fMRI voxels). However, response patterns are not averaged across either stimuli or response channels.
Parameterized designs are ideal for RSA as model RDMs can be computed directly from the stimulus parameters. A pattern-classification approach would require a grouping of the stimuli. RSA can naturally handle continuously parameterized stimulus sets. However, RSA is not limited to either grouped or parameterized stimulus sets. Random stimulus sets can be analyzed using computational models (or any measured uni- or multivariate stimulus descriptions) to provide the reference RDMs. The example application described below uses an unparameterized design.
Obviating the Need for a Spatial Correspondency Mapping
Using measured brain-activity patterns to evaluate computational network models is complicated by the need to define the correspondency between the units of the model and the channels of the brain-activity data, e.g., single-cell recordings. A one-to-one mapping between model units and data channels may not exist, and even if it did it would be difficult to define. Similar correspondency problems complicate relating activity patterns between different modalities of brain-activity measurement (e.g., single neurons and fMRI voxels), and between regions within a subject and between subjects and species. For example, a precise neuron-to-neuron mapping is unlikely to exist even between corresponding functional regions in two members of the same species. At the neuronal scale, we expect representations to be subject-unique – like fingerprints. However, population codes in corresponding functional regions are nevertheless expected to serve the same function – like fingers. Although sensitive to the fine-grained pattern, the RDM usefully abstracts from individual coding idiosyncrasies and encapsulates the information the code carries. Relating the representations at the level of the RDMs obviates the need for a spatial correspondency mapping: Since the RDMs are indexed (horizontally and vertically) by the stimuli, they can be directly compared. In an intuitive sense, what we are comparing is the represented information, not the activity patterns themselves. In particular, RSA can reveal the relationships between:
• representations in different regions of the same brain (“representational connectivity”),
• corresponding brain regions in different subjects (“intersubject information”),
• corresponding brain regions in different species (e.g., humans and monkeys),
• and different modalities of brain-activity data (e.g., cell recordings and fMRI voxels).
Allowing Tests of Conceptual and Computational Models
So far computational network models of complex brain information processing have typically been related to brain-activity data mainly at the level of verbal theory. Sometimes neurometric functions with very few parameters are used to make a quantitative link. Using brain-activity data to directly fit computational models has been pursued as well, but only for models of lower-level single-cell responses, not for network models of complex higher-level functions. RSA allows us to test complex computational network models by means of massive spatiotemporal brain-activity data. To this end, a computational model needs to be able to process the experimental stimuli presented to the subjects, such that its internal population code can be characterized by an RDM to be compared to the RDM from brain activity. Moreover, RSA can also be used to test conceptual models that are not computationally specified as long as they make predictions as to which stimulus distinctions a population code emphasizes and which it deemphasizes. A categorical model, for example, might predict that evoked activity patterns are similar within and dissimilar between the stimulus categories.
Relating Brain and Behavior
RSA can relate population codes to behavioral measures of stimulus similarity. The dissimilarity values can come from explicit similarity judgments or from reaction times or confusion errors in comparison tasks (Shepard et al., 1975
; Cutzu and Edelman, 1996
, 1998
; Edelman et al., 1998
; Op de Beeck et al., 2001
; Kiani et al., 2007
). A close match between the RDM of a brain region and the behavioral dissimilarity matrix would suggest that the regional representation might play a role in determining the behavior measured.
Combining Data- and Hypothesis-Driven Analysis
RSA has a data-driven component, e.g., the visualization of the response-pattern relationships using multidimensional scaling. It shares this feature with the early similarity analyses of mathematical psychology, which it is based upon. However, RSA becomes distinctly hypothesis-driven when testing computational or conceptual models. We can gradually move from the data-driven, exploratory pole toward the hypothesis-driven, confirmatory pole by bringing in more and more assumptions. Theoretical assumptions can motivate averaging within groups of response patterns for more stable estimates. They can also motivate the definition of a wide or more restricted space of theoretical models that predict RDMs. The exploratory pole allows us to discover major variance-explaining factors that a confirmatory analysis would have missed. The confirmatory pole grants us greater power to decide between models as it benefits (at the risk of bias) from the strong assumptions made.
Monkey inferior temporal (IT) cortex used to be conceptualized (e.g., Tanaka, 1996
) and modeled (e.g., Serre et al., 2007
) as a representation of a continuous shape space. In the human, by contrast, the homologous cortical extent was thought to be organized by category. However, the categorical structure was assumed in the design of the classical human experiments (e.g., Kanwisher et al., 1997
), rather than discovered from the data. Two recent studies (Kiani et al., 2007
; Kriegeskorte et al., 2008b
) investigated the similarity structure of IT response patterns to real-world object images in monkey and human. Kriegeskorte et al. (2008b)
compared the IT representations in the two species using RSA. In the humans, the measurements were performed with fMRI, in the monkeys with electrode recordings (experiment from Kiani et al., 2007
).
The comparison revealed a striking match between the IT representations in both species (Figure 3
). Moreover, the representations appear inherently categorical in that response patterns cluster according to conventional categories. IT emphasizes the same major categorical distinctions in both species. The animate–inanimate and face–body distinctions explain most variance. Even within stimulus categories, the dissimilarity structures are correlated between species, suggesting that IT places visual objects in a similar continuous object space in both species. IT object similarity was not well accounted for by several computational models designed to mimic either low-level or IT level features (Figure 4
; Riesenhuber and Poggio, 2002
; Serre et al., 2005
; see also supplement of Kriegeskorte et al., 2008b
).
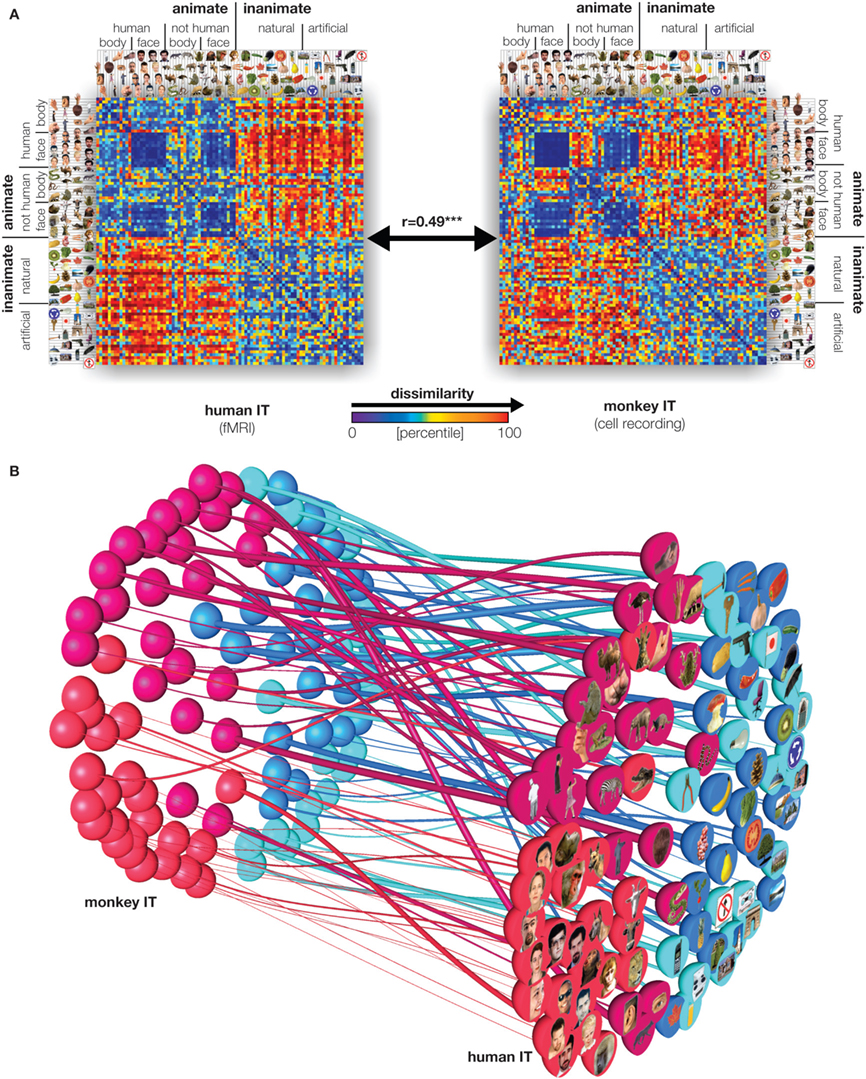
Figure 3. Relating representations between man and monkey. (A) Representational dissimilarity matrices for monkey and human IT cortex reveal matching representations in the two species. Human data is from 316 bilateral inferior temporal voxels selected by their visual-object response in an independent data set. Monkey data is from 674 IT single cells isolated in two monkeys (Kiani et al., 2007
). (B) Stimulus arrangements reflecting IT response-pattern dissimilarity in monkey and human with fiber-flow visualization of the interspecies relationship. The experimental stimuli have been arranged such that their pairwise distances approximately reflect response-pattern dissimilarity (multidimensional scaling, dissimilarity: 1 minus correlation, criterion: metric stress). The analysis does not presuppose any categorical structure, but the arrangement quite cleanly divides animates and inanimates as well as faces (including human and nonhuman faces) and bodies. Colors code for conventional category: face (red), body (magenta), natural object (blue), artificial object (cyan). The connecting fibers serve to visually relate individual stimuli between the two arrangements. In addition, the thickness of the fibers can be used to visualize relational statistics. Here the thickness of each fiber reflects to what extent the corresponding stimulus is inconsistently represented in monkey and human IT. The interspecies inconsistency of stimulus i is defined as (1 − ri)2, where ri is the correlation between the vectors (for human and monkey) of the 91 dissimilarities between stimulus i and the other stimuli. For details, see Kriegeskorte et al. (2008b
).
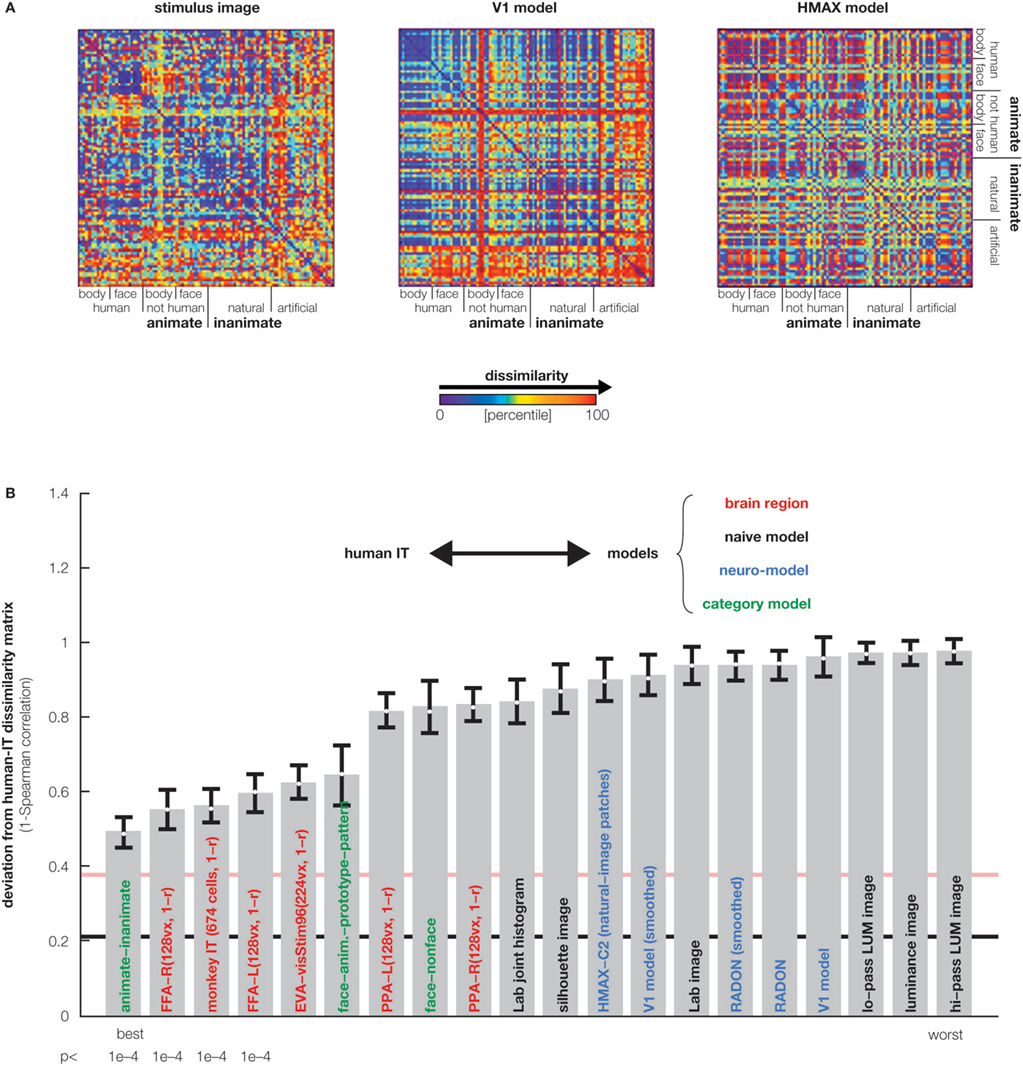
Figure 4. Testing computational and conceptual models. (A) RDMs for three model representations (computed as in Figures 1 and 3
). Each model predicts a unique similarity structure that can be compared to that of an actual brain region. (B) Comparison between the RDM for human IT (Figure 3
) and a range of models. Each bar indicates the deviation between the RDM of human IT and that of a model or other brain region. The deviation is measured as 1 minus the Spearman correlation between RDMs. Text-label colors indicate the type of representation: neuroscientifically motivated computational model (blue), naive computational model (black), conceptual model (green), brain representation (red). Error bars indicate the standard error of the deviation estimate (from bootstrap resampling). The number below each bar indicates the p value for a test of relatedness between the RDM of human IT and that of the model or other region. The black line indicates the noise floor, i.e., the expected deviation between the empirical reference RDM (with noise) and the underlying true RDM (without noise). The light red line indicates the expected retest deviation between the RDM for human IT that would be expected if the experiment were repeated with different subjects (both matrices affected by noise). This analysis has not previously been published, but the method follows Kriegeskorte et al. (2008a
,b
).
We suspect that a computational model would have to be explicitly trained to distinguish conventional categories (like the prefrontal stage in Serre et al., 2007
) or to emphasize semantic features (McClelland and Rogers, 2003
) in order to account for the representational dissimilarities we observed in human and monkey IT. Interestingly, inconsistencies between the species were also apparent. Exploratory RSA suggested a conspecific face representation, in which human faces are better distinguished by human IT and monkey/ape faces by monkey IT (Fig. S4 in Kriegeskorte et al., 2008b
).
Taken together, the pattern-similarity based analyses of Kiani et al. (2007) and Kriegeskorte et al. (2008b)
went beyond previous studies by suggesting that the IT representation is inherently categorical in both man and monkey and that the inherent category structure matches between the species. The results pose a challenge to the non-categorical shape-space view of IT. Importantly, the RDMs provide rich empirical constraints for computational models. The good match additionally suggests that similar population-code information can be revealed by single-cell recordings and fMRI when each modality is analyzed for multivariate pattern information. Moreover, these studies encourage the view that the macaque brain might provide an appropriate model of the human brain not only for early sensory processing, but also at the higher level of categorical object representations. One interpretation is that evolution and individual development leave primate IT with representational features that emphasize behaviorally important categorical distinctions. The major distinctions, animate–inanimate and face–body, are so basic that their conservation across species appears plausible. The interspecies match of both category and within-category structure suggests an IT code common to human and monkey, which combines a categorical and a continuous representation of objects.
Several limitations deserve consideration when applying these methods and interpreting their results.
(1) RSA abstracts from the selectivities of individual measured channels (e.g., neurons or voxels) so as to reveal the information in the population code. To what extent the information is concentrated in a few highly selective channels or distributed over the investigated brain region is a question that requires complementary analyses.
(2) RSA covers a wide spectrum between data driven (e.g., stimulus arrangements from multidimensional scaling) and hypothesis-driven analyses (e.g., testing a computational model by checking if its predicted RDM fits the data). At the hypothesis-driven end, it can be used to test if stimuli from two predefined categories elicit the same or different response patterns – thus addressing the same conceptual question as pattern-classifier analysis. The reference RDM in this case would contain a 0 for all pairs of stimuli in the same category and a 1 for all pairs in different categories. The RDM correlation would then essentially address if response patterns elicited by stimuli in different categories tend to be more different. However, this might be a less sensitive method of detecting subtle category information (e.g., in the sense of linear separability) than classifier analysis.
(3) RSA requires the choice of a pattern-dissimilarity measure. Several studies suggest that correlation distance works well in practice (Haxby et al., 2001
; Kiani et al., 2007
; Kriegeskorte et al., 2008a
). Correlation distance is insensitive to differences of the spatial-mean activity level and the variability of the activity across each activity pattern. Alternative dissimilarity measures include the Euclidean distance, the absolute spatial-mean activation difference, and more complex measures like the Mahalanobis distance, or the pairwise discriminatory information. The appropriate interpretation of the results will depend on the chosen dissimilarity measure.
(4) There is a rich literature on mathematical methods for analyzing similarity data (e.g., Borg and Groenen, 2005
) and statistical learning techniques rely on closely related concepts (e.g., Schölkopf and Smola, 2002
). However, the particular problem of relating population codes in a pattern-similarity framework deserves further attention. Basic statistical inference on the relatedness between two RDMs can be performed using a randomization test (e.g., Kriegeskorte et al., 2008a
) and random-effects inference based on descriptive RSA results for each subject is straightforward. However, more complex statistical methods remain to be developed or adapted for brain-activity data, for example frequentist and Bayesian methods for comparing relative RDM fits of several models.
The key idea of RSA is to relate different population codes by comparing their RDM signatures. Making the link at the level of the RDMs combines three attractive features: (1) the RDM is a conceptually well-motivated summary description that abstracts from coding idiosyncrasies of individual brains or models to encapsulate what the population code “cares” about, (2) despite summarizing across the activity pattern, the RDM is an information-rich signature of the population code [e.g., 96 × (96 − 1)/2 = 4560 entries for 96 stimuli], (3) since RDMs are indexed by the stimuli they can be directly compared, thus obviating the need for a spatial correspondency mapping between the activity patterns in brains and models or in different regions or species. For these reasons, the RDM can serve as a hub that relates representations from a wide variety of sources (Figure 5
). These features suggest that RSA can contribute to a more integrated systems neuroscience, where representations are quantitatively related between regions, individuals, and species, and where computational models form an integral component of data analysis so as to help us understand both content and computation of neuronal population codes.
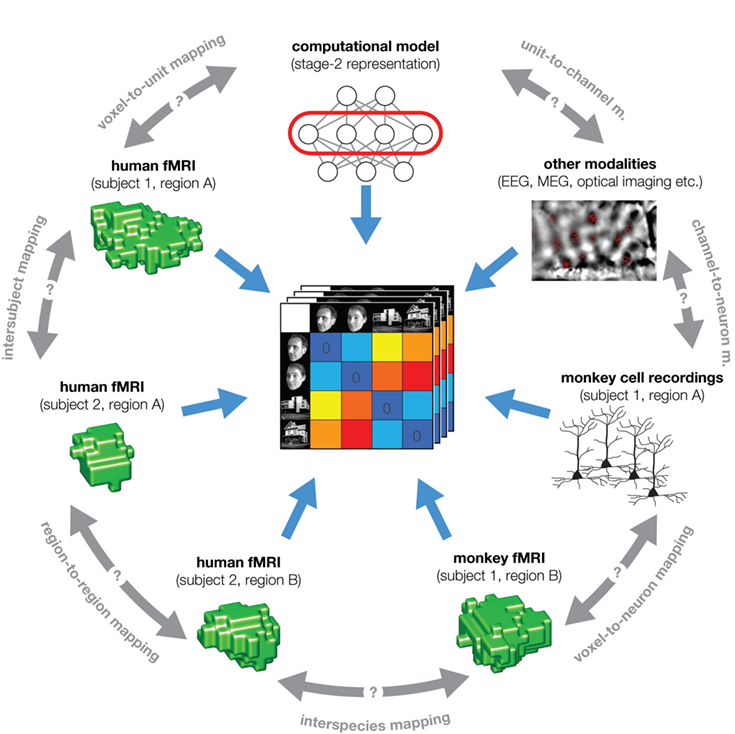
Figure 5. The representational dissimilarity matrix as a hub that relates different representations. A number of representational relationships (gray text along the perimeter) can be established via the representational signature provided by the RDM. In particular, we arbitrarily chose the example of fMRI to illustrate the relationships that can be established within a single modality of brain-activity measurement: subject-to-subject, region-to-region, and human-to-monkey. Note that all these relationships are difficult to establish otherwise (gray double arrows). Dissimilarity matrices can also be used to characterize behavior (not shown), using explicit dissimilarity judgments, confusion frequencies, or choice reaction times. RSA thus promises to contribute to a more quantitative integration of the three major branches of systems neuroscience: behavioral experimentation, brain-activity measurement, and computational modeling.
The author declares that the research was conducted in the absence of any commercial or financial relationships that could be construed as a potential conflict of interest.
I thank Marieke Mur, Roozbeh Kiani, Douglas Ruff, Jerzy Bodurka, Hossein Esteky, Keiji Tanaka, and Peter Bandettini for the continual support and the many insights they contributed to the development of these ideas.
Population code: A spatial or spatiotemporal pattern of brain activity across a population of neurons, which is interpreted to serve the function of representing (“coding for”) something external to the brain. The represented entity can be an object presently perceived through the senses, a remembered or imagined object, or an action, such as one that is currently in progress or a remembered, imagined, or intended action.
Pattern-information analysis: Multivariate analysis technique that aims to reveal the information carried by a population of neurons. A popular variant is pattern-classifier analysis, which attempts to decode the stimulus from the response pattern. This approach typically requires grouping the stimuli into predefined categories.
Representational similarity analysis: An extension of pattern-information analysis, in which each stimulus (or experimentally induced mental state) is treated as a unique entity and the relationships between all pairs of stimulus-evoked activity patterns are jointly analyzed to reveal the nature of the population code and test competing computational or conceptual models.
Representational dissimilarity matrix: A square matrix indexed horizontally and vertically by the experimental stimuli and containing an entry for each stimulus pair, which reflects the dissimilarity of the response patterns evoked by the two stimuli. An RDM can serve as a signature of a population code. It encapsulates which stimulus distinctions are emphasized and which are deemphasized by the representation. Pattern similarity can be characterized by either a similarity or a dissimilarity measure. We prefer dissimilarity measures, because they can be interpreted as distances in a space, where a distance of 0 indicates identical representations.