Feature selectivity of the gamma-band of the local fi eld potential in primate primary visual cortex
1
Max Planck Institute for Biological Cybernetics, Tübingen, Germany
2
Department of Neuroscience, Baylor College of Medicine, Houston, TX, USA
3
Division of Imaging Science and Biomedical Engineering, University of Manchester, Manchester, UK
4
Michael E. DeBakey Veterans Affairs Medical Center, Houston, TX, USA
5
Department for Computational and Applied Mathematics, Rice University, Houston, TX, USA
Extracellular voltage fluctuations (local field potentials, LFPs) reflecting neural mass action are ubiquitous across species and brain regions. Numerous studies have characterized the properties of LFP signals in the cortex to study sensory and motor computations as well as cognitive processes like attention, perception and memory. In addition, its extracranial counterpart – the electroencephalogram – is widely used in clinical applications. However, the link between LFP signals and the underlying activity of local populations of neurons remains largely elusive. Here, we review recent work elucidating the relationship between spiking activity of local neural populations and LFP signals. We focus on oscillations in the gamma-band (30–90 Hz) of the LFP in the primary visual cortex (V1) of the macaque that dominate during visual stimulation. Given that in area V1 much is known about the properties of single neurons and the cortical architecture, it provides an excellent opportunity to study the mechanisms underlying the generation of the LFP.
An extracellular electrode placed in the brain measures the mean extracellular field potential, comprised of the aggregate electrical activity generated by various neural processes in a cell ensemble around the electrode tip (Figure 1
A). For instance, the high frequency range (from 0.6–1 to 3 kHz) of this signal has been estimated to carry a signature of the spiking activity of up to a few thousand cells located as far as 140–300 μm away (e.g. Gray et al., 1995
; Henze et al., 2000
; Logothetis, 2003
, 2008
). It is referred to as multi-unit (MU) activity and can be seen as reflecting the output of a local neural population.
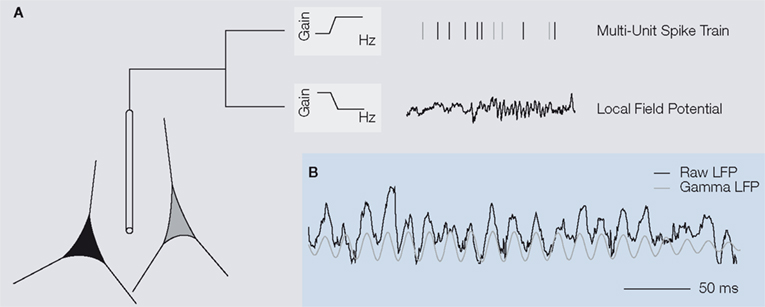
Figure 1. (A) An extracellular electrode placed in the brain measures the mean extracellular field potential, an aggregate signal originating from the population of neurons in the vicinity of the electrode tip. To obtain multi-unit spiking activity, the recorded voltage trace is high-pass filtered and individual action potentials are detected (top). The local field potential (LFP) is comprised of the low frequency components of the extracellular field potential up to 200 Hz (bottom). Its frequency composition varies over time. In the example shown here, prominent oscillations in the frequency band between 30
and 90 Hz – called the gamma-band – are visible during the later part of the trace. (B) In primary visual cortex of awake primates, oscillations in the gamma-band of the local field potential are dominant during visual stimulation, as illustrated
in the example. The raw signal (black) has been filtered in the gamma frequency range to obtain the gamma LFP (grey).
In contrast, low frequency voltage fluctuations (<200 Hz) mirror a different aspect of neural mass action: The so-called local field potentials(LFP) are commonly thought to be related to the input of a neural ensemble and dendritic processing within the network. In line with this reasoning, it is believed to measure primarily synchronized synaptic signals (Mitzdorf, 1985
, 1987
), subthreshold membrane oscillations (Kamondi et al., 1998
) and spike afterpotentials (Buzsaki and Kandel, 1998
; Gustafsson, 1984
). Evidence supporting this hypothesis that the LFP reflects inputs and local processing comes from a study that showed that it is possible to predict the time course of the LFP in primary visual cortex from spikes in LGN but not vice versa (Calabrese et al., under revision
). While the LFP is used to study the neural processes underlying perception (Gail et al., 2004
; Wilke et al., 2006
), memory (Pesaran et al., 2002
) and attention (Fries et al., 2001
, 2008
; Taylor et al., 2005
), the mechanism underlying its generation and its precise spatial resolution is not yet well known.
A more detailed understanding of the relationship of the LFP to the spiking activity of neural populations is essential for many applications: First, oscillations in brain activity as measured by the LFP might reflect a specific mode of neural computation. In this spirit, the extracranial counterpart of the LFP – the electroencephalogram (EEG
) – has been used in research and medical applications for decades (Swartz and Goldensohn, 1998
) and oscillations in the EEG have been used as a marker of diverse cognitive states. Linking these high-level diagnostic markers to distinct modes of neural processing will require an in-depth understanding of the LFP, as a mesoscale signal bridging the gap between EEG and neural activity (Whittingstall and Logothetis, 2008
). Second, the LFP is correlated with the blood-oxygen-level dependent signal (BOLD
) as measured by fMRI (Goense and Logothetis, 2008
; Logothetis et al., 2001
; Nir et al., 2007
). While both, LFP and MU activity, are correlated with BOLD for short stimulation paradigms, they dissociate in the case of prolonged stimulation with the sustained oscillations of the LFP better predicting the time course of the BOLD signal. Thus, understanding which features of neural population activity are measured via the LFP will help to elucidate the source of the BOLD signal (Logothetis, 2008
). In addition, the LFP is comparably easy to obtain and has been used successfully to control motor prosthesis (Mehring et al., 2003
; Andersen et al., 2004
). A better understanding of the mechanisms generating the LFP might allow for the construction of better prosthetic devices.
In different brain areas, the LFP
comes in widely different flavours. In the hippocampus, for instance, strong theta oscillations between 4 and 10 Hz are the most prominent feature. They are believed to be critical for temporal coding of information and synaptic plasticity in these circuits (Buzsaki, 2002
), as well as hippocampal–cortical interactions (Siapas et al., 2005
; Sirota et al., 2008
). In awake primates, sensorimotor regions of the cortex exhibit pronounced oscillations in the beta frequency band between 15 and 30 Hz related to motor preparation and planning (Sanes and Donoghue, 1993
; Scherberger et al., 2005
). Finally, in primary visual cortex of awake primates fast oscillations in the gamma-band between 30 and 90 Hz are dominant during visual stimulation (Figure 1
B, e.g. Berens et al., 2008
; Frien et al., 2000
). In this review, we will focus exclusively on the latter and describe what the feature selectivity of LFP gamma-oscillations in primary visual cortex can teach us about the spatial extent of the network activity they resemble.
In the absence of visual stimulation, the LFP in the primary visual cortex of awake macaques is dominated by slow fluctuations (Figure 2
A), such that the power in low frequencies dominates the frequency spectrum (Figure 2
B; e.g. Berens et al., 2008
; Henrie and Shapley, 2005
; Juergens et al., 1999
; Young et al., 1992
). This frequency dependence of the LFP power spectrum is not due to a frequency dependence of the impedance spectrum of the cortical tissue (Logothetis et al., 2007
), although the morphology of neural dendrites might result in a low-pass filtering effect on neural signals (Pettersen and Einevoll, 2008
; see below). Dominant fast oscillations in the gamma-band (30–90 Hz) emerge during visual stimulation (Figure 2
A) and, accordingly, a pronounced increase of the power in this band can be observed (Figure 2
C). Interestingly, spikes of single neurons occur preferentially at the trough of these oscillations (“phase locking”, Berens et al., 2006
; Ray et al., 2008a
) and the gamma-power is the single most relevant feature for the prediction of spike density functions from the LFP (Rasch et al., 2008
). A similar result has also been obtained in cat area 17, where the coupling between spikes and LFP under visual stimulation as measured by the frequency dependent spike-field coherence is also highest in the gamma-band (Siegel, 2003
). LFP gamma-power thus might originate from processes that are intimately linked to the spiking of local populations of cortical neurons and, as gamma-oscillations occur predominantly during visual stimulation, they possibly reflect ongoing computations in these networks.
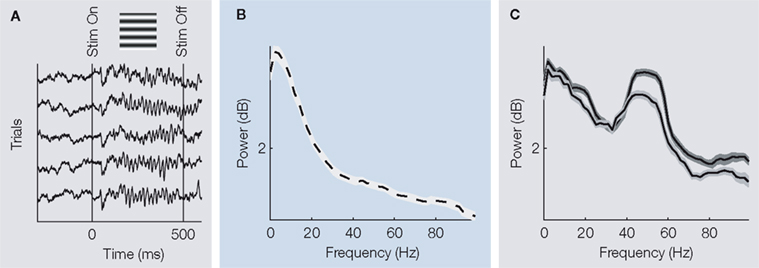
Figure 2. (A) Exemplar raw traces showing the LFP during a typical trial. Before the onset of stimulation, low frequency fluctuations dominate the LFP. During stimulation with an oriented grating, however, strong gamma-oscillations are visible. (B) Typical power spectrum of the LFP during the resting state. Low frequency fluctuations dominate the spectrum, which follows roughly a 1/f decay. (C) Typical power spectra of the LFP during visual stimulation with two gratings of different orientation (differing colours). A pronounced power increase in the gamma-band is observed.
In particular, this increase depends in strength on the orientation of the visual stimulus. All displays in this figure were adapted from (Berens et al., 2008
).
While for spiking activity relatively precise estimates of the volume from which spikes are recorded are available (Gray et al., 1995
; Henze et al., 2000
; Logothetis, 2003
, 2008
), the exact spatial extent of the neural population contributing to the LFP as an aggregate signal is yet unknown and evidence remains somewhat inconclusive. Estimates based on spectral coherence between simultaneously recorded sites (Goense and Logothetis, 2008
; Juergens et al., 1999
) or current-source density analysis (Mitzdorf, 1987
) range from 500 μm up to 3 mm. Recently, Goense and Logothetis (2008)
have used reverse correlation with small circular gratings to determine the spatial summation properties of the LFP signal and found them to be very similar to those of the MU activity. A recent study has tried to predict the LFP time course from the spiking activity of MU activity and has found that taking sites from up to 1 mm away into account can significantly improve the reconstruction accuracy (Calabrese et al., under revision
).
The question of spatial resolution, however, is crucial: Far reaching LFP coherence between sites, in particular in the gamma-band, has been interpreted as a hallmark of synchronization of distant cortical populations (Engel et al., 2001
). To unambiguously attribute these findings to synchronization it is mandatory to have a precise estimate of the extent of the network contributing to the LFP gamma-band. While the complexity of network interactions prevents to study this question with current methodology directly, it can be approached indirectly by studying selectivity of the LFP to features of the visual stimulus and comparing it to the selectivity of MU activity (Berens et al., 2008
).
The feature selectivity of local groups of neurons such as measured by MU activity has been mapped extensively – especially in primary visual cortex – and for many features the spatial organization of MU preferences is well known (e.g. Bartfeld and Grinvald, 1992
; Blasdel, 1992a
,b
; Hubel and Wiesel, 1968
, 1974
; Lund et al., 2003
; Ringach et al., 2002
). One extensively studied feature of neurons in visual cortical areas is their orientation tuning. In primary visual cortex, most MU sites respond with an elevated firing rate to bars or gratings of a certain orientation (Hubel and Wiesel, 1968
; Ringach et al., 2002
) and show a Gaussian-like tuning profile around this preferred orientation. It is natural to ask whether this important characteristic of neurons in V1 is also present in the gamma-band of the LFP recorded in this area. In our study (Berens et al., 2008
), we find that indeed the LFP gamma-power increases in a stimulus specific manner during visual stimulation with an oriented grating (Figure 2
C). Furthermore, its selectivity for stimulus orientation was stronger for the gamma-band in comparison to any other frequency band of the LFP (Figure 3
A, grey shaded region). Nevertheless, even this most strongly tuned LFP band is less selective for orientation than MU activity measured simultaneously at the same site (Figure 3
B; Berens et al., 2008
; Frien et al., 2000
).
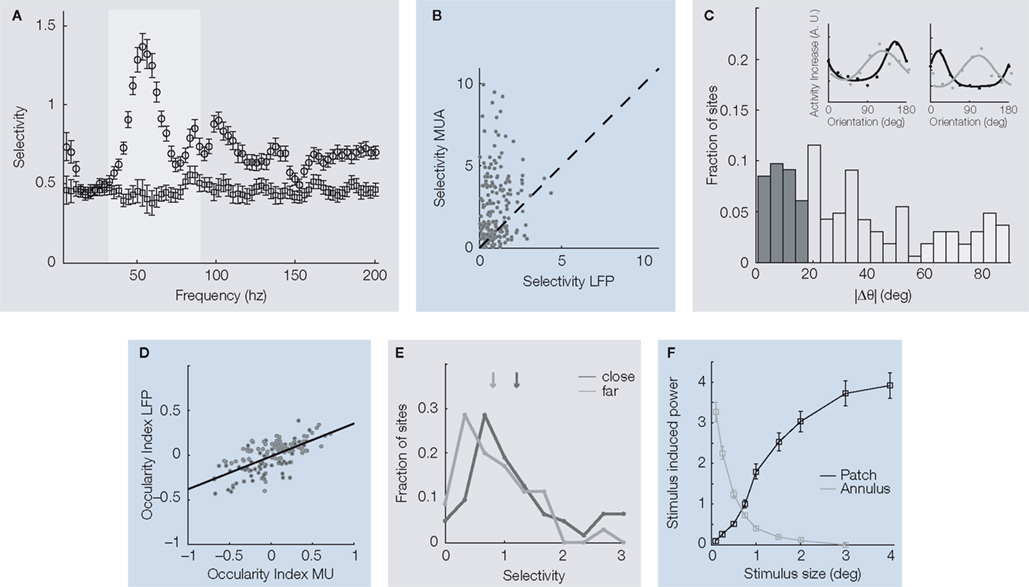
Figure 3. (A) Mean orientation selectivity of the power in a frequency band of the local field potential of a population of recording sites (open circles) and a trial shuffled version for comparison (open squares). The most prominent orientation selectivity is found in the gamma-band (grey shading) around 55 Hz. (B) Comparison of the mean orientation selectivity of the gamma-band of the LFP and MU activity recorded simultaneously from the same electrode. Although the most selective LFP band was chosen, MU selectivity is on average still significantly higher, as indicated by the dark cross. (C). Distribution of differences in preferred orientation for simultaneously recorded LFP gamma-band and MU activity. While a large fraction of sites shows good agreement between the two, in a considerable amount of sites the preferred orientations of the two signals differ by more than 60°. Dark grey (<20° difference) and light grey (>60° difference) indicate sites used for Figure 3
E. The inset shows the orientation tuning functions of two exemplar sites, with LFP (light grey) and MU (dark grey) tuning functions overlaid. In the site shown on the left, both preferred orientations are close to each other while in the site shown on the right they are nearly 90° apart. (D) Ocularity index of MU activity and LFP gamma-band power. The ocularity index measures how strongly the activity at a site is modulated by the eye of stimulation. Its sign indicates which eye is preferred. Ocularity indices of the MU activity are significantly stronger than those of the LFP gamma-band, but they are correlated well. (E) Histogram of orientation selectivity index computed separately for sites with close (dark grey) and far away (light grey) preferred orientations [sites as in (C)]. Arrows indicate the respective medians. On average, sites where the preferred orientation of the LFP gamma-band agrees well with that of the MU have higher orientation selectivity than the others. (F) Average difference in gamma-power (25–100 Hz) between the spectrum during stimulus presentation and baseline (mean ± SEM) as a function of the diameter of the grating (black line) or the grating annulus (grey line) that was used for stimulation. For gratings, the gamma-power increases as a function of stimulus diameter. In the case of annuli, large values on the x-axis indicate that only the surround was stimulated. This alone was not sufficient to elicit pronounced gamma-oscillations. For experimental details regarding this panel, see Gieselmann and Thiele (2008
). Panels (A–E) in this figure were adapted from Berens et al. (2008
) and data for panel (F) was provided by Gieselmann and Thiele (2008
).
To further compare the feature selectivity of the two signals, we also mapped out orientation tuning curves of the average LFP power in the gamma-band and the corresponding MU spiking responses (Figure 3
C, insets). Interestingly, at some sites the preferred orientations of both signals agreed well while at others they did not, and differences in preferred orientation were widely distributed (Figure 3
C). The overall correlation between preferred orientations obtained from the gamma-band of the LFP and the MU activity recorded simultaneously was surprisingly low (∼0.2; Berens et al., 2008
).
Ocular dominance columns
are a second dominant organizational feature of primary visual cortex and typically cover slabs of about 500 μm in diameter (Blasdel, 1992a
; Hubel and Wiesel, 1968
, 1977
). By selectively presenting stimuli to one eye only, we showed that the correlation between the ocular preferences of the MU activity and those of the LFP gamma-power are much better correlated (Figure 3
D, ∼0.6; Berens et al., 2008
).
Why are the preferred orientations of MU activity and LFP gamma-band power only poorly correlated, while their ocular preferences are well correlated? Orientation tuning of spiking activity is organized at a very fine spatial scale in macaque V1, where orientation columns span about 50 μm (Hubel and Wiesel, 1968
, 1974
, 1977
). Ocular dominance columns on the other hand extend over about an order of magnitude more (Blasdel, 1992a
; Hubel and Wiesel, 1968
, 1977
). The fact that the preferred orientations of MU activity and the LFP gamma-band are not well correlated but ocular dominance properties are, suggests that the LFP gamma-band integrates signals over an area much larger than the size of orientation columns in V1. We therefore conjecture that the gamma-band of the LFP reflects signals integrated from an area spanning at least 500–800 μm in diameter.
According to our reasoning, the difference in correlation between the two signals for orientation and ocularity tuning is due to the scale of spatial integration. A critical test of this hypothesis is that the preferred orientation of the LFP should be close to that of the MU activity when the local neighbourhood of the recording location is comparably homogenous in preferred orientations, such as in linear zones, and differing from it in nonhomogenous parts of the orientation map. While our data did not allow us to test this hypothesis directly, we conjectured that if our reasoning was valid, homogenous zones should be characterized by higher LFP orientation selectivity than nonhomogenous zones (Nauhaus et al., 2008
). Indeed, we found that the orientation selectivity of sites at which the preferred orientations of MU activity and LFP gamma-band power were close was higher than the selectivity of sites at which preferred orientations differed significantly (Figure 3
E).
In addition to differences in their orientation tuning, the gamma-band of the LFP and MU activity show different surround suppression
characteristics (Gieselmann and Thiele, 2008
). MU activity was typically maximal when the grating used for stimulation just covered its classical receptive field (CRF), and decreased when it was enlarged further. The gamma-power of the LFP, however, increased with grating size beyond the CRF (Figure 3
F, black line). The maximal oscillatory drive contributing to the LFP power occurred when stimuli covered approximately an area of 1° in diameter. Converting this via the cortical magnification factor to cortical distance, Gieselmann and Thiele concluded that the gamma-band of the LFP integrates sources as far as 0.6–1.2 mm away from the electrode tip. Interestingly, stimulation of the surround alone was not sufficient to evoke gamma-oscillations (Figure 3
F, grey line).
Feature selectivity can, however, also inform hypotheses regarding other aspects of the underlying mechanisms generating the LFP. First, when we analysed how the correlation between the preferred orientations of MU activity and LFP power changed as a function of frequency band, we found that it increased from its initial low values in the gamma-band to saturate over 150 Hz at ∼0.8 (keep in mind, however, that less sites are tuned over all in these bands and mean selectivity is lower than in the gamma-band; Figure 3
A), similar to findings from primary auditory cortex (Kayser et al., 2007
), area MT (Liu and Newsome, 2006
) and somatosensory cortex (Ray et al., 2008b
). The correlation for ocularity tuning remained high also above the gamma-band.
Similarly, in a study using more naturalistic stimuli, such as movies, the high frequency regime at frequencies above 70 Hz carried information about the stimulus which was very similar to MU activity, i.e. the two signals showed high signal correlations (Belitski et al., 2008
). At lower frequencies, like those found to be most tuned to orientation in our study, this correlation was substantially weaker. Similarly, for the prediction of spike times from the LFP features in the high gamma-band above 60 Hz are most useful (Rasch et al., 2008
). Together, these findings point towards the hypothesis that the spatial extent of neural processes contributing to the LFP may be frequency dependent (see below).
Second, it is yet unclear how different cell types contribute to the gamma-band power. The latter is increased by enhancing the contrast of the stimulus (Henrie and Shapley, 2005
). In particular, while many neurons show pronounced saturation in their firing rate at high contrasts, the gamma-power can still increase beyond this saturation point. In addition, as mentioned above, enlarged stimulus size can enhance gamma-power even beyond a point where MU activity is starting to be inhibited (Figure 3
F; Gieselmann and Thiele, 2008
). Enlarging the stimulus beyond the CRF of the spiking responses or enhancing stimulus contrast activates interneuron networks more strongly (Angelucci et al., 2002
), leading to the observed dissociations between spiking and LFP activity. These findings therefore hint towards an important role of inhibitory interneurons (see below).
The LFP is commonly thought to originate from a weighted average over potential changes in the vicinity of the electrode tip, generated by current sinks and sources in extracellular space (as reviewed by Goense and Logothetis, 2008
; Logothetis, 2003
, 2008
). These are generated, for instance, when synchronous excitatory synaptic input activates the dendrites of a neuron, leading to a current sink at the dendrite and a source at the soma (Figure 4
A; Mitzdorf, 1985
). The resulting dipole
contributes to the measured LFP depending on the arrangement of the generating cell with respect to the local population. For example, pyramidal cells
have large dendritic arbours facing in one direction opposing their somata and their dendrites are neatly aligned with each other (a so-called “open field arrangement” (Johnston and Wu, 1995
; Mitzdorf, 1985
). Therefore, dendritic processes on pyramidal cells in the cortex are thought to contribute strongly to the LFP, as potential differences from the local network do not cancel each other due to their geometrical arrangement (Figure 4
B). Dipoles generated by the spiking activity itself are much faster, however, and therefore do not directly add to the LFP power. While it was originally thought that excitatory postsynaptic potentials form the most important source of LFP generating dipoles (Mitzdorf, 1985
, 1987
), more recently also other sources such as inhibitory synaptic input (Hasenstaub et al., 2005
), subthreshold membrane oscillations (Kamondi et al., 1998
) and afterpotentials of somatodendritic action potentials (Buzsaki, 2002
) have been found to contribute significantly to the LFP.
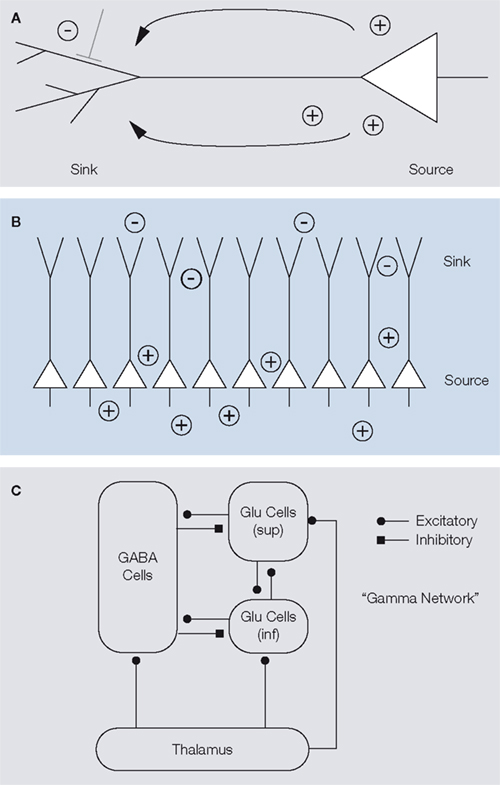
Figure 4. (A) Illustration of a pyramidal cell, where the dendritic tree is shown schematically on the left, the cell body and axon on the right. A synaptic potential creates a current sink on the dendritic tree and a current-source at the soma. Adapted from Johnston and Wu (1995
). (B) Pyramidal cells are aligned in a very stereotype fashion, with large dendritic arbours facing one direction and somata facing to the other. In this so-called open field arrangement, synchronized synaptic input creates strong dipoles, since currents flow from individual cells do not cancel each other.
(C) Illustration of the excitatory-inhibitory cortical network involved in the generation of gamma-oscillations. Thalamic inputs activate populations of infragranular (inf) and supragranular and granular (sup) glutamergic cells, as well as GABAergic cells. These three groups interact with each other. Inhibitory synapses are indicated by a square (symbol), excitatory synapses by a circle (symbol). Adapted from Logothetis (2008)
.
The extracellular space acts like a volume conductor, which can, in principle, carry electrical signals over large distances and whose resistance depends on the geometry and layout of the neurons (Johnston and Wu, 1995
; Logothetis et al., 2007
). The impedance of the cortical tissue has been found to be isotropic and independent of frequency (Logothetis et al., 2007
; Ranck Jr., 1963
). While recent modelling work suggests that even in purely resistive extracellular medium frequency dependent attenuation can be caused by the dendritic morphology of the neurons (Pettersen and Einevoll, 2008
), the specific shape of the LFP spectrum as shown in Figure 2
B likely also reflects underlying neural processes.
Oscillators contributing to the LFP at different frequencies are possibly generated by processes on varying scale and strength (Buzsaki and Draguhn, 2004
; Logothetis et al., 2007
). Low frequency oscillations, on the one hand, are thought to be formed by global neuromodulatory inputs (Steriade, 2006
) giving rise to strong slow oscillators. Gamma-rhythms, on the other hand, most likely originate locally within cortical microcircuits consisting of pyramidal cells and interneurons
(Fries et al., 2007
; Logothetis, 2008
). Experimentally, this has been shown to be the source of the gamma-oscillations in the hippocampus of rats (Csicsvari et al., 2003
) where pyramidal cells and interneurons form networks with a distinct spatial layout much like in cortical tissue. Similarly, we postulate that such circuits in cortex get activated by thalamic input, as surround stimulation alone was not sufficient to evoke gamma-oscillations (Gieselmann and Thiele, 2008
). Recurrent processing loops between pyramidal neurons of layer 4 and 2/3 and interneurons then generate the pronounced gamma-oscillations observed during visual stimulation (Figure 4
C). Thus, while pyramidal neurons may be the strongest mediator of dipoles contributing to the LFP due to their size and geometry, interneurons play an important role in generating the dipoles underlying gamma-oscillations: They act as rhythm generators via rhythmic inhibition of pyramidal neurons and synchronized inhibitory synaptic potentials contribute significantly to the membrane oscillations on pyramidal neurons (Bartos et al., 2007
; Fries et al., 2007
; Hasenstaub et al., 2005
; Whittington et al., 1995
). This is in good agreement with the idea that enhanced gamma activity during high contrast or surround stimulation reflects increased interneuron drive (see above). For a more detailed discussion of interneuron networks and their role for cortical gamma-oscillations, see the excellent reviews by Bartos et al. (2007)
, Fries et al. (2008) and McBain and Fisahn (2001)
. Mazzoni et al. (2008
) used a model network consisting of sparsely connected pyramidal and interneurons and simulated the generation of the LFP from excitatory and inhibitory synaptic currents. Interestingly, this simple model reproduced quantitatively accurate the dependence of LFP gamma-power on stimulus contrast as well as the dependence of information content in different LFP bands measured under naturalistic stimulation. How exactly these active network processes on different scales interact with passive low-pass filtering properties due to dendritic morphology (Pettersen and Einevoll, 2008
) to form the signal measured as LFP is yet to be determined.
If the gamma-band of the LFP originates in local cortical circuits as also revealed by reverse correlation with very localized stimuli (Goense and Logothetis, 2008
), why is the spatial resolution apparently so much poorer compared to MU activity? We postulate that this results from the interplay of two factors: First, strong oscillations – especially like those present under visual stimulation – can spread in the extracellular medium for considerable distances, as this acts as an isotropic frequency independent resistor (Logothetis et al., 2007
). This results in spatial blurring of the LFP signal. Note, however, that this effect becomes only noticeable when large stimuli that excite extended networks of neurons are used (see Discussion of Berens et al., 2008
). Second, the spatial extent of microcircuits oscillating in phase and thus the size of the oscillating dipole is determined by the spread of thalamic axon fields, the size of the dendritic arbours of cortical neurons and intracortical horizontal connections (Angelucci et al., 2002
; Lund et al., 2003
). This will lead to contributions to the LFP signal by tissue at considerable distance from the electrode tip, as for instance thalamic axons in upper layer 4 fan out to cover an area of up to 1.2 mm. In addition, the LFP also integrates subthreshold oscillations, which do not lead to spiking activity. In the cat visual cortex, these synaptic response fields have been shown to extent significantly beyond the region in which spiking activity was evoked (Bringuier et al., 1999
).
While the above arguments provide a strong indication that the spatial resolution of the LFP gamma-band parallel to the cortical surface is on the scale of 600–1000 μm, specificity across different layers might be much higher. Recent evidence from rodent somatosensory and prefrontal cortex, however, suggests that this is not the case (Sirota et al., 2008
). Using multiple silicon probes, Sirota et al. (2008)
showed that gamma oscillators typically engage cortical circuits spanning several hundred micrometers. The spatial resolution of the LFP is not only determined by the electric properties of the neural tissue and the spatial extent of the biophysical processes contributing to the LFP, but is also affected by properties of the recording apparatus such as electrode type, material and impedance as well as the exposed area at the electrode tip or the position of the reference electrode.
The specific processes contributing to the different parts of the gamma-band spectrum, however, are yet unknown. Our study (Berens et al., 2008
) shows that the feature selectivity of MU activity and the gamma-band of the LFP can differ substantially, as in the case of orientation tuning. For other features, such as ocular dominance, both signal preferences are well correlated. Since these two features are organized on spatial scales differing by approximately one order of magnitude, the spatial resolution of the LFP can likely explain this discrepancy. In good agreement with other studies (Gieselmann and Thiele, 2008
), we estimate the spatial resolution of the gamma-band of the LFP parallel to the cortical surface to be ∼600–1000 μm. Gamma-oscillations in the LFP most likely arise in cortical networks of pyramidal and interneurons, when activated by thalamic stimulation, and are mediated by synchronized synaptic potentials impinging on pyramidal neurons. Results on the feature selectivity of the LFP (Gieselmann and Thiele, 2008
; Henrie and Shapley, 2005
) as well as direct measurement (Hasenstaub et al., 2005
) indicate an important contribution from interneurons as well.
To precisely determine the aspects of neural mass action reflected in the gamma-band of the LFP will require an increased effort on many levels: Important insight into the relevant subpopulation of neurons and receptors can be achieved through the adaptation of recently developed genetic tools that allow the selective manipulation of specific cell types and channels (Aronoff and Petersen, 2008
). Further, detailed reconstruction of neural circuits (Briggman and Denk, 2006
) in combination with biophysical modelling (Linden et al., 2008
; Mazzoni et al., 2008
; Pettersen and Einevoll, 2008
) might lead to a better understanding of which features of the anatomical layout are important for the generation and localization of LFP gamma-band oscillations. Last, monitoring the activity on the dendrites and somata of many neurons in parallel using novel two-photon techniques might allow direct measurements of the voltage fluctuations recorded as the LFP (Reddy et al., 2008
).
The authors declare that the research was conducted in the absence of any commercial or financial relationships that could be construed as a potential conflict of interest.
We thank Axel Oeltermann and Christoph Kayser for discussions and Stephanie Funk, R. James Cotton and Fabian Sinz for comments on the manuscript. We are grateful to Alex Thiele and Alwin Gieselmann for kindly providing the data for Figure 3
F. This work was supported by grants from the National Eye Institute (R01 EY018847) and the Department of Defense, USA (W81XWH-08-2-0147), an Arnold and Mabel Beckman Foundation Young Investigator Award and a VA Merit Award to Andreas S. Tolias as well as by the Max Planck Society. Philipp Berens and Alexander S. Ecker were in addition supported by the German Ministry of Education, Science, Research and Technology through the Bernstein award to Matthias Bethge (BMBF; FKZ:01GQ0601).
BOLD: The BOLD (blood oxygenation level dependent) contrast mechanism is most commonly used in functional MRI studies. It is based on the fact that the magnetic susceptibility of hemoglobin depends on its oxygenation state. Neural activity, in turn, changes locally the relative concentration of oxygenated and deoxygenated blood.
LFP frequency bands: The classification of the LFP into distinct frequency bands, known as delta (approx. 0-4 Hz), theta (4-10), alpha (8-12 Hz), beta (15-30 Hz) and gamma (30-90 Hz) has been adopted from the EEG literature. It is based on the strong correlation of each band with a distinct behavioral state.
Ocular dominance column: Primary visual cortex is the first area in the visual stream where information coming from the two eyes is combined. Nevertheless, neurons respond often more vigorously to stimulation of one eye over the other. These patterns of ocular dominance are organized in slabs spanning ∼500 μm and thus form an ocular dominance map.
Surround suppression: When a stimulus of optimal orientation is extended beyond the classical receptive field of typical V1 neurons, their firing rates start decreasing. The suppressive surround field is generally several times larger than the excitatory center. Local cortical inhibitory interneurons are believed to play an important role in surround suppression.
Dipole: A current dipole is generated when a current sink and a current source are separated by a distance. A distribution of small sinks and sources – as caused by synchronized synaptic potentials at the membrane of the dendrite of a pyramidal neuron – can be approximated by a larger dipole. When the resulting dipoles are well aligned, they can be measured at considerable distance.
Pyramidal cell: These primary projection neurons make up ∼80% of all cortical neurons. Their axon branches profusely and forms excitatory glutamatergic synapses. Inhibitory input impinges on the soma and the axon; excitatory input arrives at the dendrites. A basal dendritic tree branches out from the base of the soma, while a single apical dendrite can extend upwards from the cell body for hundreds of micrometers.
Interneuron: Interneurons are local circuit neurons with short ranging projections. They make up ∼20% of cortical neurons. Most of them are inhibitory with GABA as transmitter and have dendrites without spines. Basket cells are a main class of interneurons, preferably targeting the soma and proximal dendrites of their pyramidal targets, possibly acting as gain-control for the integrated dendritic information.
Berens, P., Ecker, A. S., Hoenselaar, A., Keliris, G., Siapas, A. G., Logothetis, N. K., and Tolias, A. S. (2006). Spikes are phase locked to the gamma-band of the local field potential oscillations in the primary visual cortex of the macaque. In Areadne – Research in Encoding and Decoding of Neural Ensembles, J. S. Pezaris and N. Hatsopoulos, eds (Santorini, Greece), p 46. http://www.areadne.org/2006/pezaris-hatsopoulos- 2006-areadne.pdf.
Linden H, Pettersen K, and Einevoll, G. T. (2008). Frequency scaling in local field potentials: A neuron population forward modelling study. Frontiers in Neuroinformatics [Conference Abstracts: Neuroinformatics 2008]. http://www.frontiersin.org/conferences/individual_abstract_ listing.php?conferid=2&pap=387&ind_ abs=1&q=2