Intrinsic-signal optical imaging reveals crypticocular dominance columns in primary visual cortex of New World owl monkeys
- Department of Psychology, Vanderbilt University, Nashville TN, USA
A significant concept in neuroscience is that sensory areas of the neocortex have evolved the remarkable ability to represent a number of stimulus features within the confines of a global map of the sensory periphery. Modularity, the term often used to describe the inhomogeneous nature of the neocortex, is without a doubt an important organizational principle of early sensory areas, such as the primary visual cortex (V1). Ocular dominance columns, one type of module in V1, are found in many primate species as well as in carnivores. Yet, their variable presence in some New World monkey species and complete absence in other species has been enigmatic. Here, we demonstrate that optical imaging reveals the presence of ocular dominance columns in the superficial layers of V1 of owl monkeys (Aotus trivirgatus), even though the geniculate inputs related to each eye are highly overlapping in layer 4. The ocular dominance columns in owl monkeys revealed by optical imaging are circular in appearance. The distance between left eye centers and right eye centers is approximately 650 μm. We find no relationship between ocular dominance centers and other modular organizational features such as orientation pinwheels or the centers of the cytochrome oxidase blobs. These results are significant because they suggest that functional columns may exist in the absence of obvious differences in the distributions of activating inputs and ocular dominance columns may be more widely distributed across mammalian taxa than commonly suggested.
Introduction
A common premise in neuroscience is that the neocortex is sometimes or even typically modularly organized (Kaas, 1990 ; Krubitzer, 1995 ; Mountcastle, 1997 ; Purves et al., 1992 ). While definitions of what constitutes a cortical module differ across investigators (Manger et al., 1998 ), one concept is that groups of columns of cortical cells of differing functional properties alternate in a mosaic of patches or bands within a cortical area. The differences in functional properties of these groups of cells reflect the differences in the types of activating inputs. Hence, modularity may be functionally defined, or defined solely on the differing responsiveness of adjacent regions of cortex. For instance, there is evidence that at least the hand representation in primary somatosensory cortex (area 3b) of monkeys is subdivided into alternating clusters of cells responsive to the activation of either slowly or rapidly adapting peripheral nerve afferents (Chen et al., 2001 ; Friedman et al., 2004 ; Sur et al., 1981 ). Other types of modular segregation have been reported, but possibly most studied is the segregation of neurons activated or dominated by stimulation from either the ipisilateral eye or the contralateral eye in the primary visual cortex (the striate cortex, V1 or area 17). In cats (Wiesel and Hubel, 1963 ) and monkeys (Hubel and Wiesel, 1968 ) ocular dominance (OD) columns or modules were first recognized in microelectrode recording experiments, where it was first noticed that neurons primarily activated by one eye or the other were grouped near one another. Experiments utilizing glucose metabolism first revealed the elegant bands and patches of ocular dominance in macaque monkeys (Kennedy et al., 1976 ) and squirrel monkeys (Hendrickson and Wilson, 1979 ).
Another conceptualization of the cortical module relies upon its visualization through anatomical means, such as neuroanatomical tract tracing or histological preparations of the neocortex. The anatomical basis for functionally defined ocular dominance columns was soon revealed by methods that identified arrangements of inputs to visual cortex from the layers of the lateral geniculate nucleus that receive projections from either the ipisilateral or contralateral eye (Anderson et al., 1988 ; Hubel and Wiesel, 1969 ; Shatz et al., 1977 ). In some mammals, inputs related to the contralateral eye were segregated in layer 4 from those related to the ipisilateral eye. The pattern resulting from this segregation, when viewed from the surface of the brain, appeared as merging and diverging sets of bands of cortex, alternating in eye dominance from one eye to the next. In parts of primary visual cortex devoted to peripheral vision where the relation of contralateral inputs increased, the band-like patters changed to patches of neurons of ipisilateral dominance in surrounds of contralateral dominance.
Surprisingly, not all investigated mammals had bands of segregated geniculate inputs in striate cortex. They were found in the first investigated taxa, the cats and macaque monkeys, and later in ferrets, humans, chimps, and a number of monkey species, but not in lagomorphs, tree shrews, and some of the New World monkeys (Florence and Kaas, 1992 ; Krubitzer and Hunt, 2007 ). In adult marmosets, overlapping distributions of inputs from the two eyes were reported (DeBruyn and Casagrande, 1981 ; Spatz, 1979 ), but the two distributions are partially segregated early in development (Spatz, 1989 ). This segregation is preserved in marmosets reared with monocular deprivation (DeBruyn and Casagrande, 1981 ; Fonta et al., 2000 ; Silveira et al., 1996 ). In addition, some mature marmosets have patent OD columns (Chappert-Piquemal et al., 2001 ), and OD columns have been revealed in marmosets using optical imaging (Roe et al., 2005 ). Squirrel monkeys differed in another way in that some individuals demonstrated a complete overlap of inputs while others demonstrated various degrees of segregation in patches of various sizes (Adams and Horton, 2003 ).
Area 17 of owl monkeys has overlapping inputs from the geniculate layers with ipislateral and contralateral retinal inputs (Diamond et al., 1985 ; Kaas et al., 1976 ). There was no evidence for an uneven distribution of inputs related to the ipisilateral and contralateral eyes, except for one owl monkey described by Rowe et al. (1978) , where cortical inputs from the magnocellular layers were patchy in appearance in the cortex of the upper bank of the calcarine sulcus. This cortex represents peripheral vision of the lower visual quadrant (Allman and Kaas, 1974 ). Thus, there is no known anatomical substrate for ocular dominance columns in owl monkeys, with the possible exception of cortex representing peripheral vision of the magnocellular pathway of one owl monkey. However, there have not been any attempts to determine if functional ocular dominance columns exist in owl monkeys. Possibly, geniculate inputs related to the ipisilateral and contralateral eyes are rather evenly distributed in layer 4 of area 17, while competitive and inhibitory interactions result in groups of neurons that are more responsive to the ipisilateral or contralateral eye. This type of ocular dominance could be expressed more strongly in layers superficial to layer 4 without direct geniculate inputs. Indeed, in macaque monkeys and squirrel monkeys, ocular dominance columns have been reported to be present in layers superficial to layer 4 (Hendrickson and Wilson, 1979 ; Tootell et al., 1988 ). Here, we used optical imaging of the global pattern of evoked activation of V1 of owl monkeys by stimulating one eye and then the other eye to demonstrate that these monkeys do indeed have ocular dominance columns. They form a mosaic of alternating patches, rather than bands. These results indicate that functional columns may exist even when there are no obvious differences in the distribution of activating (anatomical) inputs, and that ocular dominance columns may be more widely distributed across mammalian taxa than commonly suggested.
Materials and Methods
Animal Preparation
The six owl monkeys (Aotus trivirgatus) used in this study were handled according to approved protocols from the Vanderbilt Animal Care and Use Committee which conformed to guidelines set out by the National Institutes of Health. Animals were initially given i.m. injections of ketamine and atropine (10 mg/kg each) and were intubated and artificially ventilated with 2% isoflurane in oxygen. Anesthetic depth was continuously monitored by EEG; two silver-wire electrodes were placed adjacent to the dura over each frontal lobe. End-tidal CO2, heart rate, body temperature and blood oxygen were also monitored continuously. Eyes were dilated with atropine sulfate and were fitted with contact lenses of appropriate curvature (Danker Laboratories Inc, Sarasota, FL) to focus on a computer screen, placed 24.5 cm from the animals’ eyes. A craniotomy and durotomy was performed to expose visual areas V1 and V2 (see Figure 1 ). Agar was placed over the exposed surface of the cortex and the cortex was fitted with a clear glass coverslip to stabilize the brain.
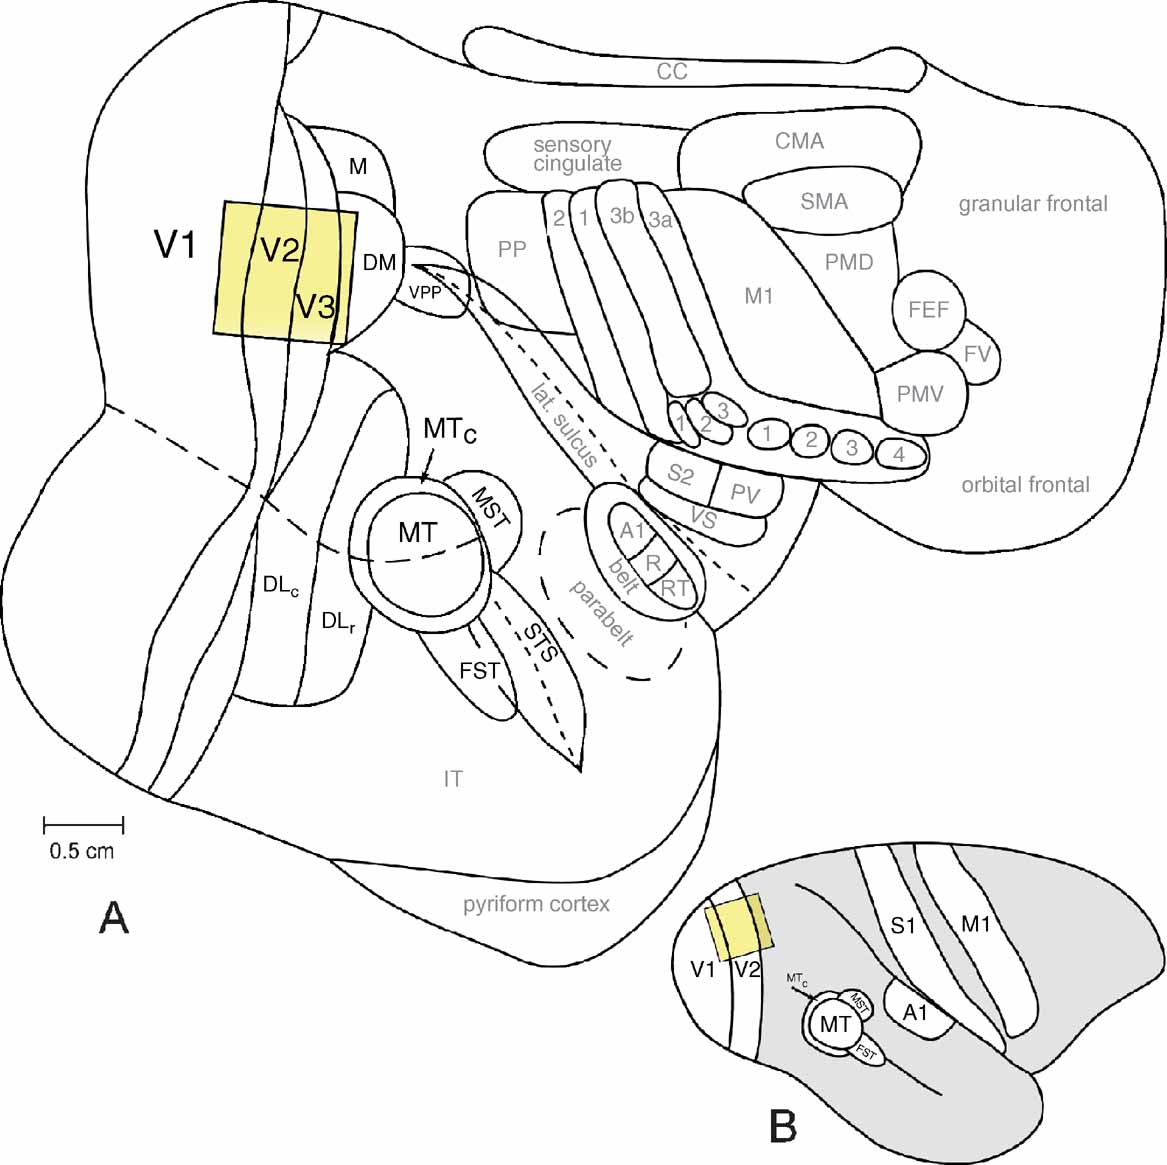
Figure 1. The owl monkey neocortex. The location and approximate size of a typical camera frame includes areas V1, V2, and V3. A typical camera frame is shown with respect to other cortical areas of the owl monkey (A. trivirgatus) on a flattened view of the entire neocortex (A) and on a lateral view of the intact owl monkey brain (B). The scale bar in A is 0.5 cm.
Visual Stimuli
Stimuli were created using custom-made computer programs using a VSG-board (Cambridge Research Systems) with Matlab and presented on a CRT monitor (Sony Trinitron GDM F500R). Screen extent spanned about 90 × 70 degrees of visual field. In each experiment, electromechanical shutters were placed in front of the eyes to control monocular stimulation (Landisman and Ts’o, 2002 ; Roe and Ts’o, 1995 ). Stimuli employed were full screen drifting, achromatic gratings with a mean luminance of 43 cd/m2 and 100% contrast. During interstimulus interval and during the blank condition, eye-shutters were closed. Gratings drifted with 0.5 c/deg at 2 Hz and were of different orientations (0, 45, 90, and 135 degrees) to reveal orientation maps. Orientations were presented in a randomly interleaved order. Each shutter (either left eye or right eye) was opened for stimulus presentation to either eye. Peak luminance of the black-white grating was approximately 87 cd/m2.
Optical Imaging
In each case the brain was stabilized with agar and images were obtained through a glass coverslip. Images of reflectance change (intrinsic hemodynamic signals) corresponding to local cortical activity were acquired using Imager 3001 (Optical Imaging Inc., Germantown, NY) with 630 nm illumination (Roe and Ts’o, 1995 ; Ramsden et al., 2001 ). Signal to noise ratio was enhanced by trial averaging (10–50 trials per stimulus condition) and by synchronization of acquisition with heart rate and respiration. Each stimulus was presented for 3.5 s, during which 16–20 consecutive image frames were taken (4 Hz frame rate). Inter-stimulus interval for all stimuli was 8 s. Each frame contained 504 × 504 pixels (representing 8 × 8 mm cortex area). Stimuli were presented in blocks of randomly interleaved conditions. Stimulus onset and shutter-opening for the respective eye occurred after the first two frames of imaging (0.5 s).
Image Analysis and Quantification
All results were initially first-frame subtracted using the first two frames in each trial. From these images, we generated two types of maps: single condition maps, and subtraction maps. Single condition maps were generated by summing all orientations for each eye (LE and RE maps), whereas ocular dominance maps (subtraction maps) were generated by subtracting RE conditions from LE conditions. We generated subtraction maps for orientation preference (0–90 deg, 45–135 deg). Polar angle maps for orientation preference were generated with custom-written software in Matlab. Maps were low-pass filtered with a Gaussian kernel of 3 or 7 pixels, hi-pass filtered with a Gaussian kernel of 80 or 120 pixels (1.27 or 1.9 mm) and clipped at 1, 1.5, 2 or 3 SD from the mean.
Ocular Dominance Column Size and Spacing
In order to get an estimate of the sizes of LE and RE columns, subtraction maps were low- and high-pass filtered at Gaussian kernels of 15 and 80 pixels. The top and bottom 25% of gray-level value pixels were selected using Photoshop (Adobe, Inc.). Hence, 50% of the area of V1 was assigned to the LE and the RE columns, whereas the remaining 50% of the area of V1 was not assigned to either LE or the RE columns. Columns due to vessel artifact or columns unlike those present in LE or RE maps (regions consisting of two or three merged columns) were excluded from measurements. The areas of columns present in the resulting images were measured with ImageJ (v 1.33u W. Rasband, NIH, Bethesda MD). As an additional method to assess the sizes of LE and RE columns, areas of activation present in single condition maps (LE and RE maps) were outlined by visual inspection and the areas of these regions were calculated in ImageJ. Areas measured by eye in single condition maps (LE and RE maps) closely corresponded to those measured independently as the top and bottom 25% of pixels gray-level values. In order to determine the average spacing between LE and RE column centers, the area of V1 from which the number of LE and RE columns was counted was divided by the number of LE and RE columns found within that area. The square root of the resulting value (the square root of the average area per column) was used as an estimate of the average center to center spacing for OD columns. The center to center spacing determined in this manner closely approximated that measured by hand from LE or RE maps and from OD maps. Angle maps (orientation preference maps) were generated within Matlab with custom-written software, from 4 single condition orientation preference maps. The centers of orientation pinwheels were manually chosen by visual inspection and assigned either a clockwise rotation or a counterclockwise rotation.
Histology and Alignment With Optical Images
The animals were given a lethal dose of sodium pentobarbitol (50 mg/kg or more) and, when are reflexive, were perfused transcardially with phosphate buffered saline (PBS, pH 7.4), followed by 2% paraformaldehyde in PBS. After perfusion, the brain was removed and prepared for processing. The cortex was carefully removed from the underlying white matter, manually flattened (Krubitzer and Kaas, 1990 ), held between two glass plates and stored overnight in 30% sucrose in PBS. The cortex was cut on a freezing microtome in sections parallel to the surface at a thickness of 100 um (top three sections) and 50 mm (remaining sections). Sections were processed for cytochrome oxidase (CO) (Wong-Riley, 1979 ) or myelin (Gallyas, 1979 ) to reveal architectonic borders and features. Photographs of the histological material were taken with a digital camera (Nikon, DXM1200F) attached to a Nikon Eclipse E800 microscope. Images of the tissue were aligned using the top several sections containing features of the surface vasculature with images of the cortex taken in vivo under green illumination using the imaging camera. Adobe Photoshop was used to align the histological sections with the optical imaging camera frames. In some instances “stretching” was required in addition to scaling and rotating images to account for minor irregularities due to flattening the cortex and mounting the CO-processed tissue on slides. In these instances, we show both CO-processed sections demonstrating the surface vasculature and a reference camera frame taken under green illumination to demonstrate alignment precision. Architectonic borders apparent on sections processed for CO or myelin were transferred to the camera frames of interest. Several CO-processed slides were photographed, and using Photoshop the images were contrast enhanced, leveled, high pass filtered and blurred. In some instances blood vessels were manually deleted for clarity.
Results
Using intrinsic-signal optical imaging, we have examined the functional organization of the striate cortex in six owl monkeys (A. trivirgatus). Ocular dominance columns were unequivocally present in V1 in every case examined in our laboratory (Figure 4 ). We found no evidence suggesting the presence of ocular dominance columns in regions other than V1, such as the second visual area (V2), or the third visual area (V3), though these areas were simultaneously imaged (Figure 1 ). In the following sections we describe the shape, size, and spacing of ocular dominance columns in owl monkeys and the lack of any spatial relationship between ocular dominance column centers and other modular organizational features in V1 of owl monkeys.
Ocular Dominance Column Shape, Appearance, and Size
Examples of unfiltered and unclipped single-condition maps of left eye activation (LE) and right eye activation (RE) are shown in Figure 2 . From inspection of LE and RE single condition maps, it is apparent that ocular dominance columns in owl monkeys are more patch-like or circular than the stripe-like ocular dominance columns seen in other monkeys (e.g., macaques). This is apparent in Figure 2 , for example, where circular LE and RE columns are clearly evident. Panels C and D of Figure 2 demonstrate the circular appearance of the ocular dominance columns in owl monkeys, where individual LE and RE columns are indicated in red and blue. It is also apparent that LE columns are distinct from RE columns (see 2 E). There are no ocular dominance columns in visual cortical areas other than V1.
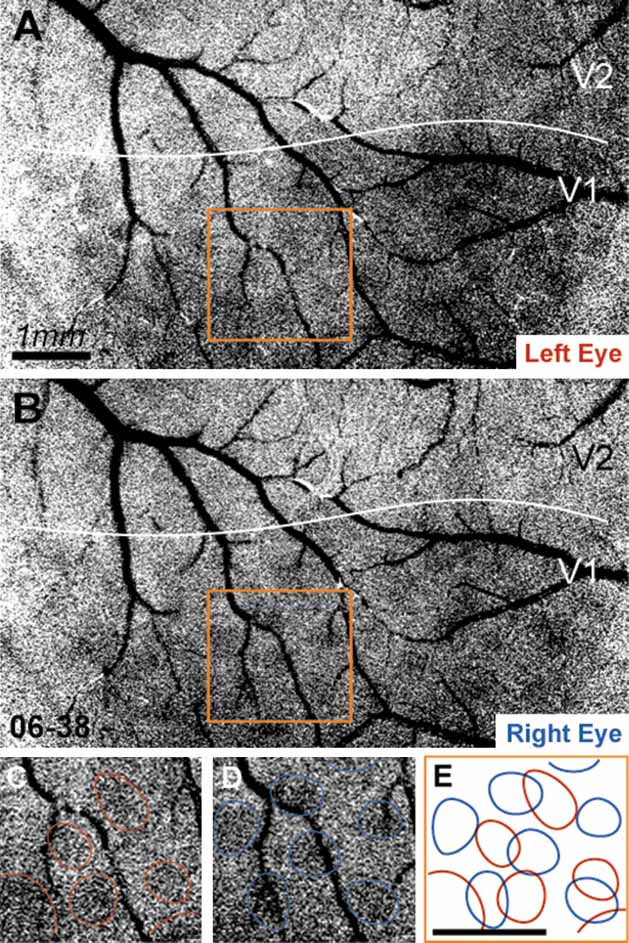
Figure 2. Left eye and right eye maps. Panels A and B show raw unprocessed data resulting from left eye stimulation and right eye stimulation, respectively, from case 06–38. Each map is the sum of four orientated gratings (0, 45, 90, and 135 degrees) presented to either the left eye (A) or the right eye (B). Panels C and D show the region indicated in A and B, respectively, with LE and RE columns indicated in red and blue. In Panel E, the LE and RE columns indicated in C and D are shown in relation to one another. Scale bar is 1 mm.
An example of the relationship between the V1–V2 border, defined by ocular dominance columns, is shown in relation to the V1–V2 border as it appears in a section stained for cytochrome oxidase and in a map of orientation preference in Figure 3 . It is apparent that the V1–V2 border as defined by each of these methods is essentially the same. It is also apparent that ocular dominance is only a feature of area V1; ocular dominance columns are not present in V2 or V3.
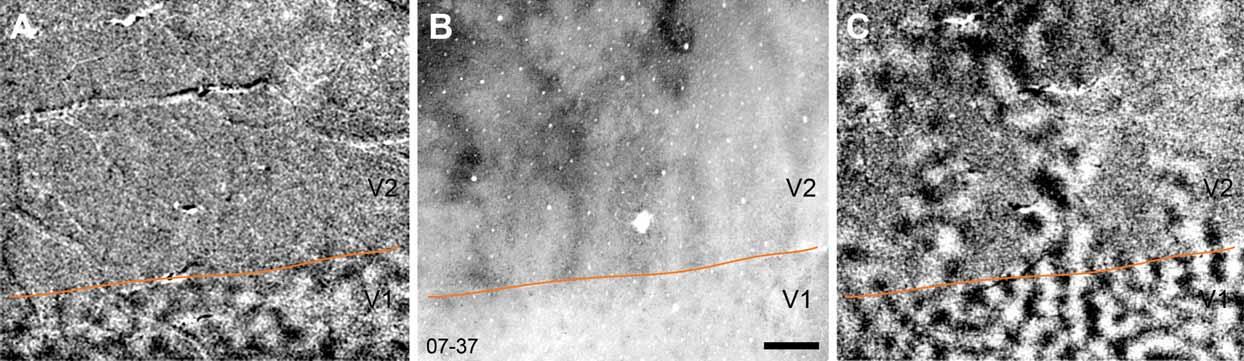
Figure 3. The V1-V2 border evident in ocular dominance maps, cytochrome oxidase stained sections and in orientation preference maps. In A, an ocular dominance map is shown for case 07–37. No ocular dominance columns are present beyond the V1–V2 border, which is evident in a section stained for cytochrome oxidase (B) and in a map of orientation preference (C). Scale bar is 1 mm.
In the six cases (seven hemispheres), we examined in this study (Figure 4 ), across the extent of visual cortex imaged, ocular dominance columns appear fairly uniform in size and shape. Casual inspection and measurement of LE and RE columns indicate that they are about 300–400 μm in diameter (see scale bar in Figure 4 A or 2 A). To measure these columns quantitatively, ocular dominance maps (LE–RE) were filtered, clipped, and thresholded; the sizes of LE and RE columns were measured for each of the seven hemispheres shown in Figure 4 (see Materials and Methods for details). As shown in Table 1 , average areas for the ocular dominance columns in each of the seven hemispheres range from 0.09 to 0.14 mm2 (SD = 0.03 mm2). The diameters of ocular dominance columns calculated from these measured areas range from 299 to 422 μm (SD = 44.46 μm) (see Table 1 ). Although these measurements may vary with the specific filtering and thresholding parameters, they provide an estimate of the range and variability of column sizes, and one which is consistent with qualitative inspection. However, it is important to note that ocular dominance columns were defined as the top and bottom 25% of levels of activation for each eye (top and bottom 25% of pixels gray-level values). Thus, only 50% of the cortical surface was assigned to right and left eye OD territories. This means that the strength of OD signal for each eye varied from the center of one OD column to the next. A mathematical estimate of the average distance between ocular dominance column centers measured from all seven examples, as shown in Figure 4 , is 650 μm and is within the range of values measured from casual inspection. Thus, if all cortex is assigned to right and left eye columns, these columns would be about 650 μm in diameter.
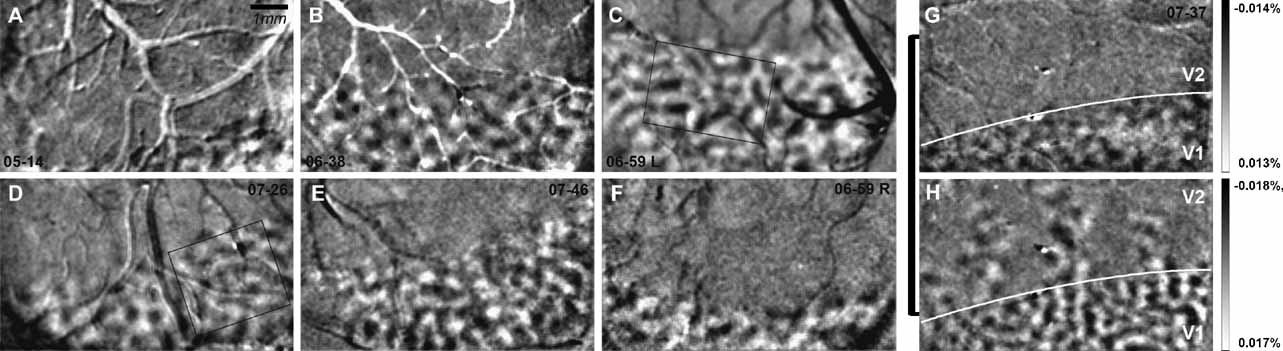
Figure 4. Ocular dominance columns in owl monkeys. Ocular dominance maps (left eye – right eye) are shown for six cases (n = 7 hemispheres) in panels A–G. Cases shown are low pass filtered with a Gaussian kernel of 3 pixels, high pass filtered with a Gaussian kernel 120 pixels and clipped at 2 SD. Panel G shows an ocular dominance map for case 07–37 and panel H shows an orientation map (HV) from the same case. The V1–V2 border is indicated in white in panels G and H. Ocular dominance columns are present only in V1. Percent signal change is shown for panels G and H. Scale bar is 1 mm (Panel A).
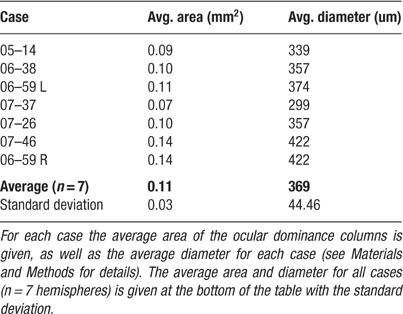
Table 1. The size of ocular dominance columns in owl monkeys
Ocular Dominance Columns, Pinwheel Centers, and CO Blobs
In two cases, we selected a sub-region of V1 to examine the relationship among the cytochrome oxidase blobs, the orientation pinwheels, and the ocular dominance columns. The regions of V1 that were analyzed from cases 06–59L and 07–26 are indicated in panels C and D of Figure 4 . In Figure 5 , we show this analysis for case 06–59L, and in Figure 6 for case 07–26. We only selected regions within which we were certain of the precise alignment between the green reference image (camera frame), the top section, or sections processed for cytochrome oxidase and a deeper section processed for CO, which revealed the blobs. Both Figures 5 and 6 show the precision of alignment between the green reference image (Panel A) and the top section or two containing the surface vasculature revealed through processing for CO (Panel B). Panel C of each figure shows a deep section revealing the blobs, and Panel D shows the same CO-processed section as in C, filtered and clipped to help demarcate the centers of cytochrome oxidase blobs. Panels E and F show the ocular dominance map from this region and an orientation preference map, revealing the orientation pinwheels (white = clockwise; black = counterclockwise). The crosses indicating the centers of the pinwheel are 116 μm, the estimated error in defining pinwheel centers (Polimeni et al., 2005 ). The centers of the blobs and the pinwheels are shown in the OD map in Panel E in both Figures 5 and 6 . As can be seen in panel E of Figures 5 and 6 , there is no apparent relationship between the centers of ocular dominance columns, the centers of blobs, and the orientation pinwheels. The average density of ocular dominance columns, pinwheel centers, and CO blobs measured from these two cases was about 3 blobs/mm2, 6 ODCs/mm2, and 8 pinwheels/mm2.
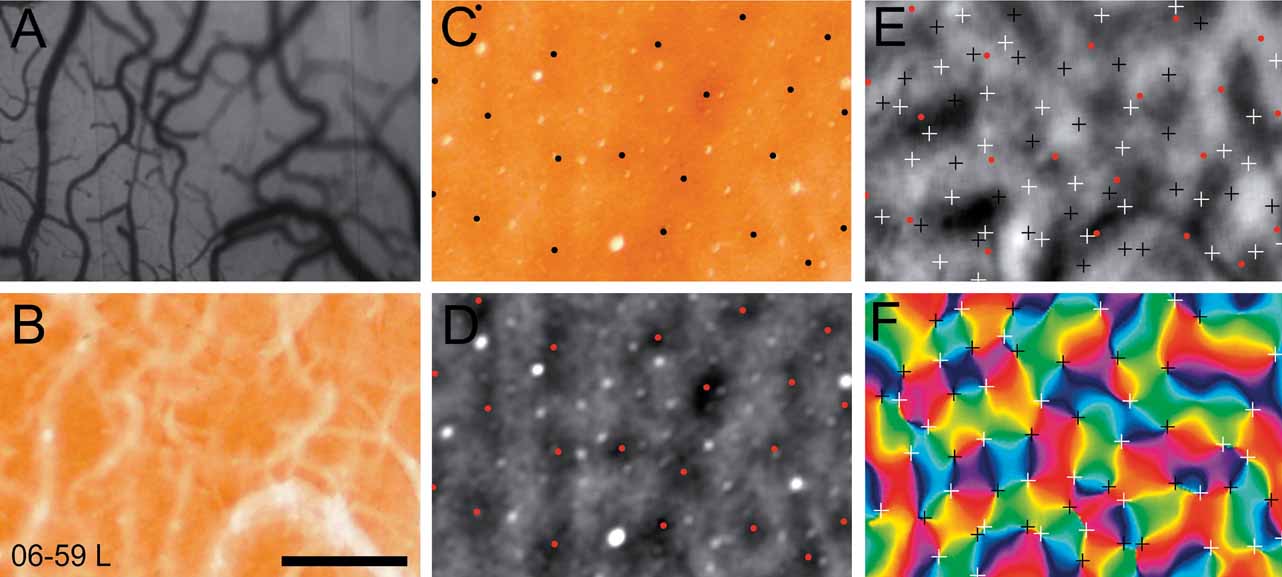
Figure 5. Ocular dominance columns, blobs and pinwheels. Each panel in this figure is taken from a small region of V1 from case 06–59L (see Panel C, Figure 4 ). The vasculature in vivo, photographed from the imaging camera is shown in A. The most superficial section, processed for cytochrome oxidase, is shown in B. A deeper section stained for cytochrome oxidase (C) is has been filtered (D), where blob centers are marked with black (C) or red (D) dots. In E the locations of blob centers and are in relation to a map of ocular dominance. Pinwheel centers are marked with white (clockwise) and black (counterclockwise) crosses in an angle map (F). The crosses indicating the centers of the pinwheel are 116 um, the estimated error in defining pinwheel centers (Polimeni et al., 2005 ). Scale bar is 1 mm.
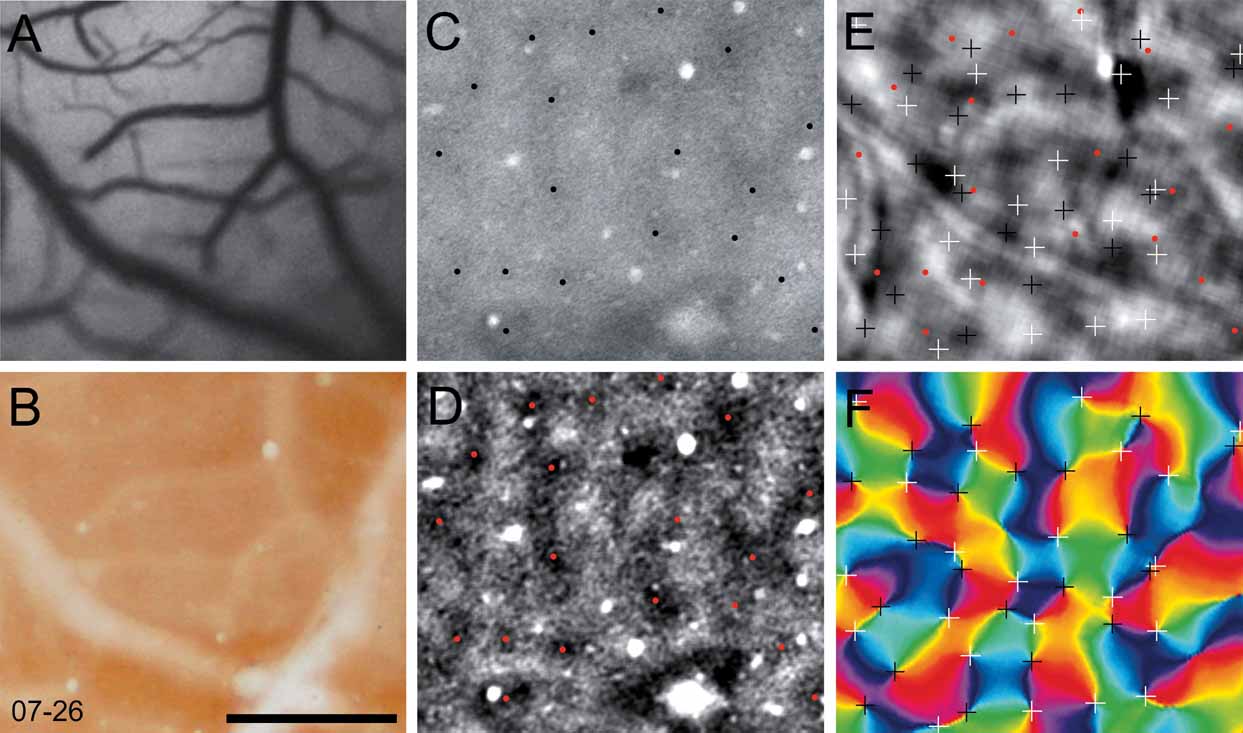
Figure 6. Ocular dominance columns, blobs and pinwheels. Each panel in this figure is taken from a small region of V1 from case 07–26 (see Panel D, Figure 4 ). The vasculature in vivo, photographed from the imaging camera is shown in A. The most superficial section, processed for cytochrome oxidase, is shown in B. A deeper section stained for cytochrome oxidase (C) is has been filtered (D), where blob centers are marked with black (C) or red (D) dots. In E the locations of blob centers and pinwheels (from F) is shown in relation to a map of ocular dominance. Pinwheel centers are marked with white (clockwise) and black (counterclockwise) crosses in an angle map (F). The crosses indicating the centers of the pinwheel are 116 um, the estimated error in defining pinwheel centers (Polimeni et al., 2005 ). Scale bar is 1 mm.
Discussion
In the present study, we demonstrate the existence of ocular dominance columns in primary visual cortex (V1) of owl monkeys. The pattern of changes in reflected light from the surface of V1 due to hemodynamic responses evoked by drifting gratings was recorded with either one eye stimulated or the other. The resulting pattern from a surface view was one of alternating patches of cortex that were more activated by either the left eye or the right eye. The patches were approximately 370 μm in diameter, with centers that showed no relationship to the centers of cytochrome oxidase blobs or to orientation pinwheels. The centers of adjoining right and left eye columns were about 650 μm apart.
The presence of ocular dominance columns in V1 of owl monkeys was unexpected, as projections from geniculate layers with inputs from either the contralateral eye or the ipisilateral eye overlap one another in layer 4 (Diamond et al., 1985 ; Kaas, 1990 ; Rowe et al., 1978 ). There was no evidence in these anatomical experiments for even a weak segregation of geniculate inputs by eye, except for a patchy distribution of terminals via the ipisilateral eye, which were present in the magnocellular division of layer 4 of the upper bank of the calcarine sulcus reported in one owl monkey by Rowe et al. (1978) . Previously, microelectrode recordings from V1 of owl monkeys identified both monocular and binocular neurons (O’Keefe et al., 1998 ), but provided no evidence for ocular dominance columns. As optical imaging of intrinsic signals reflects the activity patterns of neurons in the superficial layers of cortex, it is possible that there is a slight bias for left and right eye columns in layer 4, as shown here. This has so far been undetected in the superficial layers of the striate cortex of Aotus. These results indicate that optical imaging is capable of revealing ocular dominance columns in a species with no apparent ocular dominance columns.
Optical imaging has been used to reveal ocular dominance columns in V1 of primates before, indicating that such columns are apparent in the activity patterns of neurons in the superficial layers of cortex. For example, Roe et al. (2005) used optical imaging to demonstrate ocular dominance columns in two out of the four marmosets, but other studies have failed to demonstrate their presence in any imaged marmosets (McLoughlin and Schiessl, 2006 ). Judging from the varying results in studies of geniculate inputs to layer 4 of marmosets (Chappert-Piquemal et al., 2001 ; Roe et al., 2005 ), ocular dominance columns appear to be variably expressed in marmosets, appearing in some but not other individuals, present in infants, and stabilized by monocular visual deprivation (DeBruyn and Casagrande, 1981 ; Markstahler et al., 1998 ; Sengpiel et al., 1996 ). The ocular dominance columns in marmosets that were revealed by optical imaging were more irregular in size and shape than those in owl monkeys. As another example, Xu et al. (2005) used optical imaging to reveal a patchy ocular dominance map in V1 of prosimian galagos. Previously, there has been anatomical evidence for ocular dominance patches in layer 4 of galagos (Diamond et al., 1985 ; Glendenning et al., 1976 ), although this has not been studied extensively. In microelectrode recording experiments in V1 of galagos, the presence of ocular dominance columns was suggested by the grouping of recorded cells with left or right eye dominance (DeBruyn et al., 1993 ; Sengpiel et al., 1996 ). In earlier experiments on macaque monkeys, optical imaging techniques were used to reveal ocular dominance columns (Blasdel, 1992 ). In summary, ocular dominance columns are expressed in the superficial layers of cortex in Aotus, and can be identified by optical imaging.
The Size and Shape of Ocular Dominance Columns
Ocular dominance columns vary in size and shape in primates. In Old World monkeys, apes and humans, they form alternating bands that merge and diverge, and break down in the representation of peripheral vision into patches activated by the ipisilateral eye with larger, continuous surrounds for the contralateral eye (Florence et al., 1986 ; Florence and Kaas, 1992 ; Rosa et al., 1992 ). The transition from bands of equal width to the dot and surround pattern, appears to be a consequence of a shift from equal inputs from the two eyes in the portion of the striate cortex representing central and paracentral vision, to a greater contralateral representation in the portion of striate cortex representing peripheral vision (Florence and Kaas, 1992 ; LeVay et al., 1985 ; Stone and Johnston, 1981 ; Tanaka, 1991 ). The width of parallel OD bands span a range of sizes from about 300 μm in talapoin monkeys, 330 um in cebus monkeys to 450 μm in macaque monkeys (Florence and Kaas, 1992 ). In humans, the width of ocular dominance columns has been reported to vary from 500 μm to about 1 mm in postmortem tissue (Horton et al., 1990 ; Horton and Hedley-Whyte, 1984 ) but has been reported to range up to 1.2 mm wide in vivo, as measured from fMRI (see Figure 5 of Cheng et al. (2001) for the 1.2 mm wide ODCs of PMK; (Goodyear et al., 2002 ). As these primates represent a series of increasing ocular dominance column sizes, and given the increase in size of the striate cortex (Kaskan et al., 2005 ) it is not surprising that the ocular dominance bands vary in width in a parallel manner (Florence and Kaas, 1992 ).
Ocular dominance columns form alternating regions of right eye and left eye activation in owl monkeys, as they do when apparent in marmosets, squirrel monkeys, and galagos. In owl monkeys, these patches were roughly 300–400 um in diameter, and circular in appearance. Marmoset patches are elongated, and have been described as 200–400 um in width (Chappert-Piquemal et al., 2001 ; Roe et al., 2005 ). In squirrel monkeys, ocular dominance columns may not be expressed at all, or they may vary across individuals from very small patches to patches of 225 um in size (Horton and Hocking, 1996 ). In galagos, where OD columns are weakly expressed in layer 4 (Casagrande and DeBruyn, 1982 ; Glendenning et al., 1976 ), OD patches are of the order of 300 um or less (Xu et al., 2005 ).
In summary, in those primates where OD columns form parallel bands, the widths of the bands increase with the size of area 17; absolutely larger striate cortices have larger OD columns, not necessarily more columns. In primates with a patchy pattern of ocular dominance, the patches may be variably expressed, and they range in size up to about 400 um in diameter. This variability has been used as an argument against OD columns having a direct role in stereoscopic vision (Horton and Adams, 2005 ; Purves et al., 1992 ).
The Relationship of Ocular Dominance Columns to Cytochrome Oxidase Blobs and Orientation Pinwheels
In the striate cortex of primates, there are three horizontally organized modular systems representing eye preference, orientation preference, and cytochrome oxidase (CO) activity. CO blobs appear to be common to all primates (Preuss and Kaas, 1996 ), and orientation selective neurons are spatially arranged relative to the cortical surface in pinwheels of gradually changing preferences in a range of primates (galagos (Xu et al., 2005 ); owl monkeys (Xu et al., 2004 ); macaques; tree shrews as close relatives to primates (Bosking et al., 1997 )) and even in distantly related cats (Bonhoeffer and Grinvald, 1991 ) and ferrets (Chapman et al., 1996 ) (for a list of species which have maps of orientation preference in V1, see Van Hooser et al., 2005 ). Ocular dominance columns, though variable in size and shape, are also present in primates, and as we have shown here, in owl monkeys as well. Though these three modular systems are coextensive within the striate cortex of primates, there appears to have evolved two kinds of relationships between them. In prosimian galagos (Xu et al., 2005 ) and New World marmosets (Roe et al., 2005 ) there is no relationship between the ocular dominance columns centers, the orientation pinwheels and the cytochrome oxidase blobs. In squirrel monkeys, cytochrome oxidase blobs show no clear relationship to the variably expressed ocular dominance columns (Horton and Hocking, 1996 ). In this study, we demonstrated that the ocular dominance columns of Aotus have no obvious relationship to cytochrome oxidase blobs or centers of orientation pinwheels. In the striate cortex of macaque monkeys, however, CO blobs are centered on ocular dominance columns (Bartfeld and Grinvald, 1992 ; Blasdel and Salama, 1986 ; Horton and Hubel, 1981 ), though the relationship between pinwheels of V1 and the CO blobs or ocular dominance columns has been more controversial in this Old World monkey species. For instance, some studies report statistical relationships between the blobs, pinwheels, and ocular dominance columns in macaques (Blasdel and Salama, 1986 ; Obermayer and Blasdel, 1993 ), yet others suggest that there is no clear relationship between CO blobs and orientation pinwheels (Bartfeld and Grinvald, 1992 ). It is important to note, however, that there is uncertainty in determining the locations of pinwheel centers. Polimeni et al. (2005) suggest that pinwheel centers, defined though post-processing, may be found up to 116 um from their actual location in vivo. This introduces some error in assessing the spatial relationships between pinwheels centers and CO blobs or OD columns. Incorporating this error into our assessment of the relationship between pinwheel centers and OD columns and CO blobs still does not lead us to believe that there is any systematic relationship between these three systems. Given the range in size of the CO blobs and OD columns in other primates, this error may be comparatively small. The magnitude of this error may not significantly effect ones assessment of the relationships between pinwheel centers, OD columns, and CO blobs.
Thus, the three types of horizontal organizations in V1 of primates, those for ocular dominance, orientation preference, and CO activity appear to be independently organized in prosimian primates and New World monkeys, and interrelated in Old World monkeys, and possibly apes and humans. The reasons for species differences in the relationships between these three types of modular organizations are unclear; there may or may not be ecologically relevant reasons for these relationships (see below). It appears that one line of primate evolution, the one leading to Old World monkeys, apes and humans, evolved an interdependent relationship, while a more primitive independence was preserved in New World monkeys and prosimians. Alternatively, the pattern of interdependence could have emerged in those primates having bigger brains. New World spider and cebus monkeys have large brains and ocular dominance columns that closely resemble those in macaque monkeys (Florence et al., 1986 ; Rosa et al., 1992 ). Cytochrome oxidase blobs seem to be largely centered on the ocular dominance bands in cebus monkeys (Rosa et al., 1991 ). It would be interesting to investigate the relationships of orientation pinwheels to the ocular dominance columns in these larger-brained New World monkeys.
The Functional Significance of Ocular Dominance Columns
As noted by Livingstone (1996) , there are two primary theories on why ocular dominance columns exist. (1) The interdigitated inputs are related to the two eyes in a way that is important for neurons that function in stereopsis (Ferster, 1981 ; LeVay and Voigt, 1988 ; Poggio et al., 1988 ). (2) Alternatively, they emerge as a consequence of various balances of factors in a developmental program that have been incorporated for other reasons, but also produce ocular dominance columns (Kaas, 1990 ; Miller et al., 1989 ; Purves et al., 1992 ; Swindale, 1980 ). Thus, asking what are the functions of ocular dominance columns is the wrong question to ask. We should ask why the developmental factors that lead to the ocular dominance columns were selected in evolution. We know from the experiments of Constantine-Paton and Law (1978) that transplanting an extra eye to a tadpole will result in a frog with two eyes innervating the contralateral optic tectum. For such cases, ocular dominance columns are present, even though they are never normally present and, therefore, have no normal (ecologically relevant) function. They appear to be the outcome of the interaction between developmental factors that direct connections to specific locations in a retinotopic map, and factors that reflect and maintain synaptic connections based on synchronous neural activities. The variable of using correlated activity in inputs to restrict the selection of synapses on single neurons and on groups of neurons could lead to many desirable neuronal response properties, while producing ocular dominance columns for no functional reason. This concept of ocular dominance as a developmental side effect may explain why they appear to exist in so few taxa, and why they are so variable in some New World monkeys.
Conflict of Interest Statements
The authors declare that the research was conducted in the absence of any commercial or financial relationships that should be construed as a potential conflict of interest.
Acknowledgments
This work was supported by National Eye Institute Grants EY002686 (to J. H. K.), EY11744 (to A. W. R.) and T32 EY007135 (to P. M. K.).
References
Adams, D. L., Horton, J. C. 2003. Capricious expression of cortical columns in the primate brain. Nat. Neurosci. 6, 113-114.
Allman, J. M., and Kaas, J. H. (1974). The organization of the second visual area (V II) in the owl monkey: a second order transformation of the visual hemifield. Brain Res. 76, 247-265.
Anderson, P. A. Olavarria, J., and Van Sluyters, R. C. (1988). The overall pattern of ocular dominance bands in cat visual cortex. J. Neurosci. 8, 2183-2200.
Bartfeld, E., and Grinvald, A. (1992). Relationships between orientation-preference pinwheels, cytochrome oxidase blobs, and ocular-dominance columns in primate striate cortex. Proc. Natl. Acad. Sci. U. S. A. 89, 11905-11909.
Blasdel, G. G. (1992). Differential imaging of ocular dominance and orientation selectivity in monkey striate cortex. J. Neurosci. 12, 115-3138.
Blasdel, G. G., and Salama, G. (1986). Voltage-sensitive dyes reveal a modular organization in monkey striate cortex. Nature 321, 579-585.
Bonhoeffer, T., and Grinvald, A. (1991). Iso-orientation domains in cat visual cortex are arranged in pinwheel-like patterns. Nature 353, 429-431.
Bosking, W. H., Zhang, Y., Schofield, B., and Fitzpatrick, D. (1997). Orientation selectivity and the arrangement of horizontal connections in tree shrew striate cortex. J. Neurosci. 17, 2112-2127.
Casagrande, V. A., and DeBruyn, E. J. (1982). The galago visual system: Aspects of normal organization and developmental plasticity. In The lesser bushbaby as an animal model: Selected topics. D. E. Haines (ed.), (CRC), pp. 107-168.
Chapman, B., Stryker, M. P., and Bonhoeffer, T. (1996). Development of orientation preference maps in ferret primary visual cortex. J. Neurosci. 16, 6443-6453.
Chappert-Piquemal, C., Fonta, C., Malecaze, F., and Imbert, M. (2001). Ocular dominance columns in the adult New World Monkey Callithrix jacchus. Vis. Neurosci. 18, 407-412.
Chen, L. M., Friedman, R. M., Ramsden, B. M., LaMotte, R. H., and Roe, A. W. (2001). Fine-scale organization of SI (area 3b) in the squirrel monkey revealed with intrinsic optical imaging. J. Neurophysiol 86, 3011-3029.
Cheng, K., Waggoner, R. A., and Tanaka, K. (2001). Human ocular dominance columns as revealed by high-field functional magnetic resonance imaging. Neuron 32, 359-374.
Constantine-Paton, M., and Law, M. I. (1978). Eye-specific termination bands in tecta of three-eyed frogs. Science 202, 639-641.
DeBruyn, E. J., and Casagrande, V. A. (1981). Demonstration of ocular dominance columns in a New World primate by means of monocular deprivation. Brain Res. 207, 453-458.
DeBruyn, E. J., Casagrande, V. A., Beck, P. D., and Bonds, A. B. (1993). Visual resolution and sensitivity of single cells in the primary visual cortex (V1) of a nocturnal primate (bush baby): correlations with cortical layers and cytochrome oxidase patterns. J. Neurophysiol. 69, 3-18.
Diamond, I. T., Conley, M., Itoh, K., and Fitzpatrick, D. (1985). Laminar organization of geniculocortical projections in Galago senegalensis and Aotus trivirgatus. J. Comp. Neurol. 242, 584-610.
Ferster, D. (1981). A comparison of binocular depth mechanisms in areas 17 and 18 of the cat visual cortex. J. Physiol. 311, 623-655.
Florence, S. L., and Kaas, J. H. (1992). Ocular dominance columns in area 17 of Old World macaque and talapoin monkeys: complete reconstructions and quantitative analyses. Vis. Neurosci. 8, 449-462.
Florence, S. L., Conley, M., and Casagrande, V. A. (1986). Ocular dominance columns and retinal projections in New World spider monkeys (Ateles ater). J. Comp. Neurol. 243, 234-248.
Fonta, C., Chappert, C., and Imbert, M. (2000). Effect of monocular deprivation on NMDAR1 immunostaining in ocular dominance columns of the marmoset Callithrix jacchus. Vis. Neurosci. 17, 345-352.
Friedman, R. M., Chen, L. M., and Roe, A. W. (2004). Modality maps within primate somatosensory cortex. Proc. Natl. Acad. Sci. USA. 101, 12724-12729.
Gallyas, F. (1979). Silver staining of myelin by means of physical development. Neurol. Res. 1, 203-209.
Glendenning, K. K., Kofron, E. A., and Diamond, I. T. (1976). Laminar organization of projections of the lateral geniculate nucleus to the striate crotex in Galago. Brain Res. 105, 538-546.
Goodyear, B. G., Nicolle, D. A., and Menon, R. S. (2002). High resolution fMRI of ocular dominance columns within the visual cortex of human amblyopes. Strabismus 10, 129-136.
Hendrickson, A. E., and Wilson, J. R. (1979). A difference in [14C]deoxyglucose autoradiographic patterns in striate cortex between Macaca and Saimiri monkeys following monocular stimulation. Brain Res. 170, 353-358.
Horton, J. C., and Adams, D. L. (2005). The cortical column: a structure without a function. Philos. Trans. R. Soc. Lond. B. Biol. Sci. 360, 837-862.
Horton, J. C., and Hedley-Whyte, E. T. (1984). Mapping of cytochrome oxidase patches and ocular dominance columns in human visual cortex. Philos. Trans. R. Soc. Lond. B. Biol. Sci. 304, 255-272.
Horton, J. C., and Hocking, D. R. (1996). An adult-like pattern of ocular dominance columns in striate cortex of newborn monkeys prior to visual experience. J. Neurosci. 16, 1791-1807.
Horton, J. C., and Hubel, D. H. (1981). Regular patchy distribution of cytochrome oxidase staining in primary visual cortex of macaque monkey. Nature 292, 762-764.
Horton, J. C., Dagi, L. R., de McCrane, E. P., and Monasterio, F. M. (1990). Arrangement of ocular dominance columns in human visual cortex. Arch. Ophthalmol. 108, 1025-1031.
Hubel, D. H., and Wiesel, T. N. (1968). Receptive fields and functional architecture of monkey striate cortex. J. Physiol. 195, 215-243.
Hubel, D. H., and Wiesel, T. N. (1969). Anatomical demonstration of columns in the monkey striate cortex. Nature 221, 747-750.
Kaas J. H. (1990). Processing areas and modules in the sensory-perceptual cortex. In Signal and Sense: Local and global order in perceptual maps, G. M. Edelman, W. E. Gall, J. H. W. M. Cowan (eds.), (Wiley-Liss, Inc.), 67-82.
Kaas, J. H., Lin, C. S., and Casagrande, V. A. (1990). The relay of ipsilateral and contralateral retinal input from the lateral geniculate nucleus to striate cortex in the owl monkey: a transneuronal transport study. Brain Res. 106, 371-378.
Kaskan, P. M., Franco, E. C., Yamada, E. S., Silveira, L. C., Darlington, R. B., and Finlay, B. L. (2005). Peripheral variability and central constancy in mammalian visual system evolution. Proc. Biol. Sci. 272, 91-100.
Kennedy, C., Des Rosiers, M. H., Sakurada, O., Shinohara, M., Reivich, M., Jehle, J. W., and Sokoloff, L. (1976). Metabolic mapping of the primary visual system of the monkey by means of the autoradiographic [14C]deoxyglucose technique. Proc. Natl. Acad. Sci. USA. 73, 4230-4234.
Krubitzer, L. (1995). The organization of neocortex in mammals: Are species differences really so different? Trends Neurosci. 18, 408-417.
Krubitzer, L., and Hunt, D. L. (2007). The evolution of cortical areas and modules. In Evolution of Nervous Systems, Kaas J. H., Krubitzer L. A. (eds.), 3, 49-72.
Krubitzer, L. A., and Kaas, J. H. (1990). Cortical connections of MT in four species of primates: areal, modular, and retinotopic patterns. Vis. Neurosci. 5, 165-204.
Landisman, E. C., and Ts'o, D. Y. (2002). Color processing in macaque striate cortex: relationships to ocular dominance, cytochrome oxidase, and orientation. J. Neurophysiol. 87, 3126-3137.
LeVay, S., and Voigt, T. (1988). Ocular dominance and disparity coding in cat visual cortex. Vis. Neurosci. 1, 395-414.
LeVay, S., Connolly, M., Van Houde, J., and Essen, D. C. (1985). The complete pattern of ocular dominance stripes in the striate cortex and visual field of the macaque monkey. J. Neurosci. 5, 486-501.
Livingstone, M. S. (1996). Ocular dominance columns in New World monkeys. J. Neurosci. 16, 2086-2096.
Manger, P., Sum, M., Szymanski, M., Ridgway, S. H., and Krubitzer, L. (1998). Modular subdivisions of dolphin insular cortex: does evolutionary history repeat itself? J. Cogn. Neurosci 10, 153-166.
Markstahler, U., Bach, M., and Spatz, W. B. (1998). Transient molecular visualization of ocular dominance columns (ODCs) in normal adult marmosets despite the desegregated termination of the retino-geniculo-cortical pathways. J. Comp. Neurol. 393, 118-134.
McLoughlin, N., and Schiessl, I. (2006). Orientation selectivity in the common marmoset (Callithrix jacchus): the periodicity of orientation columns in V1 and V2. Neuroimage 31, 76-85.
Miller, K. D., Keller, J. B., and Stryker, M. P. (1989). Ocular dominance column development: analysis and simulation. Science 245, 605-615.
Obermayer, K., and Blasdel, G. G. (1993). Geometry of orientation and ocular dominance columns in monkey striate cortex. J. Neurosci. 13, 4114-4129.
O’Keefe, L. P., Levitt, J. B., Kiper, D. C., Shapley, R. M., and Movshon, J. A. (1998). Functional organization of owl monkey lateral geniculate nucleus and visual cortex. J. Neurophysiol. 80, 594-609.
Poggio, G. F., Gonzalez, F., and Krause, F. (1988). Stereoscopic mechanisms in monkey visual cortex: binocular correlation and disparity selectivity. J. Neurosci. 8, 4531-4550.
Polimeni, J. R., Granquist-Fraser, D., Wood, R. J., Schwartz, E. L. 2005. Physical limits to spatial resolution of optical recording: clarifying the spatial structure of cortical hypercolumns. Proc. Natl. Acad. Sci. USA. 102 4158-4163.
Preuss, T. M., and Kaas, J. H. (1996). Cytochrome oxidase ’blobs’ and other characteristics of primary visual cortex in a lemuroid primate, Cheirogaleus medius. Brain Behav. Evol. 47, 103-112.
Purves, D., Riddle, D. R., and LaMantia, A. S. (1992). Iterated patterns of brain circuitry (or how the cortex gets its spots). Trends Neurosci. 15, 362-368.
Ramsden, B. M., Hung, C. P., and Roe, A. W. (2001). Real and illusory contour processing in area V1 of the primate: a cortical balancing act. Cereb. Cortex 11, 648-665.
Roe, A. W., and Ts'o, D. Y. (1995) Visual topography in primate V2: multiple representation across functional stripes. J. Neurosci. 15 3689-3715.
Roe, A. W., Fritsches, K., and Pettigrew, J. D. (2005). Optical imaging of functional organization of V1 and V2 in marmoset visual cortex. Anat. Rec. A Discov. Mol. Cell. Evol. Biol. 287, 1213-1225.
Rosa, M. G., Gattass, R., and Soares, J. G. (1991). A quantitative analysis of cytochrome oxidase-rich patches in the primary visual cortex of Cebus monkeys: topographic distribution and effects of late monocular enucleation. Exp. Brain Res. 84, 195-209.
Rosa, M. G., Gattass, R., Fiorani, M. Jr., and Soares, J. G. (1992). Laminar, columnar and topographic aspects of ocular dominance in the primary visual cortex of Cebus monkeys. Exp. Brain Res. 88, 249-264.
Rowe, M. H., Benevento, L. A., and Rezak, M. (1978). Some observations on the patterns of segregated geniculate inputs to the visual cortex in New World primates: an autoradiographic study. Brain Res. 159, 371-378.
Sengpiel, F., Troilo, D., Kind, P. C., Graham, B., and Blakemore, C. (1996). Functional architecture of area 17 in normal and monocularly deprived marmosets (Callithrix jacchus). Vis. Neurosci. 13, 145-160.
Shatz, C. J., Lindstrom, S., and Wiesel, T. N. (1977). The distribution of afferents representing the right and left eyes in the cat's visual cortex. Brain Res. 131, 103-116.
Silveira, L. C., de Matos, F. M., Pontes-Arruda, A., Picanco-Diniz, C. W., and Muniz, J. A. (1996). Late development of Zif268 ocular dominance columns in primary visual cortex of primates. Brain Res. 732, 237-241.
Spatz, W. B. (1979). The retino-geniculo-cortical pathway in Callithrix. II. The geniculo-cortical projection. Exp. Brain Res. 36, 401-410.
Spatz, W. B. (1989). Loss of ocular dominance columns with maturity in the monkey, Callithrix jacchus. Brain Res. 488, 376-380.
Stone, J., and Johnston, E. (1981). The topography of primate retina: a study of the human, bushbaby, and new- and old-world monkeys. J. Comp. Neurol. 196, 205-223.
Sur, M., Wall, J. T., and Kaas, J. H. (1981). Modular segregation of functional cell classes within the postcentral somatosensory cortex of monkeys. Science 212, 1059-1061.
Swindale, N. V. (1980). A model for the formation of ocular dominance stripes. Proc. R Soc. Lond. B Biol. Sci. 208, 243-264.
Tanaka, S. (1991). Theory of ocular dominance column formation. Mathematical basis and computer simulation. Biol. Cybern. 64, 263-272.
Tootell, R. B., Hamilton, S. L., Silverman, M. S., and Switkes, E. (1988). Functional anatomy of macaque striate cortex. I. Ocular dominance, binocular interactions, and baseline conditions. J. Neurosci. 8, 1500-1530.
Van Hooser, S. D., Heimel, J. A., Chung, S, Nelson, S. B., and Toth, L. J. (2005). Orientation selectivity without orientation maps in visual cortex of a highly visual mammal. J. Neurosci. 25, 19-28.
Wiesel, T. N., and Hubel, D. H. (1963). Single-cell responses in striate cortex of kittens deprived of vision in one eye. J. Neurophysiol. 26, 1003-1017.
Wong-Riley, M. (1979). Changes in the visual system of monocularly sutured or enucleated cats demonstrable with cytochrome oxidase histochemistry. Brain Res. 171, 11-28.
Xu, X., Bosking, W., Sary, G., Stefansic, J., Shima, D., and Casagrande, V. (2004). Functional organization of visual cortex in the owl monkey. J. Neurosci. 24, 6237-6247.
Keywords: V1, Ocular dominance, Owl monkey, Visual cortex, Evolution
Citation: Peter M. Kaskan, Haidong D. Lu, Barbara C. Dillenburger, Anna W. Roe and Jon H. Kaas (2007). Intrinsic-signal optical imaging reveals crypticocular dominance columns in primary visual cortex of New World owl monkeys. Front. Neurosci. 1:1. 67-75. doi: 10.3389/neuro.01/1.1.005.2007
Received: 15 August 2007;
Paper pending published: 01 September 2007;
Accepted: 01 September 2007;
Published online: 15 October 2007.
Edited by:
Idan Segev, Hebrew University, IsraelReviewed by:
Daniel TsÂo, SUNY Upstate Medical University, USA Roni Azouz, Ben Gurion University, IsraelCopyright: © 2007 Kaskan, Lu, Dillenburger, Roe and Kaas. This is an open-access article subject to an exclusive license agreement between the authors and the Frontiers Research Foundation, which permits unrestricted use, distribution, and reproduction in any medium, provided the original authors and source are credited.
*Correspondence: John H. Kaas, Department of Psychology, Vanderbilt University, 301 Wilson Hall, 111 21st Avenue South, Nashville, TN 37203, USA. e-mail: jon.kaas@vanderbilt.edu