Reciprocal inhibitory connections within a neural network for rotational optic-flow processing
- 1 Max-Planck-Institute of Neurobiology, Department of Systems and Computational Neurobiology, Martinsried, Germany
- 2 Bernstein Center Munich, University Hospital Munich Grosshadern, Munich, Germany
Neurons in the visual system of the blowfly have large receptive fields that are selective for specific optic flow fields. Here, we studied the neural mechanisms underlying flow–field selectivity in proximal Vertical System (VS)-cells, a particular subset of tangential cells in the fly. These cells have local preferred directions that are distributed such as to match the flow field occurring during a rotation of the fly. However, the neural circuitry leading to this selectivity is not fully understood. Through dual intracellular recordings from proximal VS cells and other tangential cells, we characterized the specific wiring between VS cells themselves and between proximal VS cells and horizontal sensitive tangential cells. We discovered a spiking neuron (Vi) involved in this circuitry that has not been described before. This neuron turned out to be connected to proximal VS cells via gap junctions and, in addition, it was found to be inhibitory onto VS1.
Introduction
In blowflies, the processing of large field motion is performed in the posterior division of the third neuropile of the optic lobe, the lobula plate. The tangential cells found in the lobula plate represent a set of about 60 fairly large neurons per brain hemisphere each of which can be identified individually due to its invariant anatomy and characteristic visual response properties (Haag and Borst, 2002 ; Hausen, 1982 ; Hausen, 1984 ; Hengstenberg et al., 1982 ). Among them, cells are found responding preferentially to vertical motion like the 10 Vertical System cells (VS, VS1–VS10) as well as cells which are best activated by horizontal motion like the three Horizontal System (HS)- and the two Centrifugal Horizontal (CH) cells. While these tangential cells respond to motion stimuli in a graded potential manner, tangential cells can be found that produce full blown action potentials (Haag and Borst, 1996 ; Hengstenberg, 1977 ). With their large dendrites the tangential cells spatially pool the signals of thousands of local, columnar elements arranged in a retinotopic fashion (Borst and Egelhaaf, 1992 ; Haag et al., 1992 ; Single and Borst, 1998 ). In addition to the columnar input, many tangential cells receive input from other tangential cells (Farrow et al., 2003 , 2005 , 2006 ; Haag and Borst, 2001 , 2002 , 2003 , 2004 ; Hausen, 1982 , 1984 ; Horstmann et al., 2000 ; Kalb et al., 2006 ). Together with the directionally selective input from columnar elements, these lobula plate network interactions are responsible for the tangential cells tuning to specific flow–fields. Tangential cells often have complex receptive fields with different preferred direction in different parts of the visual field matching the optic flow that occurs during specific flight maneuvers of the fly (Krapp and Hengstenberg, 1996 ; Krapp et al., 1998 ; Franz and Krapp, 2000 ; Karmeier et al., 2003 ). Especially for VS cells it has been shown that the local preferred direction varies in space such as to match the optic flow induced by self-rotation of the animal around various axes. This is particular the case for proximal VS cells which have local preferred directions that are distributed to match the flow field occurring during a rotation of the fly (Krapp and Hengstenberg, 1996 ). These cells respond best to upward motion in the frontal part, horizontal progressive motion in the dorsal part and to downward motion in the lateral part of their visual field.
This complex structure of the receptive field of VS cells has been found to be due to two types of interactions: (a) proximal VS cells (VS7–VS10) with a lateral receptive field receive input from horizontal sensitive tangential cells (Haag and Borst, 2004 ). This input is responsible for the dorsal horizontal sensitivity of proximal VS cells. (b) Interactions between the VS cells (Haag and Borst, 2004 ). Double electrode recordings of VS cells suggested that the VS cells are connected to each other in a chain–like fashion such that each VS cell is connected to its two immediate neighbors by axo-axonal gap junctions (Cuntz et al., 2007 ; Haag and Borst, 2004 ). This leads to a broadening of the receptive field of VS cells (Farrow et al., 2005 ). In addition, it has been found that distant cells inhibit each other bidirectionally: depolarizing current injection into VS1 led to a hyperpolarization in VS10 and vice versa. In a recent study, it has been argued that this particular wiring performs an interpolation between the output signals of VS cells, leading to a robust representation of the axis of rotation (Cuntz et al., 2007 ). Thereby it turned out that the bidirectional inhibition plays an important role in linearizing the potential decay from VS1 to proximal VS cells. However, the cellular location of the inhibition and the detailed wiring have not been described so far.
In the following, we will present experiments where we investigated the reciprocal inhibition between VS1 and VS10. In addition, we will describe the specific wiring of proximal VS cells and horizontal sensitive tangential cells. We demonstrate that proximal VS cells are coupled via electrical synapses to a spiking neuron, which has not been described so far. This neuron is also responsible for inhibitory postsynaptic potentials measured in VS1. Furthermore, we show that proximal VS cells receive input from horizontal sensitive tangential cells.
Materials and Methods
Preparation and Set Up
Female blowflies (Calliphora vicina) were briefly anesthesized with CO2 and mounted ventral side up with wax on a small preparation platform. The head capsule was opened from behind; the trachea and airsacs which normally cover the lobula plate were removed. To eliminate movements of the brain caused by peristaltic contractions of the esophagus, the proboscis of the animal was cut away and the gut was pulled out. This allowed stable intracellular recordings of up to 45 minutes. The fly was then mounted on a heavy recording table looking down onto the stimulus monitors. The fly brain was viewed from behind through a fluorescence microscope (Axiotech Vario 100 HD, Zeiss).
Stimulation
Stimuli were generated on Tektronix 608 monitors by an image synthesizer (Picasso, Innisfree) and consisted of a one-dimensional grating of 16.7 degree spatial wavelength and 87% contrast displayed at a frame rate of 200 Hz. The mean luminosity of the screen was 11.2 cd/m2. The intensity of the pattern was square-wave modulated along its vertical axis. For measuring the sensitivity along the azimuth (Figure 1 b), we used three Tektronix monitors: monitor 1 was placed contralateral and extended from -90 to -30 degrees in the horizontal direction and from +40 to -30 degrees in the vertical direction; monitor 2 was placed at position -15 to +40 degrees, monitor 3 was at position +55 to +120 degrees. Each monitor screen was divided into five stripes each with a horizontal extent of 11 (for monitors 1 and 2) or 13 degrees (for monitor 3), respectively. The pattern inside these stripes could be moved independently. For measuring the response to rotational stimuli (Figure 7 ), we used two Tektronix monitors. The stimulus field extended from 16 to 42 degrees and from 95 to 133 degrees in the horizontal direction and from -30 to +30 degrees in the vertical direction of the fly.
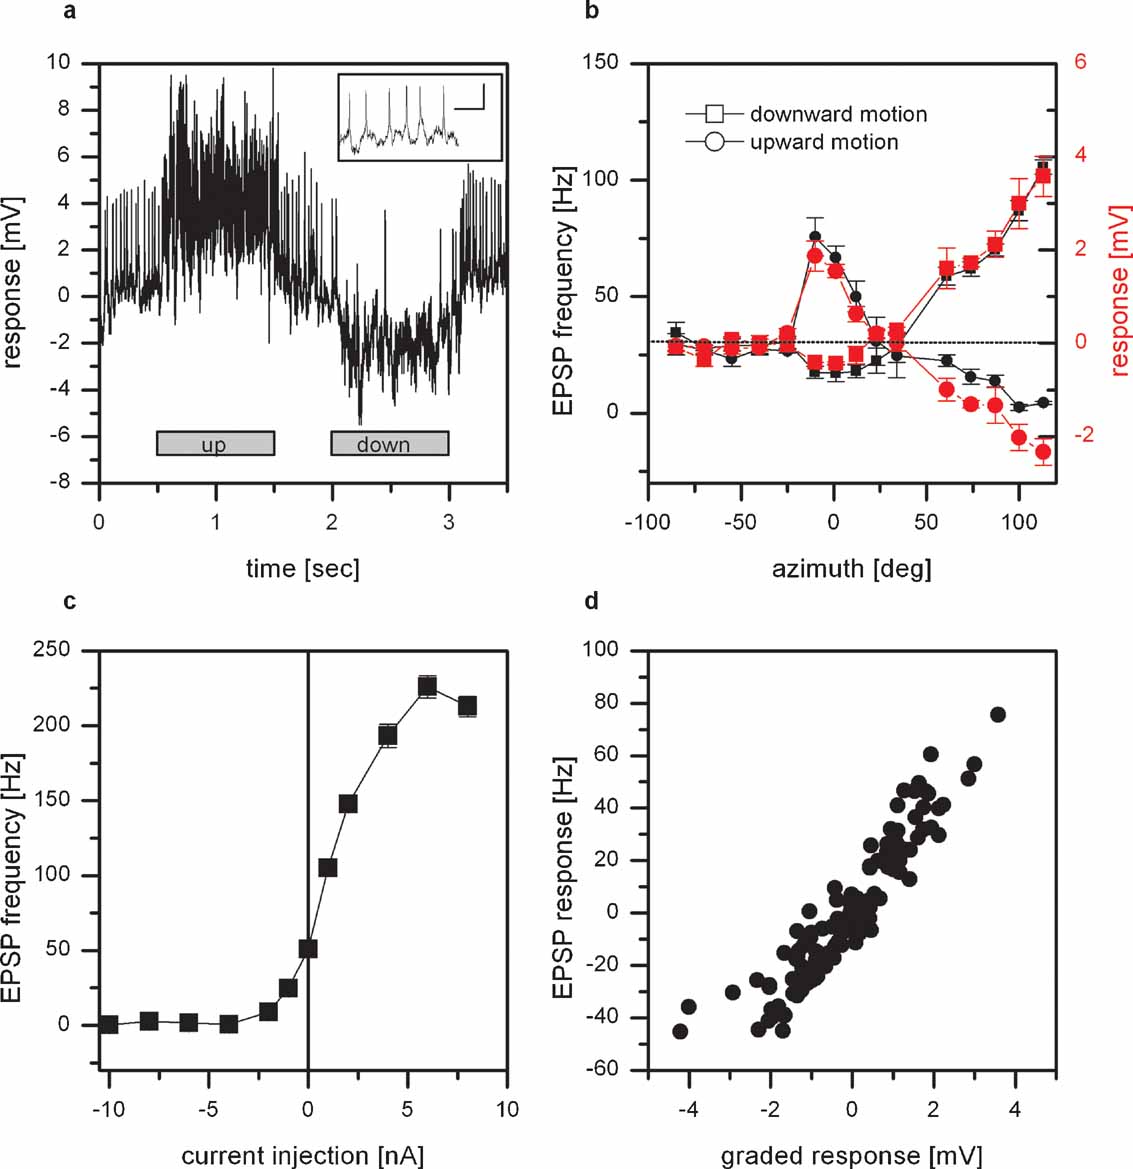
Figure 1. Intracellular recording from VS8. (a) Example of the response of VS8 to vertical motion at an azimuthal position of 0 degrees. The cell responds to upward motion with a depolarization, to downward motion with a hyperpolarization of the membrane potential. In addition, the membrane potential of these cells reveals distinct EPSPs. The inset shows EPSPs with a higher temporal resolution; scalebar: 2 mV, 50 msec (for a schematics of the stimulus, see Figure 1 in Haag et al., 2007 ). (b) Graded response (red symbols) and EPSP frequency (black symbols) of VS8 to vertical motion as a function of the azimuth position. The strongest response to vertical motion can be elicited at lateral stimulus positions where downward motion depolarizes and upward motion hyperpolarizes the cell. In addition, VS8 responds to motion in the frontal part with an inverse preferred direction. Data represent the mean value of 5 stimulus presentations recorded in one fly. The error bars represent the standard error of the mean (SEM). The dotted line shows the resting frequency of the EPSPs. (c) Effect of current injection into VS8 on the EPSP frequency. Hyperpolarization of VS8 decreases the frequency of EPSPs, depolarization increases the frequency of EPSPs up to 230 Hz. Data represent the mean value ± SEM of 5–10 current injections. (d) Dependence of the change of EPSP frequency on the graded response. Data from the experiments for measuring the sensitivity along the azimuth were used to plot the change in EPSP frequency as a function of the graded response of the cells. The change in EPSP frequency depends linearly on the graded response. Data are from recordings on 2 VS7, 2 VS8, and a VS9 cell, dataset from Haag et al., 2007 .
Electrical Recording
For intracellular recordings of the cells, electrodes were pulled on a Brown-Flaming micropipette puller (P-97) using thin-wall glass capillaries with an outer diameter of 1 mm (Clark, GC100TF-10). The tip of the electrode was filled with 10 mM Alexa 488 (Molecular Probes) or with 8 mM Oregon-Green-Bapta I (Molecular Probes) for the optical recordings. The shaft of the electrode was filled with a 2 M KAc solution. Electrodes had resistances of about 15 MΩ. For dual intracellular recordings, one electrode was filled with the green fluorescent dye Alexa 488, the other electrode filled with the red fluorescent dye Alexa 568 (Molecular Probes). A SEL10-amplifier (npi-electronics) operated in the bridge mode was used throughout the experiments. In the experiments with dual intracellular recordings, we used an additional SEL10-amplifier. For data analysis, the output signals of the amplifiers were fed to a PIII PC via an 12 bit A/D converter (DAS-1602/12, Computerboards, Middleboro, MA) at a sampling rate of 5 kHz and stored to hard disk. The signals were evaluated offline by a program written in Delphi (Borland).
EPSPs in the intracellular recorded responses were detected by differentiating the response traces and applying a threshold operation. For calculation of the EPSP-triggered-averaged (ETA), the detected EPSPs in cell A were used to cut out and average the membrane potential of cell B between -10 and +20 ms after the appearance of the EPSP.
All the recordings were made from the axons of the VS cells. In the double recording experiments, one electrode was placed close to the main dendritic branch point and the second electrode close to the terminal region of the cells. For the experiments presented in Figures 2 c and 2 d, we will refer to the electrode placed close to the main dendritic branch point as dendritic electrode. VS cells were identified using a method described by Farrow (2005) . There, not only the specific anatomy of the cell was taken into account, but also the relative position of their ventral dendrite within the lobula plate.
Two-photon Microscopy
We used a custom-built two photon microscope (Denk et al., 1990 ; Haag et al., 2004 ) consisting of the following components: a 5W-pumped Ti:Sapphire laser (MaiTai, Spectra Physics), a pockels cell (Conoptics), scan mirrors incl. drivers (Cambridge Technology), a scan lens (4401-302, Rodenstock), a tube lens (MXA 22018, Nikon), a dichroic mirror (DCSPR 25.5 × 36, AHF Tuebingen), and a 40× water immersion lens (Zeiss). The lens can move along all three axes by a step-motor driven micromanipulator (MP285-3Z, Sutter Instruments). Emitted light is filtered in parallel by two bandpass filters (HQ 535/50M and HQ HQ610/75M, Chroma) and collected by multialkali photomultipliers (R6357, Hamamatsu). The whole system is controlled by custom-written software (CfNT V1.569, Michael Mueller, MPI for medical Research, Heidelberg, Germany). The anatomy of the cells (Figures 4 and 5 ) was recorded with a XYZ resolution of 0.4 × 0.4 × 2 μm3 and consisted of 19 Z-stacks shifted in XY-direction. 3D reconstruction of the cells was performed with the software package AMIRA V4.0 (Mercury Computer Systems, Berlin, Germany).
Optical Recording
We used an upright microscope (Axiotech, Zeiss), a 10× water immersion lens (UMPLFL 10xW Olympus), and a CCD camera (PXL, Photometrics, equipped with a EEV-chip, 1024 × 512 pixel) connected to a Power-Mac (Apple). For calcium imaging, we used the FITC filter set #9 from Zeiss (BP 450–490 nm, beamsplitter 510 nm, LP 520 nm). To visualize neurons with Alexa 568, we used the rhodamin filter set #15 from Zeiss (BP 546 nm, beamsplitter 580 nm, LP 590 nm). To calculate relative fluorescence change, the first frame of each image series was taken as a reference that was subtracted from each following image. This resulted in a series of difference images (ΔF), which were subsequently divided by the reference frame (ΔF/F).
Results
In a first set of experiments, we measured the responses of VS cells with a lateral receptive field to up- and downward motion at different azimuth positions. As an example the response of a VS8 cell is shown. VS8 responds to motion stimuli with a graded shift in membrane potential. In addition, the membrane potential of these cells reveals distinct EPSPs (Figure 1 a). Downward motion of the pattern leads to a depolarization and an increase in EPSP frequency, upward motion to a hyperpolarization of the cell and a decreased ESP frequency.
The graded response and the frequency of the EPSPs to upward and downward motion at different azimuth positions are shown in Figure 1 b. The sensitivity to vertical moving pattern measured for the graded response (red line) as well as the EPSP frequency (black line) exhibit the same profile. The strongest response can be found for downward motion in the lateral part of the visual field, i.e., at azimuth positions larger than 100 degrees. In addition, there is a strong sensitivity to upward motion in the frontal visual field at around 0 degrees.
The EPSPs cannot only be elicited by motion stimuli, but also by current injection into the cell recorded. This is demonstrated in Figure 1 c. Here the EPSP frequency recorded in a VS8 cell is plotted as a function of the injected current. At rest, i.e., when the cell was not stimulated by pattern motion nor current injection, the EPSP frequency was at about 50 Hz. Negative current injection led to a decrease, positive current injection to an increase in EPSP frequency of up to 230 Hz. The dependence of the EPSP frequency on the injected current turned out to be rather steep. The injection of +1 nA which elicited an estimated depolarization of about +5 mV led already to an increase in EPSP frequency by 50 Hz. The same steep relationship can be observed when the dependence of the change of EPSP frequency on the graded response was plotted. Here we used the measurements of the sensitivity along the azimuth to plot the change in EPSP frequency as a function of the graded response. The function turned out to be linear for the measured responses.
These findings can be explained if we assume that VS8 receives input from a spiking interneuron connected to it by an electrical synapse. Depolarizing current injection into VS8 would spread into the coupled spiking neuron increasing its firing frequency. The action potentials elicited there would then lead to distinct EPSPs in VS8.
EPSPs cannot only be found in VS8, but also in VS7, VS9, and VS10. These four neurons all show the strongest response to downward motion in the lateral, and to upward motion in the frontal part of the visual field. To see whether the observed EPSPs are from a common input to all of the abovementioned VS cells, or whether they receive independent input, we performed double intracellular recordings from two VS cells with a lateral receptive field. As an example, a stretch of the membrane potential from simultaneously recorded VS8- and VS10 cells is shown in Figure 2 a. Whenever an EPSP is elicited in VS8, an EPSP can also be seen in VS10. In addition, depolarizing current injection into VS8 leads not only to an increase in EPSP frequency in VS8 but also in VS10 (Figure 2 b). The same effect can be seen in VS8 if current was injected into VS10. The recordings indicate that these VS cells receive common input from a single spiking neuron.
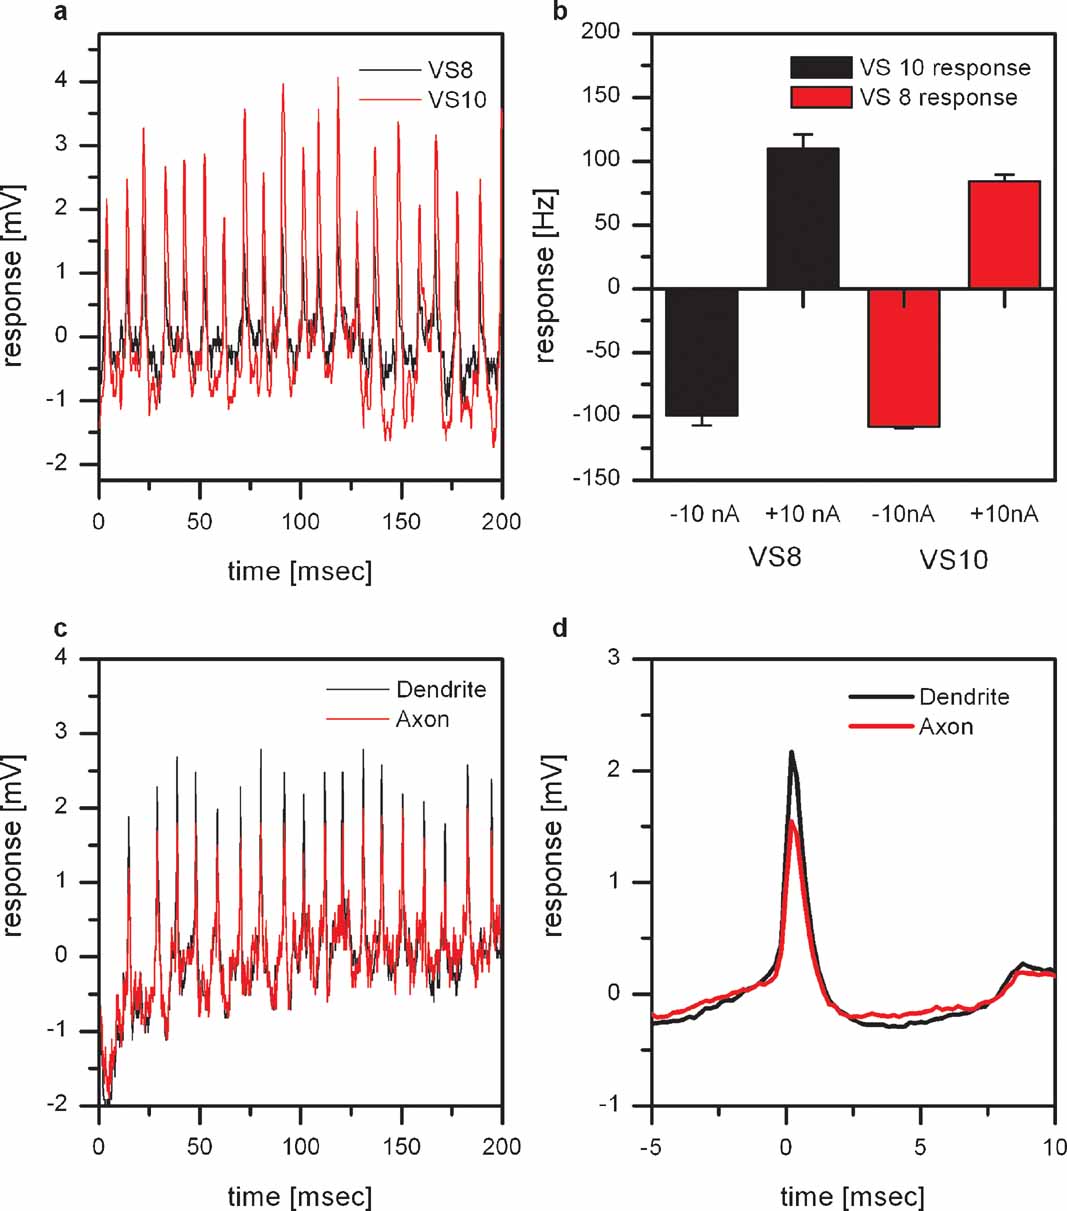
Figure 2. Dual intracellular recordings from proximal VS cells. (a) Membrane potential of a VS8 (black line) and a VS10 cell (red line). The VS8-cell was recorded from the axon close to the terminal region, the VS10 from the axon close to the main dendritic branch point. Whenever an EPSP is elicited in VS8, an EPSP is also visible in VS10. (b) Change of EPSP frequency by current injection. Current injection into VS8 leads not only to a change in EPSP frequency in VS8 but also in VS10. The same effect can be seen in VS8 if current was injected into VS10. Data represent the mean ± SEM of 3 repetitions. This experiment was repeated for two VS8-VS9 pairs, yielding similar results. (c) Double intracellular recording from a single VS9 cell. One electrode was placed in the axon close to the main dendritic branch (black line) and the second electrode in the axon close to the terminal region (red line). The comparison of the amplitude of the EPSPs recorded at the two locations shows that EPSPs recorded near the dendrite have larger amplitudes. (d) ETA of the membrane potential recorded close to the terminal region. The EPSP recorded close to the main dendritic branch point is on average about 50% larger than the EPSP recorded close to the terminal region. The larger amplitudes of the EPSPs in the dendritic recording indicate a synaptic connection to the spiking neuron located in the dendrite of the VS cells.
To investigate whether the VS cells are contacting the spiking neuron in their dendrite or the axon terminal, we performed double recordings from a single VS cell. We placed one electrode in the main branching point of the dendrite and the other electrode in the axon close to the terminal region of the cell. These recordings revealed that the amplitude of the EPSPs measured with the dendritic electrode are larger compared to the axonal electrode (Figure 2 c). This can also be seen in the dendritic potential where we used the EPSPs in the axon as a trigger (Figure 2 c). The larger amplitudes of the EPSPs in the dendritic recording indicate a synaptic connection to the spiking neuron located in the dendrite of the VS cells.
The frequency of EPSPs measured in VS7–VS10 cannot only be altered by direct current injection into VS cells or by visual motion stimuli but also by current injection into horizontal sensitive tangential cells (Haag and Borst, 2004 ). This is again illustrated in Figure 3 a. Here, current was injected into either dCH or HSN cells and the frequency of EPSPs were measured in proximal VS cells (VS7–VS9, n = 3 for dCH current injection and n = 3 for HSN current injection). Injection of hyperpolarizing current decreased EPSP frequency and injection of depolarizing current increased EPSP frequency. The effect of current injection into dCH cells was about twice as large as the effect of current injection into HSN cells. This different strength of the effect might be explained by the fact that HSN and dCH cells are coupled via dendro-dendritic gap junctions. Thereby the effect of current injection into HSN on the frequency of EPSPs in VS cells is an indirect one, mediated by dCH. According to this, current injection into HSN would lead to a change in membrane potential in dCH which itself alters the EPSP frequency. If dCH is responsible for the frequency change than it has to be connected either to the spiking neuron itself or to VS cells. Double recordings of dCH and VS cells indicated that there is a direct connectivity between these cells. Current injection into dCH led to a change in membrane potential in VS cells and vice versa. This is shown in Figure 3 b. Here the response of dCH as a function of current injected into VS8 (black line) and the response of VS8 as a function of current injected into dCH (red line) is shown. Such a bidirectional connection speaks in favor of electrical synapses between dCH and VS cells. Another experiment suggesting the direct connection between dCH and VS cells is shown in Figure 3 c. Here the recorded EPSPs in VS8 were used to calculate a spike-triggered average of the dCH membrane potential. Compared to the EPSPs measured in VS8, the EPSPs in dCH are much smaller. Taken together, these two datasets indicate a coupling of dCH to VS cells and not to the spiking neuron. Since dCH does not receive direct input from local motion detectors, but their motion response is driven by HS-cells (Farrow et al., 2003 ), we investigated how well the response properties of proximal VS cells is similar to the response properties of HS-cells. We, therefore, measured the responses of proximal VS cells and HSN to gratings moving with different directions presented in the frontal visual field. The result is shown in Figure 3 d. Shown is the response of proximal VS cells (black line) and HSN (red line) as a function of the orientation of the grating. Both curves show an identical dependence on the orientation of the grating, indicating that most of the motion response in the frontal visual field is mediated by the response of HSN.
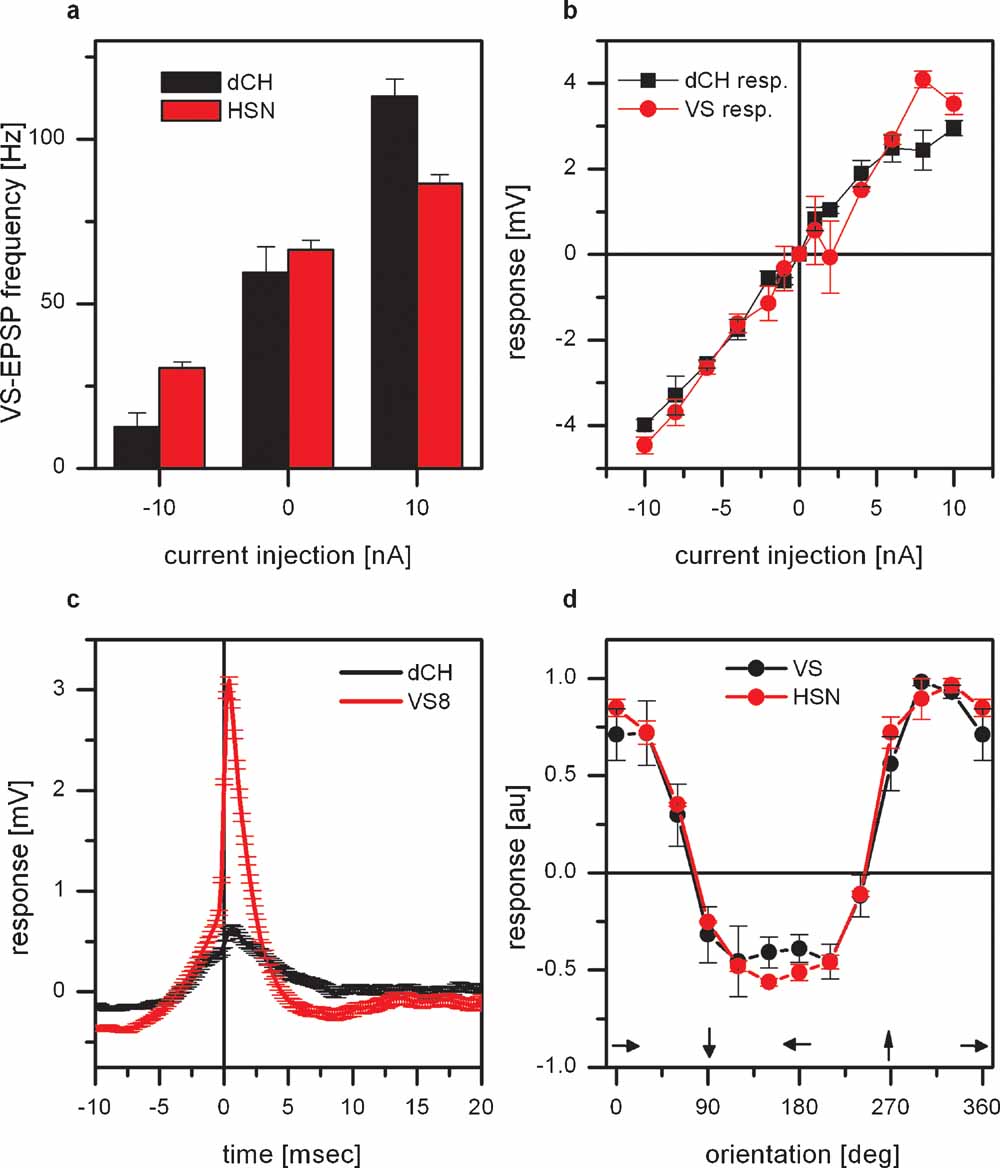
Figure 3. Effect of connectivity of proximal VS cells and horizontal sensitive tangential cells. (a) Current injection into dCH cells elicited a larger change in EPSP frequency in proximal VS cells than current injection into HSN cells. Data represent the mean value ± SEM of 3 dCH-VS and 3 HSN-VS pairs. (b) Double recording of a dCH- and a VS9-cell. Current injection into dCH evoked a potential change in VS9 and current injection into VS9 elicited a potential change in dCH. The amplitude of the potential change depended linearly on the injected current. These experiments demonstrate that not only current of both polarities is transmitted between dCH and VS9, but that the connection also works in both directions. Data represent the mean ± SEM of 5–10 repetitions. The same result was also obtained for another dCH-VS9, a dCH-VS8, and a dCH-VS7 pair. (c) ETA of the dCH membrane potential. The red line shows the average EPSP in VS8 which served as a trigger for averaging the membrane potential of dCH (black line). While the EPSPs are clearly visible in the membrane potential of proximal VS cells, the EPSPs found in dCH are much smaller. This indicates a direct coupling of dCH to proximal VS cells and not to the spiking neuron. (d) Orientation tuning of proximal VS cells and HSN. Plotted is the graded response normalized to the maximum response as a function of the orientation of the grating. The tuning curves for proximal VS cells and HSN are almost identical. Data represent the mean and SEM for 4 proximal VS cells and 3 HSN cells.
In order to identify the spiking neuron responsible for the EPSPs in VS cells, we tried to record from spiking neurons. Since there are numerous spiking neurons in the lobula plate, it turned out to be necessary to perform double recordings of spiking neurons and proximal VS cells.
Figure 4 shows an example of a spiking neuron and VS9. Whenever a spike is elicited in the spiking neuron, an EPSP can be detected in VS9 (Figure 4 a). This can also be seen in the spike-triggered average of the VS9 membrane potential (Figure 4 b). The anatomy of the spiking neuron is shown in Figure 4 c. To obtain an anatomical picture of the neuron, we stained the cell with Alexa488 and imaged the anatomy with a two-photon microscope (see Materials and Methods). The anatomy of this neuron resembles a neuron described as dCAL1 (K. Hausen, personal communication). Vi connects the lobula plates from the left and right brain hemisphere. The dorsal arborizations in the right lobula plate are in close vicinity to dendritic branches of VS8. So far it is not known which polarity this neuron has, i.e. whether the arborizations in the left or right lobula plate are dendritic or axonal. To investigate potential coupling to tangential cells in the left lobula plate, we recorded several tangential cells (HSN, HSE, vCH, VS1, VS3, VS5, VS8) together with a VS9 cell from the right lobula plate. Again we used the EPSPs detected in VS9 as indirect recording of spikes in Vi. Current injection into left tangential cells did not influence the EPSP frequency recorded in the VS9 of the left lobula plate. This excludes the possibility that the branches of Vi in the left lobula plate are postsynaptic to the above-mentioned tangential cells. In addition the EPSP-trigger average of the membrane potential of left tangential cells did not reveal distinct membrane deflections in these cells. Therefore, it can also be excluded that the left branches of Vi are presynaptic to the recorded tangential cells.
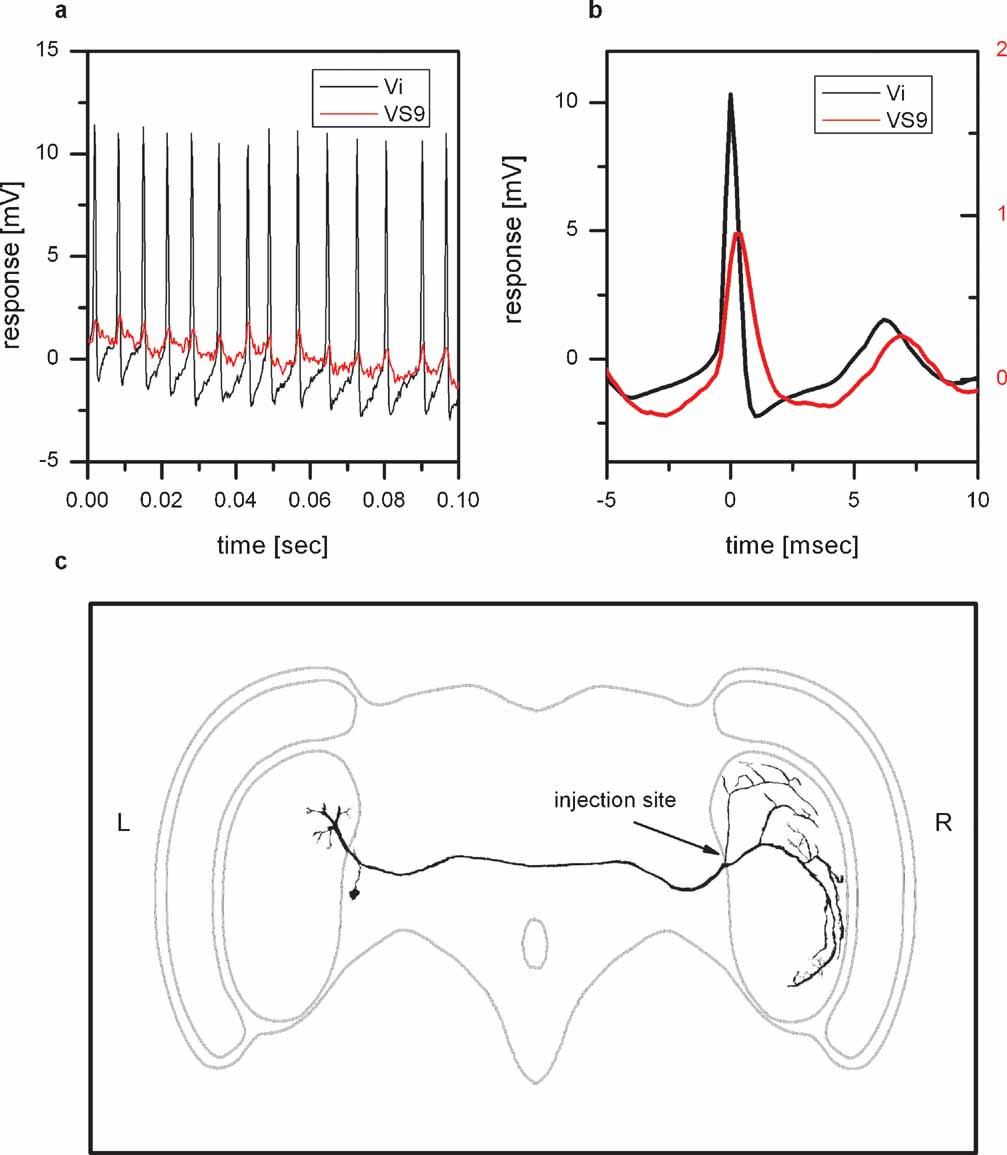
Figure 4. Physiology and anatomy of Vi. (a) Double intracellular recording of Vi and VS9. Shown is a stretch of the membrane potential of Vi (black line) and VS9 (red line). Whenever a spike is elicited in Vi, an EPSP can be measured in VS9. (b) Spike-triggered average of the VS9 membrane potential. The black line shows the average spike in Vi, which served as a trigger to average the membrane potential of VS9 (red line). (c) Two-photon imaging of Vi. The cell was filled with the green fluorescent dye Alexa488 and imaged with a two-photon microscope at a resolution of 0.4 × 0.4 × 2 μm3. This resulted in a total of 19 XYZ stacks that were merged and further processed with Amira software. Vi connects the lobula plates from the left and right brain hemisphere and has arborizations in both lobula plates. The cell was penetrated and dye injected in the arborization in the right lobula plate. The arborizations in the left lobula plate are likely not completely filled. Overall, Vi was recorded in five experiments, three of which are double recordings with proximal VS cells. Vi was stained in three experiments.
Besides the overlap of Vi arborizations with dendritic branches of VS8, there is also an overlap with dendritic branches of VS1 (Figure 5 a). In order to investigate whether there is a coupling between Vi and VS1, we performed double recordings between VS1 and proximal VS cells. Since it turned out to be difficult to perform double recordings with Vi and VS1, we made use of the electrical coupling of proximal VS cells with Vi. Given that each EPSP recorded in proximal VS cells is the passive reflection of a spike in Vi, we can use proximal VS cell EPSPs as an indirect measure of spikes in Vi. The result of such a double recording of VS1 and VS9 is shown in Figure 5 b. Whenever an EPSP is elicited in VS9, indicating a spike in Vi, an IPSP can be detected in VS1. The inhibitory connection between VS cells onto VS1 has been reported before (Haag and Borst, 2004 ).
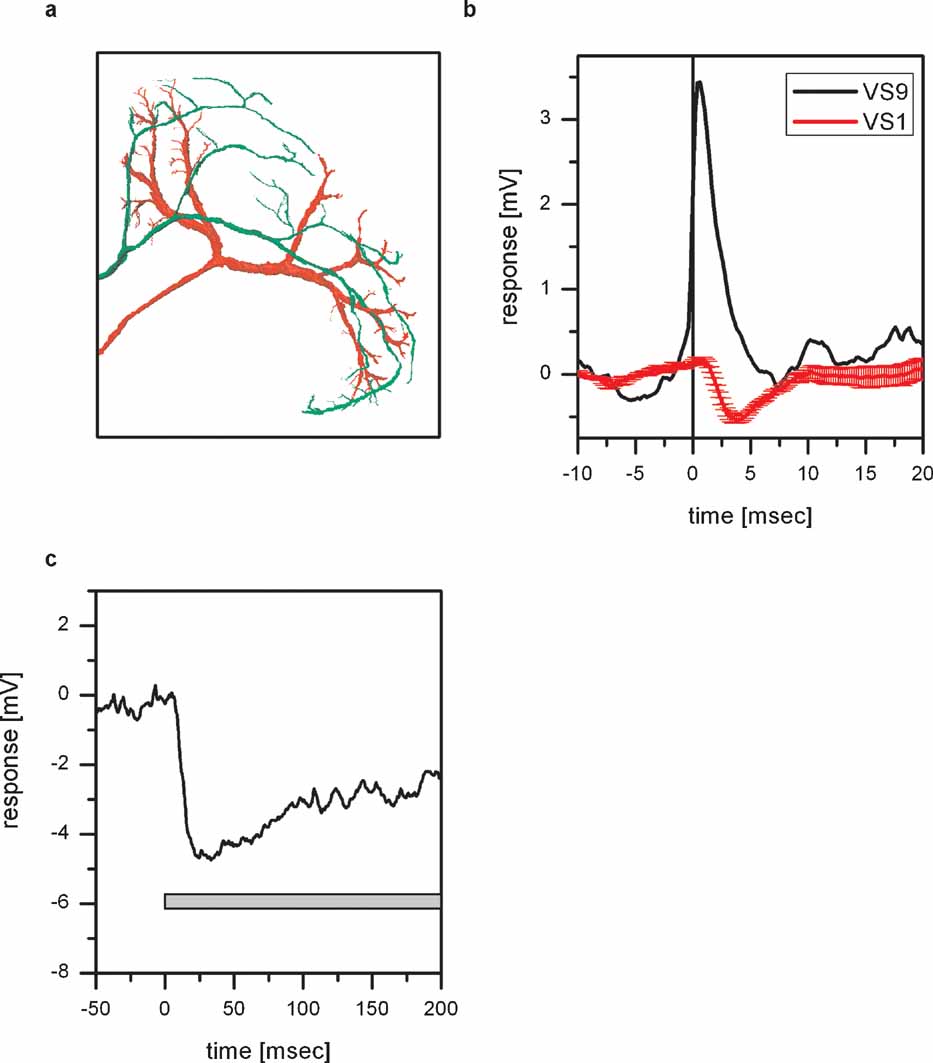
Figure 5. Inhibitory coupling of Vi with VS1. (a) Anatomy of Vi together with VS1 in the left lobula plate. Both cells were filled with Alexa488, imaged with a two-photon microscope and reconstructed with Amira. For details see legend for Figure 4 c. The ventral arborizations of Vi and VS1 are in close vicinity to each other. This holds also true if the two cells are viewed in a XZ-projection. (b) ETA of VS1 membrane potential. The black line shows the average EPSP recorded in VS9 which served as a trigger for averaging the membrane potential of VS1 (red line). An EPSP recorded in VS9 coincides with an IPSP recorded in VS1. The negative peak of the VS1 signal appeared about 3 ms after the peak of the VS9 EPSP. (c) Effect of depolarizing dCH on the membrane potential of VS1. Current injection of +10 nA in dCH resulted in a hyperpolarization of the VS1 membrane potential. The negative peak in the VS1 response appeared about 20 ms after the current injection into dCH. Data represent the mean of 13 repetitions. Current injection into vCH did not elicit a response in VS1 (data not shown).
Since we demonstrated that depolarization of dCH increases the EPSP frequency in VS cells and, therefore, the spike frequency in Vi and since Vi is inhibitory to VS1, depolarization of dCH should hyperpolarize VS1 (see also Figure 8 ). This indeed can be shown by injecting depolarizing current into dCH and measuring the membrane potential if VS1 (Figure 5 c). Injection of +10 nA into dCH led to a pronounced hyperpolarization of VS1 by about 4 mV.
The described inhibitory coupling between Vi and VS1 could explain previous results where positive current injection into VS9 led to a hyperpolarization of VS1 (Haag and Borst, 2004 ). In the same study, an inhibitory coupling of VS1 onto proximal VS cells was shown. In order to reveal the site of the connection, we employed optical recording techniques. As was shown previously, the calcium signal in VS cells follows the membrane potential in a rather linear way, thus making calcium a feasible indicator of activity within these cells (Haag and Borst, 2000 ; Egelhaaf and Borst, 1995 ). To see whether calcium imaging can be used to visualize connectivity between VS cells, we filled a VS7 cell with the calcium indicator OGB-I and subsequently recorded from VS cells electrically. The result of such an experiment is shown in Figure 6 . Depolarizing current injection into VS7 led to an increase in fluorescence in the terminal region and in the dendrite (Figure 6 b). When the same amount of depolarizing current was injected into a VS6 cell, fluorescence increased in the VS7 cell as well (Figure 6 c). However, in this case the change in fluorescence was much higher in the terminal region than in the dendritic region of VS7 indicating an axo-axonal coupling between the cells. This result is in agreement with similar experiments obtained previously (Cuntz et al., 2007 ). In contrast, depolarizing current injection into VS1 elicited a decrease in fluorescence in the terminal region of VS7 (Figure 6 d). This points towards an axonal inhibitory connection from VS1 onto VS7. Whether VS1 is indeed directly inhibiting the proximal VS cells or indirectly via other not yet identified interneurons is presently not known. The VS1 spike-triggered average of the membrane potential of VS7 shows a slow, long lasting IPSP that was elicited with a delay of 2–3 ms after the VS1-spike. This might indicate an indirect coupling between these cells (Figure 6 e).
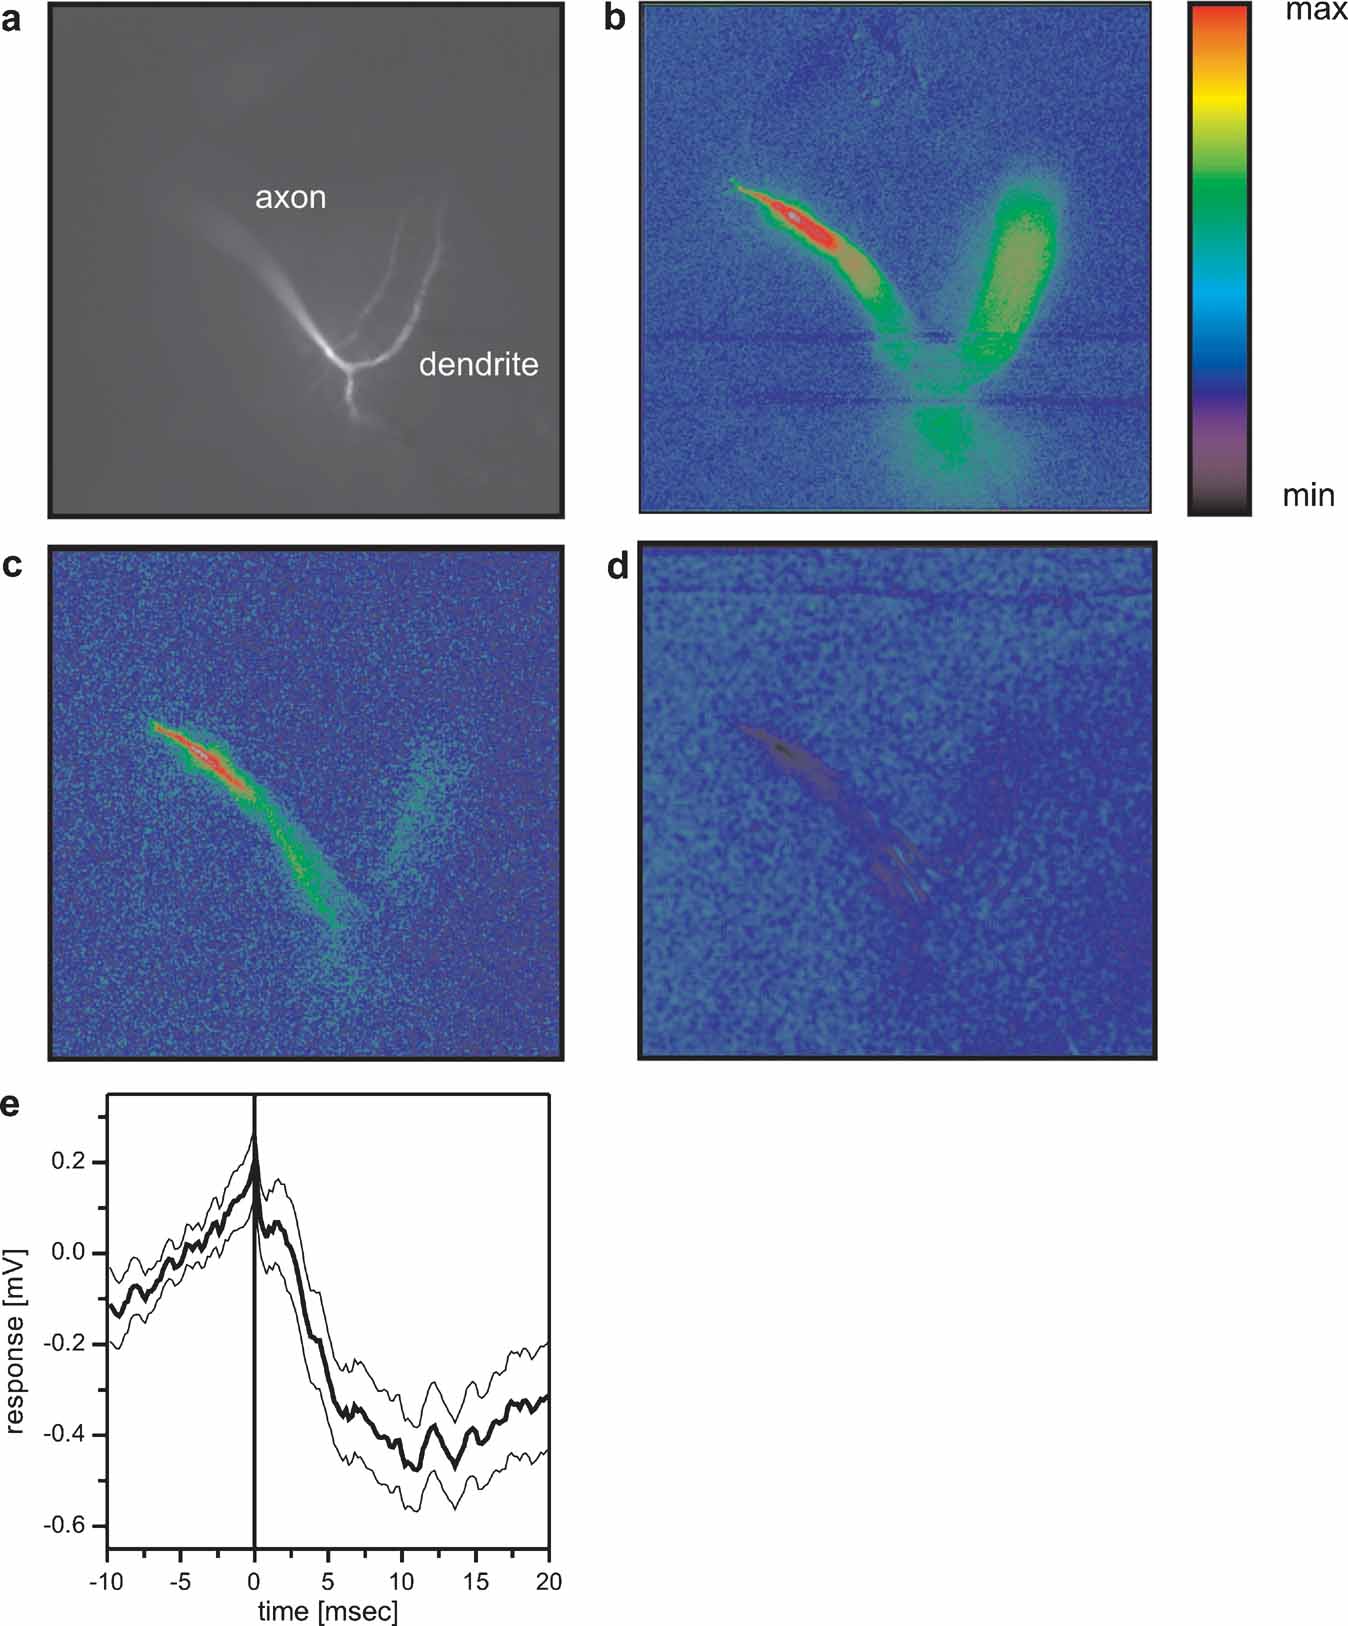
Figure 6. Optical imaging of connectivity between VS cells. (a) Fluorescence image of a VS7 cell filled with OregonGreen Bapta I (OGB-I). (b) False-color images of relative change of fluorescence (ΔF/F) occurring in the VS7 cell after direct current injection of +10 nA into the VS7 cell. Color code: min = -10%, max = +30% ΔF/F. (c) False-color images of relative change of fluorescence (ΔF/F) occurring in the VS7 cell after current injection of +10 nA into VS6. Color code: min = -3%, max = +10% ΔF/F. The current injection into VS6 elicited an increase in fluorescence mainly in the terminal region of VS7. (d) False-color images of relative change of fluorescence (ΔF/F) occurring in the VS7 cell after current injection of +10 nA into VS1. Color code: min = -2.5%, max = +7.5% ΔF/F. Depolarizing current injection into VS1 elicited a decrease in fluorescence in VS7 again in the terminal region of the cell. This indicates that VS1 is inhibitory to VS7 and that the two cells are connected via axo-axonal contacts. For anatomical identification, VS1 and VS6 were filled with the calcium insensitive dye Alexa568. Since the FITC filter set was used for calcium imaging of VS7, VS1 and VS6 are not visible in the pictures with this filter set. (e) Spike-triggered average of VS7 membrane potential, where spikes occurring in VS1 served as a trigger signal. The averaged membrane potential of VS7 revealed a slow IPSP following a spike in VS1. The thick line shows the average potential (n = 112), the thin lines the mean ± SEM.
Proximal VS cells have local preferred directions that are distributed to match the flow field occurring during a rotation of the fly (Krapp and Hengstenberg, 1996 ). In the frontal part, they respond best to upward motion, in the dorsal part to horizontal progressive motion and in the lateral part to downward motion. Whereas the lateral sensitivity is due to local motion detector input, the frontal and dorsal sensitivity is mediated by the connectivity to other tangential cells. In order to test whether the responses of VS cells to rotational stimuli are indeed larger than to pure translational ones, we recorded the response of proximal VS cells to simultaneous motion stimuli shown at different locations in the receptive field. To do so, we used two stimulus monitors: one placed in front of the fly and a second one in the lateral visual field. The combined stimulus with frontal upward and lateral downward motion elicited the strongest depolarization (Figure 7 , right column). In contrast, the translational stimuli with downward motion in both monitors (Figure 7 , fifth column) did not elicit any response. This also holds true when the averaged responses of five proximal VS cells were considered. These cells respond with 4.4 ± 0.3 mV to the rotational and with 0.7 ± 0.2 mV to the translational downward stimulus. This demonstrates that proximal VS cells are tuned more to a rotational flow field than to a translatory one. In addition the comparison between the responses to combined stimuli and the algebraic sum of the responses to single stimuli show that the summation of frontal and lateral stimuli is computed in an almost perfectly linear way. On average, the measured response amounted to 93 ± 5% of the algebraic sum of responses to single stimuli.
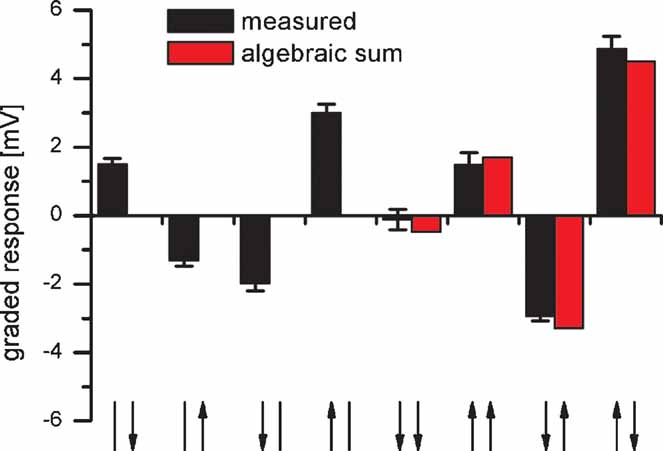
Figure 7. Response of a VS8 cell to simultaneous motion in two sectors of the receptive field. The VS cell respond best to a rotatory motion stimuli consisting of upward motion in the frontal and downward motion in the lateral eye field (rightmost stimulus configuration). The comparison between the responses to combined motion stimuli (black bars) and the algebraic sum of the responses to single motion stimuli (red bars) indicate a nearly linear summation of responses to single stimuli. Data represent the mean ± SEM recorded in 5 stimulus repetitions. Similar results were obtained for experiments on two VS7, another VS8 and a VS9 cell. The arrows on the x-axis represent the visual stimulus combinations. The left arrow represents frontal motion, the right arrow motion in the lateral visual field. The arrow head indicates the direction of motion.
Discussion
Our findings are summarized in the circuit diagram presented in Figure 8 . All VS cells are electrically coupled in a chain-like manner via axo-axonal gap junctions. In addition, proximal VS cells are electrically coupled via their dendrites to the spiking Vi-cell which in turn inhibits VS1. VS1 inhibits VS10, most likely via one or several interneurons of unknown identity. Proximal VS cells are also electrically coupled to dCH which in turn is coupled to HSN.
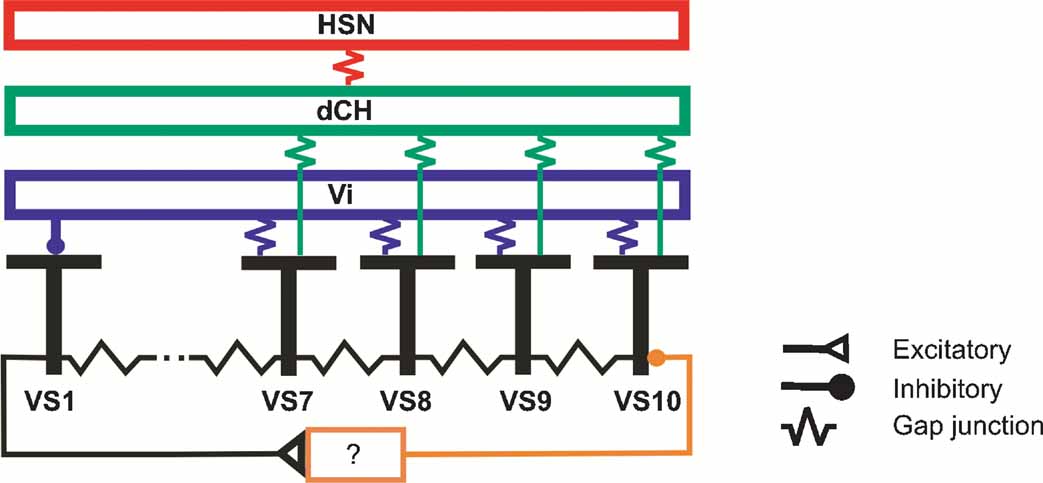
Figure 8. Summary diagram about the connections between large field lobula plate neurons characterized in this study. Gap junctions are shown as electrical resistances, inhibitory connections as filled circles, excitatory connections as open triangles.
This circuit diagram is based on a number of experimental observations presented above which shall be briefly summarized in the following. The occurrence of EPSPs in proximal VS cells and the simultaneous change in EPSP frequency upon current injection into proximal VS cells indicate an electrical coupling of these cells with a spiking neuron. According to this, the EPSPs measured in proximal VS cells are passive reflectances of action potentials elicited in the spiking neuron. The experiments summarized in Figure 2 indicate furthermore that all proximal VS cells are electrically coupled through their dendrites to the same spiking neuron. Double recordings of proximal VS and dCH cells show that these cells are additionally coupled to another. Therefore, current injection into dCH leads to a change in membrane potential in proximal VS cells and through the electrical coupling to the spiking neuron to a change in EPSP frequency. The effect of current injection into HSN is most likely mediated by dCH since these two cells had been shown to be electrically coupled, too. Thus, current injection into HSN leads to a change in membrane potential in dCH and consequently to a change in membrane potential in proximal VS cells. Since it has been shown that CH-cells do not receive direct motion input, but their motion response is mediated by the connectivity to HSN (Farrow et al., 2003 ), this implies in addition that medial VS cells receive a blurred version of the original motion input (Cuntz et al., 2003 ). The experiments summarized in Figure 5 demonstrate in addition an inhibitory connection of the spiking Vi neuron onto VS1.
All proximal VS cells show similar local preferred directions in the frontal visual field, whereas the lateral sensitivity is shifted along the azimuth, with VS7 having the most frontal peak sensitivity and VS10 the most lateral (Haag et al., 2007 ; Krapp et al., 1998 ). The sensitivity of the cells in the lateral part of the receptive fields can be explained by the retinotopic organization of the visual system together with the location of the ventral branch of proximal VS cells in the lobula plate. The more proximal the ventral branch is located in the lobula plate, the more lateral is the sensitivity along the azimuth. However, the retinotopy cannot explain the upward sensitivity in the frontal part of the visual field. The network shown in Figure 8 indicates that the upward sensitivity of proximal VS cells is mediated in part by the electrical coupling to dCH and Vi. Furthermore, the electrical coupling of the four proximal VS cells with dCH and Vi has the consequence that the sensitivity in the frontal part is similar between proximal VS cells. The similarity of the sensitivity in the frontal part has been shown by measuring the local preferred direction at different locations in the visual field. The electrical coupling between proximal VS cells and dCH results in addition in a downward sensitivity of dCH in the lateral visual field. In this case, the response of proximal VS cells to downward motion driven by local motion detector input is transmitted onto dCH. Another part of the upward sensitivity of proximal VS cells in the frontal visual field can be accounted for by the inhibitory input from VS1. Here, however, experimental ablation of VS1 failed to abolish the upward sensitivity of proximal VS cell, indicating that VS1 certainly is not the only cell providing inhibitory input onto proximal VS cells (Farrow et al., 2005 ). Future experiments will have to elucidate this part of the circuit in more detail.
How does the above circuitry contribute to the response selectivity of VS cells? In order to address this point, we had tested the response linearity of the proximal VS cells presenting various motion stimuli in the frontal and the lateral visual field in isolation and combination (Figure 7 ). These experiments revealed that proximal VS cells indeed respond stronger to rotational than to translational stimuli (Figure 7 ). In addition, the summation of the responses to frontal and lateral stimuli seems to work in an almost linear way, at least for the stimulus conditions tested. This response linearity is not expected for neurons when synaptic inputs interact with each other via conductance changes. Due to saturation properties caused by conductance change the summation of chemical synaptic input is in most cases sublinear, except when conductance changes are negligible compared to the resting conductance. For example, such a sublinear summation has been observed in lateral VS cells when stimuli were presented covering various parts of the receptive field providing immediate input to the dendrite (Borst et al., 1995 ; Egelhaaf et al., 1994 ; Haag et al., 1992 ). In addition, a recent study on the flow-field properties of V1 revealed only a small influence of the lateral upward motion on the overall response (Karmeier et al., 2003 ). This neuron has been found to have local preferred directions that resemble a rotational rather than a translational flow field (Krapp et al., 2001 ). In contrast to the predictions derived from the distribution of local preferred directions V1 responds to pure frontal downward motion with 92% of the response amplitude to the matched rotational stimulus with frontal downward and lateral upward motion (Karmeier et al., 2003 ). The authors in this study attributed this low flow-field selectivity to synaptic saturation. The circuit described above in the present study might circumvent this problem of synaptic saturation partly by connecting neurons to each other via gap junctions which do not change the conductance of the neuron. According to this idea, electrical coupling is a means to linearize the summation of the responses to frontal and lateral motion stimuli and might be one explanation for the abundance of gap junctions found within the network of lobula plate tangential cells.
Conflict of Interest Statement
The authors declare that the research was conducted in the absence of any commercial or financial relationships that could be construed as a potential conflict of interest.
Acknowledgment
This work was supported by the Max-Planck-Society and a grant of the BMBF to the Bernstein center Munich to J. H.
References
Borst, A., and Egelhaaf, M. (1992). In vivo imaging of calcium accumulation in fly interneurons as elicited by visual motion stimulation. PNAS 89, 4139-4143.
Borst, A., Egelhaaf, M., and Haag, J. (1995). Mechanisms of dendritic integration underlying gain control in fly motion-sensitive interneurons. J. Comput. Neurosci. 2, 5-18.
Borst, A., and Haag, J. (2002). Neural networks in the cockpit of the fly. J. Comp. Physiol. 188, 419-437.
Cuntz, H., Haag, J., Borst, A. 2003 Neural image processing by dendritic networks. PNAS 100, 11082-11085.
Cuntz, H., Haag, J., Foerstner, F., Segev, I., and Borst, A. (2007). Robust coding of flow-field parameters by axo-axonal gap junctions between fly visual interneurons. PNAS 104, 10229-10233.
Denk, W., Strickler, J. H., and Webb, W. W. (1990). Two-photon laser scanning fluorescence microscopy. Science 248, 73-76.
Egelhaaf, M., Haag, J., and Borst, A. (1994). Processing of synaptic information depends on the structure of the dendritic tree. NeuroReport 6, 205-208.
Egelhaaf, M., and Borst, A. (1995). Calcium accumulation in visual interneurons of the fly: Stimulus dependence and relationship to membrane potential. J. Neurophysiol. 73, 2540-2552.
Farrow, K. (2005). Lateral interactions and receptive field structure of lobula plate tangential cells in the blowfly. Doctoral Thesis, Muenchen.
Farrow, K., Haag, J., and Borst, A. (2003). Input organization of multifunctional motion sensitive neurons in the blowfly. J. Neurosci. 23, 9805-9811.
Farrow, K., Borst, A., and Haag, J. (2005). Sharing receptive fields with your neighbors: Tuning the vertical system cells to wide field motion. J. Neurosci. 25, 3985-3993.
Farrow, K., Haag, J., and Borst, A. (2006). Nonlinear, binocular interactions underlying flow field selectivity of a motion-sensitive neuron. Nat. Neurosci. 9, 1312-1320.
Franz, M. O., and Krapp, H. G. (2000). Wide-field, motion-sensitive neurons and matched filters for optic flow fields. Biol. Cybern. 83, 185-197.
Haag, J., Egelhaaf, M., and Borst, A. (1992). Dendritic integration of motion information in visual interneurons of the blowfly. Neurosci. Lett. 140, 173-176.
Haag, J., and Borst, A. (1996). Amplification of high-frequency synaptic inputs by active dendritic membrane processes. Nature 379, 639-641.
Haag, J., and Borst, A. (2000). Spatial distribution and characteristics of voltage-gated calcium currents within visual interneurons. J. Neurophysiol. 83, 1039-1051.
Haag, J., and Borst, A. (2001). Recurrent network interactions underlying flow-field selectivity of visual interneurons. J. Neurosci. 21, 5685-5692.
Haag, J., and Borst, A. (2002). Dendro-dendritic interactions between motion-sensitive large-field neurons in the fly. J. Neurosci. 22, 3227-3233.
Haag, J., and Borst, A. (2003). Orientation tuning of motion-sensitive neurons shaped by vertical-horizontal network interactions. J. Comp. Physiol. A 189, 363-370.
Haag, J., and Borst, A. (2004). Neural mechanism underlying complex receptive field properties of motion-sensitive interneurons. Nat. Neurosci. 7, 628-634.
Haag, J., Denk, W., and Borst, A. (2004). Fly motion vision is based on Reichardt detectors regardless of the signal-to-noise ratio. PNAS 101, 16333-16338.
Haag, J., and Borst, A. (2005). Dye-coupling visualizes networks of large-field motion-sensitive neurons in the fly. J. Comp. Physiol. A 191, 445-454.
Haag, J., Wertz, A., and Borst, A. (2007). Integration of lobula plate output signals by DNOVS1, an identified premotor descending neuron. J. Neurosci. 27, 1992-2000.
Hausen, K. (1982). Motion sensitive interneurons in the optomotor system of the fly. I. The horizontal cells: structure and signals. Biol. Cybern. 45, 143-156.
Hausen, K. (1984). The lobula-complex of the fly: Structure, function and significance in visual behaviour. In Photoreception and Vision in Invertebrates M. A., Ali ed. (New York, London, Plenum Press), pp. 523-559.
Hengstenberg, R., Hausen, K., and Hengstenberg, B. (1982). The number and structure of giant vertical cells (VS) in the lobula plate of the blowfly Calliphora erytrocephala. J. Comp. Physiol. A 149, 163-177.
Horstmann, W., Egelhaaf, M., and Warzecha, A. K. (2000). Synaptic interactions increase optic flow specificity. Eur. J. Neurosci. 12, 2157-2165.
Kalb, J., Egelhaaf, M., and Kurtz, R. (2006). Robust integration of motion information in the fly visual system revealed by single cell photoablation. J. Neurosci. 26, 7898-7906.
Karmeier, K., Krapp, H. G., and Egelhaaf, M. (2003). Robustness of the tuning of fly visual interneurons to rotatory optic flow. J. Neurophysiol. 90, 1626-1634.
Krapp, H. G., and Hengstenberg, R. (1996). Estimation of self-motion by optic flow processing in single visual interneurons. Nature 384, 463-466.
Krapp, H. G., Hengstenberg, B., and Hengstenberg, R. (1998). Dendritic structure and receptive-field organization of optic flow processing interneurons in the fly. J. Neurophysiol. 79, 1902-1917.
Krapp, H. G., Hengstenberg, R., and Egelhaaf, M. (2001). Binocular contributions to optic flow processing in the fly visual system. J. Neurophysiol. 85, 724-734.
Keywords: motion detection, insect, vision, gap junction, flow field
Citation: Juergen Haag and Alexander Borst (2007). Reciprocal inhibitory connections within a neural network for rotational optic-flow processing. Front. Neurosci. 1:1. 111-121. doi: 10.3389/neuro.01/1.1.008.2007
Received: 15 August 2007;
Paper pending published: 01 September 2007;
Accepted: 01 September 2007;
Published online: 15 October 2007.
Edited by:
Idan Segev, Hebrew University, IsraelReviewed by:
Hermann Cuntz, University College London, UKEgidio DÂAngelo, University of Pavia, Italy
Donald Edward, Georgia State University, USA
Copyright: © 2007 Haag and Borst. This is an open-access article subject to an exclusive license agreement between the authors and the Frontiers Research Foundation, which permits unrestricted use, distribution, and reproduction in any medium, provided the original authors and source are credited.
*Correspondence: Juergen Haag, Max-Planck-Institute of Neurobiology, Department of Systems and Computational Neurobiology, Am Klopferspitz 18, D-82152 Martinsried, Germany.