1
Institute of Neuroscience, Newcastle University, Newcastle, UK
2
Department of Mathematics, Boston University, Boston, MA, USA
3
School of Computing Science, Newcastle University, Newcastle, UK
4
Psychiatry CEDD, GlaxoSmithkline plc, Harlow, Essex, UK
5
Department of Physiology and Pharmacology, SUNY Health Sciences Center, Brooklyn, NY, USA
The neocortex generates rhythmic electrical activity over a frequency range covering many decades. Specific cognitive and motor states are associated with oscillations in discrete frequency bands within this range, but it is not known whether interactions and transitions between distinct frequencies are of functional importance. When coexpressed rhythms have frequencies that differ by a factor of two or more interactions can be seen in terms of phase synchronization. Larger frequency differences can result in interactions in the form of nesting of faster frequencies within slower ones by a process of amplitude modulation. It is not known how coexpressed rhythms, whose frequencies differ by less than a factor of two may interact. Here we show that two frequencies (gamma – 40 Hz and beta2 – 25 Hz), coexpressed in superficial and deep cortical laminae with low temporal interaction, can combine to generate a third frequency (beta1 – 15 Hz) showing strong temporal interaction. The process occurs via period concatenation, with basic rhythm-generating microcircuits underlying gamma and beta2 rhythms forming the building blocks of the beta1 rhythm by a process of addition. The mean ratio of adjacent frequency components was a constant – approximately the golden mean – which served to both minimize temporal interactions, and permit multiple transitions, between frequencies. The resulting temporal landscape may provide a framework for multiplexing – parallel information processing on multiple temporal scales.
Rhythmic activity in the EEG occurs over temporal scales from <1 Hz (Steriade, 1999
), through well known EEG bands (2–80 Hz) up to very fast oscillations (Canolty et al., 2006
). Long-term EEG spectra demonstrate a 1/f relationship between power and frequency – a pattern common in other cortical activity patterns and natural dynamic systems (Plenz and Thiagarajan, 2007
). In contrast, spectral analysis of short epochs of EEG activity reveal discrete spectral peaks with underlying network mechanisms that can be related functionally to their associated psychophysical processes (Baker et al., 2006
; Tallon-Baudry et al., 1999
; Womelsdorf et al., 2006
). Many of these rhythms occur with the apparent relationship between adjacent frequencies approximating to the natural log (e) (Buzsaki and Draguhn, 2004
). However, while this observation relates brain activity to other natural dynamical systems, the mechanisms underlying such a distribution of frequencies, and their inter-relationships, remain elusive. In vitro models of rhythmic activity provide a means to study in detail the range of possible, stable oscillatory states capable of being generated in neocortex (Cunningham et al., 2004
; Roopun et al., 2006
).
Linear dynamic techniques have allowed detailed analysis of interrelationships between coexistent rhythms in single cortical areas (Le van Quyen and Bragin, 2007
). From these analyses two main patterns of interaction are apparent. Firstly, a single frequency of population rhythm may be amplitude modulated by a coexistent lower frequency, producing a phenomenon referred to as ‘nesting’ of one frequency in another. This pattern is seen when considering gamma (30–80 Hz) rhythms coexisting with theta (4–12 Hz) frequency oscillations in hippocampus (Bragin et al., 1995
) and entorhinal cortex (Cunningham et al., 2003
). Further examples of this type of temporal interaction include that of very fast oscillations (>80 Hz) within alpha rhythms (Grenier et al., 2001
) and multiple, broad band frequencies within slow wave oscillations (Tononi et al., 2006
). Well structured amplitude modulation of rhythms on multiple scales can be seen in hippocampus, with gamma rhythms nested within theta rhythms, also serving to amplitude modulate very fast oscillations in field potentials (Traub et al., 2003a
) and excitatory synaptic inputs to interneurons (Gloveli et al., 2005
). Secondly, when pairs of frequencies differ by approximately a factor of 2–3, phase synchrony between population rhythms have been seen (Palva et al., 2005
). In this case, for example, a 40 Hz rhythm can be seen to synchronize with a 20 Hz rhythm only on every second period of the faster rhythm. Further ratios of frequencies can be shown to exhibit phase synchrony (Palva and Palva, 2007
), but as yet, for methodological reasons, the ratios (n:m) of frequencies seen experimentally to support this interaction have to be integers. Here we demonstrate the pattern of interaction between coexistent frequencies when the ratio is <2 and non-integer. In this situation we show that modulation of excitatory drive to neocortical networks can produce a number of discrete oscillatory states interrelated in both frequency and period by a novel process of rhythm interaction period concatenation.
Experiment
Horizontal slices of parietal cortex of 450 μm thick were prepared from adult male Wistar rats (150–250 g) following terminal anesthesia with ketamine/xylazine. All procedures were performed in accordance with the UK animals (scientific Procedures) act. Neocortical slices containing secondary somatosensory cortex were maintained at 34°C at the interface between warm wetted 95% O2/5% CO2 and acsf containing (in mM): 3 KCl, 1.25 NaH2PO4, 1 MgSO4, 1.2 CaCl2, 24 NaHCO3, 10 glucose and 126 NaCl. Extracellular recordings from Layers II and V of somatosensory cortex were obtained using glass micropipettes containing the above acsf (resistance <0.5 MΩ). Intracellular recordings of neurons with somata in layer II or V were taken with sharp microelectrodes filled with potassium acetate (resistance 30–90 MΩ). Signals were analog filtered at 2 kHz and digitized at 10 kHz. Coherence and cross corellograms were all calculated from 60 s epochs of field data using Matlab. Unit timing histograms were obtained by measuring the mean temporal separation between concurrent single unit recordings in LII and LV. Relative spike timings were obtained from concurrent intracellular and field recordings, with spikes binned (1 ms width) with respect to the peak positivity in the local field potential on each period.
Model
The mathematical model represents a reduction of a detailed single-column model (Traub et al., 2005
). We implement populations of the four cell types observed in the in vitro preparations. In the superficial layer we include the regular spiking (RS) pyramidal cell, the fast spiking (FS) interneuron, and an inhibitory low threshold spiking (LTS) cell, and in the deep layer the intrinsic bursting (IB) cell. Each individual cell consists of one or three compartments and intrinsic currents consistent with previous models (Cunningham et al., 2004
; Roopun et al., 2006
; Traub et al., 2003b
, 2005
) and the experimental data. We connect the cell populations with chemical and electrical synapses to establish a network model of the two cortical layers. We developed the reduced model to capture the fundamental dynamical characteristics of the activity using simple, yet biophysical, currents and connections.
In the superficial layer we implemented a Pyramidal-Interneuron-Network-Gamma (PING) model with two cells: a RS cell and FS cell. The single compartment RS cell consisted of four intrinsic membrane currents: a transient inactivating sodium current (NaF current), a delayed rectifier potassium current (KDR current), a hyperpolarization activated (or anomalous rectifier) current (h-current), and a leak current. The single compartment FS cell consisted of three intrinsic membrane currents: a NaF current, a KDR current, and a leak current. We also included in the superficial layer a single compartment LTS interneuron with four intrinsic currents: a NaF current, a KDR current, an h-current, and a leak current. We connected the RS and FS cell, and the RS cell and LTS interneuron, with reciprocal synapses, included inhibitory autapses on the FS cell and LTS interneuron, and an inhibitory synapse from the FS cell to LTS interneuron. We did not include fast rhythmic bursting (FRB) neurons in the reduced gamma model. Recent experimental and modeling results suggest that these cells provide excitation via axonal plexus activity downstream from RS pyramidal cell somata to drive neocortical gamma rhythms (Cunningham et al., 2004
). Instead, to avoid the complexity of such a system, while maintaining sufficient phasic drive to interneurons to generate gamma rhythms, we included tonic input currents injected to the RS and FS cells to maintain the gamma rhythm (Borgers et al., 2005
). This simplifying strategy maintains the ability of the network to generate interneuron-mediated PING without the requirement of modeling a large (many thousands of neurons) axonally interconnected array of principal cells.
To model the deep layer beta2 rhythm, we implemented a three compartment reduction of the IB cell (Traub et al., 2005
). The three compartments (an axon, soma, and dendrite) each contained the intrinsic membrane spiking currents: a NaF current, a KDR current, and a leak current. In addition, we included in the axon a muscarinic receptor suppressed potassium current (M-current), and in the dendrite we included an h-current, an M-current, and a high-threshold noninactivating calcium current (CaH current).
To establish population models of the superficial and deep layer activities, we created twenty replications of the RS-FS-LTS cell circuit and of the IB cell. We made all parameters identical for each cell type in the population except for a depolarizing input current which we independently varied for each cell. This heterogeneity resulted in a range of gamma activity (30–50 Hz) in the superficial layer and beta2 activity (20–30 Hz) in the deep layer. We connected the superficial to deep layer with synapses from the LTS interneurons to the IB cell dendrites, and connected the deep to superficial layer with synapses from the IB cell axons to the FS cells and LTS interneurons. In addition, we connected the twenty RS cells together, and the twenty IB cells together, with all-to-all electrical coupling. To model the transition to beta1, we included plastic NMDA synapses from the axonal to dendritic compartments of the IB cell population and decreased the excitation of the network.
Gamma rhythms (38 ± 3 Hz, n = 25) were generated by 400 nM kainate in somatosensory neocortical slices in layers II and III (Cunningham et al., 2004
), whereas beta2 rhythms (24 ± 2 Hz, n = 25) were concurrently generated in layer V (Roopun et al., 2006
) (Figure 1
A). Mean synchrony between laminae II/III and V was approximately 0 (Figure 2
B), but instantaneous synchrony changed rhythmically at frequencies within the EEG beta1 band (15 ± 3 Hz, Figure 2
A). Both rhythms persisted following resection of cortex at the level of layer IV (Roopun et al., 2006
), but this physical separation of the two oscillating layers increased the power of the gamma rhythm significantly (215 ± 29%, n = 6, data not shown). This suggested some functional connectivity between layer V principal cells and superficial layer neurons involved in generating the gamma rhythm (Thomson and Morris, 2002
).
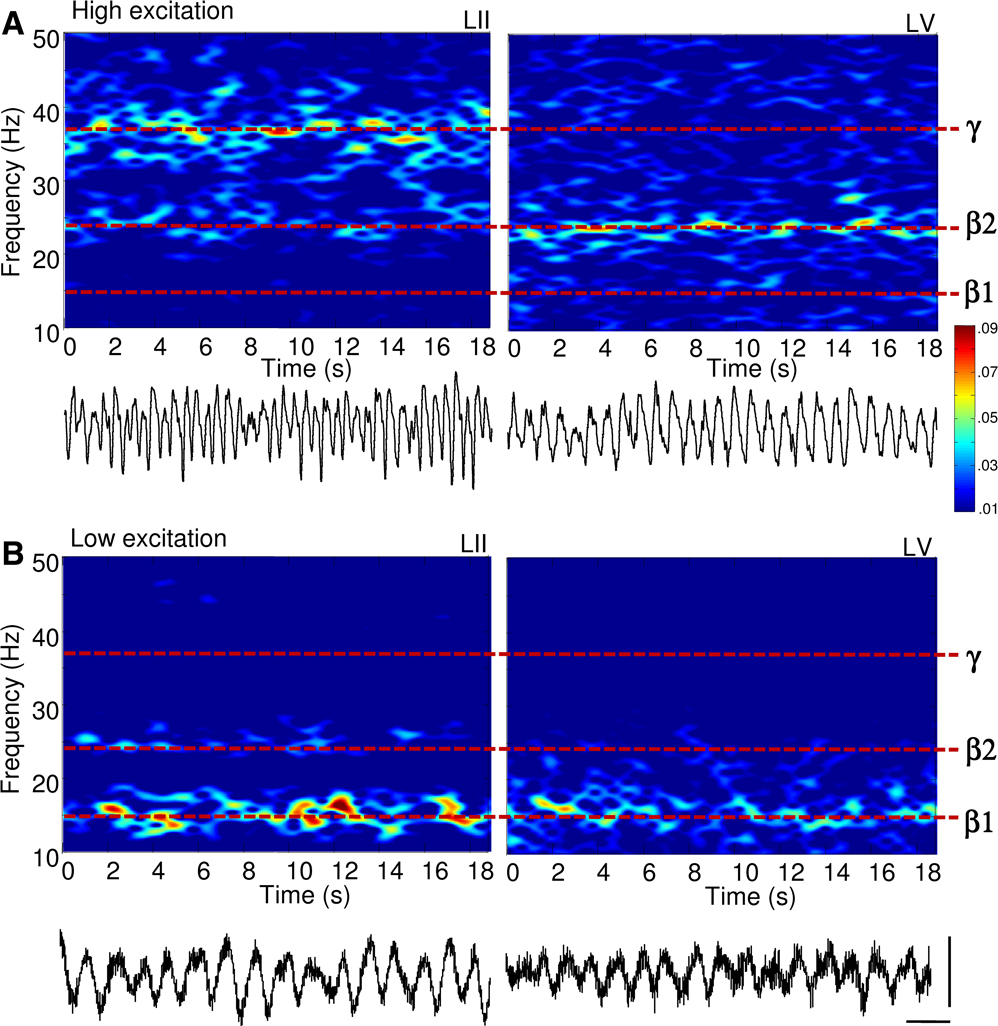
Figure 1. Reduction in excitatory drive to neocortex transforms concurrent gamma (35–45 Hz) and beta2 (22–28 Hz) oscillations into a beta1 (13–18 Hz) rhythm. Spectrograms of local field potential data from LII and LV in rat cortex in vitro. (A) Laminar separation of gamma (LII) and beta2 (LV) frequency population rhythms in the presence of 400 nM kainate. Example traces (1 s epoch) of superficial (layer II), and deep (layer V) recordings showing the nature of the two rhythms are shown below. (B) Acute reduction in glutamatergic excitation in neocortex with 2.5 μM NBQX, following 2 h of stable gamma/beta2 oscillations abolished both field potential rhythms, generating persistent beta1 frequency rhythms in both laminae. Example traces (1 s epochs) of field potential beta1 frequency rhythms in layer II and layer V are shown below. Scale bars 100 ms, 50 μV.
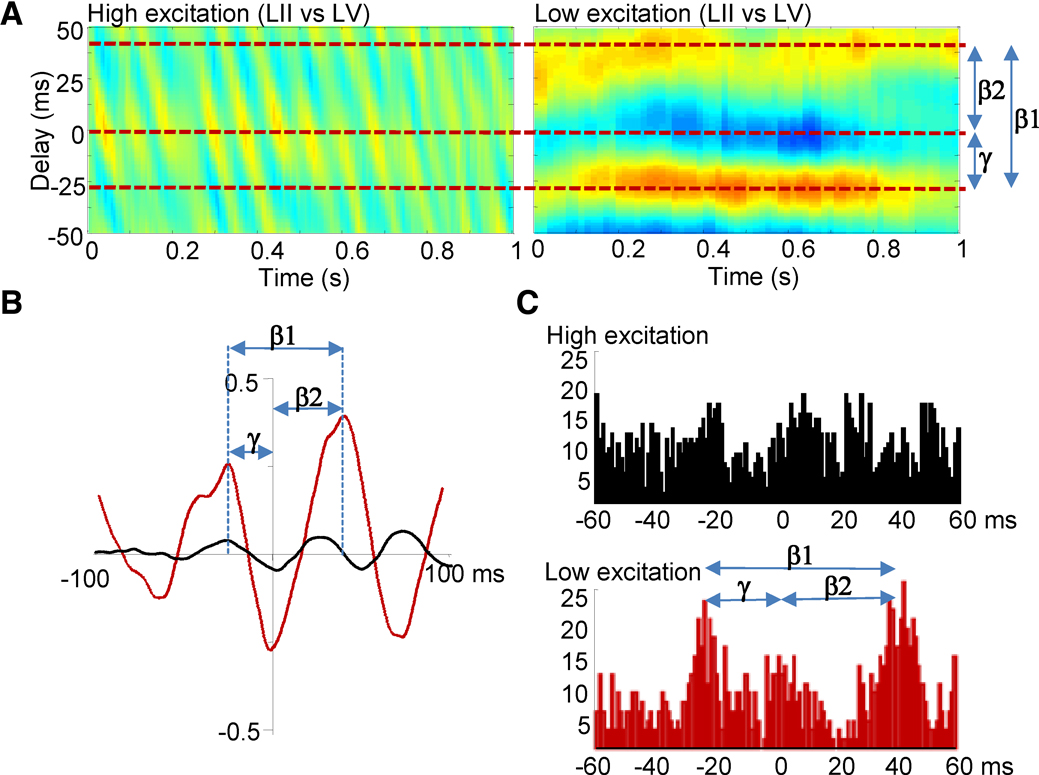
Figure 2. Asymmetric local field potential and spike cross correlations suggest period concatenation across laminae. (A) Cross correlograms from LFP data. During coexpressed gamma and beta2 rhythms (high excitation condition) the phase relationship between LII and LV varied rhythmically at beta1 frequency. When beta1 rhythms were expressed in the local field potential from LII and LV, a phase relationship was seen with LV leading and lagging LII by one gamma and one beta2 period, respectively. (B) Mean cross correlation function between LII and LV (60 epochs of data, n = 5 slices) for coexpressed gamma and beta2 field potentials (black) and beta1 rhythms (red) illustrating the generation of a stable, asymmetric temporal relationship between laminae on reduction in glutamatergic drive. (C) Graphs show distribution of LV units with respect to adjacent LII units during coexpressed gamma/beta2 (black) and beta1 (red) field potential rhythms.
Acute reduction in glutamatergic excitation with 2.5 μM NBQX [to mimic the decay in excitatory drive via neocortical ascending input (Metherate and Cruikshank, 1999
)] abolished population gamma and beta2 rhythms and produced a single beta1 frequency rhythm (15 ± 2 Hz, n = 10) in both layers (Figure 1
B). This persistent rhythm had a significantly lower modal frequency than both the previously expressed beta2 and the gamma rhythms (P < 0.05, n = 10). During beta1 frequency rhythms, local field potentials in deep and superficial cortical layers oscillated with stable phase difference (Figure 2
B), with the rhythmic, beta1 frequency changes in phase between laminae seen during coexpression of gamma and beta2 rhythms now absent (Figure 2
A). Local field potential and unit cross correlations between layers II and V revealed significantly asymmetric side-peaks (Figure 2
C and D). Population activity in LII lagged behind activity in LV by 25 ± 5 ms (n = 25), and activity in LV, in turn, lagged behind LII by 41 ± 3 ms (n = 25, Figure 2
B and C, P < 0.05 comparing the timing of the two side peaks). The temporal distribution of LV units, with respect to LII units, also showed a similar pattern of concatenation, with LII spiking alternately following and preceding LV spikes by 22 ± 6 ms and 40 ± 7 ms, respectively (n = 7, Figure 2
C, P < 0.05). Separation of deep from superficial layers at the level of layer IV abolished the population beta1 rhythm (data not shown). This pattern of period concatenation, and the requirement of connectivity between laminae, suggested that microcircuits in LII and LV were still generating spikes in a manner subject to their respective network time constants, but now in a mutually interdependent manner.
Individual neuronal inputs and outputs, during beta1 population rhythms, revealed the presence of multiple frequency components. The two main principal cell populations [LV intrinsic bursting (n = 7) and LII regular spiking neurons (n = 12)] had unimodal interspike interval distributions corresponding to 2.2 ± 0.4 Hz and 5.9 ± 0.4 Hz, respectively (Figure 3
A). Two subtypes of superficial layer interneurons [fast spiking (FS) and low threshold spiking (LTS)] also had different spike rates. FS interneurons generated outputs at gamma (39 ± 4 Hz, n = 3) and also beta1 and alpha frequencies (Figure 3
A). LTS interneuron output was at beta1 frequency (interspike interval 64 ± 8 ms, n = 5). Excitatory synaptic inputs to these cells were small compared to the control (gamma/beta2 rhythm) condition owing to the presence of NBQX. Modal peaks in the distribution of excitatory potentials were seen at beta1 frequency in all neurons except regular spiking cells, with additional peaks in the theta (6.0 ± 1.6 Hz), alpha (11 ± 2 Hz), beta2 (24 ± 2 Hz) and gamma (42 ± 5 Hz) bands (Figure 3
B). A similar pattern of multiple peaks in the spectra for inhibitory postsynaptic potentials was also seen (Figure 3
C).
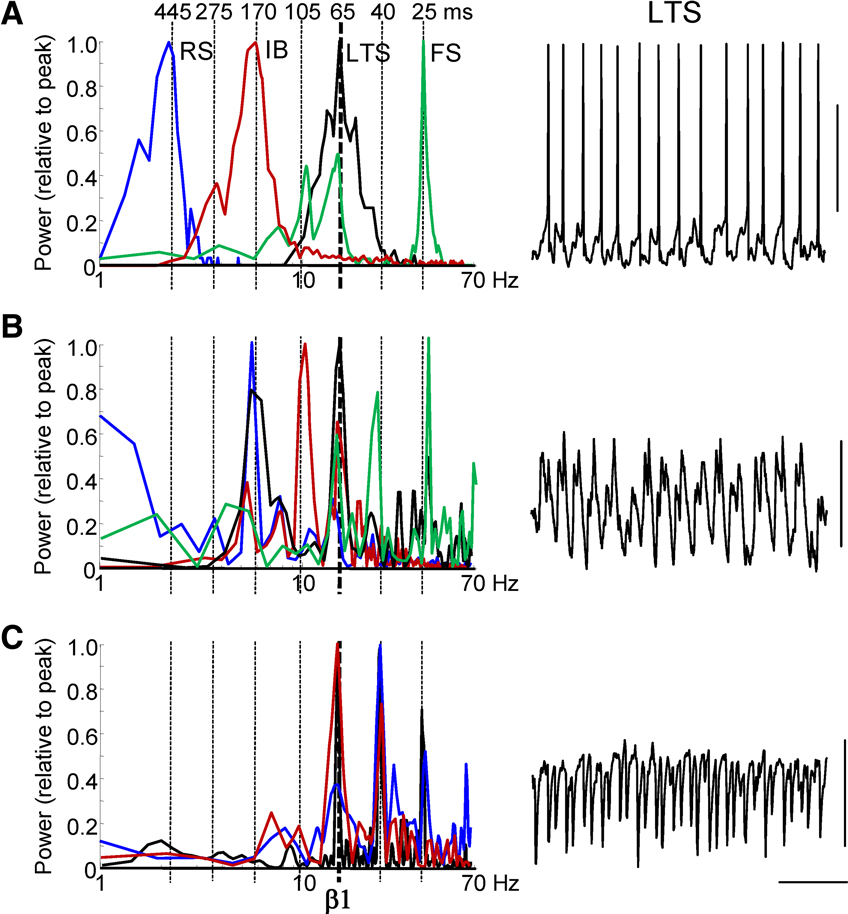
Figure 3. Multiple concatenation sums are evident in spike outputs and synaptic inputs in single neurons. (A) Frequency distribution of intracellularly recorded action potential generation from resting membrane potential (1/interspike interval, n = 500 spikes) during population beta1 rhythm for LII regular spiking cells (RS, blue), LII fast spiking cells (FS, green), LIII low threshold spiking cells (LTS, black) and LV intrinsic bursting cells (IB, red). Vertical dashed lines show successive concatenation sums from the original observed frequencies: gamma (25 ms) and beta2 (40 ms). Example trace shows 1 s epoch of activity from a LIII LTS cell illustrating action potential generation (truncated at −20 mV) at beta1 frequencies. (B) Frequency distribution of excitatory postsynaptic potential (EPSP) inputs to each of the 4 cell types, taken from power spectra (n = 5, 10 s epochs for each cell type) with mean membrane potential held at −70 mV. Example trace is 1 s epoch of EPSP data from an LTS cell. Note the beta1 frequency compound EPSP trains consisting of doublets. (C) Frequency distribution of inhibitory postsynaptic potential (IPSP) inputs to each of the 4 cell types, taken from power spectra (n = 5, 2 s epochs for each cell type) with mean membrane potential held at −30 mV. Example trace is 1 s epoch of IPSP data from an LTS cell. Scale bars 20 mV (A), 2 mV (B), 10 mV (C) and 200 ms.
Both EPSPs and particularly IPSPs in LTS cells revealed evidence for period concatenation (Figure 3
B and C). Fast synaptic excitation and inhibition occurred in doublets during each field beta1 period, phase locked to the local field potential and with a doublet interval of 27 ± 4 ms and 24 ± 6 ms (for EPSPs and IPSPs, respectively, n = 3). Distribution of action potentials in each cell type, temporally averaged with respect to the peak positivity of the local field potential beta1 rhythm, suggested a different source for each component of the EPSP and IPSP doublets. The initial, broader EPSP in the sequence in low threshold spiking cells coincided with burst generation in IB cells whereas the later EPSP coincided with spiking in superficial RS cells (Figure 4
A). The initial IPSP in LTS cells coincided with action potential generation in fast spiking interneurons whereas the later IPSP coincided with low threshold spiking interneuron output.
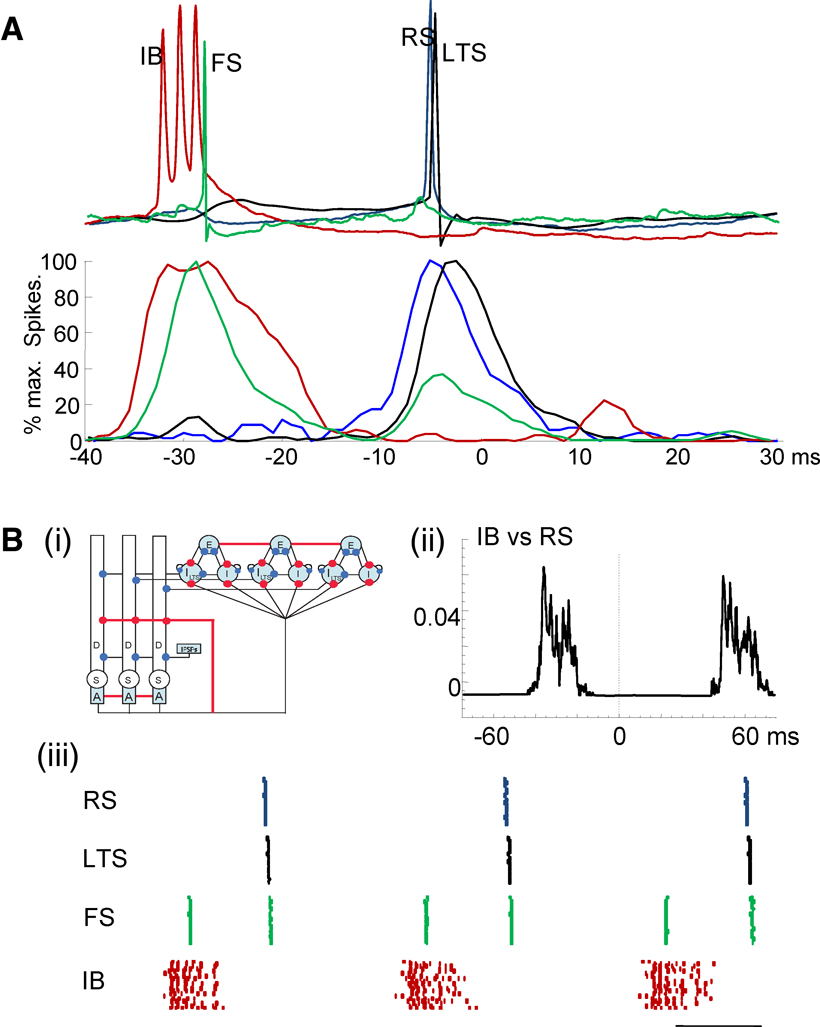
Figure 4. Experimental and computational modeling evidence for recurrent, sequential activation of deep and superficial laminae during the beta1 population rhythm. (A) Example membrane potential changes in each neuron type temporally aligned to peak positivity in concurrently recorded field potentials. Lower graph shows pooled action potential distributions for IB (red), FS (green), RS (blue) and LTS (black) cells. Note IB and superficial layer FS neurons fire approximately one gamma period before RS and LTS cells in superficial layers. (B) (i) Cartoon representation of the computational model. The populations in both layers consist of twenty cells, although we only draw three of each cell type in the figure. The deep layer consists of IB cells of three compartments: D, the dendrite; S, the soma; and A, the axon. The superficial layer contains three cell types: RS cells (E), basket cells (I), LTS cells (LTS). Termination points of excitatory and inhibitory synapses are illustrated by red and blue circles, respectively. We connect all of the IB cell axons and RS cells with gap junctions (indicated by the red lines). (ii) The average cross-correlation between the spiking activity of the RS cell population and IB cell population. (iii) The spiking activity of the superficial layer cells (FS, RS and LTS cells) and layer V (IB cells). Each colored dot represents a spike in a single compartment. The horizontal line indicates 20 ms.
To test whether it was possible for such a sequence of events to generate concatenation of LV beta2 and LII/III gamma frequencies we constructed a model expressing both inter- and intralaminar interactions in LII and LV as suggested by the data (Figure 4
Bi). With high driving conductances the model reproduced the gamma and beta2 rhythms seen in experiments. With reduction of these drives the model readily reproduced both the observed sequence of spike generation and the separation of principal cell spiking (IB and RS) by one gamma period (Figure 4
Bii) within a temporal framework of gamma/beta2 period concatenation (Figure 4
Biii). Both model and data indicated a pattern of events precipitated by IB neuronal activity projected up to superficial fast spiking interneurons, with subsequent rebound spiking of superficial pyramidal cells predominantly activating low threshold spiking neurons. In addition the model predicted that the beta2 component of the concatenated rhythm arose from low threshold spiking interneuronal inhibition of IB neurons, resetting the intrinsic rhythm-generating behavior of this cell population and thus delaying the next burst for one period of this intrinsic beta2 rhythm. This pattern of reset of intrinsic rhythmicity in principal cells appears analogous to that seen for interneuron inputs onto hippocampal principal cells (Cobb et al., 1995
).
Coexistence of multiple discrete frequencies of population rhythm is seen in neocortex (Lakatos et al., 2007
; Womelsdorf et al., 2007
), with interaction between frequencies proposed to underlie aspects of sensory processing (Palva and Palva, 2007
; Womelsdorf et al., 2007
). The pattern of distribution of frequency bands seen here suggests that the distribution of these bands is not random. The mean frequency of the beta1 rhythm was the difference of the mean frequencies of the gamma and beta2 rhythms, and the mean period of the beta1 rhythm was their sum. Also, the ratios of the upper and lower two adjacent bands was the same. Algebraically, this ratio must therefore be the golden mean (approximately 1.6 – the value observed experimentally here). In addition, the formula for the difference of the frequencies implies, from standard trigonometry, that there is a beating frequency at beta1 between the superficial gamma rhythm and the deep beta2 rhythm as observed (Figure 2
A). This relationship between frequency bands appears different from the natural log relationship proposed in Buzsaki and Draguhn (2004)
. However, the two scales are closely related (golden mean ≈ e0.5), suggesting a similar overall temporal structure but with twice as many stable, discrete rhythms – for example with separation of the beta band into functionally (Haenschel et al., 2000
) and mechanistically (the present data) distinct sub-bands.
The mechanisms underlying concatenation of beta2 and gamma frequency rhythms here involves the interaction between oscillations whose peak frequencies are determined by network interactions (the gamma rhythm) and intrinsic neuronal properties (the beta2 rhythm), via a single interneuron subtype – the LTS cell. Some subtypes of LTS cell impart dendritic events with kinetics compatible with beta frequency rhythms in layer V neurons (Silberberg and Markram, 2007
) through interaction between inhibitory postsynaptic events and intrinsic conductances (in particular hyperpolarizing activated conductance Ih). Both excitatory and inhibitory LTS cells have been reported in neocortex (de la Peña and Geijo-Barrientos, 1996
). However, it has been shown that excitatory neurons may change their firing patterns (in a continuum from RS to IB type firing) in a highly labile manner depending on conditions (e.g., ionic composition of the cerebrospinal fluid, neuromodulatory influences) (Steriade, 2004
) making definitive identification of subtle pyramidal neuron subclasses difficult. The pattern of LTS output seen in the present study corresponded (in frequency and phase) with slow inhibitory potentials in layer V IB neurons, suggesting that they were inhibitory. To test whether the same temporal pattern of concatenation could occur with excitatory LTS cells in the circuit we used the model, as described, changing only the profile of LTS cell output from inhibitory to excitatory (Figure 5
). In this case the model did not generate the pauses in firing essential for concatenation – no beta1 rhythm was seen. Instead, both in conditions generating gamma/beta2 rhythms and beta1 rhythms with inhibitory LTS cells, a switch to excitatory LTS cells produced a global, poorly correlated high frequency firing pattern in all cells simulated.
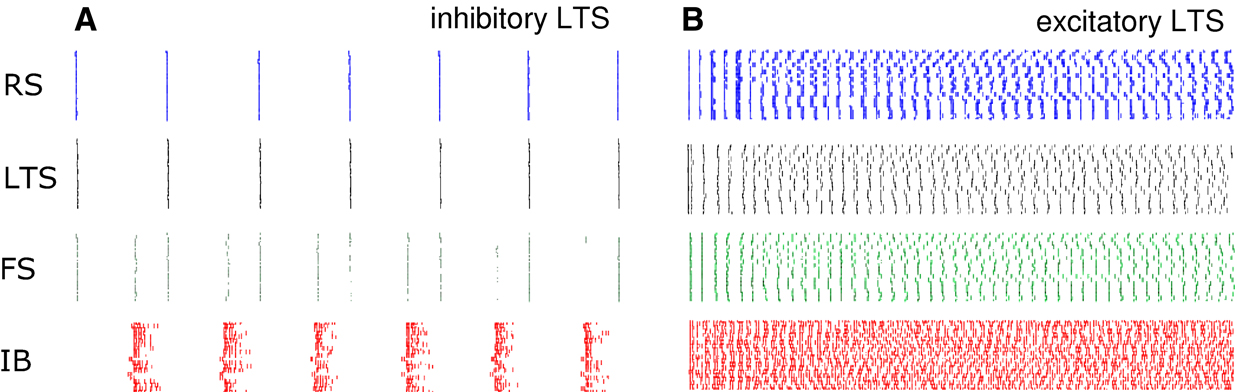
Figure 5. Excitatory LTS neurons do not foster period concatenation in simulations. Simulation results comparing 0.5 s epochs of spike activity (shown as rasters) in each of the 4 cell types, using inhibitory LTS cell output (A) and excitatory LTS cell output (B). All other model parameters were kept the same. With excitatory LTS cells note the absence of pauses in the high frequency firing rates in all cells. RS = regular spiking, superficial layer neuron, LTS = low threshold spiking superficial layer neuron, FS = fast spiking superficial layer interneuron, IB = layer V intrinsic bursting neuron.
The interrelationships between the gamma and beta oscillations seen in the present work suggest a possible general scheme of rhythm concatenation. Event frequencies (spikes, EPSPs and IPSPs) were also seen with modal peaks at delta, theta, alpha and high gamma (c.70 Hz) in neuronal behavior during the field potential beta1 rhythm (see Figure 3
). However, the experimental model used represents a reduced and highly stable rhythm generating environment. Transient, as opposed to persistent, cortical drive generates a broad range of frequencies, and thalamic – and external sensory – involvement in cortical function also generate variable frequencies. For example, thalamocortical spindle oscillations may vary in frequency from within the delta band up to beta frequencies (Destexhe and Sejnowski, 2003
), variable whisking frequency (around the theta/alpha bands) can be matched by oscillations in superficial barrel cortex (Ahissar et al., 1997
) and cortical theta rhythms may be variably paced by the sniff cycle in rodents (Uchida and Mainez, 2003
). Clearly then, a concatenation sequence represents only one aspect of cortical dynamics.
Given its overt expression in isolated, persistently oscillating cortex (as seen here), concatenated sequences of frequency bands may represent a spectral baseline upon which sensory and neuromodulatory influences may act. The functional significance of the ratio between multiple frequencies seen here for gamma and beta rhythms is not yet understood for neuroscience, though it has been much discussed in the context of other natural systems, notably phyllotaxis (Atela et al., 2002
). In the current context, this ratio fosters minimal interference between pairs of co existent frequencies (Figure 6
). It has been suggested that multiple EEG frequencies in humans are arranged as harmonics related to the golden mean (Weiss and Weiss, 2003
). In addition, it has been proposed that sensory information may be handled more efficiently if it is processed along multiple ‘channels’ with differing temporal scales (Wiskott and Sejnowski, 2002
). For example, evidence for the segregation of sensory information into different ‘frequency channels’ is apparent from studies examining how different levels of detail in the visual field are processed (Smith et al., 2006
). In this study perception based on processing coarse level features occurred at theta frequencies whereas perception of objects requiring more detailed features was associated with a faster, beta frequency rhythm. A ratio of c.1.6 between coexpressed frequencies may permit many ‘channels’ for information processing to coexist with minimal temporal interference (multiplexing). A framework of discrete network frequencies, as opposed to a continuum of oscillation states also better fits the discrete anatomical organization of larger scale networks in neocortex into hierarchies and clusters (Sporns et al., 2004
).
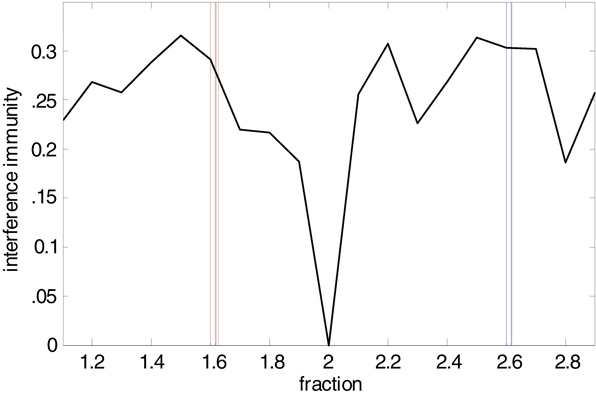
Figure 6. Interference predictions for ratios of frequency pairs. Interference immunity is a simple numerical model used to estimate the degree of interference between peak frequencies occurring at different ratios. It is calculated as follows: First, the starting peak frequency is set to 2 Hz and subsequent peak frequencies up to a limit of 2 kHz are generated by multiplying with a fraction value ranging from 1.1 to 2.9. Second, the interferences between all pairs of peak frequencies are calculated as I(f1, f2) = max [modulo (f1, f2), 1 − modulo (f1, f2)]/f2 where f1 > f2. The potential minimum is 0 which means that an integer multiple of a lower peak frequency f1 equals the higher peak frequency f2. The potential maximum is 0.5 which means that the multiplied frequency of the lower frequency f1 is f1/2 Hz away from f2. The interference immunity represents the average value over all pairs. The graph demonstrates that immunity from interference is maximal around c.1.6 and 2.6 – the former corresponding to the ratios of field potential, EPSP and IPSP frequencies observed, the latter corresponding to ratios for action potential generation, with 2.6 approximately equal to 1.62 (see Figure 3
).
Concatenation of gamma and beta2 rhythms serves to unite activity in these coexistent frequency channels, generating population activity coherent throughout cortical laminae. It is interesting to note that neurons in primary targets for motor activity in neocortex (e.g., the cuneate nucleus) also have resonant frequencies tuned to either beta1 or beta2 frequencies (Sanchez et al., 2006
), suggesting that period concatenation may shape responses to neocortical activity in the periphery. However, it is not yet clear whether interactions between other dominant neocortical rhythms (at alpha and lower frequencies), where adjacent frequency ratios can also be less than two, also demonstrate concatenation.
The present data suggest that cortical activity can be composed of a discrete sequence of stable oscillations with ratios close to the golden mean. In this framework of frequency relationships, interactions between frequencies in the beta and gamma bands are minimized. The phase relationship between two coexistent rhythms is not stable, but the frequency of the concatenation sum is seen in the periodic changes in this phase relationships. Changes in network drive may expose the phase-encoded rhythm in the frequency domain – serving to transform the temporal structure of neocortical activity through period concatenation.
We thank The MRC, The Wolfson Foundation, the NIH and the Royal Society for financial support, and S. Baker for discussion of data.
The authors declare that the research was conducted in the absence of any commercial or financial relationships that could be construed as a potential conflict of interest.