Determining K+ channel activation curves from K+ channel currents often requires the Goldman–Hodgkin–Katz equation
Ion Channel Biophysics Group, National Institute of Neurological Disorders and Stroke, National Institutes of Health, Bethesda, MD, USA
Potassium ion current in nerve membrane, IK, has traditionally been described by IK = gK(V − EK), where gK is the K ion conductance, V is membrane potential and EK is the K+ Nernst potential. This description has been unchallenged by most investigators in neuroscience since its introduction almost 60 years ago. The problem with the IK ∼ (V − EK) proportionality is that it is inconsistent with the unequal distribution of K ions in the intra- and extracellular bathing media. Under physiological conditions the intracellular K+ concentration is significantly higher than the extracellular concentration. Consequently, the slope conductance at potentials positive to EK cannot be the same as that for potentials negative to EK, as the linear proportionality between IK and (V − EK) requires. Instead IK has a non-linear dependence on (V − EK) which is well described by the Goldman–Hodgkin–Katz equation. The implications of this result for K+ channel gating and membrane excitability are reviewed in this report.
Potassium ion current – the primary repolarization mechanism in nerve membrane – has often been described by IK = gK(V, t)(V − EK) where gK is the K+ voltage- and time-dependent conductance, V is membrane potential, and EK is the K+ Nernst potential. This description was given by Hodgkin and Huxley (1952)
in their classic work on squid giant axons. A central assumption of their analysis is that IK is linearly proportional to the driving force (V − EK). Several studies since Hodgkin and Huxley (1952)
including work on squid giant axons (Frankenhauser, 1962
; Binstock and Goldman, 1971
; Siegelbaum et al., 1982
; Clay, 1991
; Taglialatela and Stefani, 1993
) have shown that IK has a non-linear dependence on (V − EK) for physiological conditions which is well described by the Goldman–Hodgkin–Katz equation (Goldman, 1943
; Hodgkin and Katz, 1949
), referred to here for brevity as GHK. The purpose of this review is to describe the GHK result and its implications for both the voltage dependence of gK and models of membrane excitability.
An example of a K+ current–voltage relation from squid giant axons is given in Figure 1
(taken from Clay et al., 2008
). This result has a curvature in the outward direction with increasing membrane depolarization from the rest level. The curve labeled GHK[(V − EK)] represents  which is equivalent to
which is equivalent to
where PK is the membrane’s permeability to K+, F is the Faraday constant, R is the gas constant, T is the absolute temperature, and EK, the Nernst potential, is given by  where
where  and
and  are the extra- and intracellular K+ concentrations, respectively. [Note that
  ]. At room temperature RT/F = 25 mV. Throughout the remainder of this review RT/F is replaced by 25. The value of PK derived from the results in Figure 1
is 1.25 × 10⁻² cm s−1 as compared to 1.2 × 10⁻³ cm s−1 for frog node of Ranvier, the preparation in which the GHK result was first demonstrated (Frankenhauser, 1962
). This comparison suggests that K+ is 10 times more permeable in squid giant axons relative to frog nerve (see Summary). One question which arises from these results is what is the GHK equivalent at the single channel level? K ions are believed to pass through K+ selective channels in a single file manner along a row of three K+ binding sites (Hodgkin and Keynes, 1955
; Zhou et al., 2001
). This result is schematically illustrated in the top left inset of Figure 2
. Two sites are shown to be occupied by a K ion which is consistent with the view of several groups (Hodgkin and Keynes, 1955
; Kohler and Heckmann, 1979
; Shumaker and MacKinnon, 1990
; Clay, 1991
) that a K+ channel contains at most a single “vacancy” and that movement of K+ through the channel can be viewed as movement of the “vacancy” through the channel. The prediction of the model is (Clay, 1991
)
]. At room temperature RT/F = 25 mV. Throughout the remainder of this review RT/F is replaced by 25. The value of PK derived from the results in Figure 1
is 1.25 × 10⁻² cm s−1 as compared to 1.2 × 10⁻³ cm s−1 for frog node of Ranvier, the preparation in which the GHK result was first demonstrated (Frankenhauser, 1962
). This comparison suggests that K+ is 10 times more permeable in squid giant axons relative to frog nerve (see Summary). One question which arises from these results is what is the GHK equivalent at the single channel level? K ions are believed to pass through K+ selective channels in a single file manner along a row of three K+ binding sites (Hodgkin and Keynes, 1955
; Zhou et al., 2001
). This result is schematically illustrated in the top left inset of Figure 2
. Two sites are shown to be occupied by a K ion which is consistent with the view of several groups (Hodgkin and Keynes, 1955
; Kohler and Heckmann, 1979
; Shumaker and MacKinnon, 1990
; Clay, 1991
) that a K+ channel contains at most a single “vacancy” and that movement of K+ through the channel can be viewed as movement of the “vacancy” through the channel. The prediction of the model is (Clay, 1991
)
where and are the extra- and intracellular K+ concentrations, respectively. [Note that ]. At room temperature RT/F = 25 mV. Throughout the remainder of this review RT/F is replaced by 25. The value of PK derived from the results in Figure 1
is 1.25 × 10⁻² cm s−1 as compared to 1.2 × 10⁻³ cm s−1 for frog node of Ranvier, the preparation in which the GHK result was first demonstrated (Frankenhauser, 1962
). This comparison suggests that K+ is 10 times more permeable in squid giant axons relative to frog nerve (see Summary). One question which arises from these results is what is the GHK equivalent at the single channel level? K ions are believed to pass through K+ selective channels in a single file manner along a row of three K+ binding sites (Hodgkin and Keynes, 1955
; Zhou et al., 2001
). This result is schematically illustrated in the top left inset of Figure 2
. Two sites are shown to be occupied by a K ion which is consistent with the view of several groups (Hodgkin and Keynes, 1955
; Kohler and Heckmann, 1979
; Shumaker and MacKinnon, 1990
; Clay, 1991
) that a K+ channel contains at most a single “vacancy” and that movement of K+ through the channel can be viewed as movement of the “vacancy” through the channel. The prediction of the model is (Clay, 1991
)
where a is the frequency of collisions of K ions with the channel, NK is the K+ channel density (typically 100 μ−2 for nerve membrane, Conti et al., 1975
), q is the unit electronic charge, d1 = 0.07, and d2 = 0.18. The parameter a is given by 9.1 × 10⁶ s−1 M−1 which is consistent with the view that the transit time of an ion through a channel is ∼10−7 s (Hille, 2001
). Equation 1 is described by the dashed line labeled “a” in Figure 2
. This result is virtually indistinguishable from the GHK equation for −150 < V < 100 mV and so the simpler GHK result is used for the rest of this review in particular the GHK voltage dependence which is given by
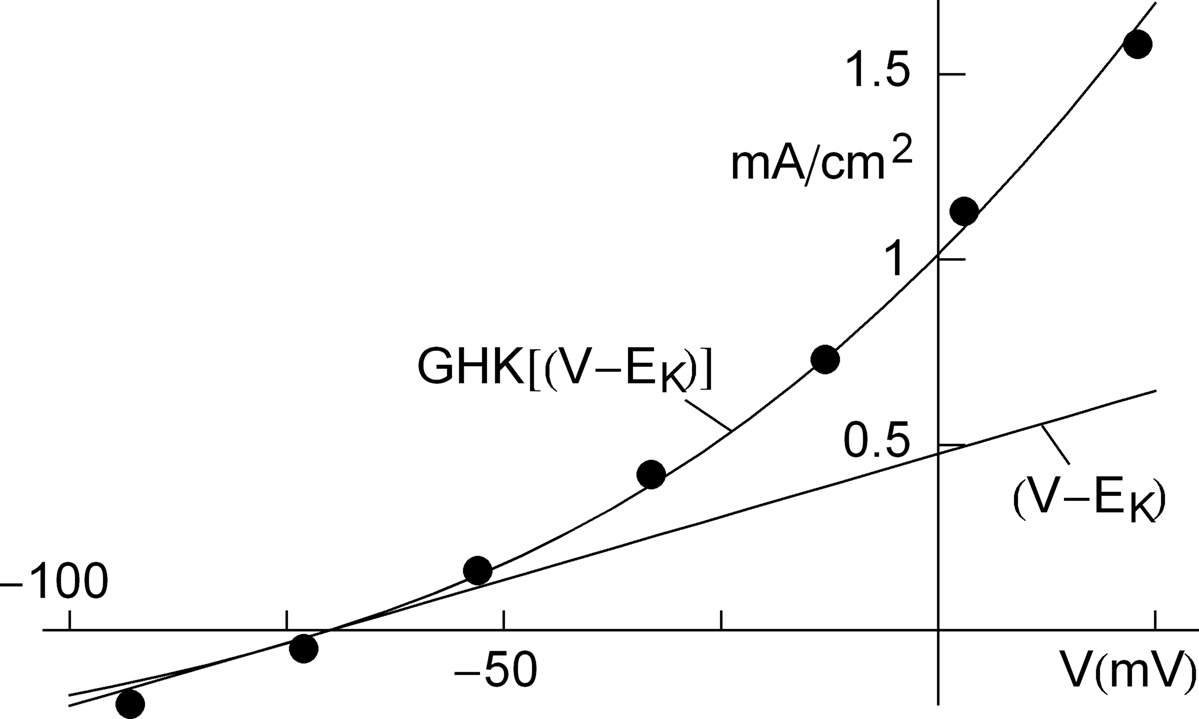
Figure 1. Squid axon IK has a non-linear dependence on (V − EK) which is well described by GHK – Eq. 1 in the text – curve labeled GHK[(V − EK)]. Specifically,  where PK = 1.25 × 10⁻² cm s−1, F is 9.65 × 10⁴ coulombs,
  and RT/F = 25 mV.
where PK = 1.25 × 10⁻² cm s−1, F is 9.65 × 10⁴ coulombs, and RT/F = 25 mV.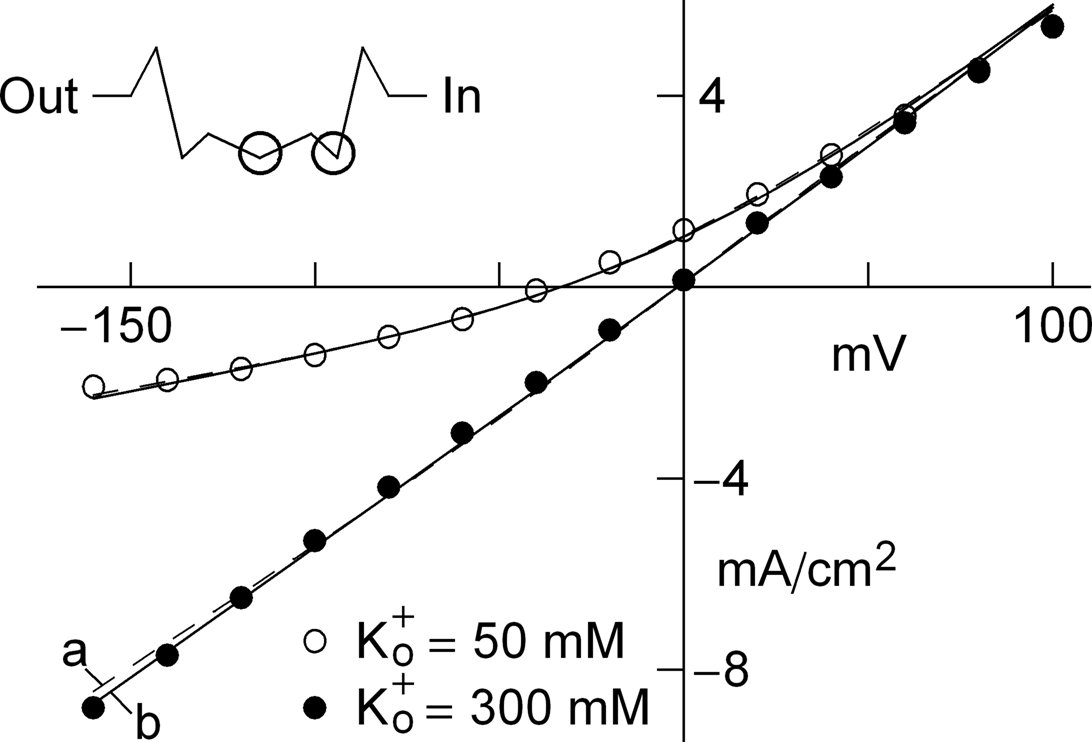
Figure 2.  dependence of IK in squid axons. The solid curves (labeled “b”, for example, in lower left hand corner) are a description of these results by GHK. The dashed lines (labeled “a”) represent Eq. 2 in the text. The diagram in the upper left is a schematic illustration of single “vacancy” ion translocation described in the text.
dependence of IK in squid axons. The solid curves (labeled “b”, for example, in lower left hand corner) are a description of these results by GHK. The dashed lines (labeled “a”) represent Eq. 2 in the text. The diagram in the upper left is a schematic illustration of single “vacancy” ion translocation described in the text.Two primary types of voltage-gated K+ channels in nerve membrane (Jan and Jan, 1997
) are the delayed rectifier (Kv2; Kv3) and the rapidly inactivating K+ channel (Kv4; Kv1.4) often referred to as IA. An example of recordings of the latter are shown in the right hand panel of Figure 3
. These results were obtained from Cajal–Retzius cells in the early postnatal rat brain (Mienville et al., 1999
). Similar results have been observed from many preparations. The IA component is rapidly activated with a depolarizing voltage step followed by a somewhat slower time course of inactivation. Activation is so much more rapid than inactivation that the peak current (IA,p in Figure 3
) can be used as an approximation of the steady-state current which would occur at any given voltage if inactivation were absent. Those results have traditionally been normalized by the driving force (V − EK) as indicated by the open circles in Figure 3
. One of the primary arguments of this review is that this procedure should be replaced by one in which normalization by GHK[(V − EK)] is used instead. The analysis is illustrated in Figure 3
. The open circles were multiplied by (V − EK) to remove the linear normalization. The results thus obtained were divided by GHK[(V − EK)] – Eq. 3 above. This set of points (filled circles) clearly saturate with depolarization. In particular the results for V = 20, 30 and +40 mV are virtually identical. Those results were averaged and that average value was used to normalize all the points. IK activation curves such as those in Figure 3
have traditionally been modeled by the Boltzmann equation, (1 + exp(−(V − V1/2)/k))−1, as illustrated by the dashed curve (Figure 3
) where V1/2 is the voltage of half-maximal activation and k represents its steepness. A better fit to either set of results – the open or the closed circles – can be obtained using a model consisting of several Boltzmann equations. An alternative approach is provided by Hodgkin and Huxley (1952)
. They modeled K+ channel gating (the delayed rectifier) by n(V, t) = −(αn + βn)n(V, t) + αn where 0 ≤ n ≤ 1, and αn and βn are voltage-dependent. They raised the n parameter to the 4th power to account for the sigmoidal time-dependent rise of IK following a voltage step. An n3 model has been used for IA activation kinetics (Campbell et al., 1993
). The activation curve for IA in this model is given by  with αn and βn for the curve (solid line) in given in the legend of Figure 3
. A similar analysis of IA over a broader voltage range is illustrated in Figure 4
(Mienville and Barker, 1997
). The activation curve obtained with GHK normalization clearly saturates with depolarization. In contrast normalization by (V − EK) becomes problematic as increasingly large depolarizations are used (open circles, Figure 4
). This argument has some circularity, although voltage-gated channels have been clearly shown to be steeply voltage-dependent (Sigworth, 2003
), a dependence which can be demonstrated by other procedures such as deactivation, or “tail” current analysis (Zagotta et al., 1994
). The steep voltage dependence is revealed from a family of K+ currents by GHK normalization.
with αn and βn for the curve (solid line) in given in the legend of Figure 3
. A similar analysis of IA over a broader voltage range is illustrated in Figure 4
(Mienville and Barker, 1997
). The activation curve obtained with GHK normalization clearly saturates with depolarization. In contrast normalization by (V − EK) becomes problematic as increasingly large depolarizations are used (open circles, Figure 4
). This argument has some circularity, although voltage-gated channels have been clearly shown to be steeply voltage-dependent (Sigworth, 2003
), a dependence which can be demonstrated by other procedures such as deactivation, or “tail” current analysis (Zagotta et al., 1994
). The steep voltage dependence is revealed from a family of K+ currents by GHK normalization.
Figure 3. GHK analysis of IA. The records in the right were taken from (Mienville et al., 1999
). The scales correspond to 100 ms and 400 pA. The open circles in the graph correspond to peak IA at the respective potential on the x-axis divided by (V − EK) where EK = −96 mV. The filled circles represent peak IA divided by GHK[(V − EK)] – Eq. 3 in the text. The dashed line corresponds to 1/(1 + exp((V − V1/2)/k)), where V1/2 = −17 and k = −18 mV. The solid line corresponds to (αn/(αn + βn))3, where αn = −0.01 (V + 51)/(exp(−0.1(V + 51)) − 1) and βn = 0.125 exp(−(V + 61)/25).
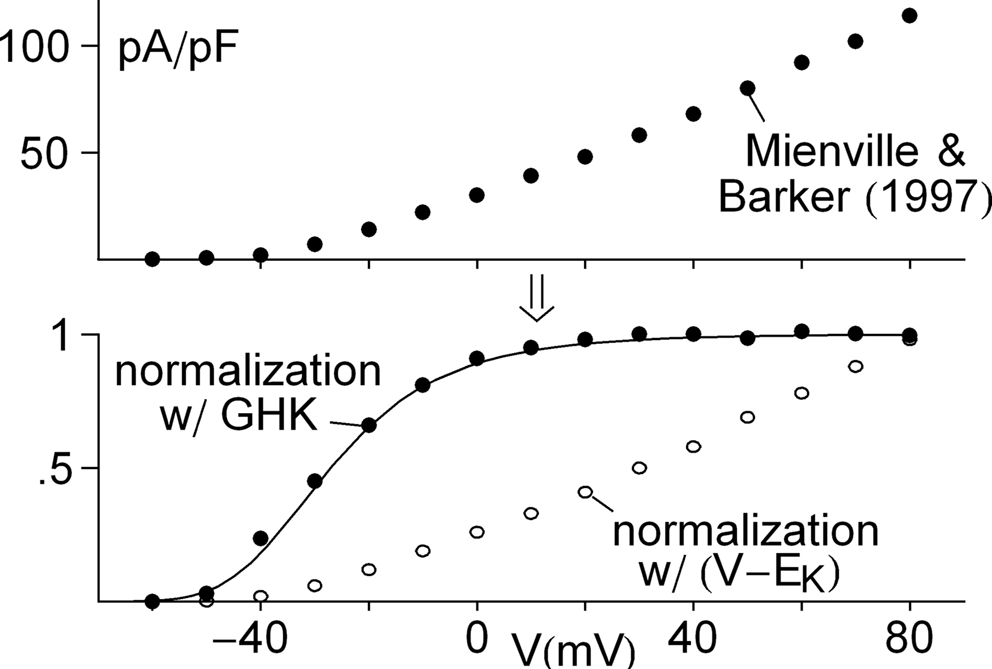
Figure 4. Further evidence for saturation of K+ channel activation with membrane depolarization. The top panel illustrates peak IA results from Mienville and Barker (1997)
. Normalization of those results by GHK[(V − EK)] and (V − EK) are given in the bottom panel. The theoretical curve is a description of the former by (αn/(αn + βn)) with αn = −0.01(V + 41)/(exp(−0.1(v + 41)) − 1) and βn = 0.125 exp(−(V + 41)/25).
Some modeling studies have been carried out concerning the role of IA in neuronal excitability (Connor and Stevens, 1971
; Rush and Rinzel, 1995
), but this issue has not yet been fully resolved (Khaliq and Bean, 2008
). Consequently, the effect of GHK normalization of IA on excitability cannot yet be determined. In contrast the delayed rectifier IK is clearly significant for repolarization of the action potential as demonstrated by Hodgkin and Huxley (1952)
. That analysis uses a linear dependence for IK and (V − EK). A similar result for repolarization is obtained with the GHK relationship for IK (simulations not shown). The IK component is more subtly involved in repetitive firing in the Hodgkin and Huxley (1952)
model. For this result GHK normalization is required. The IK activation curve obtained by Hodgkin and Huxley (1952)
using normalization with (V − EK) is illustrated in Figure 5
(curve labeled  ). This curve has a shallow voltage dependence similar to the IA results (open circles in Figure 3
) which Hodgkin and Huxley described by
). This curve has a shallow voltage dependence similar to the IA results (open circles in Figure 3
) which Hodgkin and Huxley described by  with αn and βn given in the legend of Figure 5
. Normalization of IK in squid giant axons by GHK[(V − EK)] yields a steeper voltage dependent relation (Figure 5
, filled circles). The curve describing those points is the same as in the Hodgkin and Huxley (1952)
model with one change in their βn parameter (Figure 5
legend). This modification is sufficient to describe both the IK activation curve and the response of the axon to long duration depolarizing current pulses (Clay et al., 2008
). The revised model fires only once (middle panel, Figure 6
) which is consistent with experimental results (bottom panel, Figure 6
). In contrast the Hodgkin and Huxley (1952)
model fires an unending train of action potentials in response to a sustained depolarizing current pulse (Figure 6
, top panel). The mechanism underlying this result in the revised model is described in Clay et al. (2008)
.
with αn and βn given in the legend of Figure 5
. Normalization of IK in squid giant axons by GHK[(V − EK)] yields a steeper voltage dependent relation (Figure 5
, filled circles). The curve describing those points is the same as in the Hodgkin and Huxley (1952)
model with one change in their βn parameter (Figure 5
legend). This modification is sufficient to describe both the IK activation curve and the response of the axon to long duration depolarizing current pulses (Clay et al., 2008
). The revised model fires only once (middle panel, Figure 6
) which is consistent with experimental results (bottom panel, Figure 6
). In contrast the Hodgkin and Huxley (1952)
model fires an unending train of action potentials in response to a sustained depolarizing current pulse (Figure 6
, top panel). The mechanism underlying this result in the revised model is described in Clay et al. (2008)
.
). This curve has a shallow voltage dependence similar to the IA results (open circles in Figure 3
) which Hodgkin and Huxley described by with αn and βn given in the legend of Figure 5
. Normalization of IK in squid giant axons by GHK[(V − EK)] yields a steeper voltage dependent relation (Figure 5
, filled circles). The curve describing those points is the same as in the Hodgkin and Huxley (1952)
model with one change in their βn parameter (Figure 5
legend). This modification is sufficient to describe both the IK activation curve and the response of the axon to long duration depolarizing current pulses (Clay et al., 2008
). The revised model fires only once (middle panel, Figure 6
) which is consistent with experimental results (bottom panel, Figure 6
). In contrast the Hodgkin and Huxley (1952)
model fires an unending train of action potentials in response to a sustained depolarizing current pulse (Figure 6
, top panel). The mechanism underlying this result in the revised model is described in Clay et al. (2008)
.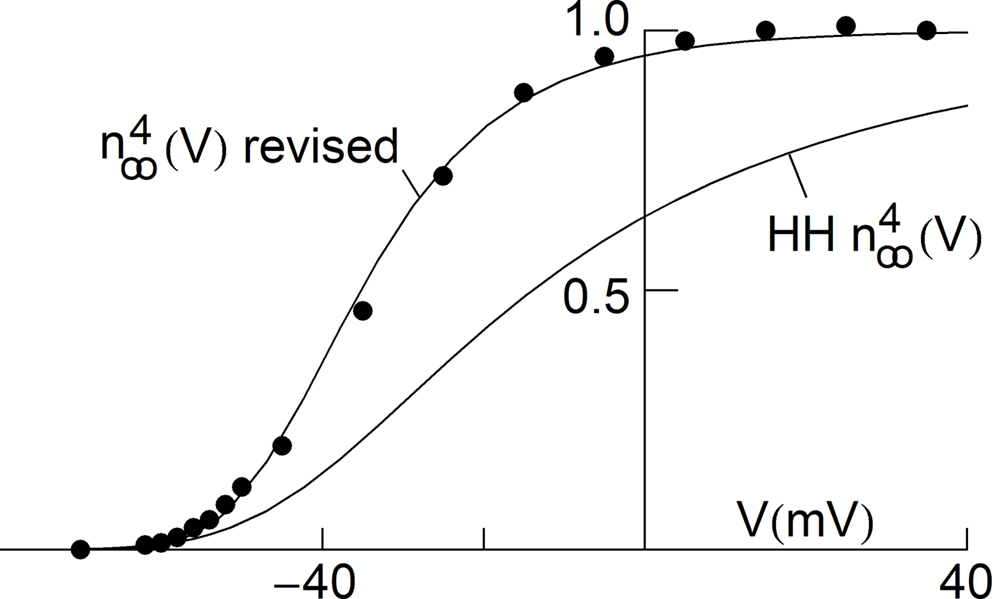
Figure 5. Normalization of squid IK activation by GHK (filled circles). The curve describing these results ( revised) corresponds to (αn/(αn + βn))4 where αn = 0.01(V + 50)/(exp(−0.1(V + 50)) − 1) and βn = 0.125 exp(−(V + 60)/20). The curve labeled HH
  is given by the same equation with βn = 0.125 exp(−(V + 60)/80).
revised) corresponds to (αn/(αn + βn))4 where αn = 0.01(V + 50)/(exp(−0.1(V + 50)) − 1) and βn = 0.125 exp(−(V + 60)/20). The curve labeled HH is given by the same equation with βn = 0.125 exp(−(V + 60)/80).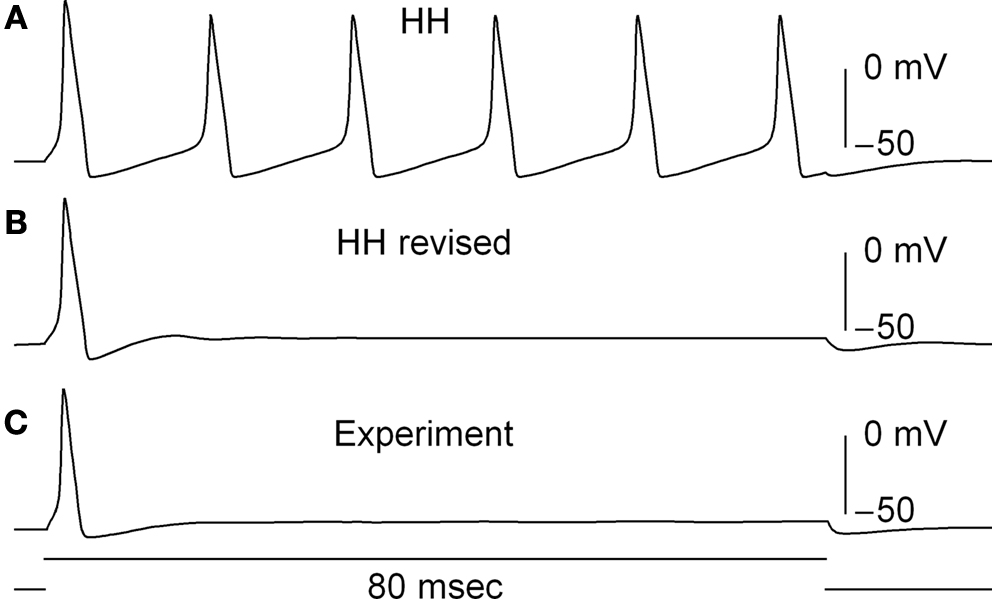
Figure 6. Effect of GHK normalization of IK in a model of squid axon excitability. (A) Prediction of the response of the Hodgkin and Huxley (1952)
model to a sustained depolarizing current pulse. The model fires an unending train of action potentials. (B) Prediction of the revised model (Clay et al., 2008
) with the modified IK activation curve given in Figure 5
. The revised model fires once and only once regardless of pulse duration or amplitude, similar to experimental observations, as illustrated in (C).
A second example of the significance of GHK normalization for models of excitability concerns neurons from the suprachiasmatic nucleus (SCN) in the mammalian brain. These cells fire spontaneously at a relatively low rate, typically 2–8 Hz (Pennartz et al., 2002
; Jackson et al., 2004
; Belle et al., 2009
) which is well mimicked by a recently published ionic model (Sim and Forger, 2007
) as shown in the inset of Figure 7
. A key component of the model is the description of IK by Bouskila and Dudek (1995)
. They obtained the IK activation curve using normalization by (V − EK) – open circles in Figure 7
. Normalization by GHK[(V − EK)] gives the filled circles in Figure 7
. The activation curve is made steeper and shifted leftward on the voltage axis, as with IA from Cajal–Retzius cells and IK in squid axons (Figures 3 and 5
, respectively). This modification in the SCN model removes spontaneous firing thereby yielding a quiescent preparation having a rest potential of −36 mV (Figure 7
inset). The revised model fails to produce an action potential even in response to strong depolarizations (results not shown). The mechanism for this result concerns the relative position and steepness of the “foot” of the IK activation curve (Figure 7
). Removal of INa (addition of TTX) in the original SCN model (Sim and Forger, 2007
) produces quiescence with a rest potential at −62 mV. The revised model rests at −36 mV even with retention of INa. The foot of the IK curve in the original model has a larger value at −40 mV compared to the revised version. Even at −60 mV this curve is significantly greater than 0 (Figure 7
). The foot of the curve in the revised version has a smaller value than the original at −40 mV and is essentially 0 at −60 mV. The revised model allows the “leak” current to depolarize the membrane potential to a level where INa is almost completely inactivated at rest. The original IK curve repolarizes the membrane potential to a level following an action potential at which INa inactivation is incomplete. Consequently, repetitive spontaneous firing of action potentials occurs in the original but not in the revised model.
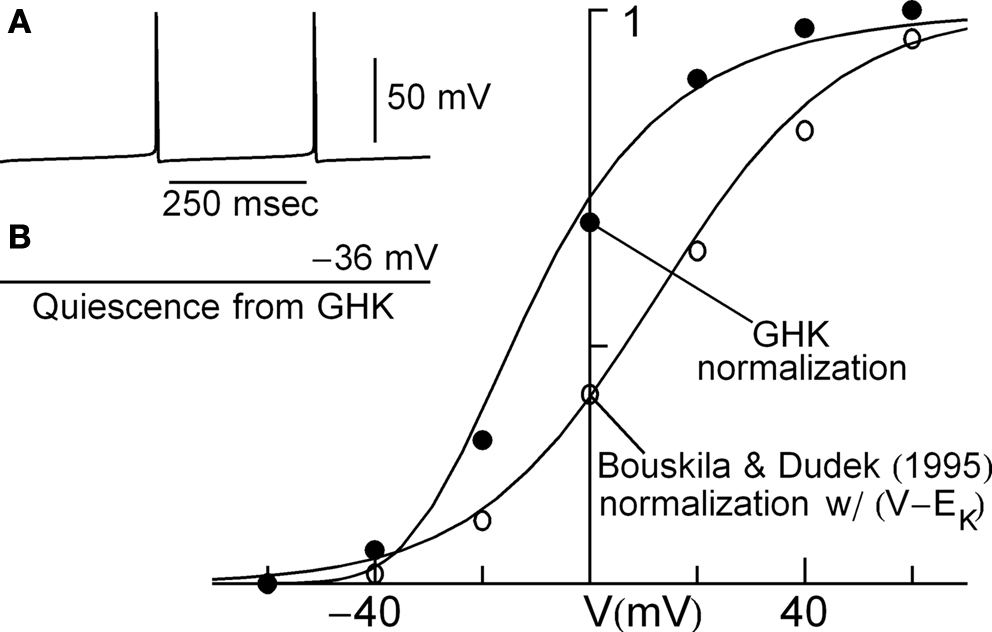
Figure 7. Effect of GHK normalization of IK in a model of electrical activity of neurons from the suprachiasmatic nucleus by Sim and Forger (2007)
. Inset (A) Prediction of the Sim and Forger (2007)
model. (B) Prediction of the model when GHK normalization is used to obtain the gK − V curve from the Bouskila and Dudek (1995)
measurements of IK described to the right. Main panel: description of IK by Bouskila and Dudek (1995)
. They normalized their results with (V − EK) – open circles. The curve describing those results is given by 1/(1 + exp(−(v − 14)/17)). Those points were multiplied by (V − EK) with EK = −97 mV, and then normalized by the GHK procedure to give the filled circles. The curve describing those results is given by (αn/(αn + βn)4 with αn = −0.01(V + 30)/(exp(−0.08(V + 30)) − 1) and βn = 0.125 exp(−(V + 40)/30). This description of IK predicts quiescence in the Sim and Forger (2007)
model as described in the text.
The squid and the SCN results can be summarized by saying that normalization of IK by GHK reduces excitability in models for both preparations. The GHK modification produces agreement between experiment and theory for squid axons but not for SCN neurons. Further modifications in the SCN model will be necessary to bring the model in agreement with experimental results.
External factors can sometimes mask the GHK voltage dependence of the current–voltage relation. An example is provided by the Na+ current in squid axons (Vandenberg and Bezanilla, 1991
). The current–voltage relation of this channel is fundamentally described by GHK[(V − ENa)] as illustrated in Figure 8
(open circles). The curvature of this relation is in the opposite direction to that of GHK[(V − EK)] because the external Na+ concentration is significantly higher than  Na+ channels are blocked in a voltage-dependent manner by extracellular divalent cations (Yamamoto et al., 1984
) which are present in significant amounts in seawater (Ca2+ = 10 mM and Mg2+ = 50 mM), giving a current–voltage relation for physiological conditions which is nearly linear over the voltage range spanned by an action potential (−70 to +40; filled circles in Figure 8
). Normalization of peak INa results by GHK[(V − ENa)] would give an incorrect description of the Na+ channel activation curve in squid. Normalization of those results by (V − ENa) as originally carried out by Hodgkin and Huxley (1952)
is serendipitously correct because of divalent cation block of INa. A similar result may occur for other types of channels. For example, delayed rectifier K+ channels (but apparently not IA K+ channels) are partially blocked by physiological levels of
Na+ channels are blocked in a voltage-dependent manner by extracellular divalent cations (Yamamoto et al., 1984
) which are present in significant amounts in seawater (Ca2+ = 10 mM and Mg2+ = 50 mM), giving a current–voltage relation for physiological conditions which is nearly linear over the voltage range spanned by an action potential (−70 to +40; filled circles in Figure 8
). Normalization of peak INa results by GHK[(V − ENa)] would give an incorrect description of the Na+ channel activation curve in squid. Normalization of those results by (V − ENa) as originally carried out by Hodgkin and Huxley (1952)
is serendipitously correct because of divalent cation block of INa. A similar result may occur for other types of channels. For example, delayed rectifier K+ channels (but apparently not IA K+ channels) are partially blocked by physiological levels of  for V > 0 mV (Bezanilla and Armstrong, 1972
) which can confound the activation curve analysis for high-voltage-activated channels such as Kv3.1 and Kv3.2 (Hernandenz-Pineda et al., 1999
). In particular, Nai block of IK can give an apparent saturation of channel activation using normalization by (V − EK), a result which would not be found in the absence of
for V > 0 mV (Bezanilla and Armstrong, 1972
) which can confound the activation curve analysis for high-voltage-activated channels such as Kv3.1 and Kv3.2 (Hernandenz-Pineda et al., 1999
). In particular, Nai block of IK can give an apparent saturation of channel activation using normalization by (V − EK), a result which would not be found in the absence of  At some point in the experimental description of an ionic current in any preparation a measurement of the current–voltage relation of the channel is required to determine the appropriateness of GHK for those results.
Na+ channels are blocked in a voltage-dependent manner by extracellular divalent cations (Yamamoto et al., 1984
) which are present in significant amounts in seawater (Ca2+ = 10 mM and Mg2+ = 50 mM), giving a current–voltage relation for physiological conditions which is nearly linear over the voltage range spanned by an action potential (−70 to +40; filled circles in Figure 8
). Normalization of peak INa results by GHK[(V − ENa)] would give an incorrect description of the Na+ channel activation curve in squid. Normalization of those results by (V − ENa) as originally carried out by Hodgkin and Huxley (1952)
is serendipitously correct because of divalent cation block of INa. A similar result may occur for other types of channels. For example, delayed rectifier K+ channels (but apparently not IA K+ channels) are partially blocked by physiological levels of for V > 0 mV (Bezanilla and Armstrong, 1972
) which can confound the activation curve analysis for high-voltage-activated channels such as Kv3.1 and Kv3.2 (Hernandenz-Pineda et al., 1999
). In particular, Nai block of IK can give an apparent saturation of channel activation using normalization by (V − EK), a result which would not be found in the absence of At some point in the experimental description of an ionic current in any preparation a measurement of the current–voltage relation of the channel is required to determine the appropriateness of GHK for those results.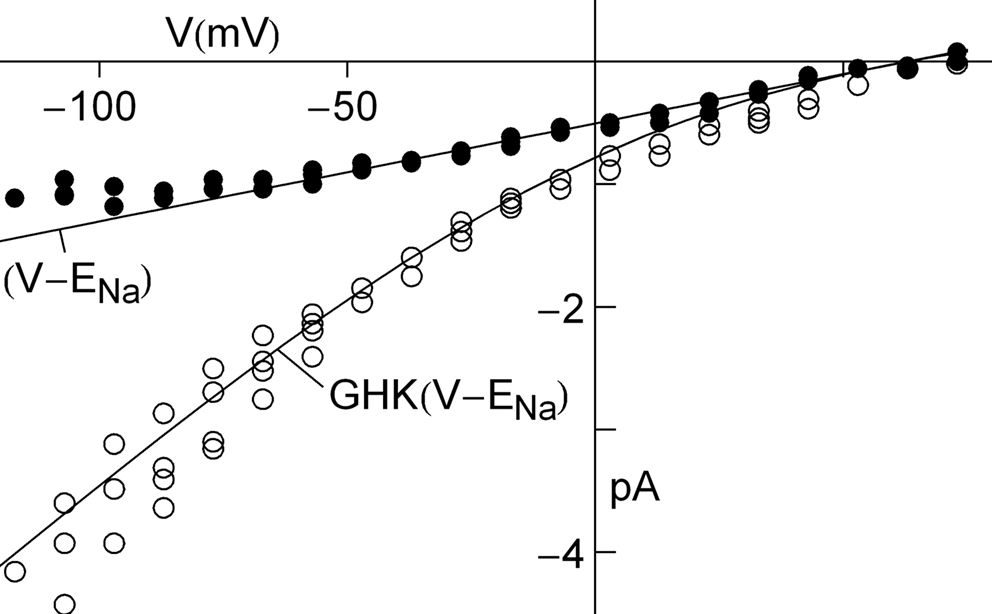
Figure 8. GHK analysis of Na+ current in squid giant axons (Vandenberg and Bezanilla, 1991
). The open circles were obtained using divalent-free artificial seawater. The filled circles were obtained under normal divalent cation conditions, Ca2+ = 10 mM and Mg2+ = 50 mM. The latter results are well described by (V − ENa) over the range of potentials spanned by an action potential (−70 to +40 mV) because of partial, voltage-dependent block of INa by Ca2+ and Mg2+.
The results reviewed here are surprising for some investigators. The relation I = g(V − E) with E ≠ 0 as is the case for most ions under physiological conditions has dogmatic status in neuroscience. The simplicity of this equation may be one of the reasons it has been largely unchallenged. Experimental observations have shown that the current–voltage relation for ion channels rectifies in a manner determined by the respective extra- and intracellular concentrations of the ion in question. The strongest evidence for this result for K+ channels are the single channel recordings in Apysia sensory neurons by Siegelbaum et al. (1982)
in physiological conditions ( – the K+ concentration of seawater). The voltage dependence of those results is well described by the GHK equation. Given the similarity of K+ currents for most if not all cell types, similar results would be expected for single channel recordings from other preparations.
– the K+ concentration of seawater). The voltage dependence of those results is well described by the GHK equation. Given the similarity of K+ currents for most if not all cell types, similar results would be expected for single channel recordings from other preparations.The non-linearity of the GHK equation is removed for equimolar conditions, i.e.,  In many preparations the extracellular medium can be exchanged for one in which this condition is obtained, i.e., an increase in
  to closely match
  Depolarizing voltage steps from a relatively negative holding potential as was used for the IA results in Figures 3 and 4
would elicit inward K+ currents for these conditions for V < 0 mV. The activation curve from those results could be obtained using linear voltage normalization without introducing the error described in this report when normalizing K+ currents in physiological conditions by (V − EK). Alternatively, as noted above, tail currents could be used for this analysis without increasing
Depolarizing voltage steps from a relatively negative holding potential as was used for the IA results in Figures 3 and 4
would elicit inward K+ currents for these conditions for V < 0 mV. The activation curve from those results could be obtained using linear voltage normalization without introducing the error described in this report when normalizing K+ currents in physiological conditions by (V − EK). Alternatively, as noted above, tail currents could be used for this analysis without increasing  Tail currents are usually measured at a fixed potential (the holding potential) which would eliminate the GHK nonlinearity in the analysis of the gK − V curve. However, this approach is not feasible for some types of K+ channels, in particular IA. Tail currents from IA are typically too small to be reliably measured given the strong inactivation of this component which occurs with membrane depolarization. Consequently, normalization of a family of currents by GHK[(V − EK)] is particularly relevant for IA.
In many preparations the extracellular medium can be exchanged for one in which this condition is obtained, i.e., an increase in to closely match Depolarizing voltage steps from a relatively negative holding potential as was used for the IA results in Figures 3 and 4
would elicit inward K+ currents for these conditions for V < 0 mV. The activation curve from those results could be obtained using linear voltage normalization without introducing the error described in this report when normalizing K+ currents in physiological conditions by (V − EK). Alternatively, as noted above, tail currents could be used for this analysis without increasing Tail currents are usually measured at a fixed potential (the holding potential) which would eliminate the GHK nonlinearity in the analysis of the gK − V curve. However, this approach is not feasible for some types of K+ channels, in particular IA. Tail currents from IA are typically too small to be reliably measured given the strong inactivation of this component which occurs with membrane depolarization. Consequently, normalization of a family of currents by GHK[(V − EK)] is particularly relevant for IA.The terms permeability and conductance have been widely used throughout the neuroscience literature. Permeability, P, has units of cm/sec. A comparison of Eqs 1 and 2 demonstrates that at the single channel level PK ∼ aqNKF−1 which also has units of cm/sec with a being a factor describing collisions of K ions with the membrane, q is the elementary electronic charge, NK is the K+ channel density, and F is the Faraday. A single value of P is sufficient and appropriate for the current–voltage (I–V) relation of K+ channels for physiological conditions. The non-linearity of the I–V result is given by the other terms either in Eq. 1 or 2. A single value of conductance, G, cannot be used for the I–V curve for physiological conditions. The slope conductance can be used, but that number changes with voltage. For example, the delayed rectifier channel in squid axons is typically described as having a single channel conductance of 20 pS for physiological conditions (Llano et al., 1988
). Those results were obtained for V = +50 mV. According to the GHK voltage dependence (Eq. 3), the single channel (slope) conductance at V = −50 mV would be 2 pS. A single value of G can be used for equimolar conditions, i.e.,  For those conditions IK = PKF(FV/RT)K+ = GKV, or GK = PKF2K+/(RT). At the single channel level, GK = γKNK, where γK is the single channel conductance. From the above discussion concerning permeability, this expression is comparable to aqNKFK+/(RT), so that γK ≈ aqK+/(25 mV), given that RT/F = 25 mV at room temperature. This expression is only an approximation primarily to give a sense of the units of the various terms involved. The detailed mechanism of ion translocation through K+ selective channels at the molecular level of channel proteins is a topic of on-going research (Berneche and Roux, 2001
; Fowler et al., 2008
; and many other reports referenced in these studies).
For those conditions IK = PKF(FV/RT)K+ = GKV, or GK = PKF2K+/(RT). At the single channel level, GK = γKNK, where γK is the single channel conductance. From the above discussion concerning permeability, this expression is comparable to aqNKFK+/(RT), so that γK ≈ aqK+/(25 mV), given that RT/F = 25 mV at room temperature. This expression is only an approximation primarily to give a sense of the units of the various terms involved. The detailed mechanism of ion translocation through K+ selective channels at the molecular level of channel proteins is a topic of on-going research (Berneche and Roux, 2001
; Fowler et al., 2008
; and many other reports referenced in these studies).One final point concerning the utility of the GHK equation for models of membrane excitability is that it permits a straightforward determination of IK when  conditions which are problematic for IK ∼ (V − EK) since EK is undefined for
  (Clay, 1998
). [Note that
(Clay, 1998
). [Note that  exp (V/25) when
  The observation that PK in squid axons is 10 times higher than in frog nerve may be of historical interest. The action potential of squid giant axons has a robust after-hyperpolarization potential (AHP) (Hodgkin and Huxley, 1952
), whereas frog nerve does not (Frankenhauser and Huxley, 1964
). The difference in PK’s provides an explanation for these results.
The observation that PK in squid axons is 10 times higher than in frog nerve may be of historical interest. The action potential of squid giant axons has a robust after-hyperpolarization potential (AHP) (Hodgkin and Huxley, 1952
), whereas frog nerve does not (Frankenhauser and Huxley, 1964
). The difference in PK’s provides an explanation for these results.
conditions which are problematic for IK ∼ (V − EK) since EK is undefined for (Clay, 1998
). [Note that exp (V/25) when The observation that PK in squid axons is 10 times higher than in frog nerve may be of historical interest. The action potential of squid giant axons has a robust after-hyperpolarization potential (AHP) (Hodgkin and Huxley, 1952
), whereas frog nerve does not (Frankenhauser and Huxley, 1964
). The difference in PK’s provides an explanation for these results.The primary thrust of this review concerns the use of GHK normalization to obtain ion channel activation curves for the delayed rectifier IK and for IA. A number of groups (DeFazio and Moenter, 2002
; Boland et al., 2003
; Van Hoorick et al., 2003
; Persson et al., 2005
; Nakamura and Takahashi, 2007
; Johnston et al., 2008
; Dementieva et al., 2009
; Sculptoreanu et al., 2009
) have recently used the procedure outlined here and in a previous report from this laboratory (Clay, 2000
) to obtain these results. One of the purposes of this review is to encourage others to do the same. An accurate description of K+ channel activation curves is important for models of neuronal excitability as illustrated by the above examples – squid giant axons and SCN neurons – and for models of K+ channel gating. Model building for the excitability properties of neurons in the mammalian brain is an evolving discipline. The analysis given here is one issue which should be kept in mind when constructing models of this type.
This research was conducted in the absence of any commercial or financial relationships that could be construed as a potential conflict of interest.
This work was supported by the Intramural Research Program of the National Institute of Neurological Disorders and Stroke, National Institutes of Health, Bethesda, MD, USA.
Hernandenz-Pineda, R., Chow, A., Amarillo, Y., Moreno, H., Saganech, M., de Miera, V.-S., Hernandez-Cruz, A., and Rudy, B. (1999). Kv3.1-Kv3.2 channels underlie a high voltage-activating component of the delayed rectifier K+ current in projecting neurons from the globus pallidus. J. Neurophysiol. 82, 1512–1528.