1
W. M. Keck Foundation Laboratory of Neurobiology, Center for Neural Science, New York, USA
2
CSTS, Department of Psychiatry, USU, Bethesda, USA
3
CNRS-UMR8620, NAMC, Universitè Paris-Sud, Orsay, France
4
Queens College and the Graduate Center, CUNY, NY, USA
Synaptic changes at sensory inputs to the dorsal nucleus of the lateral amygdala (LAd) play a key role in the acquisition and storage of associative fear memory. However, neither the temporal nor spatial architecture of the LAd network response to sensory signals is understood. We developed a method for the elucidation of network behavior. Using this approach, temporally patterned polysynaptic recurrent network responses were found in LAd (intra-LA), both in vitro and in vivo, in response to activation of thalamic sensory afferents. Potentiation of thalamic afferents resulted in a depression of intra-LA synaptic activity, indicating a homeostatic response to changes in synaptic strength within the LAd network. Additionally, the latencies of thalamic afferent triggered recurrent network activity within the LAd overlap with known later occurring cortical afferent latencies. Thus, this recurrent network may facilitate temporal coincidence of sensory afferents within LAd during associative learning.
The lateral amygdala (LA) is a key structure for the acquisition and expression of associative memory formed during Pavlovian auditory fear conditioning (LeDoux, 2000
; Maren and Quirk, 2004
). Synaptic plasticity occurs at auditory thalamic and cortical input synapses in LA, especially in the dorsal subnucleus of LA (LAd) (Quirk et al., 1995
; Repa et al., 2001
; Rogan et al., 1997
) which is believed to underlie, at least in part, the storage of conditioned fear memories (Blair et al., 2001
; Collins and Pare, 2000
; Davis, 2004
; Dityatev and Bolshakov, 2005
; LeDoux, 2003
; Medina et al., 2002
; Pare et al., 2004
; Rodrigues et al., 2004
; Sah et al., 2003
). While much is known about the underlying cellular mechanisms responsible for synaptic plasticity in LA (Dityatev and Bolshakov, 2005
; Doyère et al., 2007
; Humeau et al., 2003
; Pare et al., 2004
; Rodrigues et al., 2004
; Schafe et al., 2008
), it is not known, however, how the temporally segregated sensory signals interact to produce associative plasticity and memory in LA (Debiec et al., 2006
; Gewitz and Davis, 1997
; Humeau et al., 2003
).
The computational capabilities of neural structures that learn and form memories are generally thought be defined by their functional architecture (Nakazawa et al., 2002
; Silberberg et al., 2005
). Beyond membrane oscillations in LA in response to learning (Pape et al., 1998
; Pare et al., 2002
; Seidenbecher et al., 2003
), little is known about either the behavior or the functional organization of the internal network in the LA, especially in the context of conditioned fear memories (Johnson and LeDoux, 2004
; McDonald, 1984
; Pare et al., 1995b
; Pitkänen et al., 2003
; Samson et al., 2003
).
In the present study, we sought to test whether the LA network has reverberant properties that would allow temporally segregated inputs to converge and promote plasticity. To do this, we developed an analytic method to identify time-locked depolarizations in the evoked field potential (FP) triggered by sensory afferent stimulation. We used this to examine whether synchronized activity is represented in a recurrent network in LA, and whether this reflects internal activity within LAd or extrinsic inputs. Our data show that the LAd forms a temporally structured recurrent network with feedback from within the LAd, including ventral to dorsal propagation. The polysynaptic responses display synaptic plasticity and are NMDA dependent. We also observed that the network is temporally organized to allow convergence between thalamic and cortical inputs within a 40-ms window. This temporal convergence mediated by intra LA recurrent activity may allow for Hebbian temporal coincidence between subcortical and cortical afferents to the LA.
Overview
The evoked polysynaptic FP in the LA has not been previously systematically studied. Therefore our first step was to describe its nature and to categorize its properties. Below we describe the methods used to obtain the evoked FPs and also the results of this characterization that will be useful for studying LA network properties.
We recorded FPs in the LA evoked by stimulation of the auditory thalamus sensory pathway (Huang and Kandel, 1998
; Weisskopf and LeDoux, 1999
) in vitro and the auditory thalamus in vivo (Doyère et al., 2003
, 2007
). In addition to the initial monosynaptic response, the FP was also comprised of multi-peak polysynaptic responses (Cruikshank et al., 2002
; Kudoh and Shibuki, 1997
; Metherate and Cruikshank, 1999
; Mitzdorf, 1985
). We have developed a novel methodology for the reliable identification of polysynaptic responses across animals. We hypothesized that this reliable activity across different animals would reflect aspects of the intrinsic LA network structure (Cruikshank et al., 2002
; Hebb, 1949
; Kudoh and Shibuki, 1997
; Mitzdorf, 1985
). We first identified both observable and hidden peaks (peaks summated within larger peak, usually indicated by change in negative slope) from the FP waveform using automated peak fitting. Because any single stimulation may trigger events that could represent both random and reliable responses, we used an inferential statistical method to extract temporally invariant peaks across animals. These time-locked peaks (TLPs) were then studied in order to ascertain the LA network structure, and its pharmacological properties and propensity for synaptic plasticity.
In vitro Electrophysiology
In order to obtain data on the polysynaptic activity of the LA that may represent aspects of the intra LA network, we recorded extracellular FPs in the LAd in vitro in response to local bipolar current stimulation of the auditory thalamic afferent pathway (Huang and Kandel, 1998
; Huang et al., 2000
; Humeau et al., 2003
; Lamprecht et al., 2006
; LeDoux et al., 1990
; Tsvetkov et al., 2004
; Weisskopf and LeDoux, 1999
; Weisskopf et al., 1999
). Brain slices were prepared from Sprague-Dawley rats aged 4–7 weeks (n = 42). Once deeply anesthetized with 100 mg/kg ketamine + 10mg/ml xylazine, 400 μm coronal brain slices were prepared. Recordings were made at room temperature with a flow rate
1.5–2.5 ml/min. ACSF (in mM) 115 NaCl, 3.3 KCl, 1 MgSO4, 2 CaCl2, 25.5 NaHCO3, 1.2 NaH2PO4, 5 lactic acid and 25 glucose, equilibrated with 95% O2/5% CO2. FP or whole cell patch recordings were made with electrodes filled with ACSF (in mM) 130 K-gluconate, 0.6 EGTA, 2 MgCl2, 5 KCl, 10 Hepes, 2 Mg-ATP, 0.3 Na3-GTP and 0.5% Neurobiotin. Bipolar stimulating electrodes were placed to activate presumed thalamic afferents and stimulation intensities were adjusted to record a monosynaptic potential of approximately half-maximal amplitude (100–600 μA, 150 μs). LTP was induced with 100 stimulation pulses delivered at 100 Hz, ×3 at 90 s intervals for the polysynaptic experiment, and for the direct monosynaptic LAd-i to LAd-s experiment LTP was induced with 100 stimulation pulses delivered at 100 Hz, ×5 at 3 min intervals. FPs and WCP recordings were amplified (×100), filtered (2 kHz), digitized at 5 kHz, and stored on discs, then
averaged (n = 30–50) for off-line analysis. Principal neurons (PNs) were identified electrophysiologically based on their response to current injection (Faber et al., 2001
; Humeau et al., 2003
; Pare et al., 1995a
; Rainnie et al., 1991
; Weisskopf and LeDoux, 1999
; Weisskopf et al., 1999
). PNs displayed spike frequency adaptation and long duration amplitude action potentials.
Characterization of the Local Nature of the Evoked Field Potential (FP) in the LA
We optimized extracellular field recordings in order to best identify and characterize local network activity. In order to constrain the area from which evoked voltage recordings were obtained, we used relatively high impedance recording electrodes (4–7 Mω) in vitro. Within the first 50 ms, we observed multi-component voltage events (Cruikshank et al., 2002
; Haberly and Shepherd, 1973
; Kudoh and Shibuki, 1997
; Luhmann and Prince, 1990
; Metherate and Cruikshank, 1999
; Mitzdorf, 1985
). In the presence of PTX (75 μM), the positive (upward) components were strongly reduced and the negative (downward) waveforms enhanced, resulting in FPs with multiple negative wave deflections (Figure 1
A). All in vitro experiments were then performed in the presence of PTX. Following the stimulation artifact, all but one of the multi-potentials were removed by glutamatergic antagonists (10 μM CNQX + 100 μM APV) (Figure 1
B), suggesting that the remnant potential reflects a presynaptic “fiber volley” (FV) (Mitzdorf, 1985
) (Figure 1
B), and that all the other negative potentials are products of glutamatergic dependent polysynaptic activity (Cruikshank et al., 2002
; Haberly and Shepherd, 1973
; Kudoh and Shibuki, 1997
; Luhmann and Prince, 1990
; Metherate and Cruikshank, 1999
; Mitzdorf, 1985
).
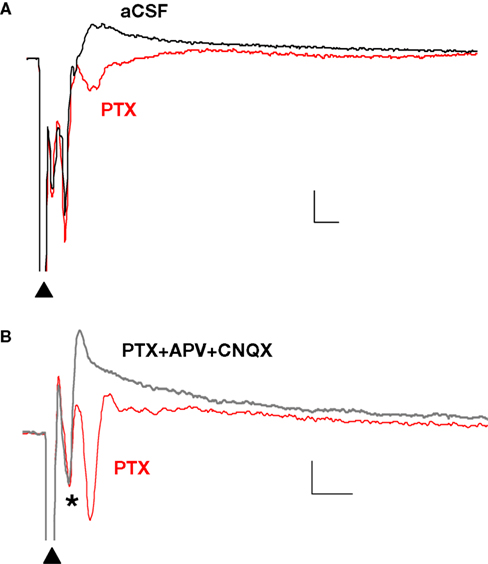
Figure 1. Polysynaptic activity in the superior lateral amygdala dorsal subnucleus (LAd-s) evoked by thalamic afferent stimulation is revealed by blockade of GABAergic inhibition and is eliminated by glutamatergic antagonism. (A) Example of FP traces from the LAd-s showing effect of PTX (75 μM). (B) Example of FP traces in LAd-s depicting effect of glutamatergic antagonism (10 μM CNQX + 100 μM APV). Only the presynaptic fiber volley (FV, *) remains. Scale = 0.1 mV, 10 ms.
The LAd has two anatomical components, one superior (LAd-s) and one inferior (LAd-i), previously referred to as dorsal and ventral LAd (Medina et al., 2002
; Repa et al., 2001
). In order to investigate the source of the polysynaptic potentials, we next performed dual recording experiments with one recording electrode in the LAd-s and another in one of eight adjacent sites (Figure 2
). We looked for simultaneous voltage peaks that may reflect volume conduction of voltage from outside the LAd-s. Of the eight sites, only the LAd-i, LAvl, basal nucleus (BLA) and amygdala striatal area (AStr) had any temporally adjacent polysynaptic activity (Figure 2
). In AStr, all peaks were smaller than the LAd-s and not temporally coincident thus ruling out the AStr as a likely site of distant voltage activity. Moreover the AStr projection neurons are GABAergic (Cassell et al., 1986
, 1999
; McDonald and Augustine, 1993
; Pare and Smith, 1993
; Pare et al., 2004
) and thus not likely the source of the glutamatergic polysynaptic activity observed in LAd-s.
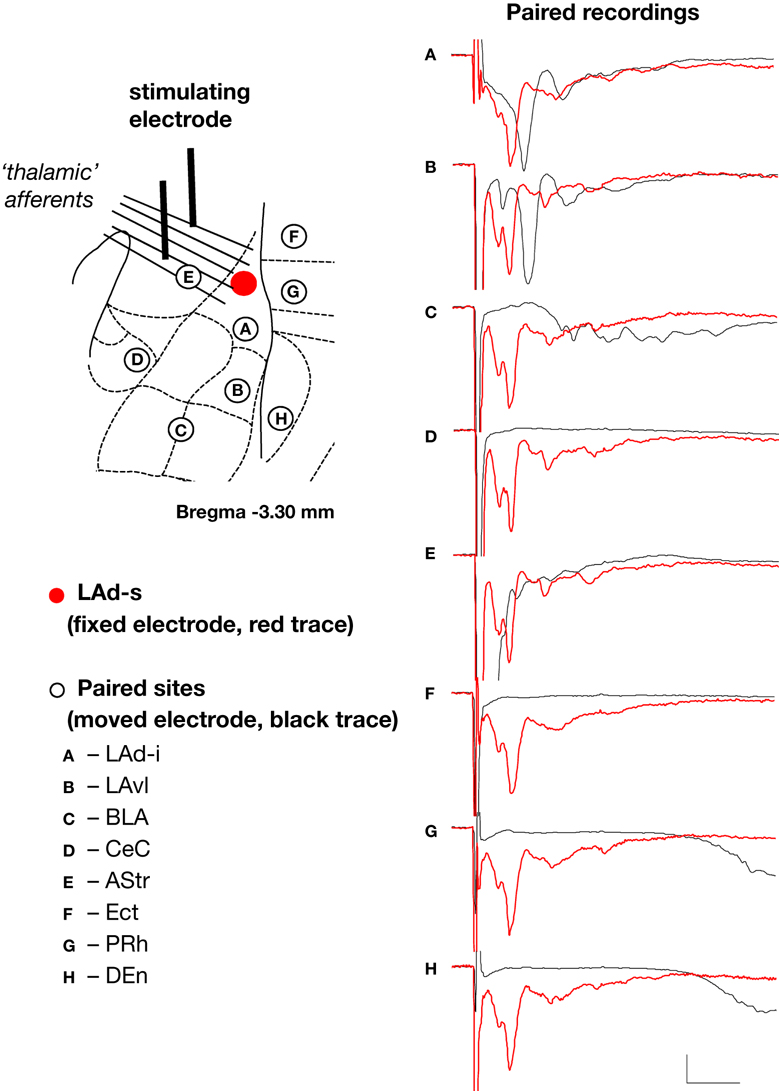
Figure 2. Spatial properties of the FP in LAd-s and adjacent sites after stimulation of thalamic afferents. In order to ascertain the degree of temporal overlap of evoked potentials occurring in sites adjacent to the LAd-s, paired recordings of FP were made with a fixed recording electrode in the LAd-s (red dot) and another recording electrode that was moved to eight adjacent sites (A–H). Recording sites adjacent to the LAd-s in sequential order: (A) inferior lateral amygdala dorsal subnucleus (LAd-i); (B) lateral amygdala ventral lateral subnucleus (LAvl); (C) basal amygdala nucleus (BLA), (D) capsular division of the central amygdala nucleus (CeC), (E) amygdala striatal area (AStr), (F) ectorhinal cortex (Ect), (G) perirhinal cortex (PRh), (H) dorsal endopiriform nucleus (Den). FP recorded simultaneously from LAd-s (red traces) and from the numbered site of recording (black traces) are superimposed. Note the delayed latency of thalamic evoked synaptic activity in cortical structures (G–H). For more ventral amygdala locations and medial structures, thalamic evoked polysynaptic activity was observed (A–C,E). No peaks or counter peaks were observed that directly corresponded to those in the LAd-s. Qualitatively, the LAd-i FP was most similar to that observed in the LAd-s. Scale = 0.2 mV, 10 ms.
The polysynaptic potentials recorded in LAd-i, LAvl and BLA amygdala subnuclei were not coincident with the LAd-s activity, thereby also ruling out voltage conduction from these as a possibility (Figure 2
). Moreover, the three cortical regions, Ect, PRh and DEn, simultaneously recorded with thalamic evoked potentials, did not show potentials at the same time as the observable monosynaptc and polysynaptic thalamic evoked potentials (Figure 2
). Consistent with other studies (Cruikshank et al., 2002
; Haberly and Shepherd, 1973
; Kudoh and Shibuki, 1997
; Luhmann and Prince, 1990
; Metherate and Cruikshank, 1999
; Mitzdorf, 1985
), our results show that the observed activity in the LAd-s is locally generated. It may thus result from polysynaptic activity, originating in neurons located in LAd-s, LAd-i, LAvl and/or BLA subnuclei (Pare and Smith, 1998
; Pitkänen et al., 1997
, 2003
; Schroeder and Shinnick-Gallagher, 2004
, 2005
; Scott and Shinnick-Gallagher, 2005
; Smith and Pare, 1994
; Smith et al., 2000
).
LA Axonal Anatomy
In order to identify fundamental properties of the intra LAd network, LAd PNs were recorded and filled in vitro. The complete in vitro axon was reconstructed and the axonal trajectories were mapped. LA PNs were recorded in whole cell patch mode under the same conditions as the in vitro FP recordings. Neurons were filed with 1% neurobiotin using the same internal solutions and recording platform as previously described (Wiesskopf and LeDoux, 1999
). Slices were submersion fixed in freshly polymerized 3% paraformaldehyde and 0.1% glutaraldehyde in 0.1 M phosphate buffer (PB) overnight and sectioned on a vibratome to 70 μm. Sections were incubated in Vector ABC and reacted with Vector SG, dried and mounted in DPX. In addition to electrophysiological criteria, neurons were anatomically determined to be PNs based on the presence of moderately to intensely spiny dendrites and large pyramidal or stellate like somata. Neurons were reconstructed in three dimensions using Neurolucida software (Microbrightfield) from 4–5 resectioned brain slices. Sections were corrected for shrinkage from fresh tissue to slide in all X, Y and Z dimensions.
In vivo Electrophysiology
In order to ascertain if any of the polysynaptic network activity identified in the brain slice is also present in vivo we also recorded thalamic evoked FP in the awake-behaving rat. We applied the same procedures to identify the TLPs as for those obtained in vitro. Then we directly compared the latencies and periodicity of the TLP from the two different preparations. We used the following experimental procedures:
Subjects
Six adult male Sprague-Dawley rats were studied (Hilltop Labs, Scottdale, PA) weighing 320–380 g at the time of surgery, and housed individually in plastic Nalgene cages with food and water ad libitum in a temperature-controlled room and on a 12-h light/dark cycle. All procedures were in accordance with the National Institutes of Health Guide for the Care and Use of Experimental Animals and approved by the New York University Animal Care and Use Committee.
Surgery
Rats were prepared for chronic implants under Nembutal anesthesia (50 mg/kg, i.p., supplemented with 10 mg/kg as necessary), as previously described (Doyère et al., 2003
). A recording electrode (nichrome, 65 μm in diameter) inserted into a guide tube and extending from it by ∼4.5 mm, aimed at the left LA (AP −3.4 mm; L −5.5 mm; DV 5.5–6.0 mm below dura). A bipolar concentric stimulating electrode (250 μm, SNEX-100, Rhodes Medical Instruments) was positioned ipsilaterally in the medial division of the medial geniculate and the posterior intralaminar nuclei (MGm/PIN, AP −5.4 mm; L −3.2 mm; DV 5.5–6.0 mm below dura). The tube served as a reference, and a cortical silver ball, placed contralaterally, served as a ground. Surgical screws and dental cement were used to anchor the electrodes and the multi-channel connecting device for chronic recordings. Rats were given at least 5 days to recover in their home cage before experimental procedures.
Electrophysiological recording procedures
Rats were habituated to the recording chamber and to the recording-headstage system for 30 min each day for 3 days before the recording sessions were started. Recording started at least 20 min after the rats were placed in the chamber when the animal was in a still-alert state. FPs evoked by stimulation delivered to the MGm/PIN (monophasic square pulse, 100 μs, 250–350 μA) were recorded through unity-gain operational amplifiers placed on the connecting sockets. Intensity of the stimulation was chosen to evoke approximately half the maximum amplitude of the monosynaptic potentials. FPs were amplified (×1000), filtered (3 kHz), digitized at 10 kHz, and stored on discs, then averaged (n = 40) for off-line analyses. Recordings and stimulation at a rate of 0.033 Hz were automated using Experimenter’s Workbench 32 software (Datawave Technologies, Longmont, CO).
Histology
Histological verification of recording and stimulating electrode placements was performed in all rats. At the end of the experiment, rats were anaesthetized with an overdose of chloral hydrate (600 mg/kg, i.p.) and perfused transcardially with 10% buffered formalin. The brains were post-fixed in 10% buffered formalin. Coronal sections were cut at 30–40 μm on a cryostat or microtome, and mounted onto gelatin-coated glass slides. Sections were then stained for Nissl using Cresyl violet, and examined using light microscopy for electrode placement.
Off-Line and Statistical Analysis of FP and Time-Locked Peaks (TLPs)
In order to identify any network activity that may be regularly occurring we analyzed the evoked FP to first reveal any hidden peaks and then to identify any reliably occurring peaks. Data analysis was performed on the averaged traces for the first 300 ms from the stimulation artifact. Three steps were followed: First, identification of all peaks, including hidden peaks in the FP; second, organization of peak latencies into categories; third, identification of reliably occurring peaks.
Automated peak fitting
To identify all peaks including hidden peaks in the FP, we used SYSTAT PEAKFIT v4.12 using the Residual Auto Peak function. Our criterion for peak identification was to fit the minimum number of peaks possible keeping R2 ≥ 0.97 (Figure 3
A). We identified the Pulse Power peak function as the most effective at reaching this criterion when compared to other peak functions. Importantly, in order to control for any peak selection bias we used an experimenter who was blind to the hypothesis to identify peaks in the FP.
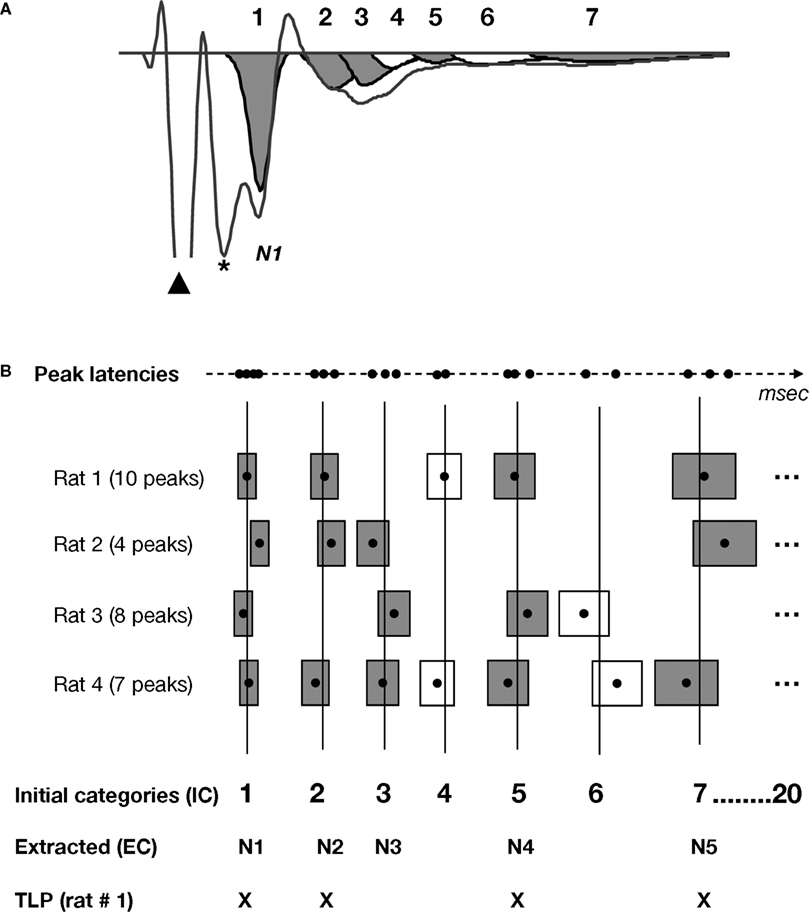
Figure 3. Schematic of the method used for the extraction of time-locked peaks (TLPs). The detailed methodology is described in the Materials and Methods section of the manuscript. (A) Example of an averaged FP recorded in vitro, and seven peaks fitted using PeakFit software, when excluding the stimulus artifact (black triangle) and fiber volley (*). For this particular case, following the procedure depicted in (B), five peaks were found to be reliable for this condition (in grey), while two peaks were not (in white). (B) Procedure for the extraction of TLPs. For clarity, the examples here depict hypothetical cases for which peak latencies are very well clustered among animals. For each animal and each peak latency (black dot), as fitted in (A), a “zone of variability” (box) was calculated around the peak latency. Then, the peaks across all animals in the same condition (e.g., in vitro LAd-s) were identified, and using their zones of variability, unique initial categories (IC, vertical lines) were defined. For example, in the case of in vitro LAd-s, 20 initial categories were formed. Of these, five were identified as reliably present across all animals and labelled “extracted categories” (EC, numbered in an ascending manner N1 to N5, corresponding to the centers of the gray boxes). For each animal, the peaks that coincided with the ECs are referred to as its time-locked peaks (TLPs). For instance, Rat 1 has only four TLPs, whereas Rat 4 has five [like in the example shown in (A)].
To identify all potential latencies of polysynaptic activity, we made categories of time (temporal categories) into which all of the observed peaks fell (see Figure 3
). As different positioning of recording and stimulating electrodes may likely introduce variability between animals that is meaningless, we first normalized the latencies to the FV, as it reflects the time point at which the afferent activity reaches the recording site. We then calculated a “zone of variability”. The aim of the calculation of this “zone of variability” was to take into account between subject variability. The calculation of the between subject standard deviation of latency of each peak was not available. In effect, from one animal to another, a given peak may or may not be present, and therefore it was unknown in advance which peaks were to be considered as representing the same event. The variability of latencies are usually reported to increase proportionately with mean latency, an effect observed neurophysiologically in spike jitter (variability) and which likely represents an increase in the number of synaptic steps in a polysynaptic network (Fujisawa et al., 2004
). Therefore we decided to use a percentage calculation which maintained a rule of proportionality. The choice was based on the empirical observation that two successive peaks in the same animal were never closer than 7% of the latencies of each peak within the first 100 ms, and 3% of the latency of the peak within 100–300 ms. Therefore, to be conservative, we calculated the zones of variability with ±5% for peaks up to 100 ms, and ±2.5% for peaks within 100–300 ms (Figure 3
B, boxes). Temporal categories (vertical lines in Figure 3
B) therefore represented mean time zones across animals in which consecutive non overlapping peaks were present.
Extraction of reliable time-locked peaks (TLPs)
Once all peaks were identified in the FP and organized into temporal categories, we next determined which peaks occurred reliably across all animals within the same condition (e.g. in vitro LAd-i). Using the same ranges of variability (±5% for 1.5–100 ms and ±2.5% for 100–300 ms), we calculated the maximum number of non overlapping sequential time zones in a 300 ms recording, yielding 67 categories. To determine whether a peak occurred reliably across animals, we then calculated the probability of finding a given number of animals (a) with a peak in a given category using the following formula:

with n, number of animals in the group
a, number of animals present in the given category
z, maximum number of peaks exhibited by any animal in the group
67,maximum number of possible categories created by the zone of variability
p = 1/67,probability that a peak falls in a given category
q = 66/67, probability that a peak falls in any other category
We first determined, for a given number of peaks (z), the probability that zero or one peak would fall into a given category. Those probabilities are qz and z × p × qz−1, with p = 1/67 (probability that a peak falls in a given category) and q = 66/67 (probability that a peak falls in any other category). We then normalized those probabilities by restricting the population of outcomes for any category to these two possibilities. Thus, the normalized probabilities of zero or one peak falling into a given category were qz/(z × p × qz−1 + qz) and z × p × qz−1/(z × p × qz−1 + qz), respectively. Using these outcomes as mutually excusive alternatives for a given category, we applied the binomial theorem to determine the likelihood that a given number of animals (a) in a group of n animals would have a peak in the same category (Eq. 1). A conventional significance level of α = 0.05 was used to determine the minimum number of animals (threshold) required to establish the reliability of a peak in that category. In this formulation, ideally z is a constant. In fact, z varied among animals in a group. To be conservative, z was taken as the maximum number of peaks exhibited by any animal in the group. The result of this probability procedure was termed Extracted Time Locked Categories across animals (EC).
Finally, this procedure permitted the identification of reliably occurring TLPs in individual animals within a condition (Figure 3
B). TLPs could be identified as by the total EC in each animal.
It may be noted that our methodology is quite stringent and conservative, putting us at risk to miss some other peaks that may also be part of a network. However, it identifies the most reliable peaks between preparations that may thus represent a “core network” in the amygdala.
Measurement of changes in identified peak amplitudes
Overall we sought to identify reliable peaks in vitro and in vivo. However in order to further describe these peaks we also studied changes in identified peak amplitudes after changes in plasticity and NMDA receptor antagonist. Changes in amplitude were measured by identifying peaks at the established TLP latencies, and then amplitude was compared before and after induction of plasticity and pharmacology protocols. For pharmacological change we measured mean peak change. For plasticity we found some peaks appeared reduced while others where increased or did not change. In order to assess this result with statistical methods we compared the individual peaks with t-tests for each peak, control v experiment. This established if the peaks were in fact decreased, increased or not significantly different. In order to establish if overall peaks were decreased, increased or not changed following manipulation of thalamic afferent plasticity, the data pool of t-test results was compared with a Chi-squared test. This provided a statistical measure of overall change in peak amplitude in the plasticity experiments. Over all the results indicate a net decrease or LTD (see Results). We confirmed this finding directly with a measure of intra-LAd monosynaptic LTD.
TLP Data Interpretation
In this study we sought to identify the properties and behavior of TLPs in the lateral amygdala in response to stimulation of thalamic afferents. TLPs could be studied in reference to the afferent stimulation (stimulation artifact) which provides a measure of “real time” activity (real time from the point of view of the experimenter). However, variability in latencies may come from different positioning of recording and stimulating electrodes among animals, and may not necessarily reflect meaningful differences. Therefore, TLPs from different recording sites were normalized in relation to the presynaptic (“fiber volley”, FV) afferent activity by subtracting their corresponding FV latency, thus producing a realignment of all TLPs with respect to FV. To determine region specific network behaviors or “network time”, we also calculated the latencies from one peak to the next (peak to peak latency), thus providing a measure of possible regularity in the rhythmicity of the network activity. Thus, data are discussed with reference to real time, normalized peak latency (from FV), or peak to peak latency. Each measure provides a window to the underlying network behavior.
Overview
We identified the temporal characteristics of the intra-LAd excitatory network. Regular network activity in the form of time-locked peaks (TLPs) was extracted from thalamic afferent evoked FPs and was used to study intra-network timing. We found polysynaptic TLPs in both the superior and inferior LAd in vitro. Some of the TLPs recorded in the LAd-s originated from the LAd-i because these potentials were lost after removal of the LAd-i in vitro. We used reconstruction of axons from LA PNs and found that these neurons possess extensive dorsal and ventral projecting axon collaterals which would allow synaptic interaction between LAd-s and LAd-i neurons. The TLPs were sensitive to NMDA blockade. These data indicated a recurrent intra-LAd network.
We also found that the intra-LAd excitatory network develops long term plasticity in response to thalamic afferent plasticity, observed as a global depression of TLPs amplitude and measured directly as a depression of intra-LAd monosynaptic response. We next found that thalamic afferent activated polysynaptic activity was identifiable as TLPs in the LAd of the awake-behaving rat. We found the temporal pattern of TLP activity in the awake-behaving rat and brain slice to be highly correlated, indicating that the same intra-LAd network can be identified in both preparations.
From these data, we formalized a model of intra-LAd network activity. This model establishes that following an auditory stimulus, thalamic activation of the LAd leads to recurrent excitatory activity within the LAd, and that this recurrent feedback is temporally coincident with subsequent cortical input into the LAd. Therefore, this model provides a network mechanism by which auditory cue driven thalamic and cortical afferent activities to the LA can be temporally coincident.
Different Temporal Organization of Superior and Inferior LAd Networks
If the LAd is a functionally homogeneous network then it would be predicted that evoked polysynaptic activity is uniform throughout the LAd. On the other hand if the LAd functions as a network with internal feedforward and feedback connectivity, then the organization of TLPs may be non-uniform. We hypothesized that the LAd-s and LAd-i are interconnected independent networks. Therefore we predicted that the TLPs identified from each region may be temporally different.
In order to examine the intra-LAd network behavior, we made simultaneous recordings of extracellular synaptic potentials in the LAd-s and LAd-i in response to local bipolar stimulation of the auditory thalamic afferent pathway in vitro (Figure 4
A). Within the first 300 ms, we observed multi-component polysynaptic voltage events at both recording sites. Following peak fitting (see Materials and Methods) we detected a similar number of negative peaks at both recording sites (LAd-s, n = 5 rats, mean ± SEM of 7 ± 0.45 peaks, range 6–8; and LAd-i, n = 6 rats, 7 ± 0.73, range 5–10). From these peaks, we identified time-locked peaks (TLPs) appearing reliably (see Materials and Methods), thus potentially reflecting a core network. Using this method, we found five TLPs (N1 to N5) in the LAd-s and six in the LAd-i (N1 to N6) (Figure 4
A), reducing the number of peaks per animal by approximately 50% for both LAd-s (4 ± 0.32, range 3–5) and LAd-i (4.17 ± 0.31, range 3–5). The peaks had similar amplitudes between the two recording sites (data not shown).
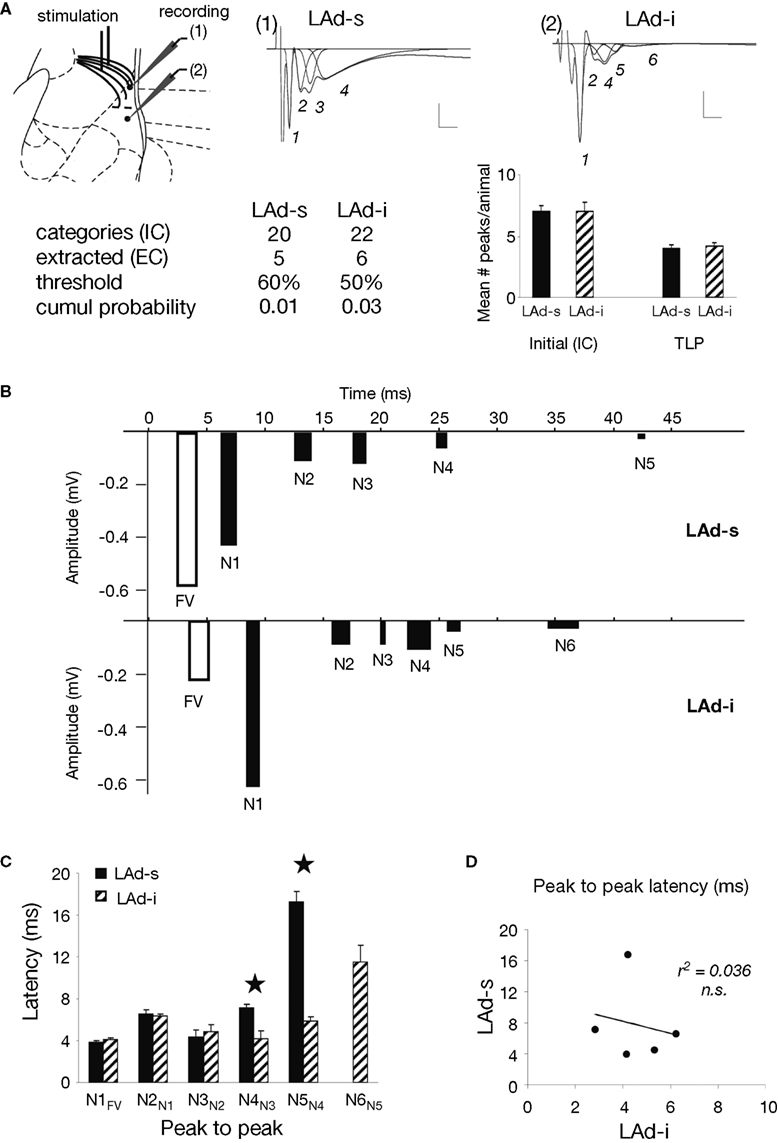
Figure 4. Temporal organization of TLPs in the dorsal lateral amygdala. (A) Atlas image depicts the location of stimulating electrode in extra-LA thalamic afferents fibers and two recording electrodes in the LAd-s and LAd-i. Example of FP traces from LAd-s (1, scale = 0.1 mV, 10 ms) and LAd-i (2, scale = 0.2 mV, 10 ms) depicting non-linear peak fitting and TLPs determined probabilistically (see Materials and Methods). From the initial number of categories found (IC), probabilistic analysis (threshold defining the minimum number of occurrence across animals resulting in a cumulative probability <0.05) extracted only few categories as reliably occurring between animals (EC). Averaged number of peaks per animal was reduced by approximately 50%, indicating that approximately 50% of all peaks detected using the non-linear curve fitting method are temporally reliable across animals (TLP). LAd-s example has TLPs N1–N4, LAd-i example has N1–N6, but misses N3. (B) Latency ranges (widths of bars) of TLPs in LAd-s and LAd-i shown in “real time” from stimulation artifact. Latency to the FV tended to be increased in the LAd-i consistent with a bigger distance between stimulating and recording electrodes. Analysis of variance indicated that these peaks were not occurring at the same time as there was a significant interaction between the two data sets F(5,54) = 80.18, p < 0.0001. Bonferroni post-hoc t-tests reveal N2 and N5 are significantly different at p < 0.01. (C) Comparison of peak to peak latencies [e.g. N1FV means (N1 latency–FV latency)] between TLPs of LAd-s and LAd-i. The first three TLPs arrive at similar latencies after their preceding ones at both recording sites. In comparison N4 and N5 occur later in the LAd-s compared to the LAd-i. *p < 0.05. (D) There was no correlation between peak to peak latencies in LAd-s and LAd-i, showing different rhythmic pattern in these two sub-areas of LAd.
When comparing TLPs in “real time” from the stimulus artifact, common to both electrodes, we found that the peaks identified in the LAd-s (N1–N5) and in the LAd-i (N1–N6) occurred at different latencies and thus can not represent the same events (Figure 4
B). Therefore the peaks identified are representative of local network activities which differ between the recorded regions.
In order to compare the network rhythmicities in LAd-s and LAd-i, we next analyzed the peak latencies with reference to their immediate preceding peak (peak to peak latency). We found both matching latencies and systematic differences in the temporal organization of LAd-s and LAd-i peaks. While a similar rhythmicity was observed for the first three peaks (N1 to N3) in the LAd-s and LAd-i, peak to peak latencies were significantly longer in the LAd-s than in LAd-i for peaks N4 and N5 (Figure 4
C). As a result, there was no significant correlation between the two temporal sequences of the first five peaks recorded in LAd-s and LAd-i (Figure 4
D). This result suggests that the two separate networks in LAd-s and LAd-i have some common network behavior patterns (N1 to N3) as well as some separate network behavior patterns (N4 to N5).
We next tested whether the polysynaptic activity observed in LAd-s depends upon NMDA transmission because synaptic activity in recurrent networks has been shown to use NMDA receptors (Nakazawa et al., 2002
; Wang, 2001
). We applied a dose of NMDA antagonist (APV, 100 μM) that on its own did not cause a significant change to N1 (−0.43 ± 0.0914, APV −0.40 ± 0.119, ns), and measured TLPs after 30 min. We applied non-linear peak fitting to the baseline trace and utilized the TLP latencies identified previously to match peaks N1–N5. The first observable change under NMDA antagonism, in contrast to the minimal change to N1, was the reduction in amplitude in all peaks following N1 (Figures 5
A,B). All polysynaptic peaks N2–N5 were significantly reduced in amplitude (p < 0.05, Figures 5
B,C). When expressing the reduction as a ratio from baseline for each peak, the greatest change in amplitude occurred at N4 and N5, suggesting a potential heterogeneous organization of NMDA sensitive receptors within the polysynaptic network (Figure 5
D). Nonetheless, the cumulative reduction in amplitude seen with successive peaks suggests that the peaks represent polysynaptic activity in a network and that NMDA receptors are involved at each synaptic transmission across the intra-LAd network.
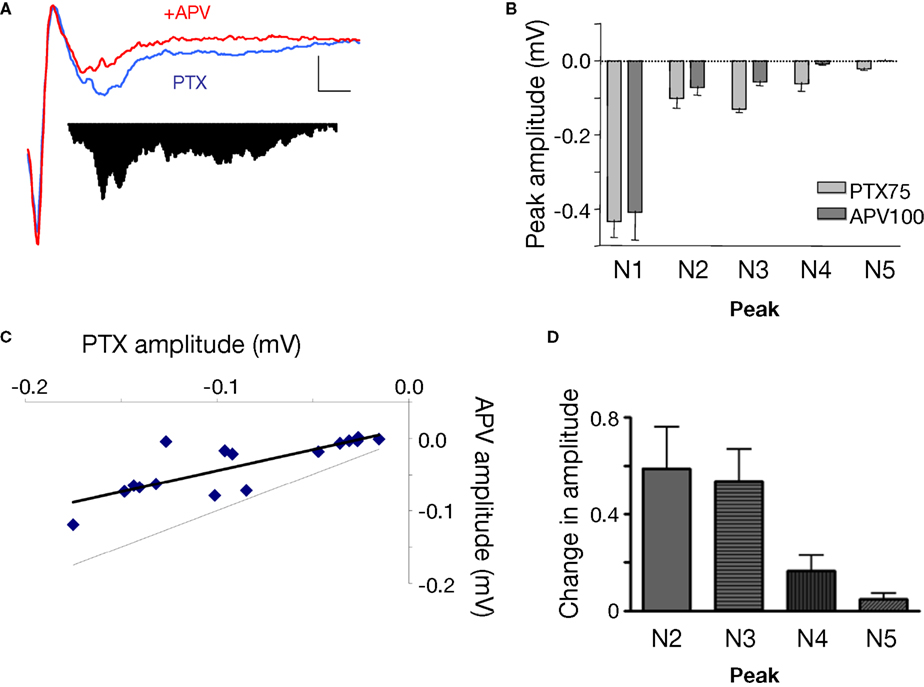
Figure 5. Effect of NMDA antagonist APV (100 μM) on polysynaptic activity in LAd-s. (A) Example traces, control (blue) and after added APV (red). The difference in area under the trace of polysynaptic activity is also shown. (B) Mean peak amplitude was decreased [for N1–N5 peaks F(1,40) = 11.99, p < 0.002; post-hoc t-tests, N1 = ns; N2–N5 p < 0.05]. (C) All individual TLPs (N2–N5) were reduced (light line = no change) (D) Ratio of change in TLPs (N2–N5) indicating the change is non-uniform across TLPs [F(3,16) = 4.7, p < 0.02].
LAd Contains a Temporally Structured Recurrent Network
The next step was to determine the possible origin of the identified peaks. We hypothesized that at least some of the TLPs observed in the LAd-s originated from ventral to the LAd-s. It was important to identify the source of the potential origin of the TLPs because the computational capabilities of a network depend upon its organization. This includes the extent to which there are recurrent excitatory connections allowing for possible reverberatory activities (Hopfield, 1982
; Nakazawa et al., 2002
, 2004
; Wang, 2001
; Wong and Wang, 2006
). If this applies to LAd, then some of the polysynaptic peaks recorded in the LAd-s maybe signs of a recurrent activity from the LAd-i. We attempted to answer this question using multiple approaches.
The first approach consisted of identifying if the LAd-i contributed to peaks in LAd-s. To do this we compared the temporal organization of polysynaptic peaks in the LAd-s with the LAd-i removed. We hypothesized that if the structured polysynaptic activity originated in the LAd-i the number of peaks would be reduced following removal of the influence of this region. Moreover, the exact peaks that disappear would provide some clues about the structure of the network. Peaks remaining following removal of LAd-i are unlikely to be due to adjacent brain structures. First, the PNs of the adjacent caudate putamen (CPu) use GABA as a transmitter (Bolam et al., 1983
; Smith et al., 1998a
) and our experiments were performed in PTX. Second, when only the adjacent cortex was removed (data not shown), polysynaptic peaks in the 200–500 ms range were observed to be lost (data not shown) and no observable change to the earlier peaks 0–100 ms was seen. This was not studied further because these later cortical peaks were beyond the time window of the LAd peaks under study, moreover no early peaks were seen in simultaneously recorded cortical regions (Figure 1
). Because our previous analysis had identified reliable peaks in the 0–50 ms range we concluded that in vitro the adjacent cortex (Faulkner and Brown, 1999
) likely contributes input to LAd on a time scale later than the internal LAd network. To test the contribution of the LAd-i we cut the LAd and cortex in a medial to lateral transection at the intersection of its mid point in the dorsal to ventral direction (Figure 6
A). Thus, the cortex immediately adjacent to the LAd-s remained but the LAd-i and the cortex adjacent to and below it were removed along with all structures ventral to these including the other amygdala nuclei. All structures medial to the LA remained. We then recorded from the LAd-s electrode and calculated the TLPs as described above.
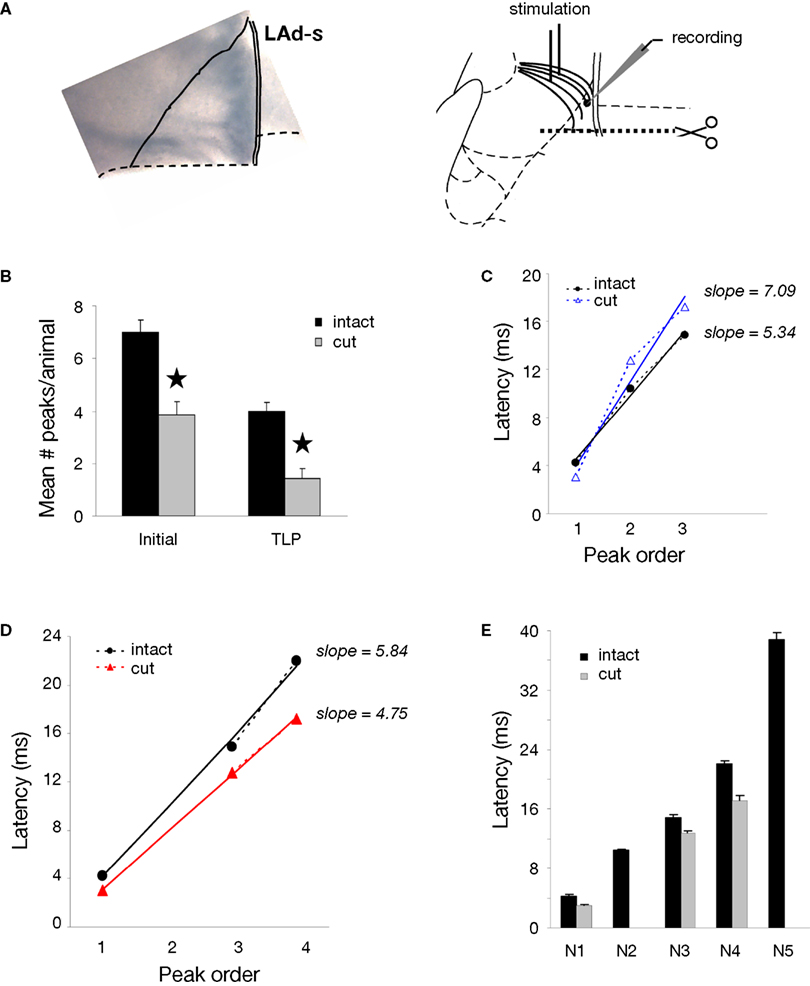
Figure 6. Ventral origin of recurrent activity in LAd network. (A) Example of an amygdala slice cut as schematically shown, with a removal of LAd-i, ventral amygdala nuclei and overlying cortex. Recordings were made in LAd-s network with stimulation of thalamic afferents. (B) Recordings from isolated LAd-s show a significant reduction in the number of polysynaptic peaks. Both the total number of peaks identified (initial) with non-linear curve fitting and the number of reliable peaks identified probabilistically (TLP) were reduced (p < 0.05) in the isolated LAd-s. (C) Extracted peak latency versus peak number shows linear relations when peaks were arranged sequentially with a difference in slope of 1.75 between intact and cut preparations. (D) When extracted peaks were arranged non-sequentially, based on closest matching latency, the correlation lines showed a difference in slope of 1.09. (E) Closest latencies and linear slopes reveal that isolation of LAd-s reduced the polysynaptic network to N1, N3, and N4. Therefore, sources of TLPs N2 and N5 are located ventrally.
Subsequent to the transection we found a significant reduction in the total number of peaks in LAd-s, both when considering the number of initial peaks (following non-linear peak fitting) and the number of extracted peaks (following probabilistic analysis) (Figure 6
B). After removal of LAd-i the number of TLPs reduced from 5 to 3, which could represent a loss of the peaks N4 and N5. Of note, however, was the apparent slowing of the second peak. In the intact slice, N2 latency from FV was 10 ms, whereas in the cut LAd the second peak appeared at 14 ms. Thus, the second peak in the cut LAd could conceivably correspond to the peak N3 in the intact slice. We considered the two options by comparing the regression lines obtained when peak latencies were plotted against the peak order. The correlations were very high in all conditions (R2 > 0.991), except when the sequential case N1-N2-N3 was considered for the cut slice (R2 = 0.955). In addition, the slopes of the regression lines were closer when remnant peaks in the cut LAd were considered to correspond to N1, N3 and N4 of the intact slice (Figure 6
D, slopes of 5.84 vs. 4.75, in the intact vs. cut slice) than when they were considered sequentially (N1, N2, N3) for both preparation (Figure 6
C, slopes of 5.34 vs. 7.09 in the intact vs. cut slice). Moreover, the peak latencies were consistently longer at all peaks in the hypothetical N1-N3-N4 situation (Figure 6
D), whereas they were crossing in the other N1-N2-N3 situation with a shorter N1 latency, but longer latencies for later peaks (Figure 6
C). It is thus most likely that the missing peaks when LAd-i has been disconnected are the original N2 and N5 of the intact slice (Figure 6
E). We also compared the amplitudes of the residual TLPs following the cut. In contrast to the loss of peaks at specific latencies there was no significant change in amplitude of the remaining TLPs.
The loss of peaks N2 and N5 adds further weight to the possibility that these potentials may be transmitted synaptically, but does not by itself indicate that these potentials are synaptic. To further assess this possibility, we determined whether there are functional synaptic connections from the LAd-i to LAd-s. We used an anatomical approach to establish if axon collaterals from LAd-s and LAd-i principle neurons could physically interact with the dendrites of the corresponding region. LAd PNs were identified and filled with Neurobiotin during whole cell current clamp recordings. The neurons including their axons were traced and reconstructed using Neurolucida (n = 9) in order to analyze both the extent and the direction of collateral projections (Figure 7
A) along the dorso-ventral and medio-lateral planes. Axons were observed traveling rostro-caudally within the limit of the in vitro preparation. Pitkänen et al. (2003)
demonstrated that a large proportion of intra-amygdala dendritic and axonal plexus obtained in vivo were contained within 500 μm of the neuron’s soma. Thus, while axons outside of the amygdala will have been lost as a result of the slice preparation, axons observed within the LA brain slice likely contained a significant portion of the total LA axon.
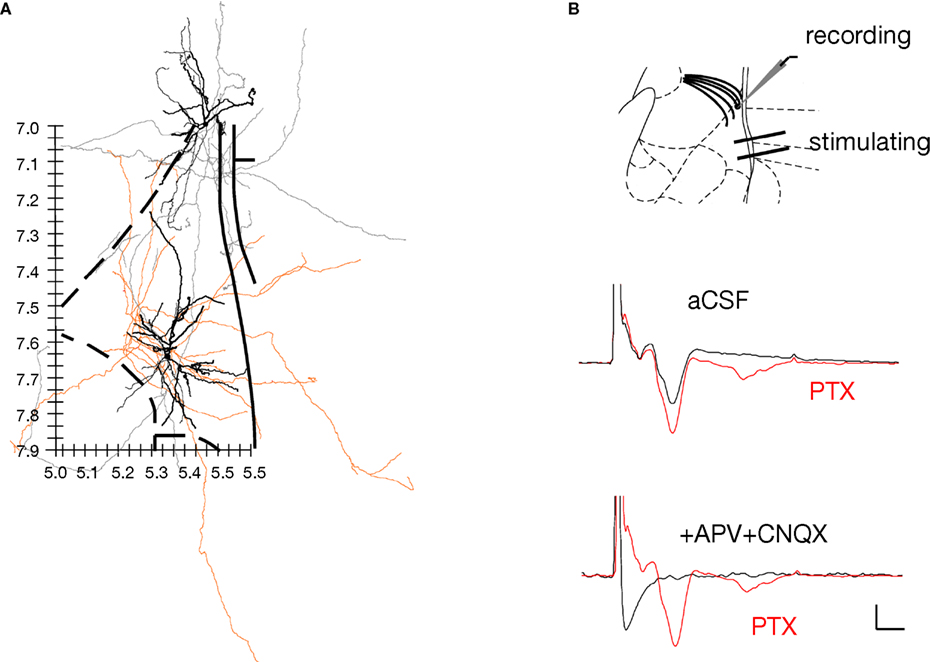
Figure 7. Direct evidence for a functional ventral to dorsal LAd network. (A) Spatial organization of axon collaterals arborizing from two example neurons located in LAd-s and LAd-i. Dendrites are depicted in black and axons in grey (LAd-s) and orange (LAd-i). Note the axon collaterals from the LAd-s reach the vicinity of dendrites from the LAd-i neuron, and axon collaterals from the LAd-i reach the vicinity of dendrites from LAd-s neuron. Scale (mm) and outline from Paxinos and Watson 4th Ed. (B) Bipolar stimulating electrodes were placed in the LAd-i, and recordings were made from LAd-s. Stimulation of LAd-i evoked monosynaptic FP in the LAd-s. In the presence of PTX (75 μM) the monosynaptic potential increased in amplitude and polysynaptic activity is observable. The FP is eliminated by glutamatergic antagonism (10 μM CNQX + 100 μM APV).
We found LA PN axons to project multidirectionally (Figure 7
A). All LA PN had at least some axon projections in the ventral direction, which was substantial in proportion or number, consistent with the classical network architecture of the amygdala (Pare and Smith, 1998
; Pitkänen et al., 1997
, 2003
). In addition, all LA PN also had axon projections in the dorsal direction, which was significant for the majority of PN (n = 9, not shown). Of note was the overlap in space of ventrally projecting axons with ventrally located dendrites. Likewise, there was overlap of dorsally projecting axons with dorsally located dendrites. Also of note was the observation that ventro-laterally located LAd PN had axons that projected both dorsally and ventrally, but also had a strong medial preference. Conversely several ventro-medially located neurons had the opposite projection pattern. Thus, in the coronal plane at least, there appears to be an organizing principle for LA PN to funnel axon collaterals dorsally, ventrally and centrally into the LA. We also observed that local axons collaterals had boutons throughout all their collateral ramifications. As a result, these LAd PN could excite other neurons within LA, including other PN as well as GABAergic interneurons (Samson et al., 2003
; Smith et al., 1998b
). These data indicate a potential for both feedforward and feedback excitatory networks.
The anatomical data suggest LAd-i and LAd-s are interconnected. We next tested whether this ventro-dorsal connection is functional by recording FP evoked in the LAd-s in response to the stimulation of the LAd-i. Stimulation of LAd-i produced a direct FP response in LAd-s (Figure 7
B). Moreover, as seen in the evoked polysynaptic activity in response to thalamic afferent stimulation, application of PTX further revealed polysynaptic activity in response to the LAd-i stimulation. In addition consistent with this connection being driven by glutamatergic local axon collaterals, application of APV and CNQX blocked the synaptic potentials. Taken together these results provide evidence supporting the hypothesis that the LAd is a recurrent network (Hopfield, 1982
).
Functional Behavior of the LAd Network Reveals Intra-Network Plasticity
The results of the experiments described above led us to suspect that the LAd contains a recurrent network. In the next set of experiments, we tested how this network behaves in response to plasticity at thalamic afferents. Much previous evidence indicates that synaptic potentiation occurs at monosynaptic thalamo-amygdala synapses during fear conditioning, as shown by a change in the amplitude of N1 (Doyère et al., 2007
; Rogan et al., 1997
; Schafe et al., 2005
; Schroeder and Shinnick-Gallagher, 2004
). As a result, the polysynaptic responses may be potentiated as well. On the other hand, theoretical and experimental work predict that polysynaptic responses may be depressed (Bi and Poo, 2001
; Hebb, 1949
; Mu and Poo, 2006
; Royer and Pare, 2002
, 2003
; Schroeder and Shinnick-Gallagher, 2004
).
We measured the changes within the LAd network when LTP was induced at the monosynaptic thalamic input. We compared these effects to those produced by an increase in stimulation intensity on evoked responses in the LAd-s (control). As expected, both the increase in stimulation intensity and LTP induction protocol (100 Hz tetanus) resulted in a significant change in the amplitude of N1 (Doyère et al., 2003
; Huang and Kandel, 1998
; Huang et al., 2000
; Lamprecht et al., 2006
) (Figures 8
A–C). When examining the polysynaptic response in the LTP and control experiments, contrasting effects were observed. A decrease in post-N1 voltage was observed after LTP (Figure 8
B), whereas an overall increase in the polysynaptic voltage was observed when the stimulation intensity was increased in the control experiment (Figure 8
C).
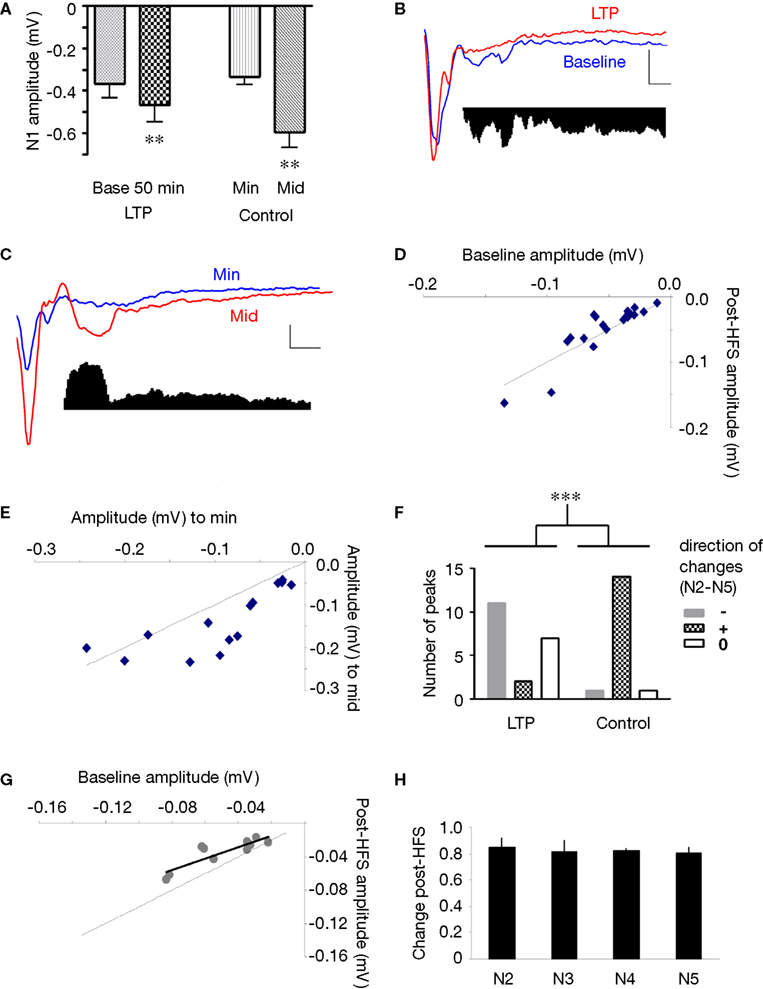
Figure 8. Effect of thalamo-amygdala LTP on polysynaptic activity in the LAd-s, as compared to an increase in stimulation intensity. (A) Mean change (+SEM) in N1 amplitude in the LTP experiment (50-min post-tetanus vs. baseline) and in the control experiment (minimum vs. middle intensities). Current intensity was delivered at ≈33% (minimum, min) and ≈66% (middle, mid) of current needed for maximal N1 amplitude. Both LTP and control show a significant increase in N1 amplitude. (B) Example traces of baseline (blue) and after LTP (red). Inset, difference in area under trace of polysynaptic activity (N2–N5) shows a decrease in polysynaptic activity. (C) Example traces of control experiment, min (blue) and mid (red) intensities. Inset, difference in area under trace of polysynaptic activity (N2–N5) shows an increase in polysynaptic activity. (D) Change in peak amplitude for all TLPs (N2–N5) in LTP group. Most peaks were decreased after LTP (line = no change, baseline vs. LTP). (E) Change in peak amplitude for all TLPs (N2–N5) in control experiment. Most peaks were increased with intensity (line = no change, min vs. mid). (F) The number of TLPs (N2–N5) that were increased, decreased or not changed was significantly different between the LTP and control experiments. (G) In the depressed cases from LTP experiment, the decrease in peak amplitude was linearly correlated to its initial baseline value. (H) Mean ratio of change in peak amplitude after LTP shows the constant suppression ratio for all TLPs (N2–N5).
We applied non-linear peak fitting to the baseline (control) trace and utilized the peak temporal latencies identified previously (Figure 4
) to match peaks N1–N5 (n = 5 slices, 4 rats). Peaks were compared as change in peak amplitude. Of the polysynaptic peaks identified, most of them were decreased or not changed from baseline after LTP, whereas almost all of them were increased at a higher intensity in the control experiment (Figures 8
D–F) (LTP vs. Control count p < 0.001, Chi square). The post-tetanus polysynaptic peaks identified as decreased could be fitted to a linear function (R2 = 0.76) with a slope of 0.68 indicating that the decrement in amplitude following tetanus was proportional to peak size (Figure 8
G). Moreover when comparing the ratio of change for each polysynaptic peak N2–N5, the change was constant and not cumulative (i.e. no additive affect) across each network node (Figure 8
H).
These results suggest intra-amygdala heterosynaptic LTD in response to thalamo-amygdala LTP. To test this hypothesis, we directly recorded the effects of thalamo-amygdala LTP on the monosynaptic intra-LA FP. Stimulating electrodes were placed in both the thalamo-amygdala path and in the LAd-i (Figure 9
A, inset). A single recording electrode was positioned in the LAd-s and monosynaptic potentials evoked by stimulation of either stimulation sites were recorded. Induction of monosynaptic LTP (two-tailed t-test; p < 0.05, n = 6) at the thalamo-amygdala synapses resulted in significant LTD at LAd-i to LAd-s monosynaptic synapses (Figure 9
A; two-tailed t-test; p < 0.05, n = 6). This effect lasted for the duration of the post-tetanic recording period of 90 min.
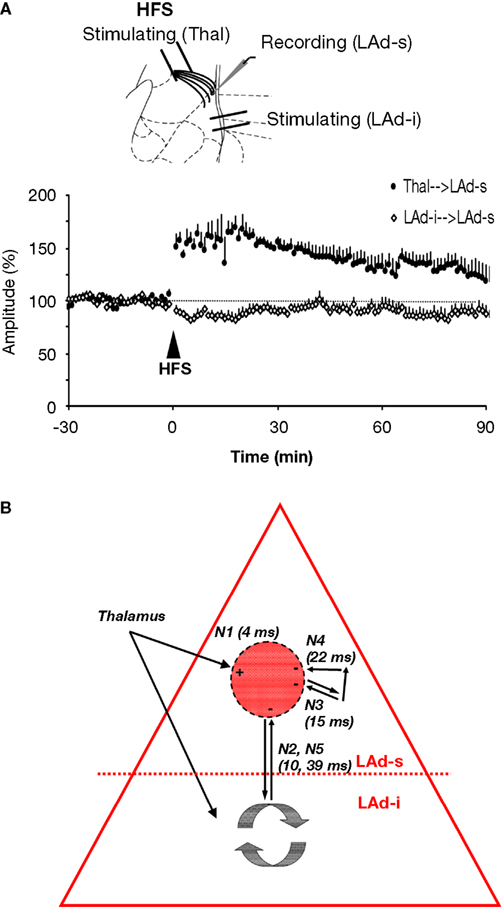
Figure 9. Polysynaptic activity in LAd-s originates from recurrent activity and is plastic. (A) Induction of thalamo-amygdala LTP induced LTD at intra-network LAd-i to LAd-s afferents. Both LTP and LTD lasted for at least 90 min. (B) Schematic model of the temporally structured and plastic recurrent network in LAd. The model describes the temporal sequence of polysynaptic excitatory activity mapped in the LAd-s in vitro, evoked by activation of the thalamic-amygdala path. The excitatory model is described in the absence of the GABA network of Samson and colleagues (2003)
. The activity of the model is described in “Network time”, as measured relative to the presynaptic conductivity prior to N1 activation (i.e. fiber volley, FV). Stimulation of thalamic fibers activates a monosynaptic connection in the LAd, which synchronizes polysynaptic activities (TLPs). Next, polysynaptic activation occurs via a network of LAd axon collaterals which provide an opportunity for network activity to influence proceeding amygdala afferent input. The first polysynaptic activity to occur (N2, 10 ms after FV in vitro) is direct ventro-dorsal and dorso-ventral connectivity (di-synaptic). This connectivity is an excitatory recurrent feedback connection to LAd-s. Further polysynaptic activity occurs via multisynaptic connectivity within the LAd-s (N3, N4). Our slice reduction data showed a further ventro-dorsal recurrent feedback from LAd-i to LAd-s (N5, 39 ms), which may well be resulting from N6 in the LAd-i. The model also incorporates functional aspects of the network. Monosynaptic LTP at thalamo-amygdala synapses (+) results in suppression of polysynaptic feedback synapses (−) on the same population of cells [see (A)].
Incorporation of all the above data including: the lack of cortical or striatal peak sources (Figure 1
); the temporal characteristics of the TLPs (Figure 4
); the feedback contribution of the LAd-i to the LAd-s network (Figure 6
), and the direct and polysynaptic data showing intra LAd plasticity (Figures 8 and 9
A), led to the establishment of an intra-LAd network model (Figure 9
B). The model incorporates the latencies obtained from the evoked TLPs. In addition, the model incorporates the results of the slice cut experiments together with the data from the LTP experiments, as well as our direct establishment of monosynaptic LAd-i to LAd-s connectivity and its heterosynaptic LTD response to LTP at thalamo-amygdala afferents. Considering the latter point, we interpret the constant suppression of the polysynaptic TLPs observed after LTP as indicating LTD at one synaptic node in the LAd network. These synapses are likely to be on those same groups of LA PNs which show LTP at thalamo-amygdala synapses (Bi and Poo, 2001
; Hebb, 1949
; Mu and Poo, 2006
; Royer and Pare, 2002
, 2003
).
The Temporally Structured Intra-LAd Network is Identifiable in Awake Animals and is Stable Over Time
We hypothesized that if the network we identified in brain slices is functionally significant it should be present in the LAd in vivo. Recordings were made in LAd-s in awake and unrestrained rats in response to stimulation of the auditory thalamic nuclei MGm/PIN (Doyère et al., 2003
; Schafe et al., 2008
). A polysynaptic voltage response was observed with multiple negative peaks and several long duration positive peaks (Figure 10
A). Our in vitro results indicated that the positive components of the polysynaptic response are removed by blockade of GABAa receptors with PTX. While the presence of intact GABAa receptors in vivo likely has an impact on peak amplitude and latency, similar patterns of activation should still be detectable if the same glutamatergic network is underlying the polysynaptic activity. Using the same method as in vitro, we identified time-locked peaks (Figures 10
A,B). Compared to LAd-s in vitro, more peaks, N1–N9, were identified. In vivo, the entire LAd is available for polysynaptic activity and connections with other brain nuclei are intact. Therefore the additional TLPs may be the product of an expanded LAd network or amygdala connectivity. Five out of the six in vivo animals were kept for 1 week and tested again. Nine peaks were found reliably present on both recording sessions 1 week apart (present each time at least in 60% of the cases). It is thus very likely that these represent synchronized recurrent activity, instead of random events.
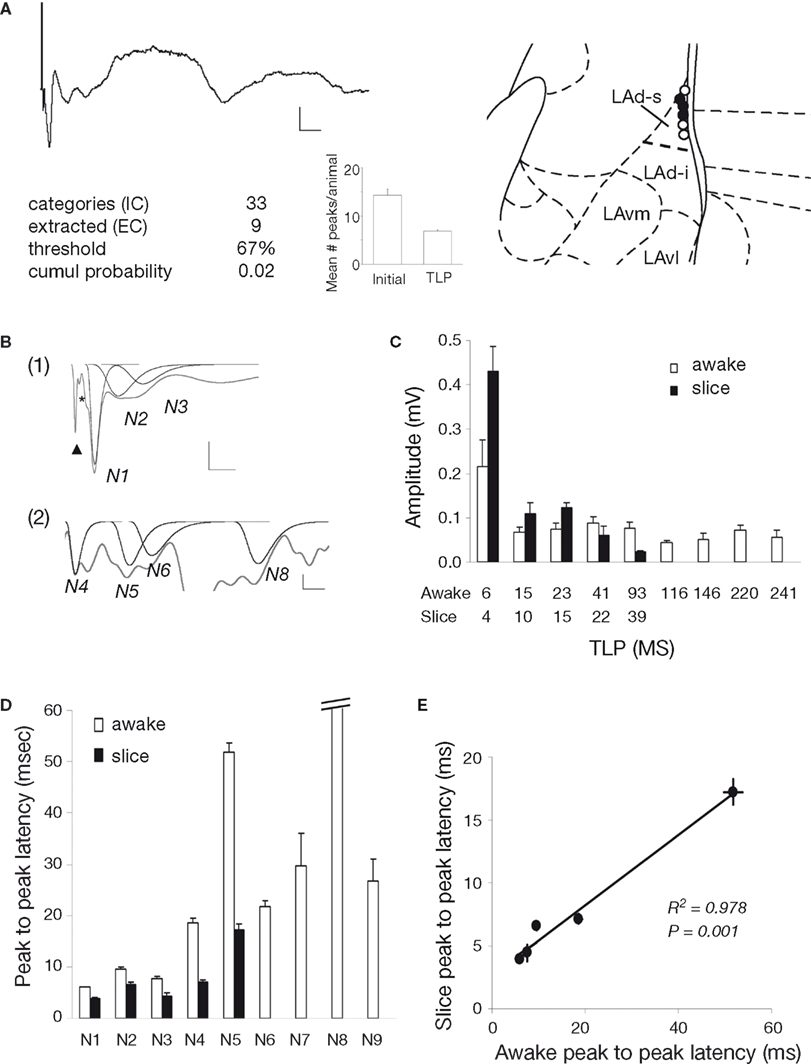
Figure 10. Comparison with temporally organized polysynaptic LAd network in vivo. (A) Thalamic stimulation in the awake animal evoked in LAd-s a monosynaptic negative potential followed by multiple polysynaptic peaks (voltage trace). Scale = 0.1 mV, 10 ms. Text and histogram show extraction of TLPs detected with non-linear curve fitting and probabilistic logic (see Materials and Methods). Mean number of peaks per animal is reduced by approximately 50%, indicating that approximately 50% of all peaks detected using the non-linear curve fitting method are temporally reliable across animals (TLP). Atlas shows the recording electrode placements in the LAd-s. Electrodes are in same anterior–posterior location shown (black) or adjacent anterior–posterior positions (white). (B) Example trace with individual peaks fitted using non-linear peak fitting and identified as TLPs. Trace is partially shown to allow clearer observation of artifact (arrowhead), presynaptic FV (*) and TLPs N1 to N3 in (1) and N4 to N8 in (2). (C) Comparison of in vivo (N1 to N9) and in vitro (N1 to N5) peak amplitudes. (D) Comparison of in vivo and in vitro peak to peak latencies. (E) Linear relationship between in vitro and in vivo peak to peak latencies.
We compared TLP amplitudes and latencies between the two preparations for peaks N1–N5. While a significantly larger N1 compared to the following peaks was observed in both preparations, no further systematic similarities in amplitude were detected (Figure 10
C). Initial observation of peak latencies also indicated that while different the two preparations showed systematic similarities. In vitro TLP latencies were consistently shorter than in vivo latencies; moreover a consistent pattern of network “speed” for each peak was apparent as parallel increases and decreases from peak to peak (Figure 10
D). These similarities were confirmed in a very high correlation (R2 = 0.978, p < 0.001) between in vitro and in vivo average peak to peak latencies for the first five TLPs (Figure 10
E). This analysis reveals that while the actual network time is slower in the awake preparation than in vitro, both preparations show the same rhythmicity. This result first indicates that the use of PTX in the in vitro experiments was not artificially creating peaks that may have been pathologically elicited, but instead it amplified TLPs that are indeed representative of a network in the amygdala. It is thus likely, based on very similar intrinsic rhythmicities, that the polysynaptic responses recorded in vitro and in vivo reflect recurrent activity in the same local network.
Current associative plasticity models of amygdala behavior rely on the concept of unidirectional information processing and do not incorporate the possibility of network feedback or the possibility of temporal segregation of afferent inputs under natural stimulation conditions. We developed a novel methodology for the identification and extraction of polysynaptic network activity and identified a temporally structured and recurrent network in LAd both in vitro and in the awake rat. Further, using this method revealed evidence for an NMDA sensitive recurrent network within the dorsal lateral amygdala LAd. Transection of the inferior part of LAd (LAd-i) from the superior part (LAd-s) reduced polysynaptic activity in the LAd-s. This is supported by anatomical and direct electrophysiological evidence for a dorsally projecting intra-LAd excitatory synaptic projection. Both polysynaptic activity and direct monosynaptic intra-LA connectivity show heterosynaptic LTD in response to thalamo-amygdala LTP. Finally, we describe the internal LAd excitatory network (Figure 9
B) and propose that recurrent network activity may temporally integrate thalamo-amygdala and cortico-amygdala afferent activity (Figure 11
).
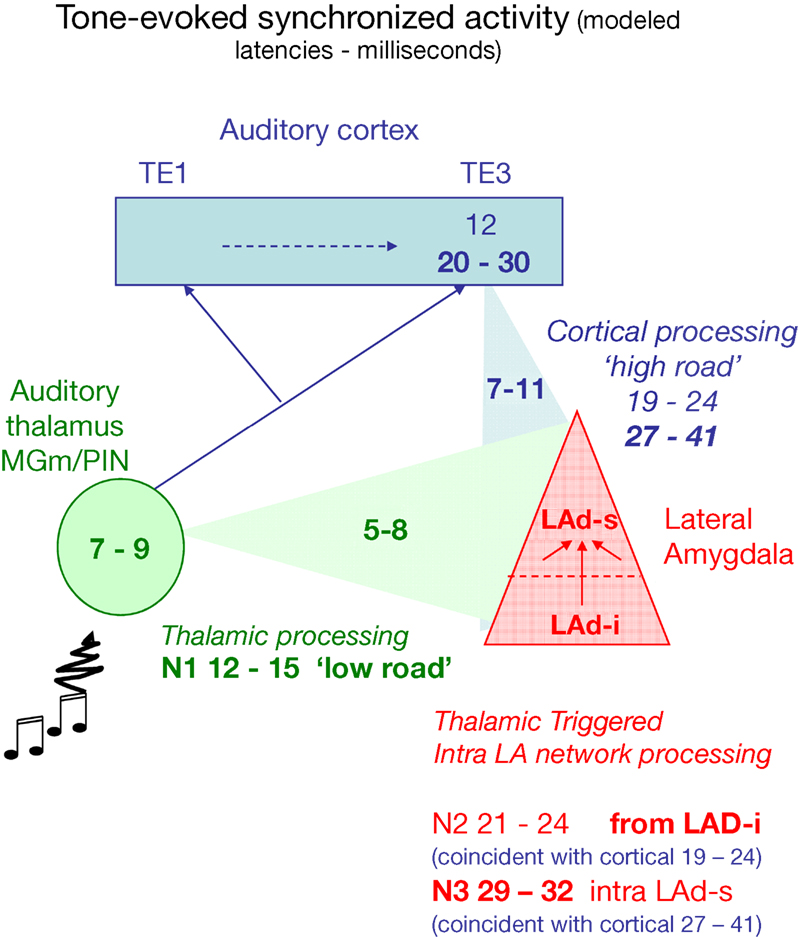
Figure 11. Model of temporal convergence between cortically processed sensory inputs and reverberating LAd structured network activity. When a stimulus like a tone is presented, it evokes rapid responses in the auditory thalamus that are transmitted to the LA both directly (green, range of latencies as reported in the literature), and indirectly via auditory primary (TE1) and associative (TE3) cortex (blue, ranges of latencies from the literature). Both routes converge on the LA (red) with latencies that can be theoretically calculated taking into account the known thalamo-amygdala (5–8 ms, in green, producing N1) and cortico-amygdala (7–11 ms, in blue) latencies. From the TLPs observed in the present study in vivo, we can infer the latencies of the first TLPs resulting from intra-LAd recurrent network processing (in red). This shows that a temporal coincidence may occur between synaptic potentials resulting from LAd recurrent network processing (N2, N3, red) and cortically processed sensory signals through the cortical network (19–24 ms for the earliest, 27–41 ms at its peak, in blue).
These data suggest that the LA recurrent feedback is temporally and spatially positioned to influence proceeding amygdala inputs. A direct ventro-dorsal connectivity (di-synaptic) is detectable as N2. The temporal organization of the recurrent LAd network revealed in this study is consistent with known cortico-amygdala latencies (Armony et al., 1997
; Li et al., 1996
). As depicted in Figure 11
, during behavioral associative conditioning a tone triggers in the LA a fast response via thalamic afferents (in green), followed by responses after cortical processing (in blue). Between these monosynaptic events recurrent activity reverberates within the LAd (in red). Within the cortico-amygdala time windows previously described (Armony et al., 1997
; Li et al., 1996
) in the literature, both the recurrent N2 and the LAd-s local N3 are synaptically active within LAd. This provides a mechanism for thalamic and cortical temporal convergence.
Technical Considerations of Network Temporal Mapping
The choice of the recording technique for the study of a network behavior presupposes conclusions as to the possible micro-organization and propagation mechanisms of the network. For example, single unit or whole cell recordings allow the visualization of spikes or EPSPs but only detect network feedback to the recorded neuron. As it is likely that any recurrent network will include direct feedback and feedback to adjacent neurons, and that it may not always be possible to localize neurons with intact neuron-to-neuron feedback connections in vitro, we decided to test for polysynaptic network activity using a technique capable of detecting both parallel and direct feedback as well as both spikes and EPSPs. To do this, we chose to record local evoked FPs with the aim to elucidate organized properties of the local network (Cruikshank et al., 2002
; Haberly and Shepherd, 1973
; Kudoh and Shibuki, 1997
; Luhmann and Prince, 1990
; Metherate and Cruikshank, 1999
; Mitzdorf, 1985
).
The amygdala lacks an elongated structural organization compared to other brain regions (Faber et al., 2001
; McDonald, 1984
; Pitkänen et al., 2003
; Swanson, 2003
; Swanson and Petrovich, 1998
) and is therefore not subject to anisotropic conductance (Johnston and Wu, 1995
; Logothetis and Wandell, 2004
). As a result the LA FP response is not solely dependent upon underlying dendrite alignment, allowing synaptic activity to potentially contribute to the response. Recent data have shown that the FP is a versatile and accurate recording method that is equal to or better than single units at predicting network activity triggering behavior (Logothetis and Wandell, 2004
; Pesaran et al., 2002
) and an accurate predictor of the fMRI BOLD signal (Logothetis and Wandell, 2004
). Moreover the FP has also been demonstrated to be a detector of polysynaptic network activity in LA (Schroeder and Shinnick-Gallagher, 2004
).
While a number of studies have used FP polysynaptic responses to elucidate micronetwork temporal structure in cortex (Cruikshank et al., 2002
; Kudoh and Shibuki, 1997
; Metherate and Cruikshank, 1999
; Mitzdorf, 1985
), this study is the first to use this approach in the LA. FP recordings have however been used extensively in the LA to study monosynaptic plasticity (Doyère et al., 2003
, 2007
; Huang and Kandel, 1998
; Huang et al., 2000
; Lamprecht et al., 2006
; Rogan et al., 1997
; Schafe et al., 2008
; Schroeder and Shinnick-Gallagher, 2004
). As a whole, our study provides convergent evidence for a polysynaptic recurrent network in the LAd: First, with the development of uniquely stringent identification and measurement of peaks in temporal space (Figure 3
), we were able to isolate reliable peaks. Second, a spatial analysis of the evoked potentials adjacent to the LAd-s (Figure 2
) revealed that cortical activity or other amygdala structures could not contribute significantly to the LAd peaks in our conditions, ruling out volume conduction. Third, reliable peaks within the LAd-s and LAd-i were temporally independent.
LA neurons are known to display membrane oscillations (Pape et al., 1998
; Pare et al., 2002
; Seidenbecher et al., 2003
) and it is a priori conceivable that regular activities in the FP could represent oscillations instead of polysynaptic network activity. Converging arguments suggest that this is not the case. First, when isolating LAd-s from LAd-i, peaks N2 and N5 were lost, a result not expected if the peaks were purely representative of a continuous membrane oscillation. Furthermore, the finding that peak amplitudes varied differentially depending upon the experimental situation (i.e. increase with increased stimulation intensity, but constant decrease with LTP at thalamic inputs and a cumulative decrease with NMDA antagonist) makes it very unlikely that the source of the FP polysynaptic peaks were solely due to membrane oscillations (Pape et al., 1998
; Pare et al., 2002
; Seidenbecher et al., 2003
). Finally, the frequency range generated by the present identified peaks is higher than 40 Hz in most cases, except for the latest peaks (27 Hz due to N5 in the in vitro preparation, or 10 and 25 Hz due to respectively N4 and N5 in the awake preparation). Thus, while we cannot rule out the possibility that the later peaks could partly represent synchronized membrane oscillation, the converging arguments suggest that at least peaks N2 and N3 represent polysynaptic network activities.
The most parsimonious interpretation of all the data, including the temporal organization of peaks (Figures 4 and 10
), as well as pharmacological (Figure 5
), anatomical (Figure 7
) and plasticity (Figures 8 and 9
) evidence, involves an axonal and synaptic propagation of electrochemical voltage change detected as polysynaptic activity in the FP. It is likely that the peaks contain elements of both EPSPs and spikes, and at least EPSPs as precursors to subsequent spiking. Working from the recurrent network latencies identified both in vitro and in vivo in the present study, future research can determine the cellular characteristics of individual nodes within this network (Douglas et al., 1995
; Johnson and LeDoux, 2004
). It would be of interest to also explore the LAd FP network response to cortical stimulation. This would potentially allow the recognition of thalamic and cortical derived components in a naturalistic auditory response measured in the LA.
Functional Considerations
Although LA, and especially LAd, is critically involved in forming and storing fear memories (Blair et al., 2001
; Davis, 2004
; Dityatev and Bolshakov, 2005
; LeDoux, 2000
, 2003
; Medina et al., 2002
; Pare et al., 2004
; Rodrigues et al., 2004
; Sah et al., 2003
), relatively little is known about LAd local networks and the way they process information (Johnson and LeDoux, 2004
). According to Hebb’s second postulate, founded in part on Lorente de No’s theorem, network reverberation is an essential component of temporal pairing (Hebb, 1949
). In this postulate, the strengthening of synapses by temporally coincident activity is facilitated by reverberatory network activity. Thus, either two new sensory signals, or an existing memory trace and a new sensory signal, can be temporally associated by means of network timing (Hebb, 1949
). In a new form of associative plasticity, described by Humeau et al. (2003)
, heterosynaptic associative plasticity occurs between simultaneously activated thalamic and cortical paths to the LA. However, in vivo in response to a natural conditioned stimulus (CS), thalamo-amygdala activity precedes cortico-amygdala activity (Figure 11
). We propose that the structural behavior of the LAd network provides a mechanism for the continuity of thalamic afferent excitatory activity to promote associative heterosynaptic plasticity at cortico-amygdala afferents during fear conditioning (Dityatev and Bolshakov, 2005
; Humeau et al., 2003
; Schroeder and Shinnick-Gallagher, 2004
; Tsvetkov et al., 2002
). The network could then conceivably contribute to the refinement of the CS as well as in forming CS–CS associations and second-order conditioning. Part of the crude representation of the stimulus initially entering the amygdala through the thalamo-amygdala path could be replayed within the LA network, enabling them to be temporally linked to another thalamo-amygdala representation, or a higher processed cortico-amygdala representation (Johnson and LeDoux, 2004
). Such mechanism could conceivably play a critical role in synapse specificity for the long-term maintenance of stimulus specific fear memory (Doyère et al., 2007
).
Previous work has suggested that LAd-s and LAd-i cells participate differentially in the course of fear learning (Repa et al., 2001
). Long and short lasting plastic cells were observed with longer lasting neurons being more common in LAd-i. The latency range (20–30 ms) of long lasting plastic neurons is in the range of both LA network (N2–N3) and cortical synaptic responses. Thus, these neurons may receive CS information via the thalamic pathway and its internal LA reverberating network, or directly from the auditory cortex, or both. Convergence of CS–CS signals may contribute to the formation of longer lasting plasticity in these neurons. We find that the thalamo-amygdala evoked signal may continue to reverberate within the LAd up to 93 ms in vivo. Therefore the model of thalamic and cortical signal integration may also extend to other later occurring but temporally distinct signals afferent to the LAd such as hippocampal (Seidenbecher et al., 2003
) and other cortical inputs (Lindquist et al., 2004
). The precise temporal choreography of these other crucial synaptic afferents from other brains regions remains to be revealed. However, the present data provide a temporal network structure within the LAd upon which we may map further synaptic inputs.
Intra Network Plasticity
Following fear learning, monosynaptic thalamo-amygdala synapses are potentiated (Dityatev and Bolshakov, 2005
; Rogan et al., 1997
; Schafe et al., 2005
). We mimicked this learning process with LTP (Dityatev and Bolshakov, 2005
; Huang and Kandel, 1998
; Humeau et al., 2003
; Schroeder and Shinnick-Gallagher, 2004
). Contrary to the potentiated monosynaptic N1, peaks N2–N5 showed suppression. Thus, while the thalamic input is potentiated the lateral excitation and recurrent feedback from the LAd-i is suppressed. This phenomenon may play a role in network homeostasis, consistent with previous findings in the amygdala where induction of LTP leads to LTD at other synapses within the same amygdala neuron (Royer and Pare, 2003
). Thus another function of the LAd recurrent network could be to balance and distribute synaptic strength throughout the network during episodes of learning and memory in order to maximize signal to noise ratios of reinforced afferent signals and refine the fear memory trace.
NMDA receptor mediated recurrent networks promote propagation of activity (Nakazawa et al., 2003
; Wang, 2001
), and are essential for CA3 pattern completion of spatial cues in a water maze task (Nakazawa et al., 2002
, 2004
). Our data suggest a cumulative effect of NMDA receptor blockade on polysynaptic potentials in the LAd-s. In contrast to the constant suppression observed after LTP, which we argued is due to LTD at only one synaptic node in the LAd network, the NMDA receptor blockade has a cumulative suppression effect. Sequential synapses in the network with NMDA receptors could account for this cumulative effect. An alternative explanation would imply that different network synapses have NMDA receptors with different weights. Knowing the exact NMDA to AMPA receptor ratios (Humeau et al., 2003
; Weisskopf and LeDoux, 1999
), at each of the internal LAd network synapses identified here would provide clues about the functional computational capabilities of the LAd network. At the behavioral level, blockade of NMDA receptors in the LA disrupts second-order fear conditioning (Gewitz and Davis, 1997
). Our results suggest that this could be due to the disruption of LA recurrent connectivity.
SUMMARY
We describe a functional recurrent network in LAd network. In addition we reveal for the first time that the intra-LAd network is NMDA dependent and that its internal synapses are plastic. Analysis of the temporal sequence of polysynaptic activity reveals a network enabling integration of coincident sensory inputs across known sensory processing times in the LAd. We describe the architecture of a feedback excitatory network within LAd, it remains to be determined how intra LA GABA networks (Samson et al., 2003
; Woodruff and Sah, 2007
) regulate this feedback plasticity (Bauer and LeDoux, 2004
) and anxiety behavior (Quirk and Gehlert, 2003
). Memory is stored, distributed and accessed via micro networks (Douglas and Martin, 1995
; Douglas et al., 1995
; Hebb, 1949
; Johnson and LeDoux, 2004
; Nakazawa et al., 2004
). Therefore defining the structure, functional behavior and temporal characteristics of the LAd network is an essential step in revealing how memory of Pavlovian fear conditioning is encoded within the amygdala (Blair et al., 2001
; Davis, 2004
; Dityatev and Bolshakov, 2005
; LeDoux, 2000
, 2003
; Maren and Quirk, 2004
; Medina et al., 2002
; Pare et al., 2004
; Rodrigues et al., 2004
; Sah et al., 2003
). In providing an initial description and model of intra LA network behavior, these findings are important because they open a window into the intra amygdala associative learning machinery.
The authors declare that the research was conducted in the absence of any commercial or financial relationships that could be construed as a potential conflict of interest.
This research is supported by: an NSF–CNRS International Cooperative Grant (LRJ, VD, JEL); a CNRS PICS grant (VD, JEL); a EU-FP6 grant promemoria (VD); NIH grants MH58911, MH46516, MH38774, MH00956 (JEL); PSC-CUNY grant 66714-00 35 (BLB). LRJ held a NARSAD Young Investigator Award. We thank Dr Joshua Johansen for comments on the manuscript.
Li, X. F., Stutzmann, G. E., and LeDoux, J. E. (1996). Convergent but temporally separated inputs to lateral amygdala neurons from the auditory thalamus and auditory cortex use different postsynaptic receptors: in vivo intracellular and extracellular recordings in fear conditioning pathways. Learn. Mem. 3, 229–242.