Important factors for the three-dimensional reconstruction of neuronal structures from serial ultrathin sections
1
Division of Cerebral Circuitry, National Institute for Physiological Sciences, Okazaki, Japan
2
Department of Physiological Sciences, The Graduate University for Advanced Studies, Okazaki, Japan
Quantitative analysis of anatomical synaptic connectivity in microcircuits depends upon accurate three-dimensional (3D) reconstructions of synaptic ultrastructure using electron microscopy of serial ultrathin sections. Here we address two pitfalls in current methodology that lead to inaccurate reconstructions and compromise conclusions drawn from the data. The first pitfall is inaccurate determination of ultrathin section thickness, which negatively affects the 3D shape of reconstructions and therefore impairs quantitative measurement of synaptic structures. Secondly, current methodology significantly underestimates the number of synaptic junctions, with only two-thirds or less of genuine synaptic contacts being identified in dendrites that radiate within the plane of section. Here we propose a new methodology utilizing precise optical measurements of section thickness and successive observations of synaptic elements across serial ultrathin sections that corrects for these limitations to allow accurate 3D reconstruction of synaptic ultrastructure. We use this methodology to reveal that parvalbumin-expressing cortical interneurons have a much higher synaptic density than previously shown. This result suggests that this technique will be useful for re-examining synaptic connectivity of other cell types.
A deep understanding of cortical microcircuitry requires accurate quantitative measurements of morphological parameters. Such measurements are reliably made from three-dimensional (3D) reconstructions of tissue structure using electron-microscopic (EM) images of successive ultrathin sections (Fiala et al., 2002
; Holtmaat et al., 2006
; Karube et al., 2004
; Kubota and Kawaguchi, 2000
; Kubota et al., 2007
; White et al., 1994
). Because the generation of reconstructions is laborious and time-consuming, more efficient methods have recently been introduced that automate the reconstruction process and facilitate structural measurements (Denk and Horstmann, 2004
; Harris et al., 2006
; Knott et al., 2008
; Micheva and Smith, 2007
). However, two pitfalls in current methodology hinder accurate reconstruction of tissue morphology. The first is accurate determination of the thickness of ultrathin sections, any error in which will significantly affect the shape of reconstructed structures and the quantitative measurements that result. The commonly used method to estimate section thickness is the minimal folds method (Small, 1968
) which measures the width of ridges in the tissue formed when small folds of tissue adhere to themselves and protrude above the plane of the section. Section thickness is assumed to be one-half the width of the ridges. However, this method generates results that vary according to the condition of the resin, the type of tissue embedded, and the height of the fold. Therefore, the accuracy of these measurements is not always certain. Further uncertainty may result from distortion of ultra thin resin after folding. The second pitfall in serial reconstructions is accurate identification of synaptic contacts. The classic characteristics used to identify synapses include: (1) the existence of a parallel space about 20 nm wide between presynaptic and postsynaptic membranes, the so-called synaptic cleft, (2) the accumulation of small vesicles next to the presynaptic membrane in the presynaptic bouton, and (3) specialization of presynaptic and postsynaptic membranes. The cleft can most easily be identified when the section is cut perpendicular to the synaptic junction face, but its identification becomes much more difficult when sections are cut parallel to it. Here we introduce a new methodology that overcomes these limitations allowing accurate morphological reconstruction of neuronal tissue and identification of synaptic contacts occurring at all angles relative to the plane of section.
Ethics Statement
All experiments were conducted in compliance with the guidelines for animal experimentation of the Okazaki National Research Institutes.
Tissue Preparation
Three male Wistar rats (6 weeks of age, 140–160 g) were anesthetized with an overdose of Nembutal and perfused through the heart with 10 ml of a solution of 250 mM sucrose, 5 mM MgCl2 in 0.02 M phosphate buffer (PB; pH 7.4), followed by 300 ml of 4% paraformaldehyde containing 0.2% picric acid and 0.5% glutaraldehyde in 0.1 M PB. Brains were then removed and oblique horizontal sections (50 μm thick) of frontal cortex were cut on a vibrating microtome (Leica VT1200S, Nussloch, Germany) along the line of the rhinal fissure. Tissue sections were put in glass tubes containing 15% sucrose in 0.1 M PB for 1 h, and then in 25% sucrose and 10% glycerol in PB for 2 h, frozen in liquid nitrogen, and then thawed at room temperature. The sections were then incubated in 0.1 M PB containing 1% sodium borohydrate for 30 min and in 0.05 M Tris-buffered saline (TBS) containing 1% H2O2 for 30 min before incubation with primary antiserum against parvalbumin developed in mouse (1:4000, P-3171, Sigma-Aldrich, Saint Louis, MO, USA) diluted in TBS containing 10% normal goat serum and 2% bovine serum albumin overnight at 4°C. The sections were then incubated in biotin-conjugated secondary antiserum (1:200, BA-2000, Vector Laboratories, Burlingame, CA, USA) followed by avidin-biotin-peroxidase complex (VECTASTAIN Elite ABC Kit PK-6100, Vector Laboratories), and staining with diaminobenzidine (DAB) with nickel (0.02% DAB, 0.3% nickel in 0.05 M Tris–HCl buffer) as the chromogen for the peroxidase reaction (0.01%). The stained sections were post-fixed for 40 min in 1.5% potassium ferrocyanide and 1% osmium tetroxide, followed by 1 h in 1% osmium tetroxide alone and dehydrated in graded dilutions of ethanol with 1% uranyl acetate added at the 70% ethanol dehydration state. Sections were flat-embedded on silicon-coated glass slides in Epon. Following re-embedding of samples of tissue, they were serially re-sectioned at thickness settings between 30 and 90 nm using an ultramicrotome (Reichert Ultracut S, Leica Microsystems, Wetzlar, Germany).
Estimation of Section Thickness
The 90 nm thick sections were mounted on a formvar-coated single-slot copper grid. The minimal folds were photographed at ×100,000 magnification and the width of the folds were measured following calibration by a diffraction grating replica (# 607, Ted Pella Inc., Redding, CA, USA). Other 30, 70 and 90 nm thick sections were placed on a clean glass slide and the thickness estimated with a color 3D laser confocal microscope (VK-9750; Keyence, Osaka, Japan), which uses a laser (408 nm) to directly measure section thickness with an accuracy of 1 nm
1
.
Reconstruction of Red Blood Cells
Red blood cells often remain in blood vessels following perfusion-fixation. After light microscopic photography, the tissue containing red blood cells was re-sectioned at 90 nm perpendicularly to the original plane of section and cells were reconstructed from the serial ultrathin sections. The EM images of the red blood cells were captured using a CCD camera and three-dimensionally reconstructed using the 3D reconstruction software Visilog (Noesis, France).
Postembedding GABA Staining and Reconstruction of Parvalbumin-Positive Dendrites
Serial sections cut at a setting of 90 nm thickness of parvalbumin-positive tissue were mounted on formvar-coated grids. To discriminate between inhibitory and excitatory presynaptic terminals, we applied postembedding GABA immunohistochemistry to the serial ultrathin sections. The ultrathin sections were washed with TBS containing 0.1% triton-X (TX) and incubated with rabbit antiserum against GABA (1:5000; Sigma-Aldrich, A-2052) in TBS containing 0.1% TX overnight, then incubated with 15 nm-colloidal gold conjugated anti-rabbit IgG (1:100; BBInternational #GAR15, Cardiff, UK) overnight in TBS containing 0.1% TX, and stained with 1% aqueous uranyl acetate followed by lead citrate. Quantitatively synaptic boutons could be divided into two classes on the basis of gold particle densities (Figure 2
A). Particle densities were greatly different in GABA-negative and GABA-positive terminals: 0.57 ± 1.66/μm2 (n = 35) and 43.9 ± 17.4/μm2 (n = 18), respectively. In serial ultrathin sections, given presynaptic GABA-negative or GABA-positive boutons always showed similar colloidal gold density in multiple sections. GABAergic terminals were defined as terminals with a gold-particle density above 26 particle/μm2, while terminals with a gold particles lower than 10 particle/μm2 were assumed to be glutamatergic. The labeled dendrites and associated structures were photographed and digitized from EM negatives using a scanner (GT-9800F, Epson, Suwa, Japan). The structures were reconstructed using the 3D reconstruction software, Reconstruct
2
.
Electron Microscopic Tomography
The synaptic structures on the parvalbumin-positive dendrite were analyzed by tomography. The EM images were taken at 10,000× by tilting the sections between −60° and +60° in 2-degree steps using Hitachi H 7650 electron microscope equipped with a 1 MB CCD camera (1024 × 1024 pixels). The synapse images were processed by the tomography software EMIP (Hitachi High-Technologies Corp., Tokyo, Japan). Z-slices (estimated thickness, 1.75 nm) were obtained from the 70 nm thick sections.
Estimation of the Thickness of Ultra Thin Sections
We first estimated the thickness of the sections by the minimal folds method. The estimation of section thickness is half the width of minimal folds in the ultrathin section, which occur when a section adheres to itself in a low ridge. The minimum folding can be confirmed by the existence of a black line at the center of the ridge (Figure 1
A). The estimated section thickness by the minimal folds method was 20.4 ± 1.0 nm (n = 6) for the section cut at 30 nm set by the microtome, 29.9 ± 1.2 nm (n = 5) at 40 nm, 26.9 ± 2.5 nm (n = 6) at 50 nm, 42.4 ± 1.7 nm (n = 3) at 60 nm, 40.7 ± 1.2 nm (n = 6) at 70 nm, 49.8 ± 1.7 nm (n = 3) at 90 nm, and 62.7 ± 2.9 nm (n = 4) at 95 nm (Figure 1
B). The thickness obtained by the minimal folds method linearly increased, but the slope was smaller than unity (Figure 1
B).
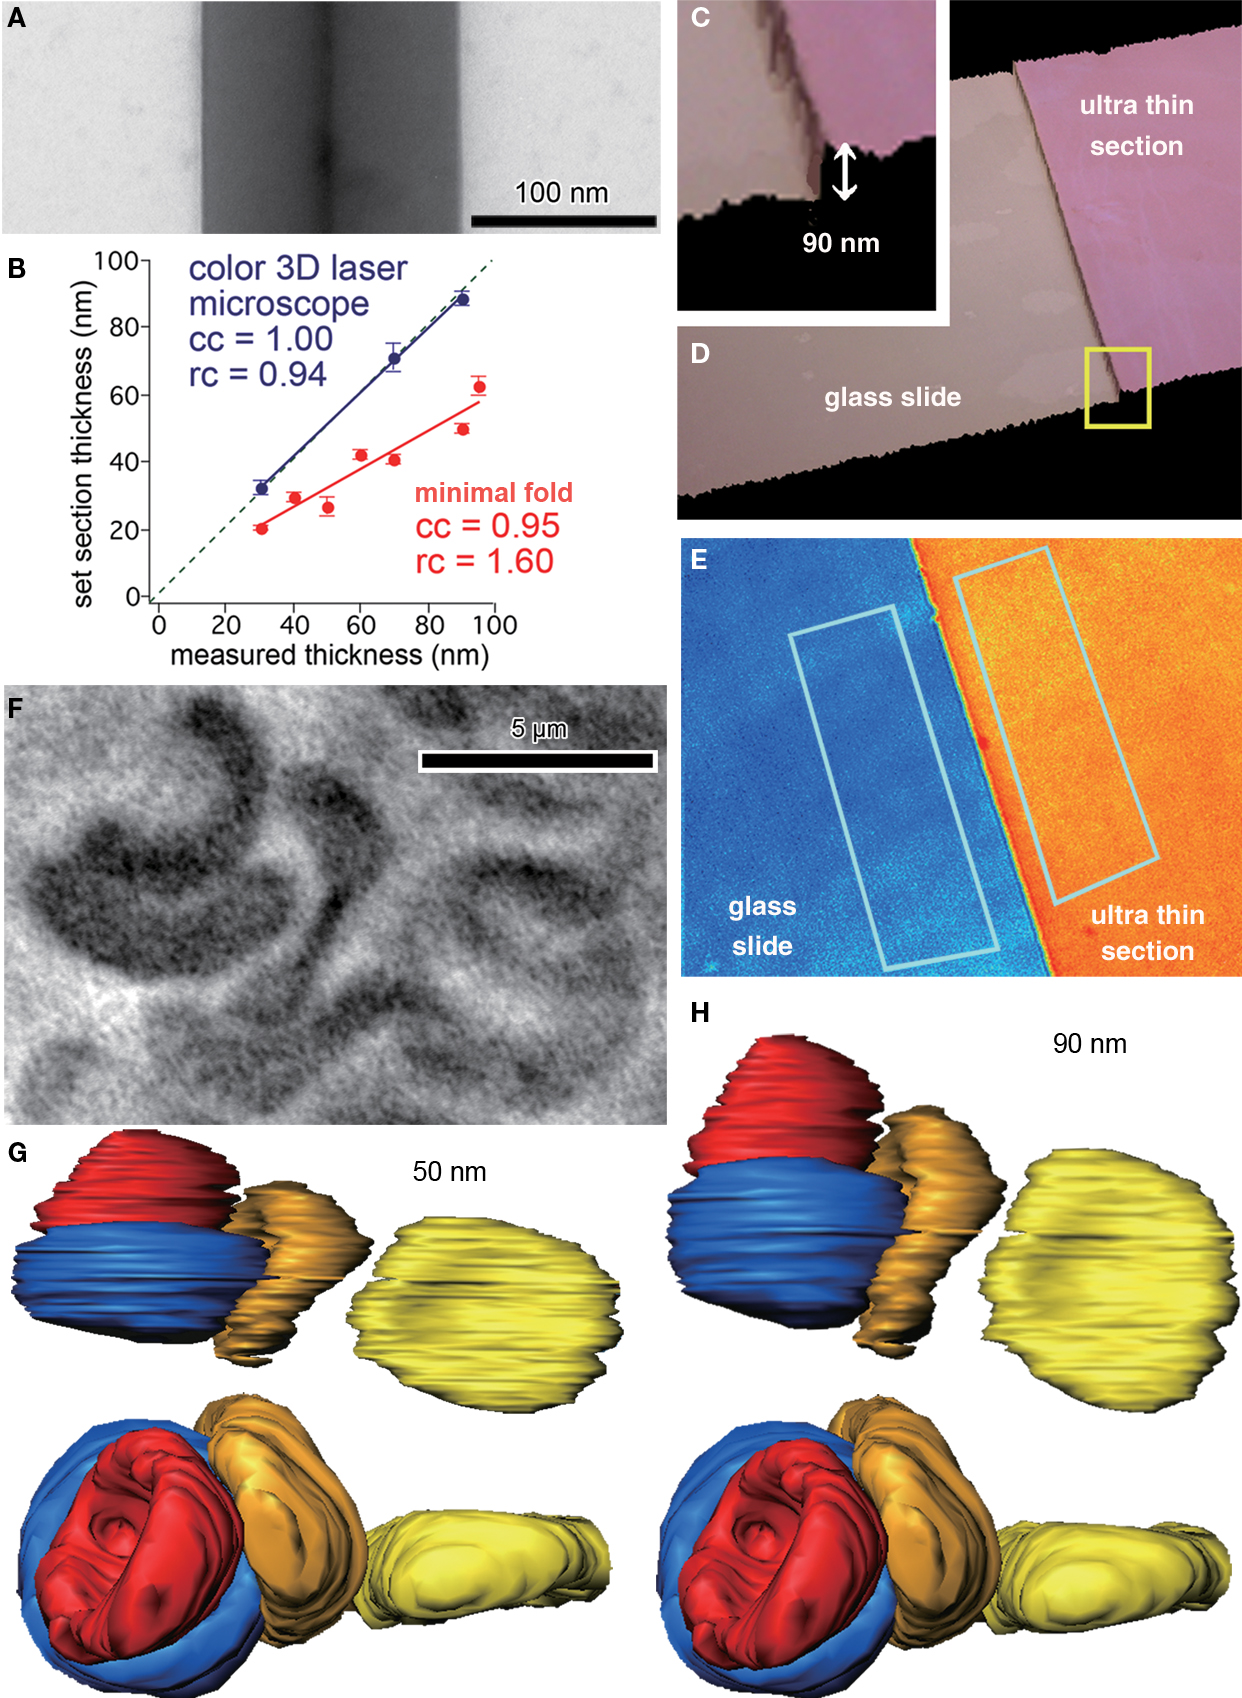
Figure 1. Thickness estimation of ultrathin sections for 3D reconstruction. (A) Minimal folds of an ultrathin section cut by a microtome set to cut 95 nm sections. Width of the minimal folds, twice the section thickness, was 130 nm, much less than expected. Note the black vertical line at the center of the fold, which is the adhered, folded membrane perpendicular to the plane of a section. (B) Correlation between section thicknesses set by the microtome and those measured by a color laser 3D microscope or the minimal folds method. The thicknesses measured by the optical method were more similar to those set by the microtome than those measured by the minimal folds method, which were 50–80% of the set section thickness. (C, D) Three-dimensional view of ultrathin section (90 nm thickness, pink) on glass slide (beige) obtained by the laser scanning microscope. The border of the section and slide surface is clearly identified in larger magnification (C). (E) The pseudocolor image representing height of the ultrathin section (orange) and glass slide (blue). Note that the colors are uniformly distributed on the surface of the section and glass slide, indicating the surface flatness. Thickness of the ultrathin section was estimated from the difference between average heights of the two areas. Rectangles (about 50 μm2), indicate areas used for evaluating the average height. (F) Light microscopic photograph of red blood cells. (G, H) The 3D images of the red blood cells reconstructed assuming 50 nm (G) and 90 nm (H) in section thickness. The view of the upper images is the same as in the light microscopic photograph in (F); the view of the lower images is “side-on”. The red blood cells reconstructed assuming a 90 nm section thickness were more similar in shape and size to those in the light microscopic photograph than were cells reconstructed assuming a 50 nm section thickness.
On the other hand, optical measurements by the color laser 3D profile microscope reported the thickness to be 32.5 ± 2.1 nm (n = 2) at 30 nm, 71.0 ± 4.5 nm (n = 5) at 70 nm, and 89.0 ± 2 nm (n = 4) at 90 nm (Figures 1
B–E). The section thickness measured by the optical method linearly increased, and the slope was close to unity.
To validate the reliability of the minimal folds method and optical laser measurements, we compared the measured diameter of red blood cells in reconstructed ultrathin sections with photographs of the same cells taken by light microscopy. Measurements from photographs (taken using a 100× oil-immersion objective lens, 1.4 N.A.; Olympus, Tokyo, Japan) indicated the vertical and horizontal diameters of the red blood cell in the right side of Figure 1
F were 6.15 and 5.73 μm, respectively (corresponding to yellow reconstructions shown in Figures 1
G,H). The tissue was cut perpendicular to the plane of section for EM observation with the microtome thickness set to 90 nm. Assuming an actual 90 nm thickness per section, the reconstructed diameters of the red blood cell were 6.20 μm (about 101% of LM image) and 5.73 μm (about 100% of LM image) in the vertical and horizontal directions, respectively (yellow red blood cell in Figure 1
H). On the other hand, when using the 50 nm section thickness estimated by the minimal folds method, the vertical and horizontal diameters were only 3.41 μm (about 55% of LM image) and 5.73 μm (about 100% of LM image), respectively (yellow red blood cell in Figure 1
G). Further, the reconstructed morphology of the red blood cell was much less elliptical when using a 90 nm section thickness. Therefore, we conclude that the minimal folds methods underestimate the thickness of ultra thin sections, and therefore recommend that thickness measurements of sample sections be obtained by the optical method.
Identification of Synaptic Contacts
We used the nickel-DAB method for pre-embedding parvalbumin immunohistochemistry so as to clearly observe postsynaptic density (PSD) structure. Immuno-precipitation of nickel–DAB selectively stains intracellular structures such as microtubules and PSD, and the distribution of the precipitation under the EM is much sparser than when DAB-only methods are used. The resulting images allow clear identification of PSD structures unobscured by dense staining of the cytoplasm (Figure 2
).
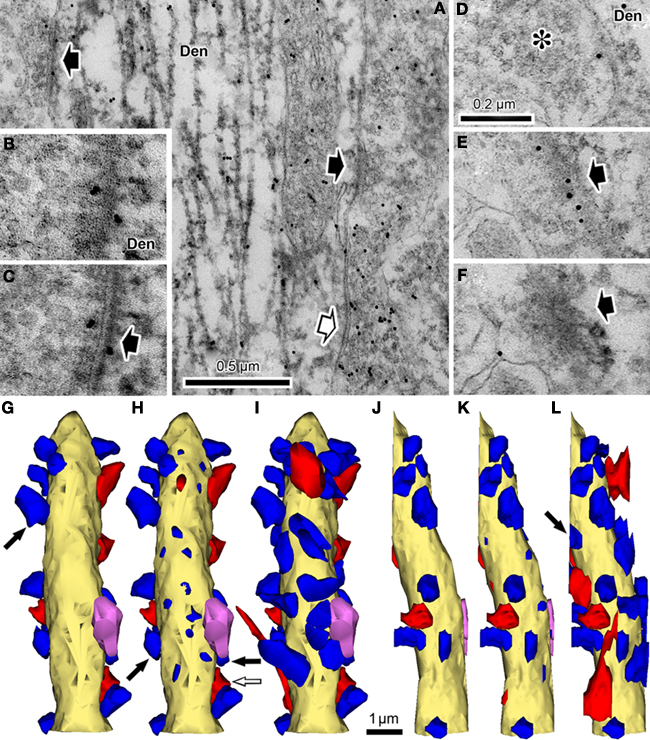
Figure 2. Synaptic contact identification on parvalbumin-positive dendrites together with GABA post-embedding staining. (A) This dendrite (Den) is labeled with nickel-DAB precipitate for pre-embedding parvalbumin immunoreaction and colloidal gold for post-embedding GABA immunoreaction. A GABA-positive bouton makes a symmetrical synaptic contact (white arrow) and two GABA-negative boutons make asymmetrical contacts onto the parvalbumin-positive dendrite. The cleft plane of these synaptic contacts is vertically angled to the plane of section, so the cleft is clearly observed. (B) GABA-negative synaptic contact with the cleft, cut diagonally on the parvalbumin positive dendrite (Den). The cleft is not clearly observed. (C) The section was tilted about 30° in order to see the cleft clearly (arrow). (D–F) A GABA-negative bouton makes synaptic contact with the cleft occurring at a steep angle to the plane of section, identified in the successive serial sections. In the first section, a presynaptic bouton with many synaptic vesicles (D, asterisk) is found next to a parvalbumin positive dendrite (Den). The next section contains a few vesicles and a small number of electron dense objects, most likely indicative of a PSD (E, arrow). The third section shows the PSD spreading into a nearby area (F, arrow). Colloidal gold particles are often observed on and/or near PSD, because PSD is located in a parvalbumin-positive dendrite that contains GABA. Scale bar in (D) for (B–F). (G–L) The 3D reconstructed parvalbumin-positive dendrite (yellow) with GABA-positive synaptic boutons (red), GABA negative synaptic boutons (blue), and a GABA- and parvalbumin-positive bouton (pink). (G) Plot of the synaptic terminals with clearly visible synaptic clefts. Using this definition of synapses about half of the dendritic surface was not covered with any synaptic contacts. Arrow, a synaptic bouton corresponding to the synapse shown in (B) and (C). (H) Plot of the same dendrite including the synaptic junctions identified by the criteria proposed in the present study. The upper surface of the dendrite also has many the synaptic junctions. Black arrows, synaptic boutons corresponding to the GABA-negative synapses and white arrow corresponding to the GABA-positive synapse in (A). (I) Reconstruction of the presynaptic boutons for the synaptic junctions in (H). The entire surface area was covered with the synaptic boutons. (J–L) Left hand side views of the parvalbumin positive dendrite shown in (G–I). Arrow in (L), synaptic bouton corresponding to the synapse in (D–F).
It is relatively simple to identify synaptic contacts when the plane of the synaptic cleft is vertical or steeply angled to the plane of section (Figures 2
A–C). On the other hand, it is much more difficult to identify synaptic contacts when the cleft plane is parallel to, or at a low angle with respect to, the plane of section of the slice. Since the dendrites upon which synapses make contact often radiate in multiple planes, it is a frequent occurrence that some reconstructed dendrites extend parallel to the plane of section (Figures 2
A–F). We have observed that cortical parvalbumin-positive dendrites receive many synapses on their dendritic shafts (unpublished observation), as has been observed in hippocampal parvalbumin-positive dendrites (Gulyas et al., 1999
). When these neurons are reconstructed and examined for synaptic contacts using traditional methodologies for identifying synaptic junctions, the dendritic surfaces parallel to the plane of section were found to have very few synaptic contacts compared to those dendritic surfaces at right angles to the plane of section, suggesting a failure to identify synaptic junctions occurring parallel to the plane of section (Figures 2
G,J). In an attempt to better identify these synapses, we looked for progressive sequences of synaptic characteristics in serial 70 nm thick sections (Figures 2
D–F). A better example of such a progressive sequence done with a tangential section of a parvalbumin-positive dendrite without GABA postembedding immunohistochemistry is shown in Figure 3
. The electron dense nickel-DAB immuno precipitate was found lightly on the intracellular structures in the cytoplasm of the parvalbumin positive dendrite, and it still prevented detailed observation of the ultra structure of synaptic contact. Therefore, we avoided using the stained portion of the dendrite. Instead, we followed the dendrite into the middle of the section to find the positive dendrites lost the stain density for this analysis. We found the objects related to synapse formation in correct synaptic sequence in the serial 70 nm thick sections. In the first and second sections, there were many synaptic vesicles in the presynaptic bouton (Figures 3
A,B). In the next section, we found many round-shaped electron dense structures of ∼35 nm diameter (Figure 3
C), but only few synaptic vesicles. These round-shaped electron dense structures likely to correspond to the “presynaptic grid” (Peters et al., 1991
). In the fourth section, electron dense flocculate material was seen, which probably indicates a PSD (Figure 3
D). In the fifth section, we observed a thin snippet of PSD within the cytoplasm of the postsynaptic dendrite (Figure 3
E). Wider field of this synaptic structure in serial sections were shown in Figures 3
F–J to see the surround structure. The other synapse in the serial tangential sections also showed the similar progressive sequence (Figures 3
K–O). We therefore believe the contact, identified in these progressive sequences of serial sections, is a synaptic contact.
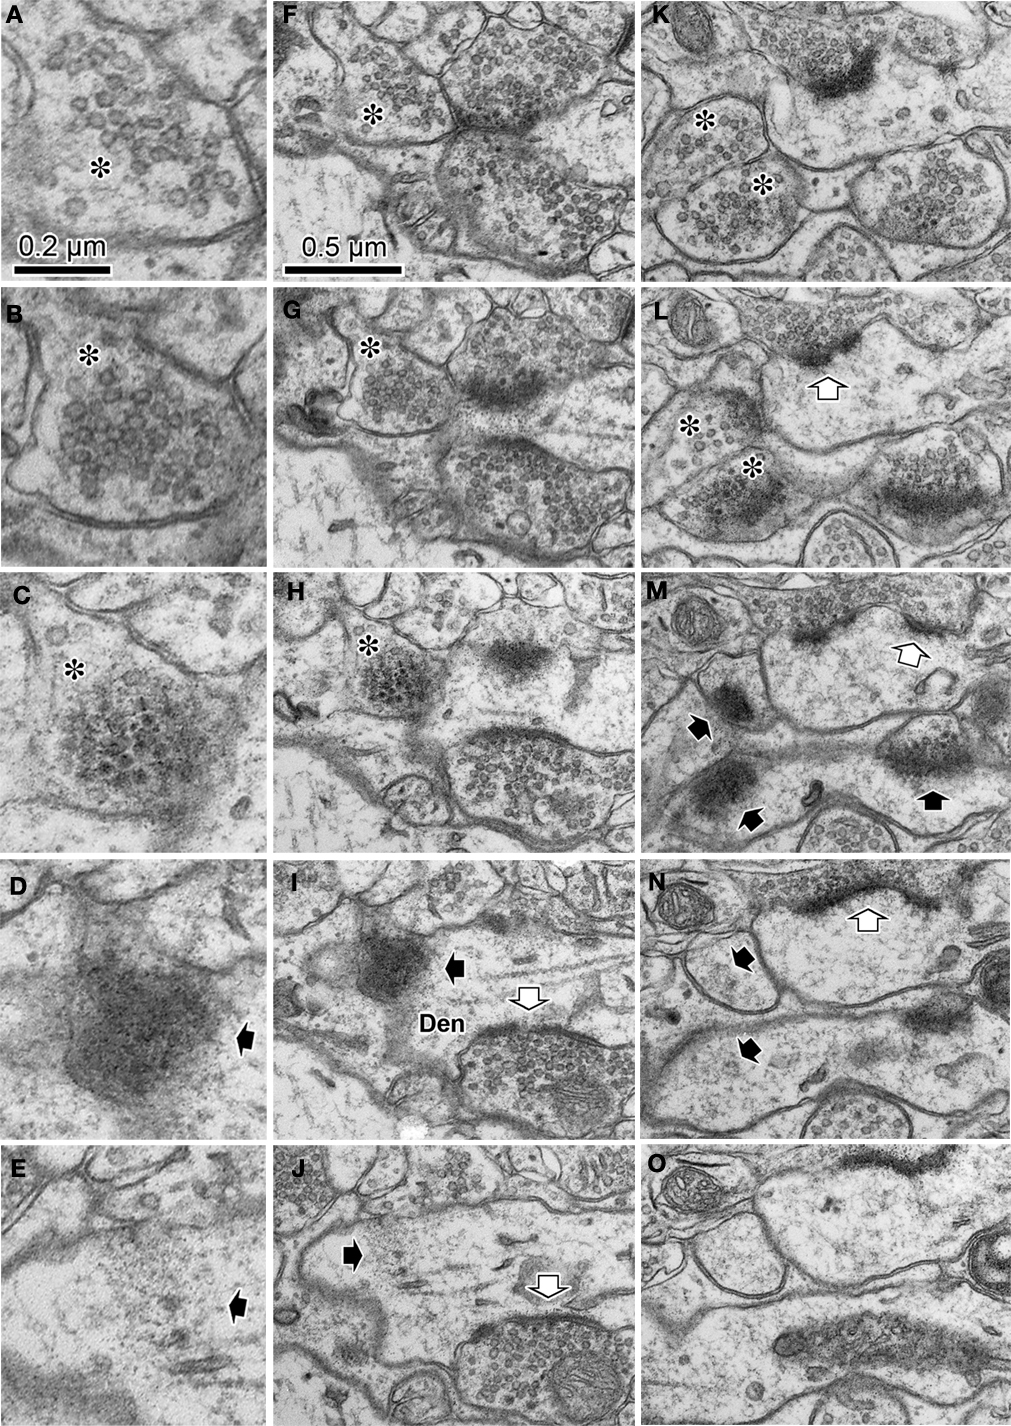
Figure 3. Serial ultrathin sections containing synapses with cleft plane cut in parallel or obliquely. (A–E) A synaptic contact with a cleft plane cut in parallel to the section plane is identified in the successive serial sections. In the first and second sections, many synaptic vesicles are found in the presynaptic bouton (A, B, asterisk). The next section contains only a few vesicles and many round-shaped electron dense spots of about 35 nm diameter (C, asterisk), that are likely to correspond to the pre-synaptic grid. The fourth section contains electron dense objects indicative of a PSD (D, black arrow). In the fifth section, we observe a small part of the electron dense objects and the cytoplasm of the postsynaptic dendrite (E, black arrow). Scale bar in (A) is for (A–E). Wider field of this synaptic structure in serial sections were shown in (F–J) to see the surround structure. White arrow in (I, J), a synaptic contact identifiable by classic methodology. The other synapse in the serial tangential sections also showed the similar progressive sequence (K–O). (K) A large number of synaptic vesicles in presynaptic boutons (asterisk). (L) PSD traces at edges of the boutons with small vesicles (asterisk). The presynaptic boutons display some round-shaped electron dense substances (presynaptic grid-like objects). (M) Electron dense flocculate substance (black arrows, postsynaptic densities) in the postsynaptic spine (upper) and dendrite (lower). White arrow, a classically defined synapse contact. (N) Traces of the electron dense PSD in the cytoplasm of the postsynaptic spine (upper black arrow) and dendrite (lower black arrow). (O) Postsynaptic spine and dendrite without any synaptic objects. Scale bar in (F) is for (F–O).
To confirm the presence of a synaptic contact, we applied tomographic analysis to observe structural changes occurring within individual 70 nm thick sections and detected gradual structural changes in the following order: (1) many synapse vesicles (Figures 4 and 5
); (2) presynaptic grids (Figure 5
); (3) synaptic cleft structures (Figures 5 and 6
); (4) PSDs (Figures 5
–7
); and (5) cytoplasm of postsynaptic dendrite or spine (Figure 7
). Structures following this sequence are indicative of a synaptic contact (Supplementary Material available online), regardless of the target structure (spine, dendrite, or soma). Tomography analysis confirmed that we can identify synapses even when synaptic membranes lie in the plane of the slice section or intersect at very oblique angles.
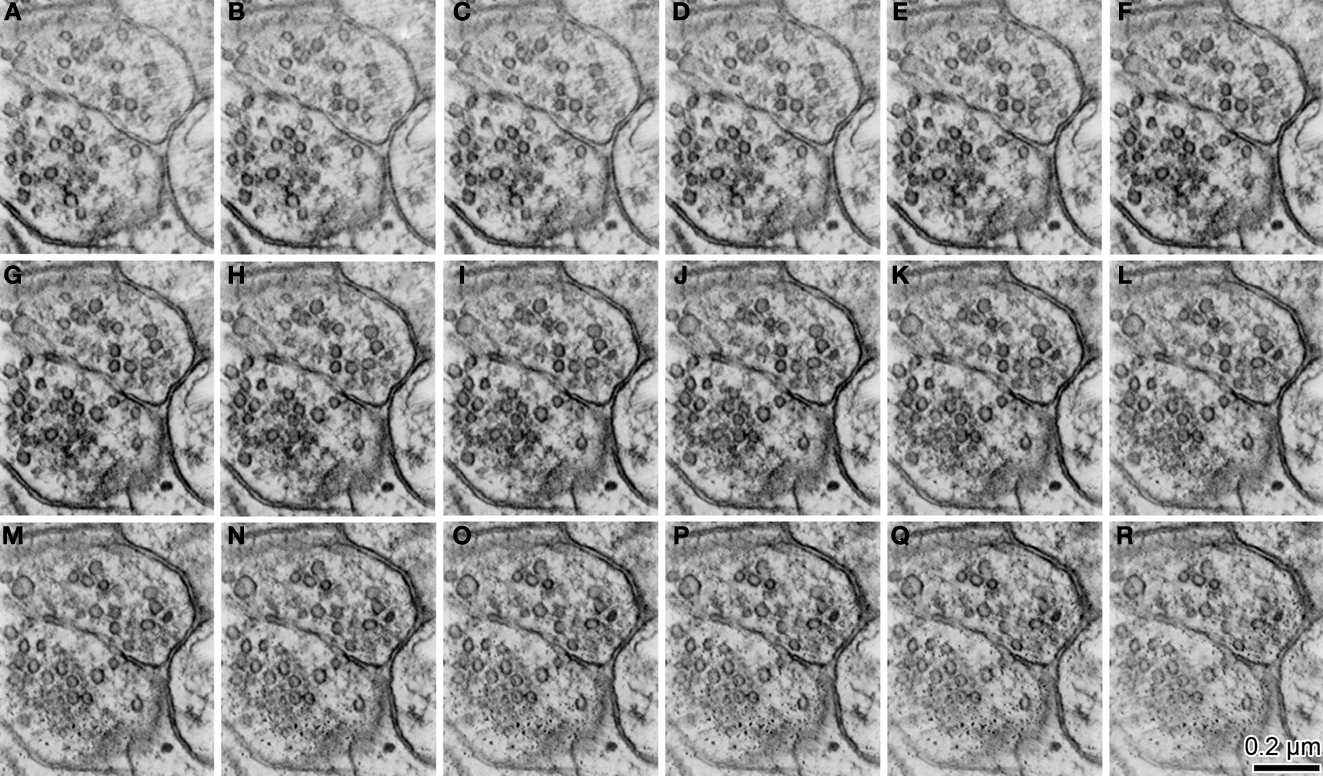
Figure 4. The serial z-slice sections obtained by the tomography analysis showing the synaptic terminals shown in Figure 3
K. We picked up 16 z-slice sections (A–R) of good quality from the middle of the z-slice sequence. The estimated thickness of the z-slice section is 1.75 nm. Some of the small vesicles (∼35 nm) emerged and disappeared within this series.
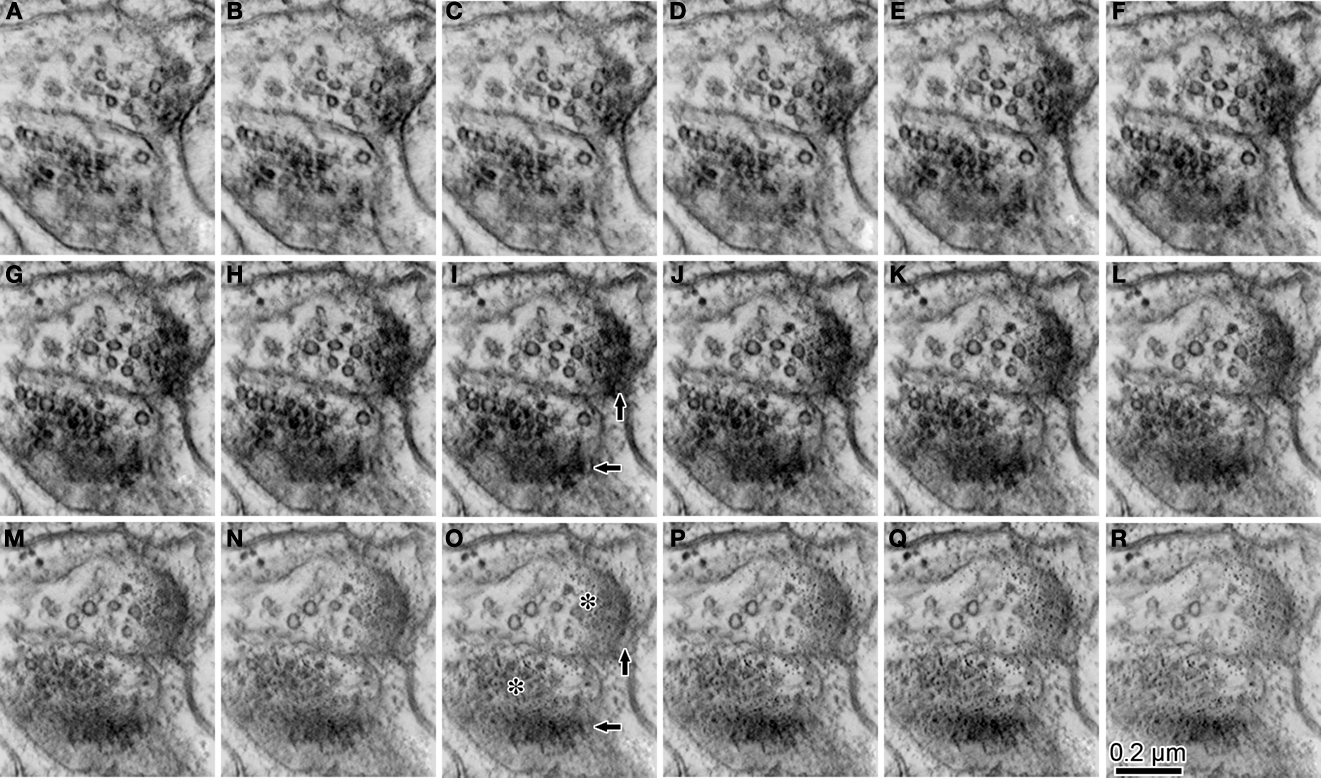
Figure 5. The serial z-slice sections obtained by the tomography analysis showing the synaptic boutons shown in Figure 3
L. We picked up 16 z-slice sections (A–R) of good quality from the middle of the z-slice sequence. The estimated thickness of the z-slice section is 1.75 nm. Some of the small vesicles (∼35 nm) emerge and disappear within the series, and presynaptic grids are seen. Traces of the PSD gradually emerge at the edge of the presynaptic boutons [for example; arrows in images (I and O)]. Intermediately electron dense flocculate substance [for example; asterisks in image (O)] emerges continuously from the location where most synaptic boutons were found in the previous z-slices. This intermediately dense flocculate probably corresponds to the synaptic cleft.
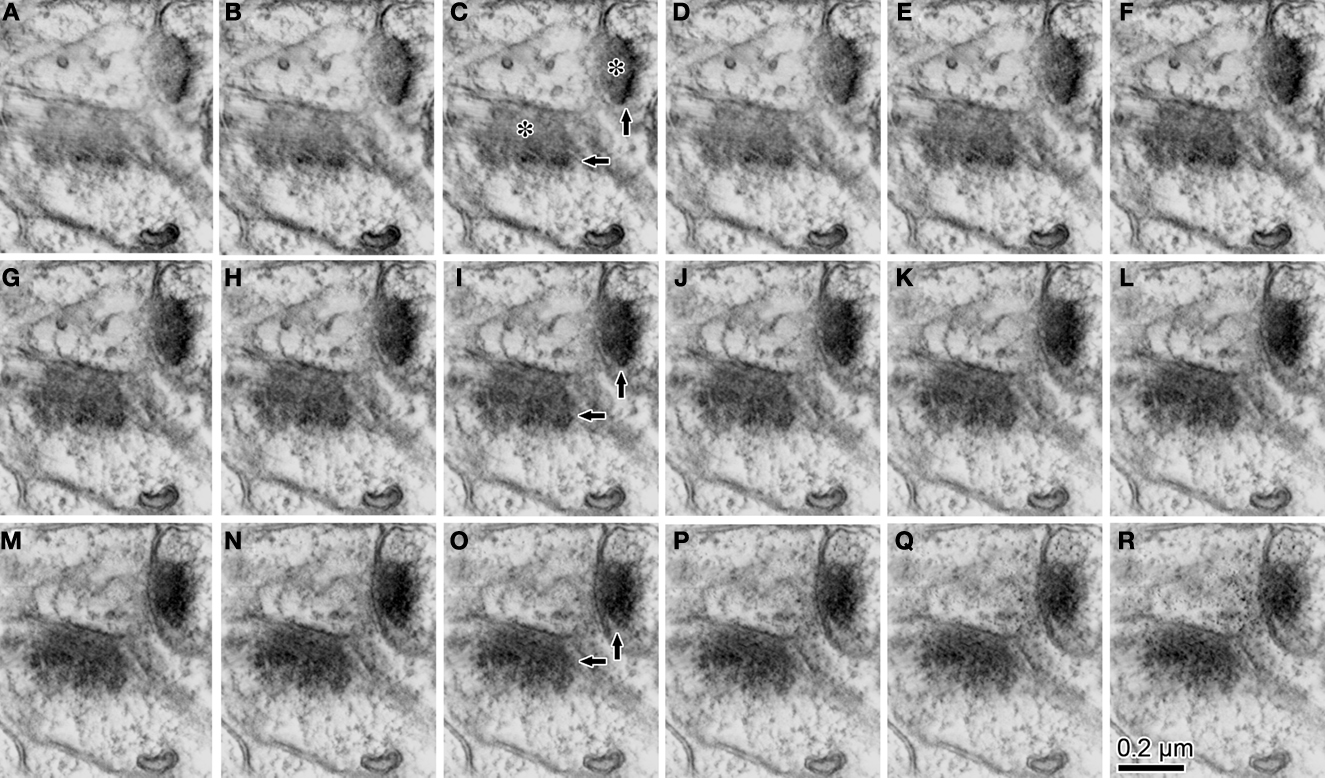
Figure 6. The serial z-slice sections obtained by the tomography analysis showing the postsynaptic dendrite and spine in Figure 3
M. We picked up 16 z-slice sections (A–R) of good quality from the middle of the z-slice sequence. The estimated thickness of the z-slice section is 1.75 nm. The Intermediately electron dense flocculate substance presumably synaptic cleft structure [for example; asterisks in image (C)] emerges continuously from the location where most synaptic boutons were found in the previous ultrathin section. Highly electron dense flocculate substance [for example; arrows in (C, I, O)], PSD, emerged at the edge of the intermediate one [arrows in (C)]. It gradually took over the domain of the intermediate electron dense flocculate substance (A–R).
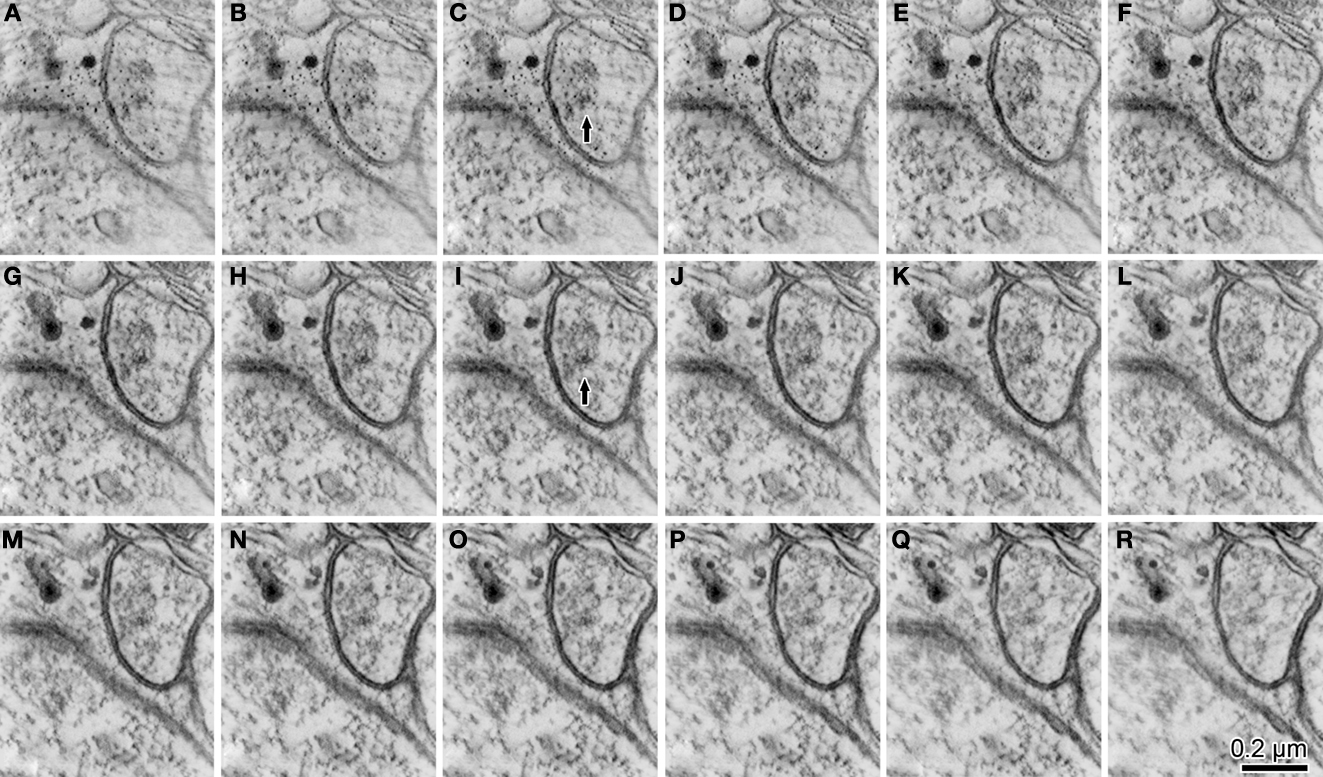
Figure 7. The serial z-slice sections obtained by the tomography analysis showing the postsynaptic dendrite and spine in Figure 3
N. We picked up 16 z-slice sections (A–R) of good quality from the middle of the z-slice sequence. The estimated thickness of the z-slice section is 1.75 nm. Traces of the electron dense PSD [for example; arrow in images (C, I)] were in the cytoplasm of the postsynaptic spine.
Overall, we found about one-third to one-half of synapses onto shafts were not identified using traditional standards for synaptic contacts when the cleft plane is parallel to, or at a low angle with respect to, the plane of section of the slice. For instance, the parvalbumin-positive dendrite (7.6 μm in length) shown in Figures 2
G–L had 17 synapses (5 GABA-positive and 12 GABA-negative synapses) identified using classic synaptic indicators, all of which were located on the surface perpendicular to the plane of sectioning (Figures 2
G,J). On the other hand, 19 synapses (3 GABA-positive and 16 GABA-negative synapses) were found on the upper and lower surfaces of the dendrite parallel to the plane of section using the progressive identification of synaptic markers in serial sections proposed in this study (Figures 2
H,I,K,L). With these added synapses, we reveal that the dendrite is densely covered by synaptic boutons on almost all surfaces (Figures 2
I,L). Analysis of five parvalbumin-positive dendrites including the dendrite in Figure 2
(mean length, 20.7 μm; total reconstruction length, 103.3 μm) revealed 285 synapses (243 GABA-negative, 35 GABA-positive and 7 GABA/parvalbumin-positive synapses), of which 79 (28%; 75 GABA-negative, 4 GABA-positive, and no GABA/parvalbumin-positive synapses) was only identifiable using this new technique.
We propose two new methodologies that improve the accuracy of 3D reconstruction of neuronal ultrastructure and facilitate accurate synapse identification. We use these methodologies to reveal that parvalbumin-positive cortical interneurons have a much higher synaptic density than previously appreciated from data using classic methodologies for synaptic identification.
Accurate measurement of section thickness is a critical first step for precise 3D reconstruction of synaptic structures. Our data indicate that the most frequently used method for measuring section thickness, the small fold method, produces significant errors that impair subsequent reconstruction of synaptic structures. An alternative method measures section thickness using optical interferometers (Nomarski) (De Groot, 1988
). However, this technique has not been widely used because of the complexity of the instrument and its difficulty of use and because it may depends upon the user’s subjective visual impression. A third way to estimate section thickness is the cylindrical diameter method, which depends on the measured width of elongated mitochondria found parallel to the plane of section (Fiala and Harris, 2001
). Based on the number of sections containing longitudinally located mitochondria and the width of the mitochondria, one can estimate the thickness of the sections, assuming the cross section of the mitochondria are round. However, mitochondria may not be truly cylindrical and/or the upper and bottom end sections may contain the mitochondria only in part of its thickness, and therefore this method may not provide an accurate estimation of thickness (Knott et al., 2008
).
Our data indicate the color 3D laser confocal microscope provides a more robust measure of section thickness than any of these other classic methodologies. It also has the advantage of providing a surface image of any object with 1 nm resolution in height and width measurement. Here we demonstrate that it can be used for accurate measurement of ultra thin sections of resin embedded tissue. Our present results also indicate that ultrathin sections with the desired thickness can easily be made from the ultramicrotome with a high degree of certainty.
There are other aspects that might limit accurate 3D reconstruction of synaptic structures, such as distortion of shape during ultrathin sectioning or damage of ultrathin sections under electron beam. However, we found that reconstructed red blood cells were quite similar in shape and size, indicating that careful processing of tissue can limit damage to the tissue and preserve accurate reconstructions. One must also consider tissue shrinkage during fixation and embedding. Our previous measurements indicated that, after fixation, dehydration, and embedding in Epon, the tissue shrank to 90% of original size (Karube et al., 2004
). Shrinkage was not corrected for in the present analysis.
Underestimating the number of synapses onto dendritic shafts radiating parallel to the plane of section is significant problem for quantitative stereology. Our experience processing serial sections for 3D reconstruction analysis suggests this underestimation is 25% or more. In a previous study, we tested whether all axonal boutons identified at with light microscopy are associated with synaptic junctions (Karube et al., 2004
). Consecutive investigation of light microscopically identified boutons (59 boutons) of two FS cells with EM found that 46 boutons (78%) showed clear synaptic junctions, with another 12 boutons (20%) having synaptic vesicles but no identifiable junction, and one bouton (2%) contained only a mitochondrion (Figure 1F in Karube et al., 2004
). It is likely that the missing synaptic junctions for those boutons with synaptic vesicles were lying in the plane of section. We also found similar ambiguity when identifying synapses onto spine heads. About 75% of cortical spines (94 out of 125) contacted by symmetrical synapses from axon terminals of nonpyramidal cells were found to also receive an asymmetrical synapse (Figure 4 in our previous paper, Kubota et al., 2007
). The remaining 25% of GABA-receptive spine heads did not have any additional asymmetrical synaptic contact. Since we now know that all synapses on neuronal surface are not identified when using only the classical synapse indicators, it is possible that additional asymmetrical contacts onto these 25% of spines were obscured based on their orientation within the plane of section of the ultrathin slice.
The present study clearly demonstrates that progressive sequences of synaptic characteristics in serial ultrathin sections can identify synaptic contacts even when they occur parallel to the plane of section. We confirmed this using EM tomography by observing the structural changes occurring within individual 70 nm thick sections. We can now postulate that synaptic junctions can be identified by the progressive sequence of synaptic indicators, as well as by classical methodologies. This may improve the quality and quantity of morphological data because tomography analysis is time consuming and the technology required is not widely distributed.
Together, our data demonstrate that more accurate measurement of section thickness (using a laser measurements or a well-calibrated microtome) and careful identification of synaptic contacts occurring tangential to the plane of section, generate more accurate reconstructions and therefore more robust data with which to understand synaptic connectivity in neuronal circuits.
The authors declare that the research was conducted in the absence of any commercial or financial relationships that could be construed as a potential conflict of interest.
We thank Drs. E. G. Jones, J. P. Bolam and A. Gulledge for valuable comments on the manuscript. We thank Y. Itoh, N. Yamaguchi and A. Sekigawa for technical assistance. Dr. E. Nakazawa and Ms. Akiko Fujisawa at Hitachi High-Technologies Corporation for tomography analysis. This work was supported by grant-in-aid for scientific research from the Ministry of Education, Culture, Sports, Science and Technology of Japan (18019037 to Y. Kubota, 20020032 to Y. Kawaguchi); Hayama Center for Advanced Studies (HCAS); and the Naito Foundation Subsidy for Natural Science Researches. The funders had no role in study design, data collection and analysis, decision to publish, or preparation of the manuscript.
Supplementary Video, Animation file demonstrating the change in synaptic structure over the course of successive z-slices obtained from the tomography of four successive 70 nm thick sections. The appearance order of synapse-related structures corresponds well to that of synapses observed perpendicularly and identified using classic methodology. The above materials can be found online at http://www.frontiersin.org/neuralcircuits/paper/10.3389/neuro.04/004.2009
.