Sub-millisecond firing synchrony of closely neighboring pyramidal neurons in hippocampal CA1 of rats during delayed non-matching to sample task
1
Khoyama Center for Neuroscience, Faculty of Computer Science and Engineering, Kyoto Sangyo University, Kyoto, Japan
2
Precursory Research for Embryonic Science and Technology, Japan Science and Technology Agency, Kawaguchi, Japan
3
Department of Psychology, Kyoto University, Kyoto, Japan
4
Core Research for Evolution Science and Technology, Japan Science and Technology Agency, Kawaguchi, Japan
Firing synchrony among neurons is thought to play functional roles in several brain regions. In theoretical analyses, firing synchrony among neurons within sub-millisecond precision is feasible to convey information. However, little is known about the occurrence and the functional significance of the sub-millisecond synchrony among closely neighboring neurons in the brain of behaving animals because of a technical issue: spikes simultaneously generated from closely neighboring neurons are overlapped in the extracellular space and are not easily separated. As described herein, using a unique spike sorting technique based on independent component analysis together with extracellular 12-channel multi-electrodes (dodecatrodes), we separated such overlapping spikes and investigated the firing synchrony among closely neighboring pyramidal neurons in the hippocampal CA1 of rats during a delayed non-matching to sample task. Results showed that closely neighboring pyramidal neurons in the hippocampal CA1 can co-fire with sub-millisecond precision. The synchrony generally co-occurred with the firing rate modulation in relation to both internal (retention and comparison) and external (stimulus input and motor output) events during the task. However, the synchrony occasionally occurred in relation to stimulus inputs even when rate modulation was clearly absent, suggesting that the synchrony is not simply accompanied with firing rate modulation and that the synchrony and the rate modulation might code similar information independently. We therefore conclude that the sub-millisecond firing synchrony in the hippocampus is an effective carrier for propagating information – as represented by the firing rate modulations – to downstream neurons.
In several brain regions, strongly modulated firing rates of neurons can provide accurate information about external stimuli (Hubel and Wiesel, 1977
) and behaviors (Georgopoulos et al., 1986
), as well as internal cognitive processes (Funahashi et al., 1989
). These rate changes of neurons in relation to internal or external events have yielded extremely valuable insights into the functioning of the brain. However, the synaptic strength to downstream neurons by the firing rate of a single neuron per se is extremely weak. On the other hand, according to the cell assembly hypothesis, the relative timing of spikes among neurons within a functional group underlies cognitive processing (Hebb, 1949
). The synaptic influence of multiple neurons converging onto downstream neurons is much stronger if they fire simultaneously (Tsodyks and Markram, 1997
; Bi and Poo, 1998
). Therefore, strong firing synchronization with high temporal precision is optimal for conveying information (Diesmann et al., 1999
; Reyes, 2003
). Previous experimental (Macvicar and Dudek, 1981
; Schmitz et al., 2001
; Litvak et al., 2003
; Reyes, 2003
) and theoretical (Softky, 1994
; Gerstner et al., 1996
; Diesmann et al., 1999
) studies have suggested that neurons and neuronal networks are able to propagate spikes with high temporal precision. The stimulus-dependent and behavior-dependent modulations of spike correlations between distantly located neurons (greater than ca. 100 μm) within a precision of more than 1 ms have been reported in various cortical areas including visual (Singer and Gray, 1995
), auditory (Sakurai, 1996
), somatosensory (Nicolelis et al., 1995
), motor (Riehle et al., 1997
) and frontal (Vaadia et al., 1995
) areas, and in the hippocampus (Sakurai, 1996
; Harris et al., 2003
). Conventional single-unit and multi-unit recordings, however, failed to detect firing synchrony with sub-millisecond precision among closely neighboring neurons (less than ca. 100 μm) because, when two or more neurons recorded from one electrode co-fire with sub-millisecond precision, the waveforms overlap and are not easily separated. This is designated as ‘the spike overlapping problem’ (Gray et al., 1989
; Henze et al., 2000
; Takahashi et al., 2003a
,b
; Buzsaki, 2004
; Takahashi and Sakurai, 2005
). To solve the problem, we recently developed an innovative spike sorting algorithm with an extension of independent component analysis (ICA) (Hyvarinen, 1999
) (ICSort) (Takahashi et al., 2003a
) and the use of 12-channel recording electrodes (dodecatrodes) (Takahashi and Sakurai, 2005
). Our previous studies (Takahashi et al., 2003a
,b
; Takahashi and Sakurai, 2005
, 2007
; Sakurai and Takahashi, 2006
) demonstrated that ICSort and dodecatrodes can detect sub-millisecond neuronal interactions in local circuits.
Using a combination of ICSort and dodecatrodes, we investigated whether closely neighboring pyramidal neurons in the hippocampus synchronize with sub-millisecond precision and whether synchronization codes salient information. To investigate these phenomena, we used an auditory delayed non-matching to sample (DNMS) task because this task enabled us to study neuronal synchrony in the hippocampus under conditions in which the processing of internal cognitive events (retention of a stimulus and comparison of stimuli) and external events (stimulus inputs) and motor outputs (go/no-go responses) are contained and distinguishable. Results reveal robust sub-millisecond synchronized spikes (SSSs) among closely neighboring pyramidal neurons; the SSSs, together with the rate modulation of single neurons, code salient information in a behavioral task.
Animal Preparation and Recordings
Six male Wistar rats were implanted with three to five movable dodecatrodes (Takahashi and Sakurai, 2005
, 2007
), each of which consisted of 12 microwires (8 μm diameter), in the hippocampus (3–4 mm posterior to the bregma, 1.5–3.5 mm from the midline). To stabilize the recording conditions and minimize electrode drift, the maximum range for the movement of dodecatrodes was held at 100 μm per day. This minimized the pressure to the brain tissue attributable to the lowering of the dodecatrodes. We recorded neuronal data only upon confirmation that the distributions of spike amplitudes across channels were constant. One dodecatrode recorded up to six neurons simultaneously from the CA1 region of the hippocampus. Multi-neuronal activities were amplified, filtered (band-pass 500 Hz–10 kHz), and recorded at 20 kHz on a custom-made PC with three 24-channel A/D converters (16-bit resolution; Contec Co. Ltd., Osaka, Japan). All experimental procedures accorded with NIH and Kyoto University guidelines and were conducted with the approval of the Animal Research Committee, Kyoto University.
Spike Sorting
Because we must detect synchronized events with sub-millisecond precision among closely neighboring neurons, extracellular action potentials were extracted and sorted using ICSort, i.e., an automatic sorting system with ICA.
ICSort completed three steps. First, in the clustering step, using k-means clustering, ICSort automatically sorted feature vectors of all extracted spikes in the high-dimensional clustering space. Then, the extracted spike waveforms in each sorted cluster were concatenated. Second, in the separation step, ICSort used ICA to find spatial filters that separate the spike waveforms into spatially fixed and distinct, maximally independent components (ICs). The only assumption underlying ICA is that the unknown components are statistically independent and have non-Gaussian distributions. Consequently, even if two or more neurons showing similar spike shapes co-fire within a precision of less than 1 ms, ICSort can separate and identify them.
Simply, a matrix X denoting a multi-unit activity recorded using a dodecatrode can be formulated as:
X = A × S
where a mixing matrix A represents the relative distances between the tips of the electrode and the source of a single cell and a matrix S represents the single-unit activities.
Actually, ICA estimates the mixing matrix A from multi-unit recordings X; then using an unmixing matrix (spatial filters; W: pseudoinverse matrix of A), ICA obtained the ICs Y as single unit activities using the following equation:
Y = W × X
To find the sources of the IC as a single-unit activity, ICSort applied ICA to each concatenated spike waveforms using a symmetric FastICA algorithm (Hyvarinen, 1999
), which is a fixed-point algorithm that maximizes an approximation of negentropy as a measure of non-Gaussianity. In the final step, ICSort aggregated the ICs to single units based on each ICA basis vector that represents the relation of the distance between the source of the IC and the tips of the electrode. Because a separated spike waveform in each IC may be shifted from the original, overlapped spike waveform, the time-stamps of the spikes in each IC were reassigned by remapping each IC onto real extracellular spaces using the following equation:
R = a × s
where R denotes a matrix of the remapped waveforms of an IC, a represents an ICA basis vector corresponding to the IC, and s denotes a vector of the IC.
Details of the ICSort were described in previous reports (Takahashi et al., 2003a
,b
).
In fact, ICSort was important for this study because conventional spike sorting cannot detect sub-millisecond synchronization of spikes of different neurons on one electrode because of the overlapped spike waveform (Gray et al., 1995
; Buzsaki, 2004
). The spike overlaps occurred when two or more neighboring single-neurons co-fire with sub-millisecond precision. Figures 1
A,B present typical examples of dodecatrode recordings in the start and end periods of the task. The overall distribution of spike amplitudes across channels does not change during the task. Figure 1
C shows that spike waveforms of neurons 1 and 2, which are reconstructed from each IC estimated using ICSort, are similar and that the distribution of spike amplitudes across 12 channels is constant. Noise components were identified and eliminated during thresholding in ICSort. To determine whether spikes from different neurons are intermingled (Type I error; false positive), we calculated auto-correlograms of all single neurons sorted in this study. Each auto-correlogram shows clear refractory periods (1–2 ms; Figure 1
D). To determine whether spikes from a single neuron are sorted to different neurons (Type II error; false negative), we calculated cross-correlograms of all pairs of single neurons sorted in this study. No cross-correlogram shows a refractory period (Figures 1
D and 3
B). Figure 1
E presents typical examples of overlapped (black) and separated waveforms (green and red) from two neurons co-firing with long (0.40 ms, left, see the gap separating red and green dashed vertical lines) and short (0.15 ms, right, see the gap separating red and green dashed vertical lines) jitters of delay. Red and green dashed vertical lines respectively depict the detected spike timing of neurons 1 and 2. In our entire dataset (n = 36 units), the correlation coefficients R between averaged waveforms of identical neurons detected from overlapping and non-overlapping spikes are >0.86. (neuron 1, R = 0.99; neuron 2, R = 0.98 in Figures 1
C,E).
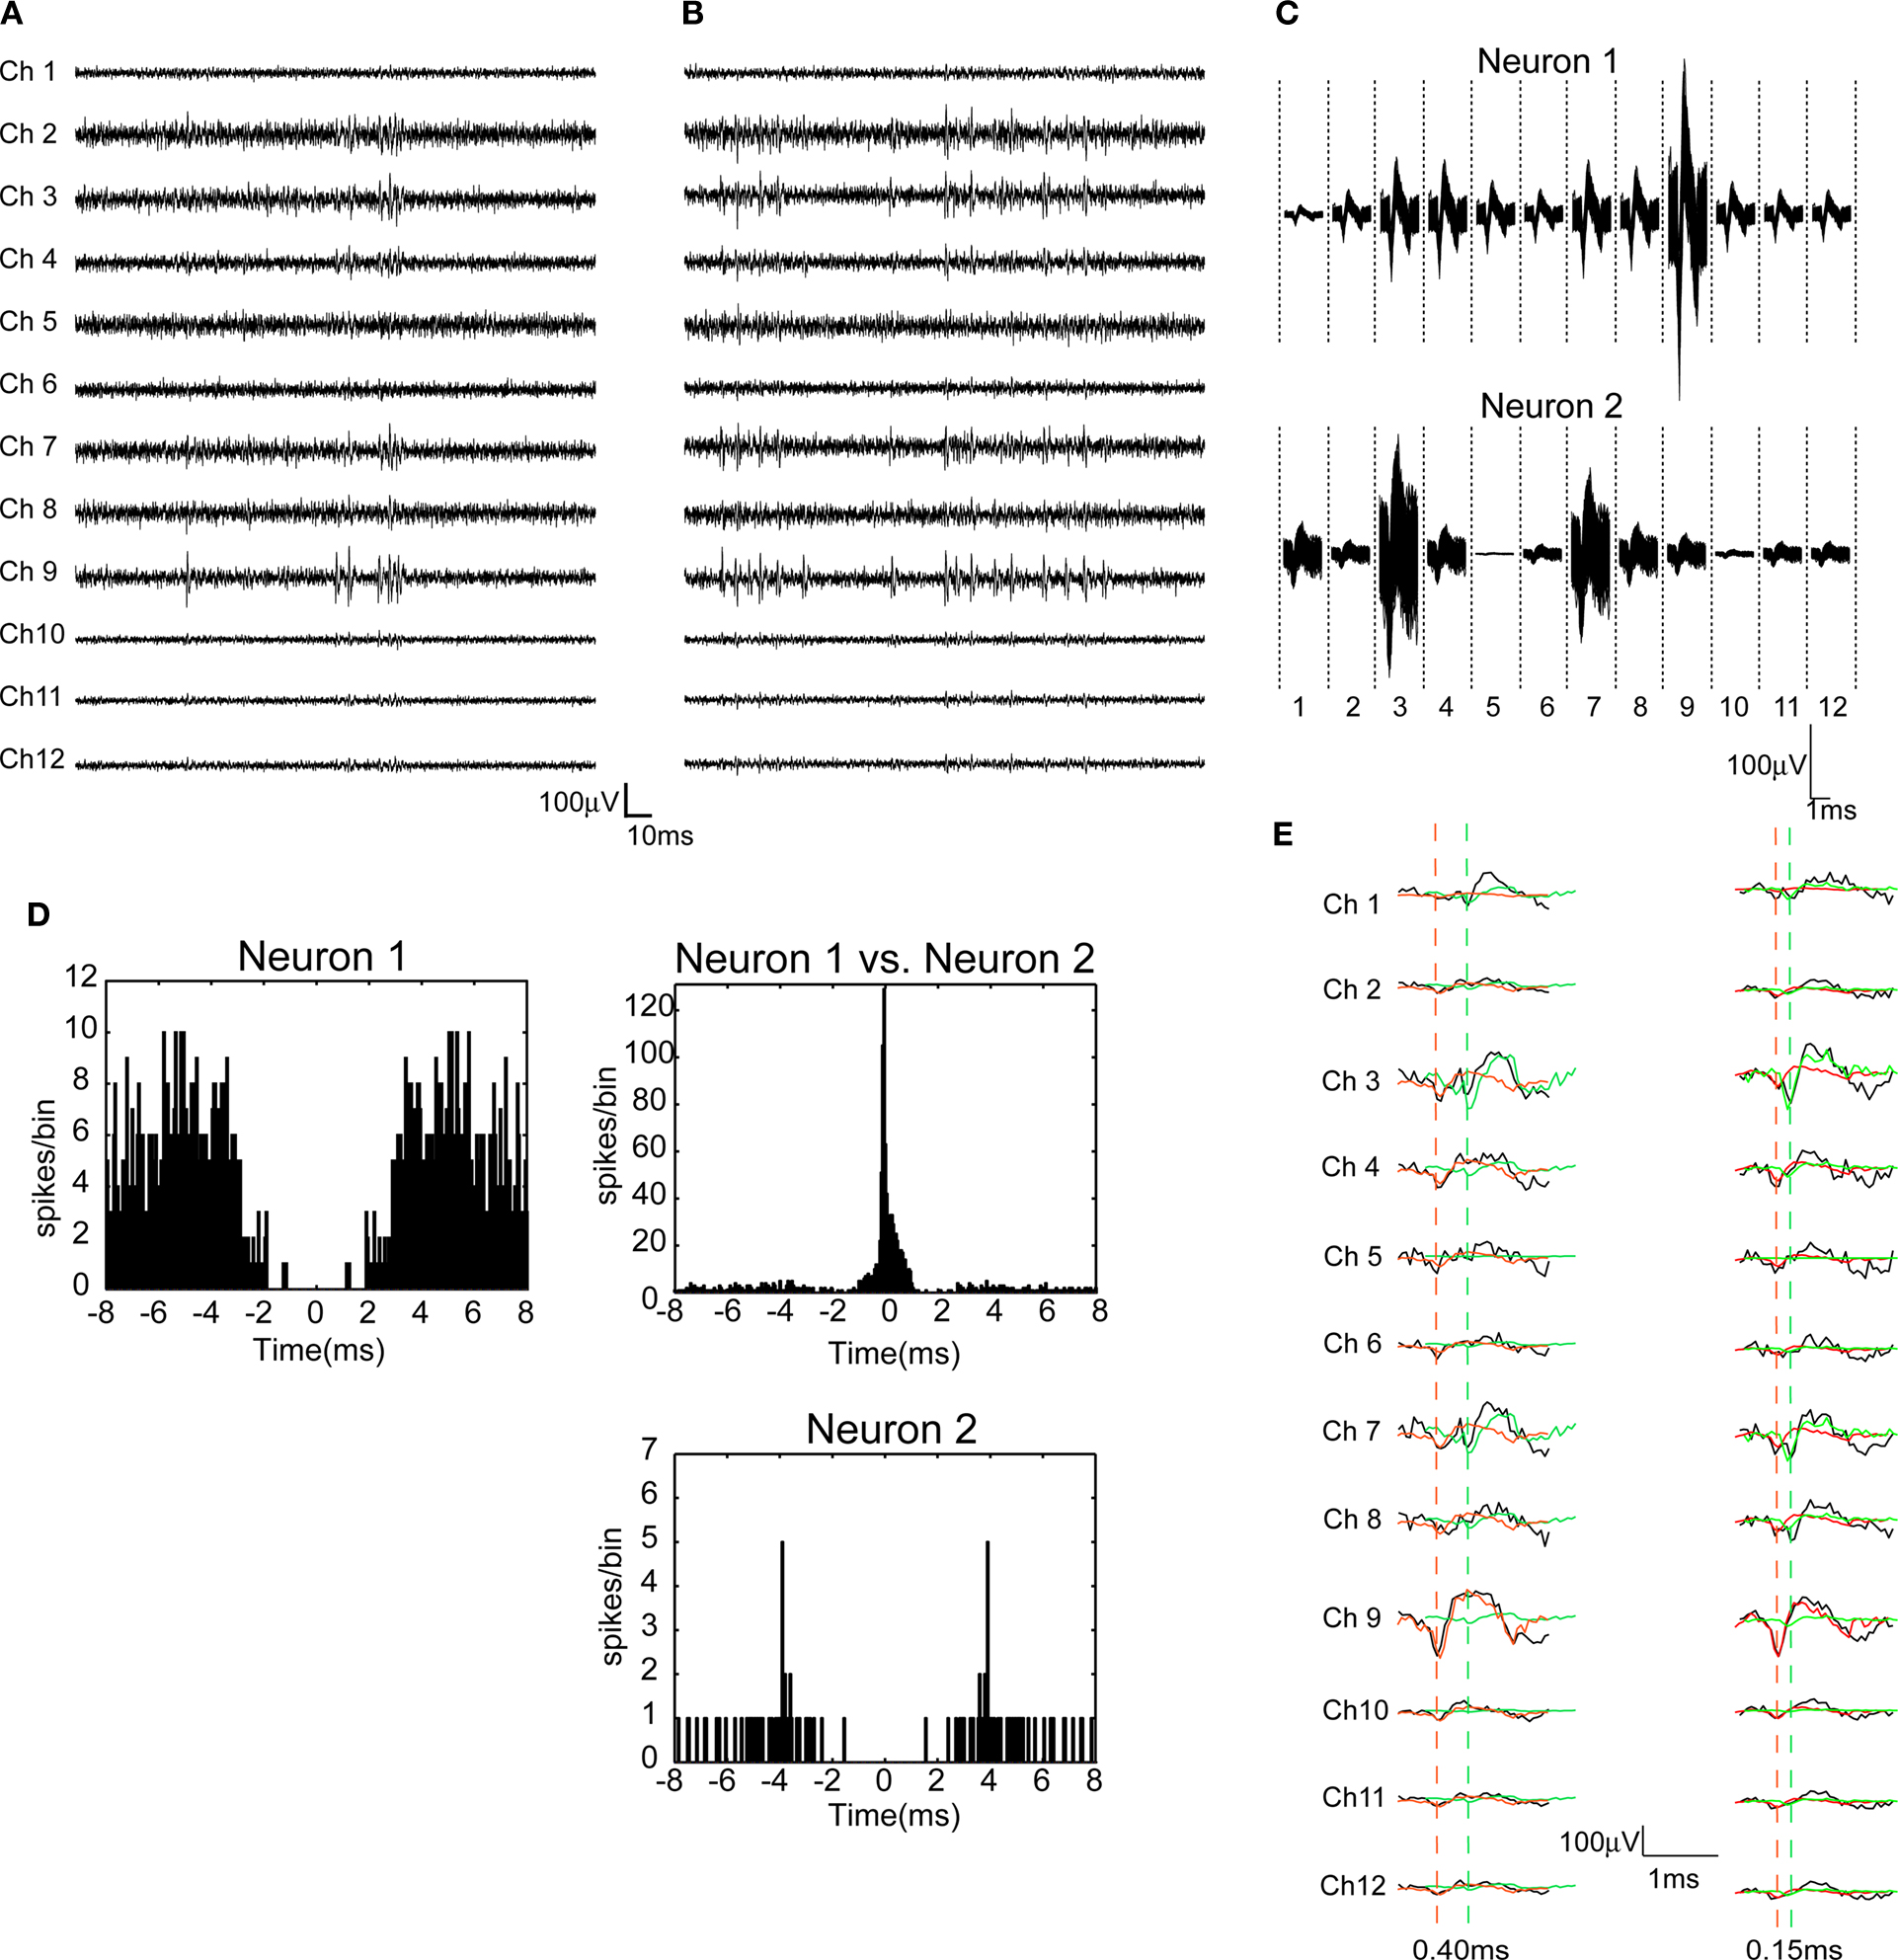
Figure 1. Performance of the combination of ICSort and dodecatrodes. (A,B) 200 ms segments of multi-neuronal activity recorded by one dodecatrode at the start and end periods of the task. (C) 1000 superimposed waveforms of two putative pyramidal neurons (neurons 1 and 2) reconstructed from each independent component estimated using ICSort. Noise components are eliminated. Because the reconstruction process remaps each independent component to real extracellular spaces, the waveforms are scaled channel by channel (see Materials and Methods). (D) Auto- and cross-correlograms between neurons 1 and 2. The bin size is 50 μs. (E) Overlapped (black solid lines) and separated waveforms reconstructed from independent components identified as neurons 1 and 2 (red dashed lines separated waveforms of neuron 1, green dashed lines separated waveforms of neuron 2). Neurons 1 and 2 co-fire respectively with a jitter of 0.40 ms (left) and 0.15 ms (right).
Identification and Classification of Neurons
After spike sorting, we identified pyramidal cells based on their wide spike shape (mean width, >0.4 ms), low average firing rate (<5 Hz), and a sign of bursts in the auto-correlogram. We used spike trains only from putative pyramidal neurons that show clear refractory periods (1–3 ms), high signal-to-noise ratios (greater than fivefold the noise level), and sufficiently high firing rates (>0.1 Hz) (Takahashi et al., 2003a
; Takahashi and Sakurai, 2005
). If this classification process is performed before the separation step during the ICSort, then neurons showing a low firing rate (<0.1 Hz) are excluded. In that case, the probability of omission error for detecting overlapping spikes is increased because neurons showing a low firing rate might be a set of overlapping spikes generated simultaneously from two or more neurons. Therefore, this classification process was performed after all processes of the ICSort had been completed. Moreover, to eliminate the inclusion of dendritic spikes, we excluded putative pyramidal neurons showing significant spike amplitude attenuations during bursts (t-test; P < 0.01) (Stuart et al., 1997
, 1999
; Quirk et al., 2001
; Takahashi and Sakurai, 2005
, 2007
).
Task Procedure
The rate modulation of hippocampal neurons is strongly associated with non-spatial behavior (Sakurai, 1990
, 1994
; Otto and Eichenbaum, 1992
), and spatial behavior (Wilson and McNaughton, 1993
). For that reason, we used an auditory DNMS task (Sakurai, 1990
, 1994
). A training session consisted of approximately 200 trials performed for about 1 h. One of two tones (high tone, 10 kHz, 85 dB SPL; low tone, 2 kHz, 85 dB SPL) was presented for 15 s in each trial, randomly following a 5 s delay period (inter-trial interval). One second after tone onset, a guillotine door opened to reveal the illuminated response panel immediately behind the door; the panel was thereafter available for 3 s. A food pellet was delivered immediately after the go response in a non-match trial, in which the presented tone (high/low) differed from that in the preceding trial. The criterion for performance was 80% correct trials per session. Training was continued for more than 1 month. During each trial, a rat was required to make a go response in non-match trials and a no-go response in match trials. During the delay period, the rat had to remember which stimulus (high tone or low tone) had been presented most recently. All behavioral events were controlled using custom-written software running in an analytical software environment (LabVIEW; National Instruments Corp., Austin, TX, USA).
Statistical Analysis
Occurrence probability of SSS
The occurrence probability of SSS among N neurons, PN, is calculated as the number of SSSs among N neurons divided by the number of all possible opportunities in which N neurons synchronize within 1 ms precision. We defined the opportunity as a circumstance in which at least one of N neurons fires in a 1 ms window.
In that equation, SN denotes the number of SSSs among N neurons. In other words, SN means the number of spikes generated simultaneously from all N neurons in a 1 ms window (see Figures 2
A,B). AN denotes the number of asynchronous spikes with 1 ms precision. Asynchronous spikes are defined as spikes generated from only one of N neurons in a 1 ms window (see Figures 2
A,B). S2-N represents the number of SSSs among two or more of N neurons.
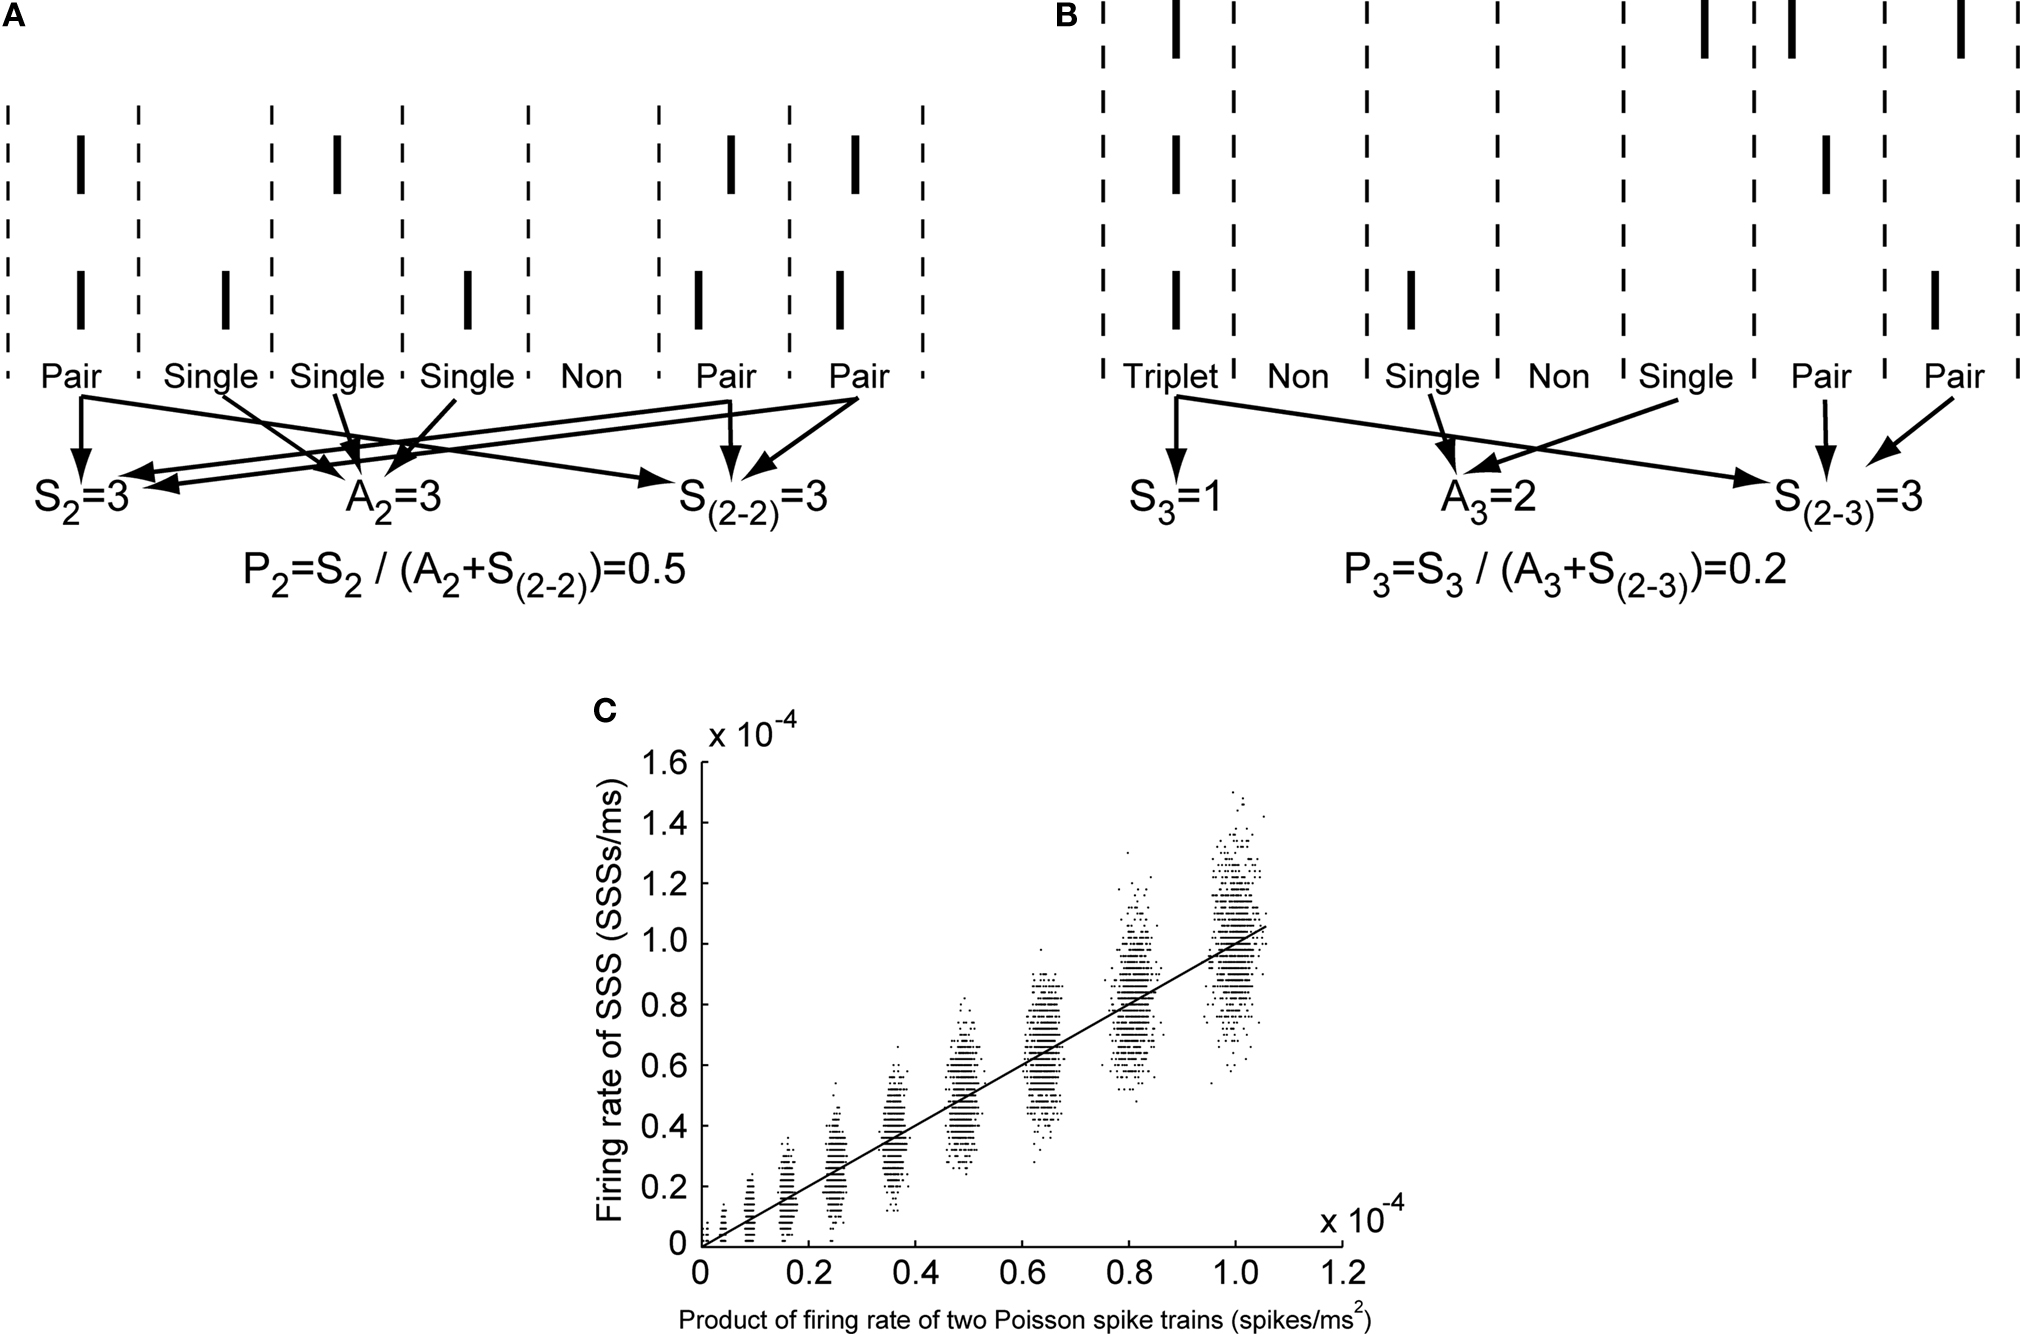
Figure 2. (A) Example of manipulation of spike trains generated from two neurons. Herein, S2 represents the number of windows in which two neurons fire simultaneously. A2 signifies the number of windows in which only one neuron fires. S(2-2) denotes the number of windows in which two neurons simultaneously fire. P2 is the occurrence probability of SSS between those two spike trains. (B) Example of manipulation of spike trains generated from three neurons. Here, S3 signifies the number of windows in which all three neurons simultaneously fire. A3 stands for the number of windows in which only one neuron fires. S(2-3) denotes the number of windows in which two or three neurons fire simultaneously. P3 represents the occurrence probability of SSS among those three spike trains. Each bar is one spike. Windows are partitioned by dashed lines. (C) The firing rate of SSSs between two Poisson spike trains is plotted as a function of the product of firing rate of those Poisson spike trains. The correlation coefficient, R, is 0.97. The solid line depicts a linear regression line. The regression coefficient is 1.0.
Continuous U-test
To confirm whether SSSs can code information as well as rate modulations, we analyzed the association between the firing rate of SSS of a group of neurons (or spikes of participating neurons) and behavioral events during a task. We defined that the firing rate of SSS as a frequency of spikes co-fired from two or more neurons within precision of less than 1 ms. Unitary event analysis (UEA) (Riehle et al., 1997
) is a good tool that enables us to investigate such dynamic synchronies. However, because it has a limitation related to firing rates (Roy et al., 2000
), neurons in our datasets whose firing rates cannot exceed the limitation cannot be analyzed using UEA. For that reason, we modified UEA using a conventional non-parametric statistical test: the Mann–Whitney U–test. Each firing rate of SSS of a group of neurons (e.g. Figure 5
I) and of spike of the participating neurons (e.g. Figures 5
D,H) was computed by sliding a boxcar window of 1 s in 1 ms steps over the behavioral events (stimulus inputs, retention of a stimulus, motor outputs and comparison of stimuli). To determine whether the spikes of a neuron or SSSs among the considered neurons are associated with behavioral events, the statistically significant difference in the firing rate of spikes of an individual neuron or SSSs of a group of neurons between the sets of behavioral events (stimulus inputs and retention of a stimulus: high/low tone; motor outputs: go/no-go responses; comparison of stimuli: correct/erroneous match trials) was tested using a two-tailed Mann–Whitney U-test for each boxcar window of 1 s in 1 ms steps. For SSSs, to eliminate the expected rate of firing coincidence, we subtracted the product of individual firing rates of participating neurons from the firing rate of SSS of a group of neurons based on the null hypothesis of independent firing (Aertsen et al., 1989
; Riehle et al., 1997
). To verify the hypothesis, we performed a simple simulation in which two Poisson spike trains for 10 s whose firing rates are set at 0.1, 0.5, 1, 2, 3, 4, 5, 6, 7, 8, 9, and 10 Hz were constructed and analyzed. The correlation coefficient and linear regression coefficient between the product of individual firing rates of two Poisson spike trains and the firing rates of the SSS between them were 0.97 and 1.0, respectively, under the simulation (Figure 2
C), validating this hypothesis.
For spikes of individual neurons and SSSs among neurons, we calculated P values, Pis(i) and Psss(i) in the i-th window using the following two equations:
Pis (i) = U (s1i,s2i),
Psss (i) = U [(t1i − p1i), (t2i − p2i)].
Therein, s1i and s2i denote vectors of the number of spikes generated from a neuron in the i-th window over all trials in a pair of behavioral events (For stimulus inputs and retention of a stimulus: 1, high tone; 2, low tone. For motor outputs: 1, go response; 2, no-go response. For comparison of stimuli: 1, correct match trial; 2, erroneous match trial), t1i and t2i denote vectors of the number of SSSs among neurons in the i-th window over all trials in a pair of behavioral events, and p1i and p2i denote vectors of the number of coincident spikes estimated using the product of firing rates of participating neurons in the i-th window over all trials in a pair of behavioral events. The function U performs a two-tailed Mann–Whitney U-test between the vectors, returning the P value.
To enhance visual resolution at the relevant low P values, P values are shown on a negative logarithmic scale (−log10). When the value exceeded the fixed threshold α (=2; P = 0.01) for >10 ms, this defined a period with significantly more firings. The P value of SSS tends to be less than that of the firing rate of the considered neuron pairs because the firing rate of SSS is always much less than that of the considered neuron pairs; moreover, the P value of the U-test depends on the number of spikes. Because this test is based on a non-parametric U-test, the significant period represents that not a specific subpopulation of neurons but all considered neurons become synchronous from trial to trial. We defined SSS among three or more neurons as spike co-fired by all three or more neurons within a precision of less than 1 ms. Consequently, instead of testing possible pairs of neurons selected from a group of three or more neurons, we applied one continuous U-test to a group of three or more neurons at once without a process of multiple comparisons. All analyses were performed using custom-written software (MATLAB; The MathWorks Inc, Natick, MA, USA/C++).
Occurrence rate for the SSS
To test whether SSSs occur at any spike frequency and to identify the optimal, if any, bands of spike frequency for SSSs, we calculated the occurrence rate for the SSSs between two participating neurons as a function of the instantaneous spike frequency. The instantaneous spike frequency of each neuron is calculated as a reciprocal number of only one preceding inter-spike interval. The resolution of the inter-spike interval is set at 1 ms. The occurrence rate for the SSS, RS, at a spike frequency, f, is calculated as:
where NS(f) denotes the number of SSSs whose spike frequency is f, and TS(f) denotes the number of spikes generated from one of two participating neurons whose spike frequency is f.
The occurrence rate for the non-SSS, i.e., all spikes except SSSs, RN, at a spike frequency, f, is calculated as:
where AS(f) denotes the number of all spikes generated from one of two participating neurons whose spike frequency is f.
To test the significance of the occurrence rate for the SSS at each spike frequency, we compared the rate of occurrence for the SSS and non-SSS using two-tailed t-test. The significance level was set to 0.05.
We recorded activities of 68 neurons in the CA1 region of the hippocampi of six rats during the DNMS task. We identified 63 neurons as pyramidal neurons based on their wide spike shape, low average firing rate, and a sign of bursts (see Materials and Methods). Attenuation of the spike amplitude of pyramidal neurons during bursts might be caused by dendrites (Buzsaki et al., 1996
; Stuart et al., 1997
; Quirk et al., 2001
; Takahashi et al., 2003a
; Takahashi and Sakurai, 2005
, 2007
). Moreover, firings of the soma and dendrite might code different information in the hippocampal CA1 of behaving rats (Takahashi and Sakurai, 2007
). We therefore specifically examine spikes predominantly originated from the soma as final outputs of single cell. We analyzed spike trains from 36 putative pyramidal neurons not showing spike-amplitude attenuations during bursts (see Materials and Methods).
Robust Sub-Millisecond Synchrony Among Pyramidal Neurons
The firing of all possible pairs of simultaneously monitored pyramidal neurons by one dodecatrode often synchronized with less than 1 ms precision (Figure 3
A). The cross-correlograms of all possible pairs of neurons typically showed sharp peaks at approximately zero delay within a 1 ms range (Figures 1
D and 3
B). These synchronized spikes among closely neighboring pyramidal neurons – recorded from one dodecatrode, and occurring with sub-millisecond precision – are designated as SSSs. Of 36 pyramidal neurons recorded by dodecatrodes, the average occurrence probabilities of SSSs of possible pairs, triplets, quadruplets, quintuplets, and sextuplets of pyramidal neurons (see Materials and Methods) were, respectively, 8.3 ± 1.4, 0.55 ± 0.14, 0.058 ± 0.016, 0.0073 ± 0.0047 and 0% (mean ± SEM, n = 40, 28, 16, 6, 1).
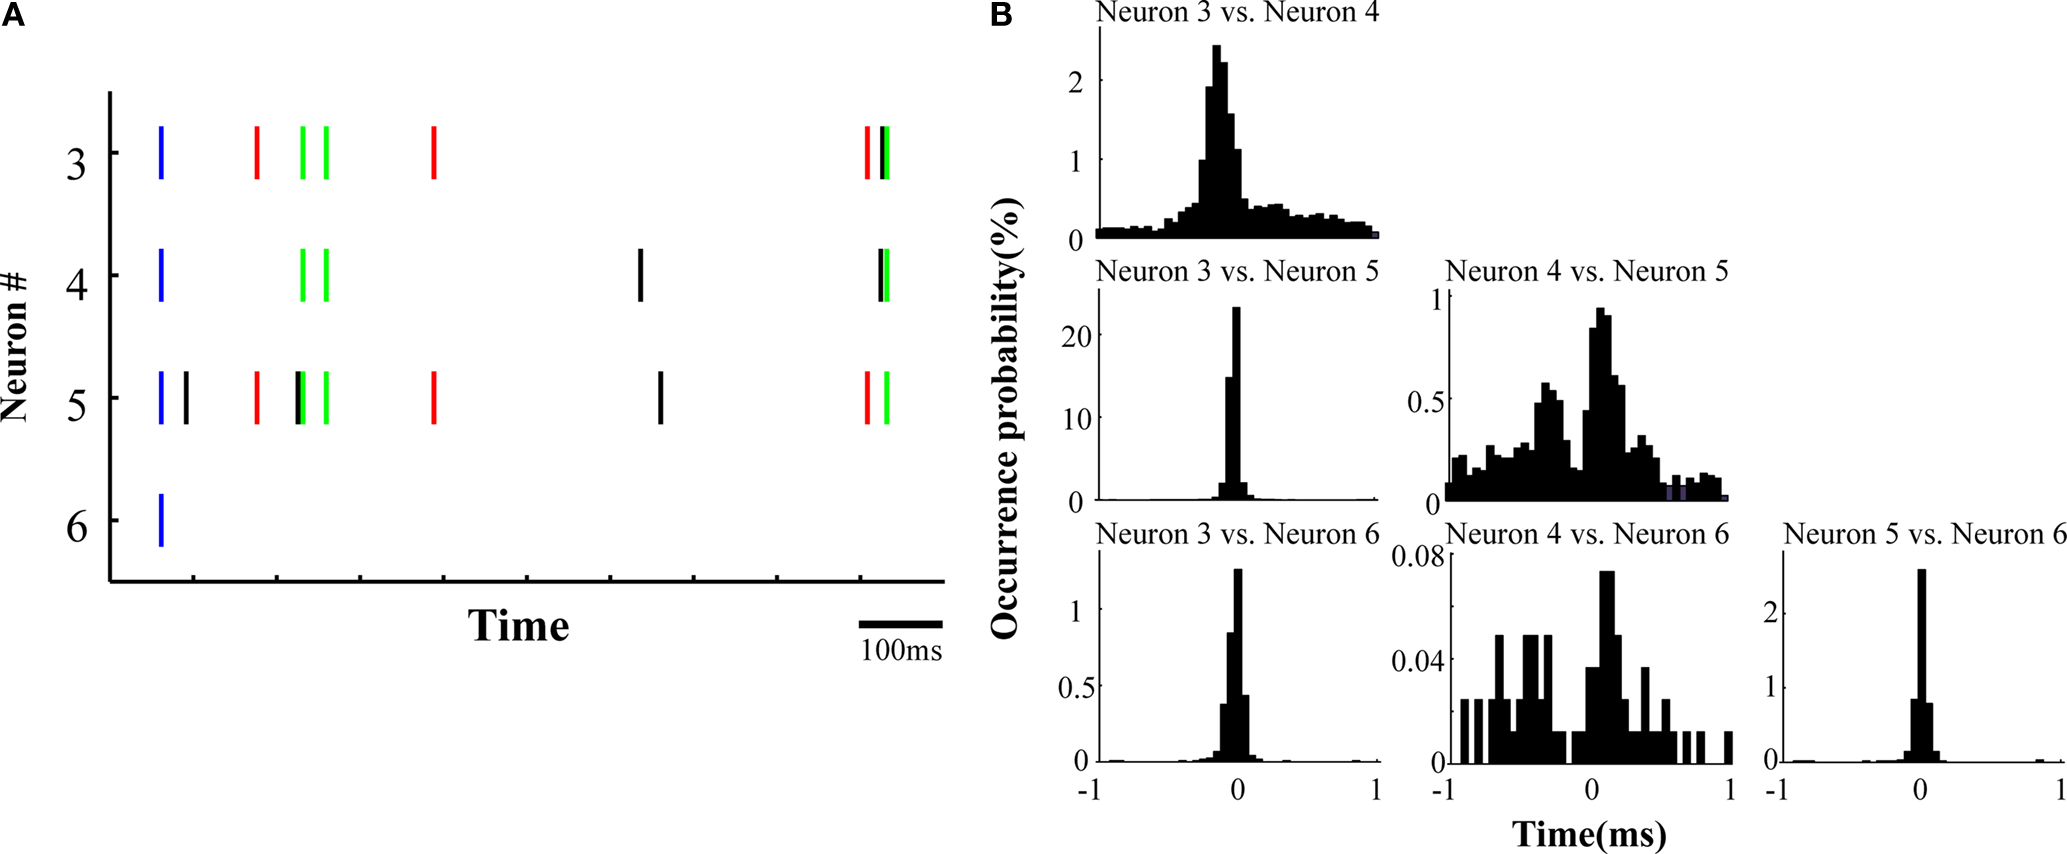
Figure 3. Sub-millisecond synchronizations among closely neighboring neurons. (A) Spike rasters of four pyramidal neurons recorded from one dodecatrode for a 1-s data segment. Possible coincidences within a 1-ms range are color-coded (Black, no coincident spike; Red, pairwise coincident spike; Green, triplet coincident spike; Blue, quadruplet coincident spike). (B) Cross-correlograms between pyramidal neurons, showing sharp peaks at around zero delay. The bin size is 50 μs.
Optimal Bands of Spike Frequency for the Occurrence of SSSs
To test if these robust SSSs occur at any spike frequency, we constructed auto-correlograms of all SSSs detected from 40 pairs of pyramidal neurons. Figure 4
A presents that the SSSs oscillate slightly at frequencies of ca. 20 and ca. 150 Hz. However, it is possible that such oscillations were generated by the network effect and/or non-SSSs, i.e., asynchronous spikes with sub-millisecond precision. To test and identify the optimal bands of spike frequency for the SSSs statistically, we calculated the spike frequency of occurrence of SSSs and non-SSSs in relation to the spike frequency of the neurons participating in the considered pair. We then statistically compared the occurrence rate between SSSs and non-SSSs (t-test; Figure 4
B; see Materials and Methods). The results show that the optimal bands of spike frequency for the SSS are 15–30, 70–80 and 140–200 Hz (P < 0.05, n = 80).
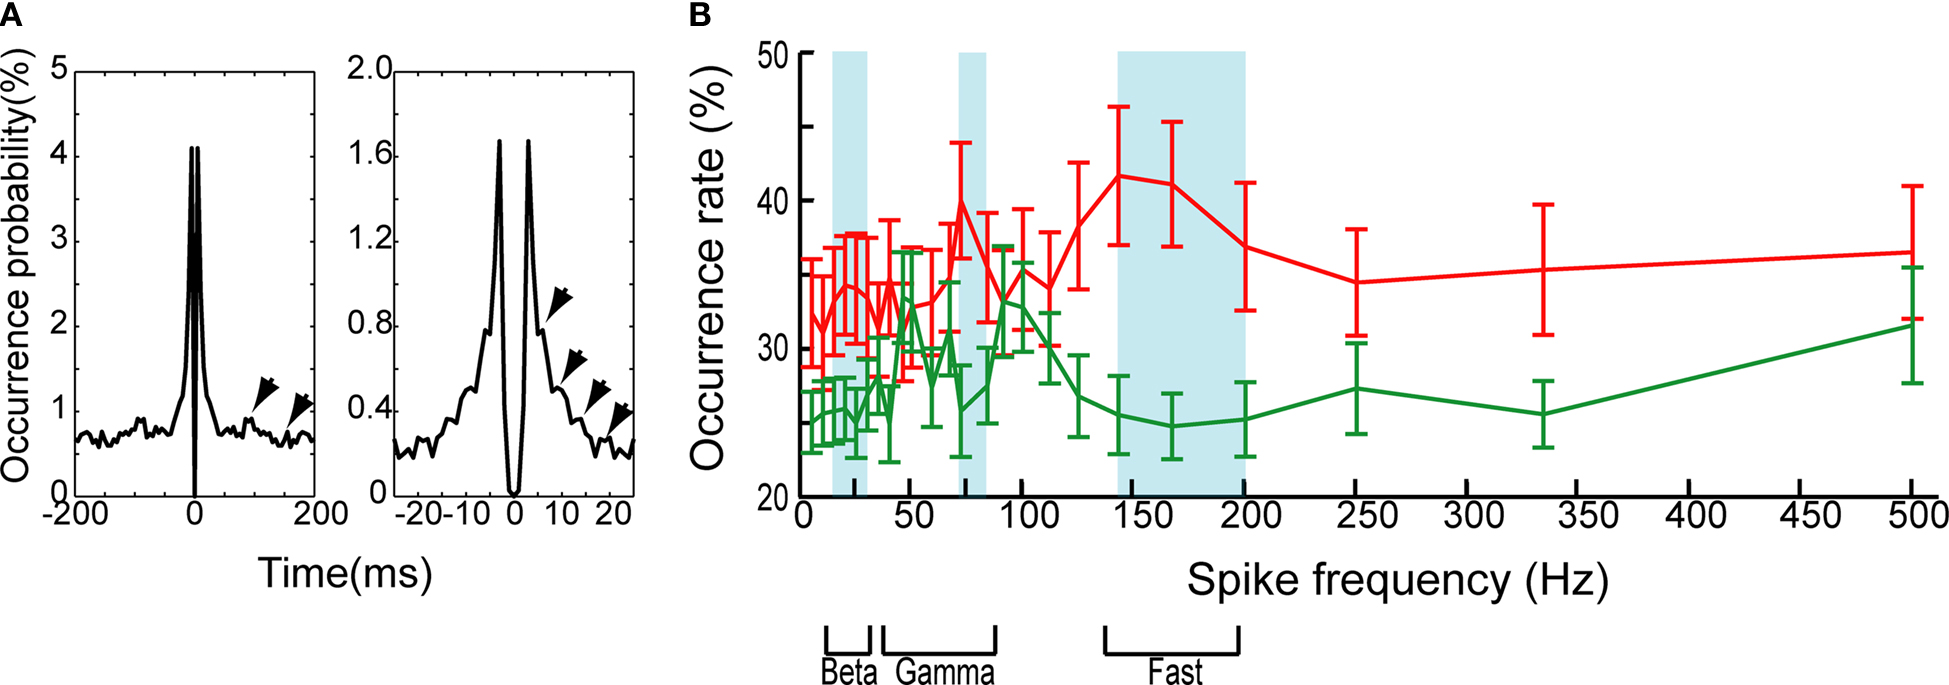
Figure 4. (A) Auto-correlograms of whole SSSs among all possible pairs of neurons in a window of ±200 ms (left) and ±25 ms (right). The bin sizes are set, respectively, at 5 and 1 ms. The SSS oscillates slightly at ca. 20 and ca. 150 Hz (arrows). (B) The occurrence rate for the SSS (red) and non-SSS (green) as a function of the spike frequency. The blue shaded box highlighted bands of significant spike frequency (t-test; P < 0.05; see Materials and Methods). Error bars show SEM. The lower portion shows the bands of the beta, gamma and fast-ripple oscillations.
Relation between SSS and Rate Modulation
To confirm whether SSSs can code information as well as rate modulations, we analyzed the relation between the SSSs of closely neighboring neurons and behavioral events during the DNMS task. We used a non-parametric statistical U-test because it is often difficult to predict the type of distribution of neuronal firing rates. In this experiment, we defined groups of simultaneously monitored neurons from one dodecatrode as a local neuron group. In our spike sorting, each local neuron group was shown to consist of two to six pyramidal neurons. In all, 13 groups were analyzed. During the sample, delay, and test periods of the DNMS task, both the SSSs and rate modulations were analyzed in relation to behavioral events, i.e., stimulus inputs, stimulus retention, motor outputs, and comparison of the stimuli. At least two groups showed that SSSs and firing rate modulations of participating neurons were coupled and correlated with stimulus inputs (Figure 5
N), stimulus retention (Figure 6
N), motor outputs (Figure 7
N), and comparison of stimuli (Figure 8
N), respectively.
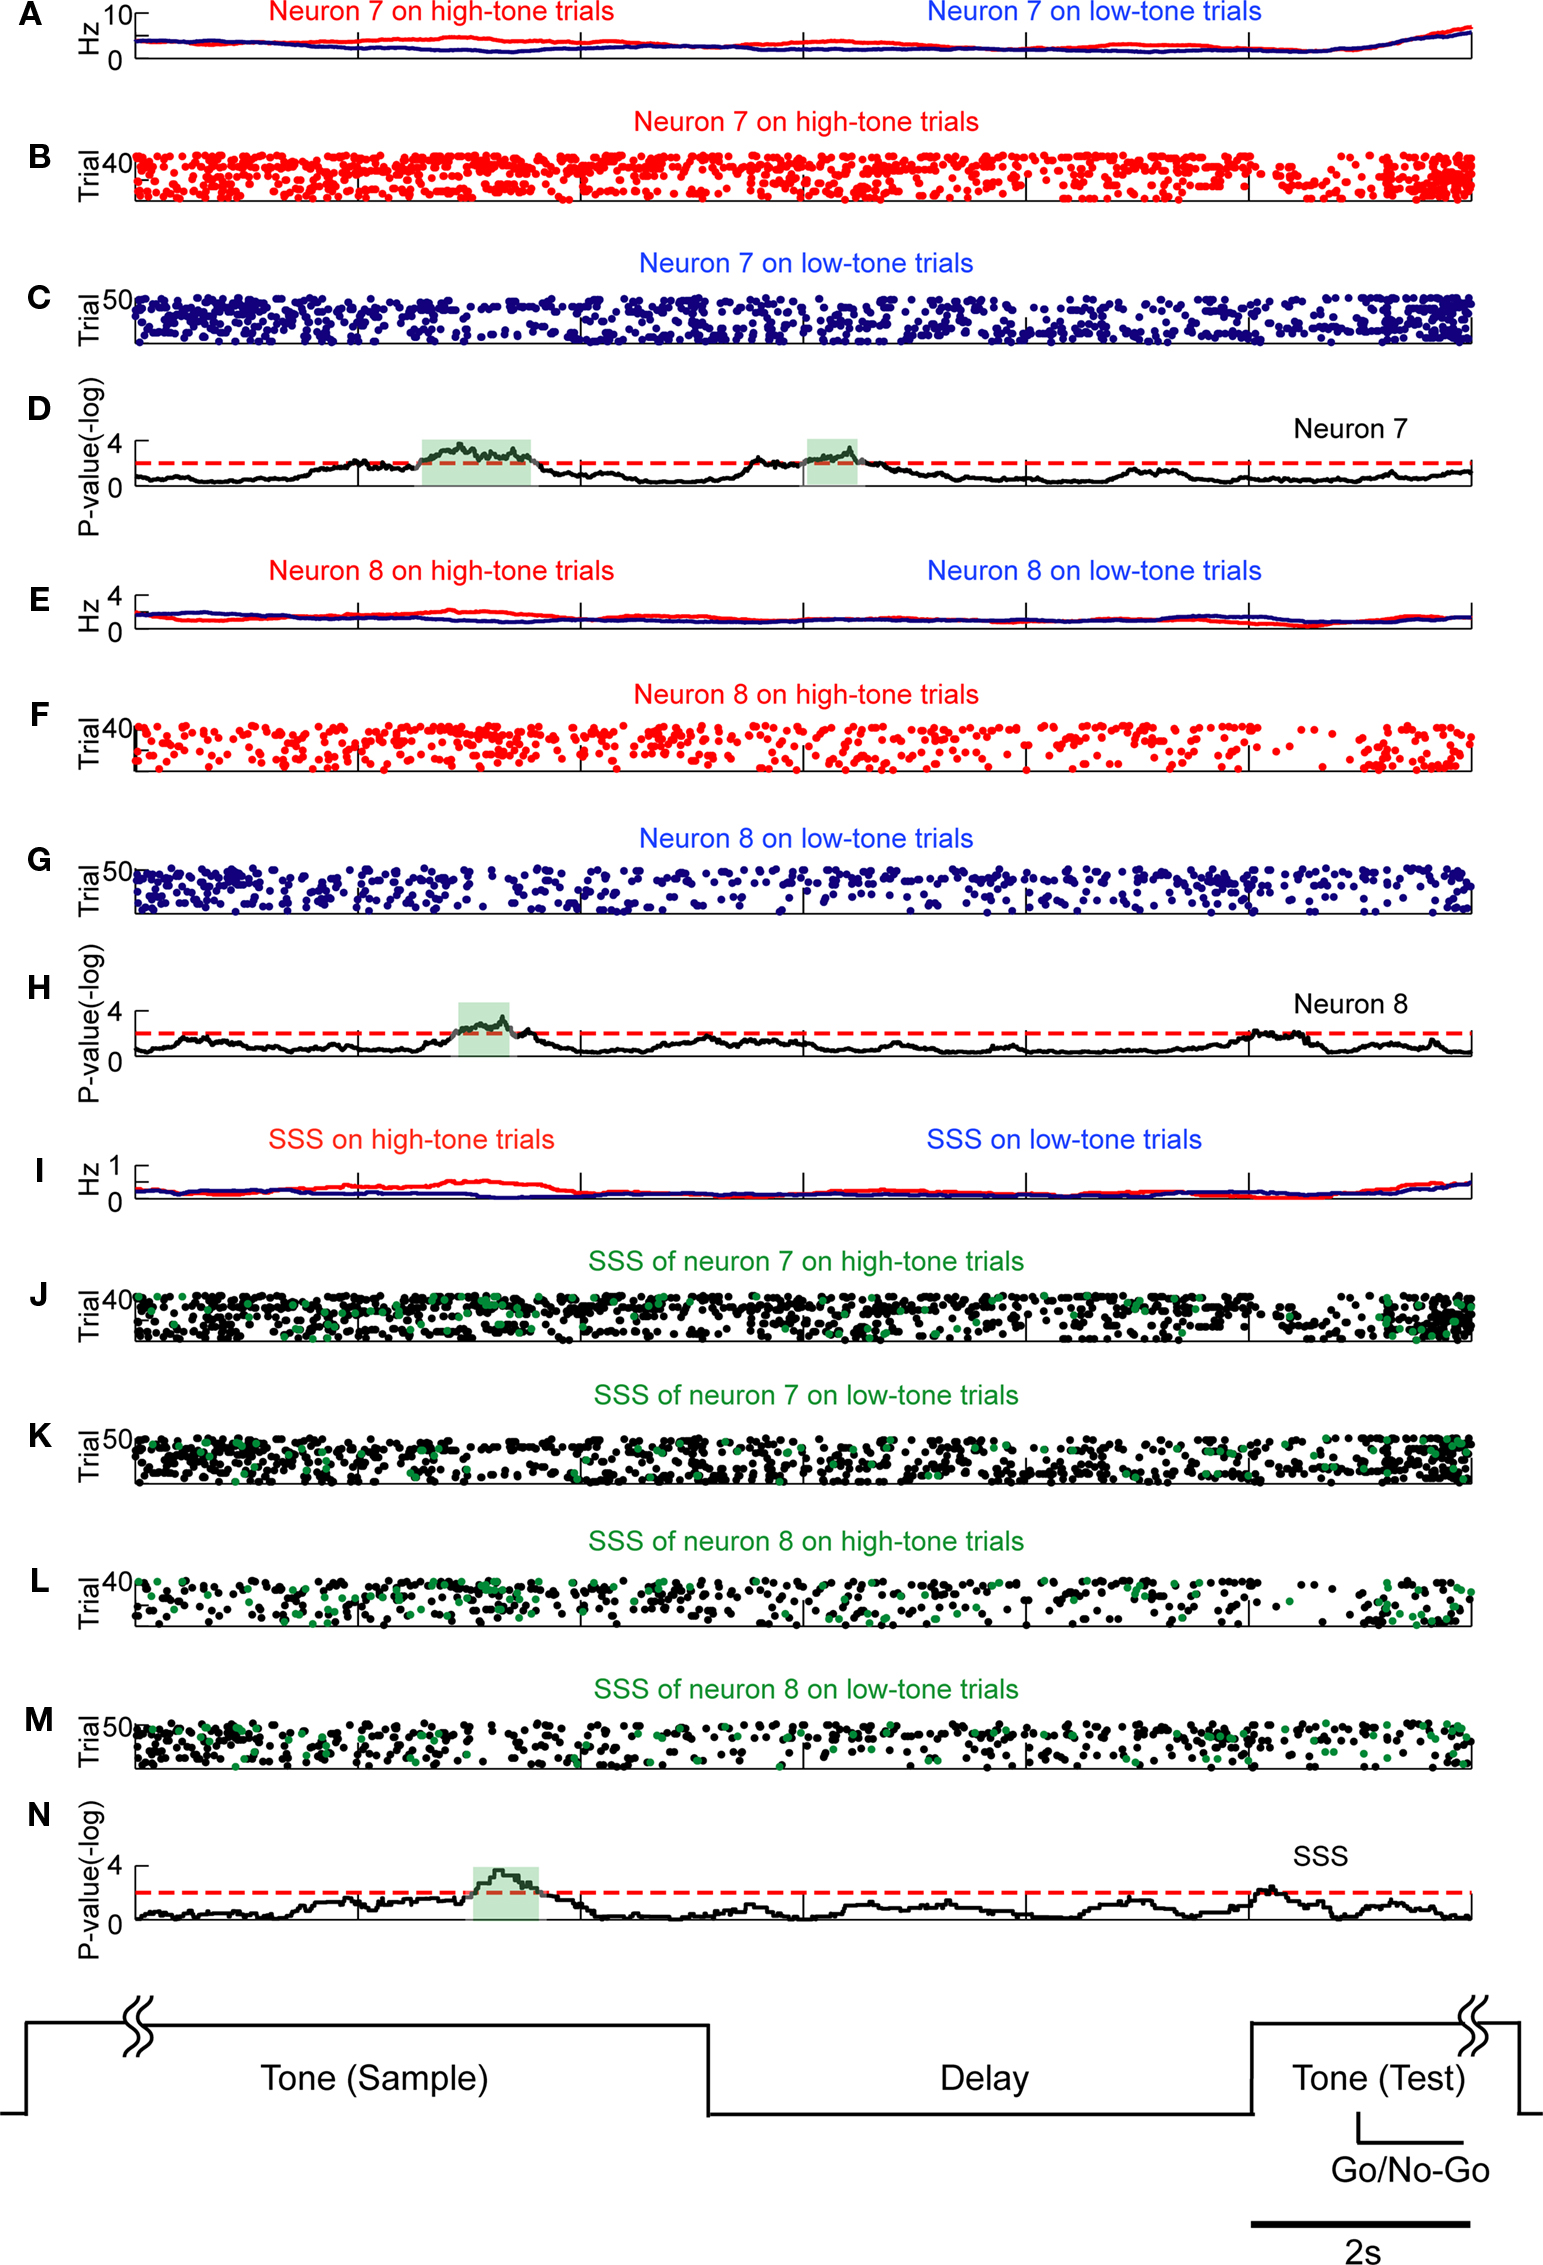
Figure 5. SSSs related to stimulus inputs are associated with firing rate modulations. Comparison of SSSs and rate modulations between high tone and low tone trials was selected in this example. Each subfigure averages all correct trials of a session. Results of U-tests of 5 s of tone presentation in the preceding trial, 5 s of delay, and 2 s of tone presentation in the next trial are shown. Additional details are described in Section ‘Materials and Methods’. (A) Firing rates of neuron 7 in high tone (red) and low tone (blue) trials. (B,C) Raster plots of spikes of neuron 7 in high tone (red) and low tone (blue) trials. (D) P-values of neuron 7 for a difference between rates in high tone and low tone trials. The dotted red line represents the level of significance, α (=2; P = 0.01). The significant period (P < 0.01) is enclosed in the green shaded box. (E)–(I) and (N) are shown in the same manner as in (A)–(D). (E) Firing rates of neuron 8. (F,G) Raster plots of neuron 8. (H) P-values of neuron 8. (I) Rates of the SSS between neurons 7 and 8. (J–M) In copies of raster plots from (B), (C), (F), and (G) (black dots), SSSs are shown as green dots. (N) P-value of the SSS between neurons 7 and 8. The significant firing rates of neurons 7 and 8 are associated with SSS.
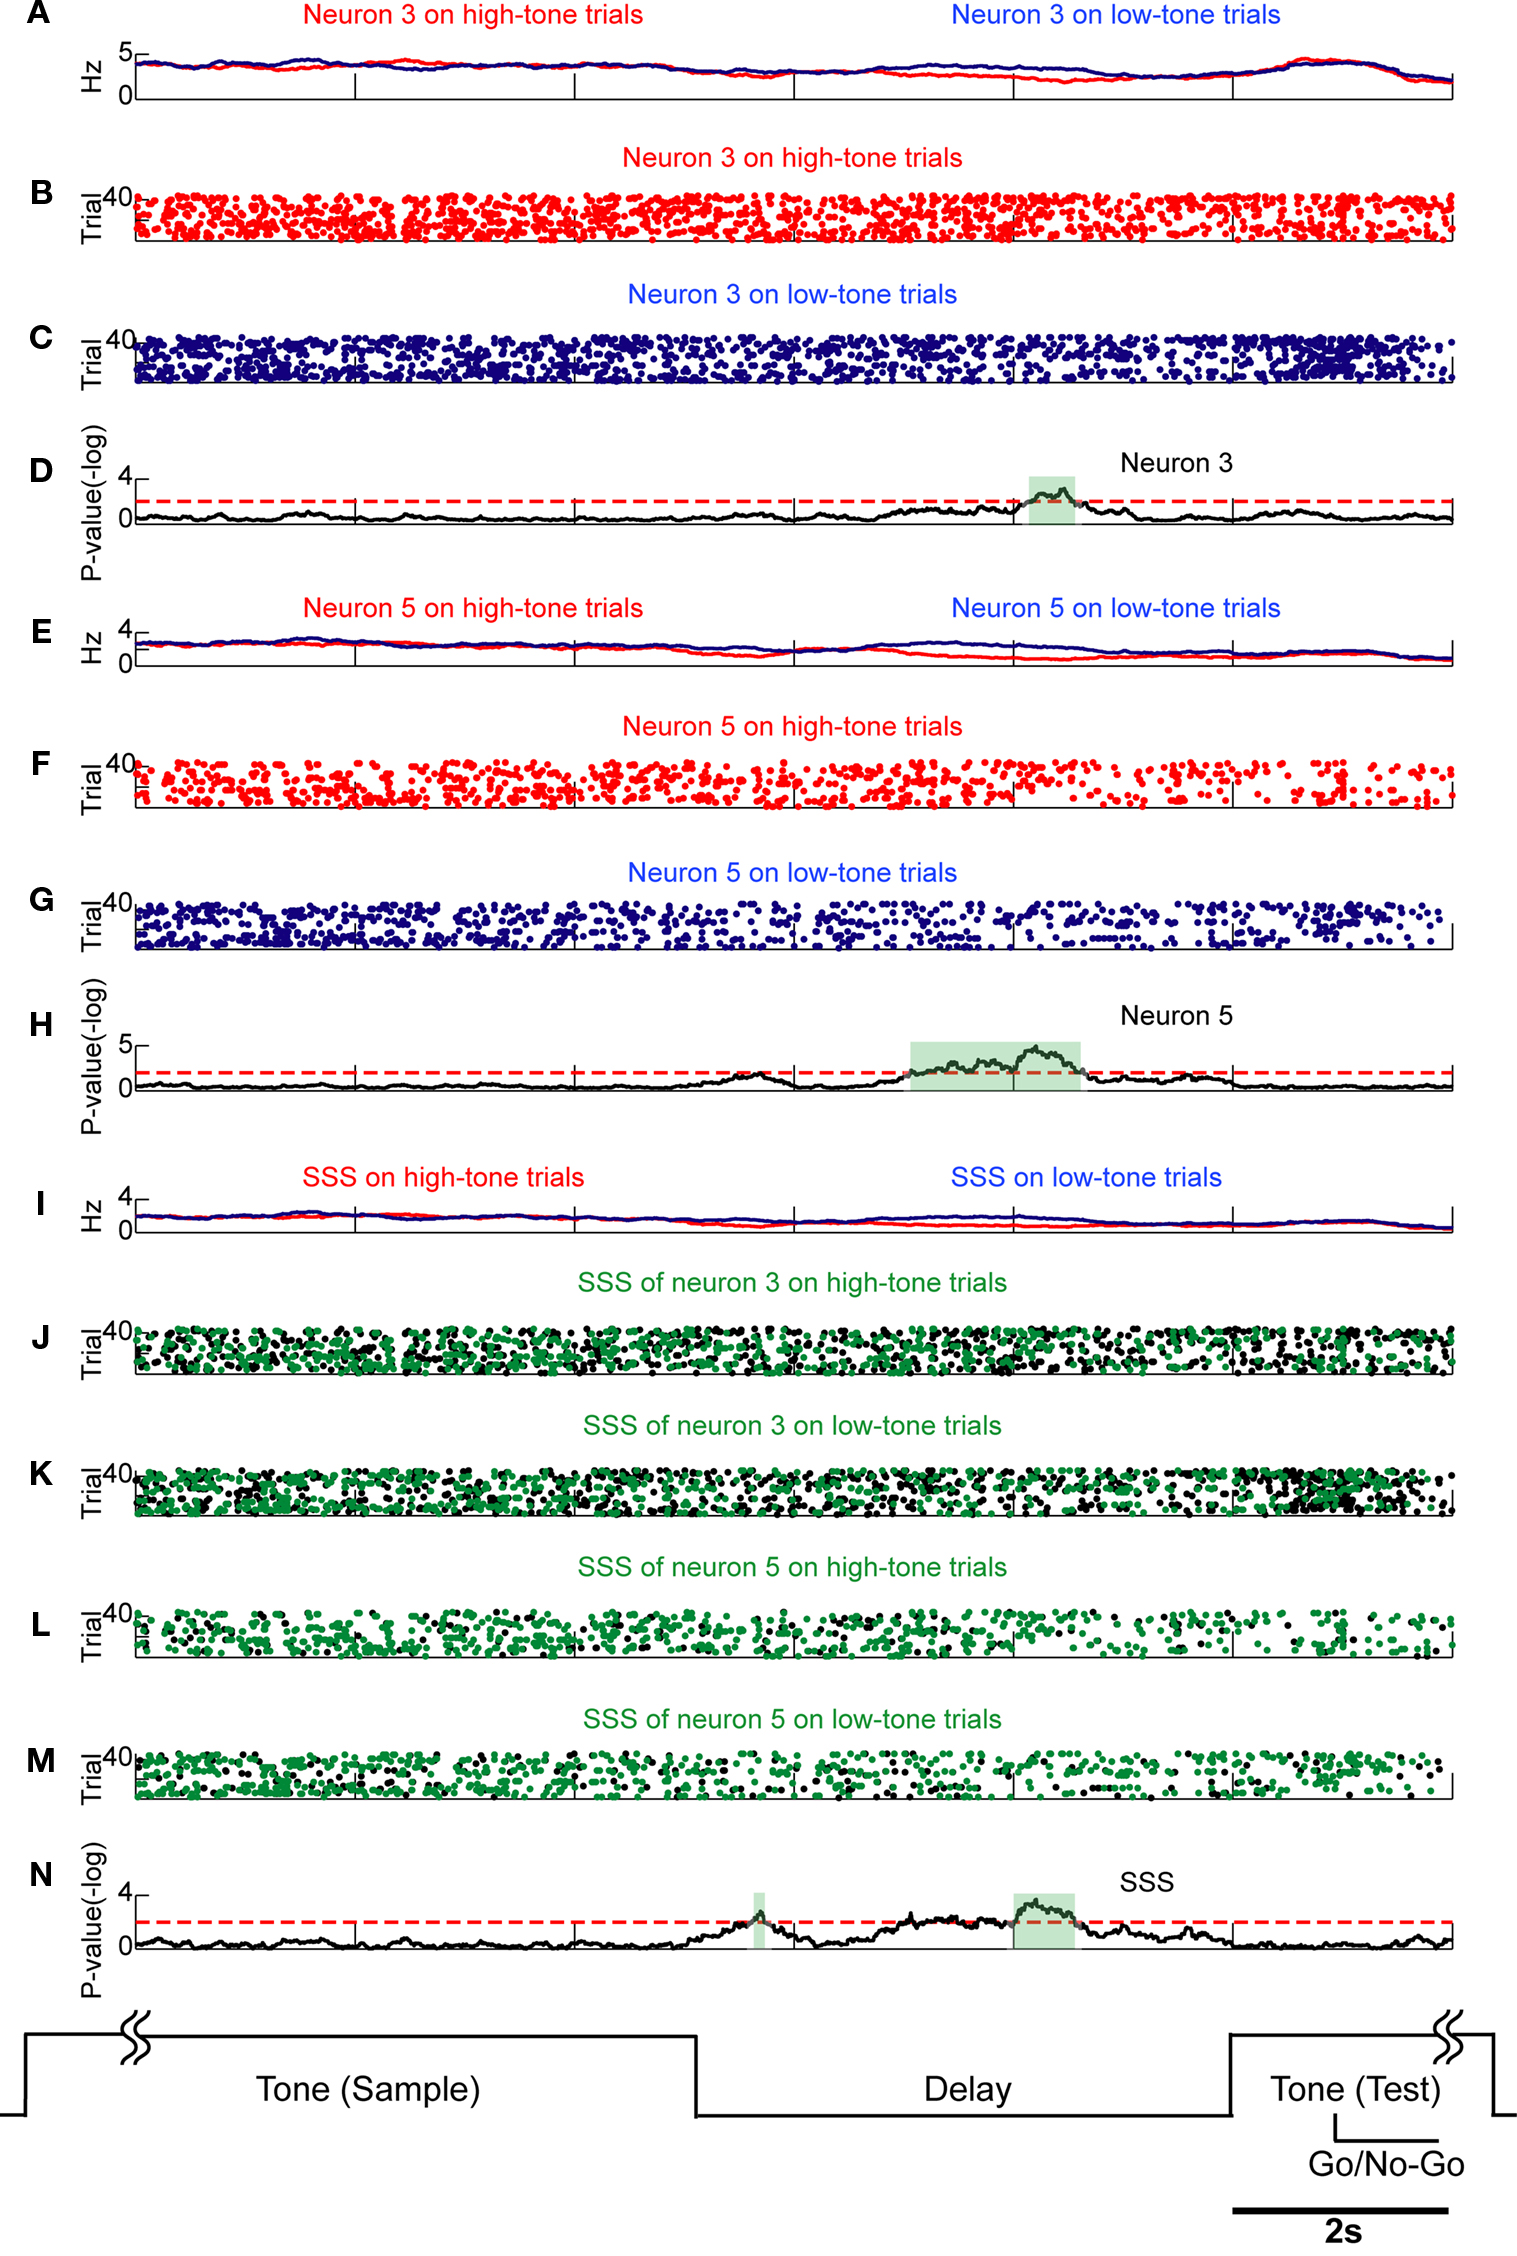
Figure 6. SSSs related to retention of the stimulus are associated with firing rate modulations. Comparison of SSSs and rate modulations between high tone and low tone trials was selected in this example. Each subfigure averages all correct trials of a session. Results of U-tests of 5 s of tone presentation in the preceding trial, 5 s of delay, and 2 s of tone presentation in the next trial are shown. (A) Firing rates of neuron 3 in high tone (red) and low tone (blue) trials. (B,C) Raster plots of spikes of neuron 3 in high tone (red) and low tone (blue) trials. (D) The P-values of neuron 3 for the difference between rates in high tone and low tone trials. (E) Firing rates of neuron 5. (F,G) Raster plots of neuron 5. (H) The P-values of neuron 5. (I) Rates of the SSS between neurons 3 and 5. (J–M) In copies of raster plots from (B), (C), (F), and (G) (black dots), SSSs are shown as green dots. (N) P-value of the SSS between neurons 3 and 5. The significant firing rates of neurons 3 and 5 are associated with SSS. Additional details are presented in Figure 5 and described in Section ‘Materials and Methods’.
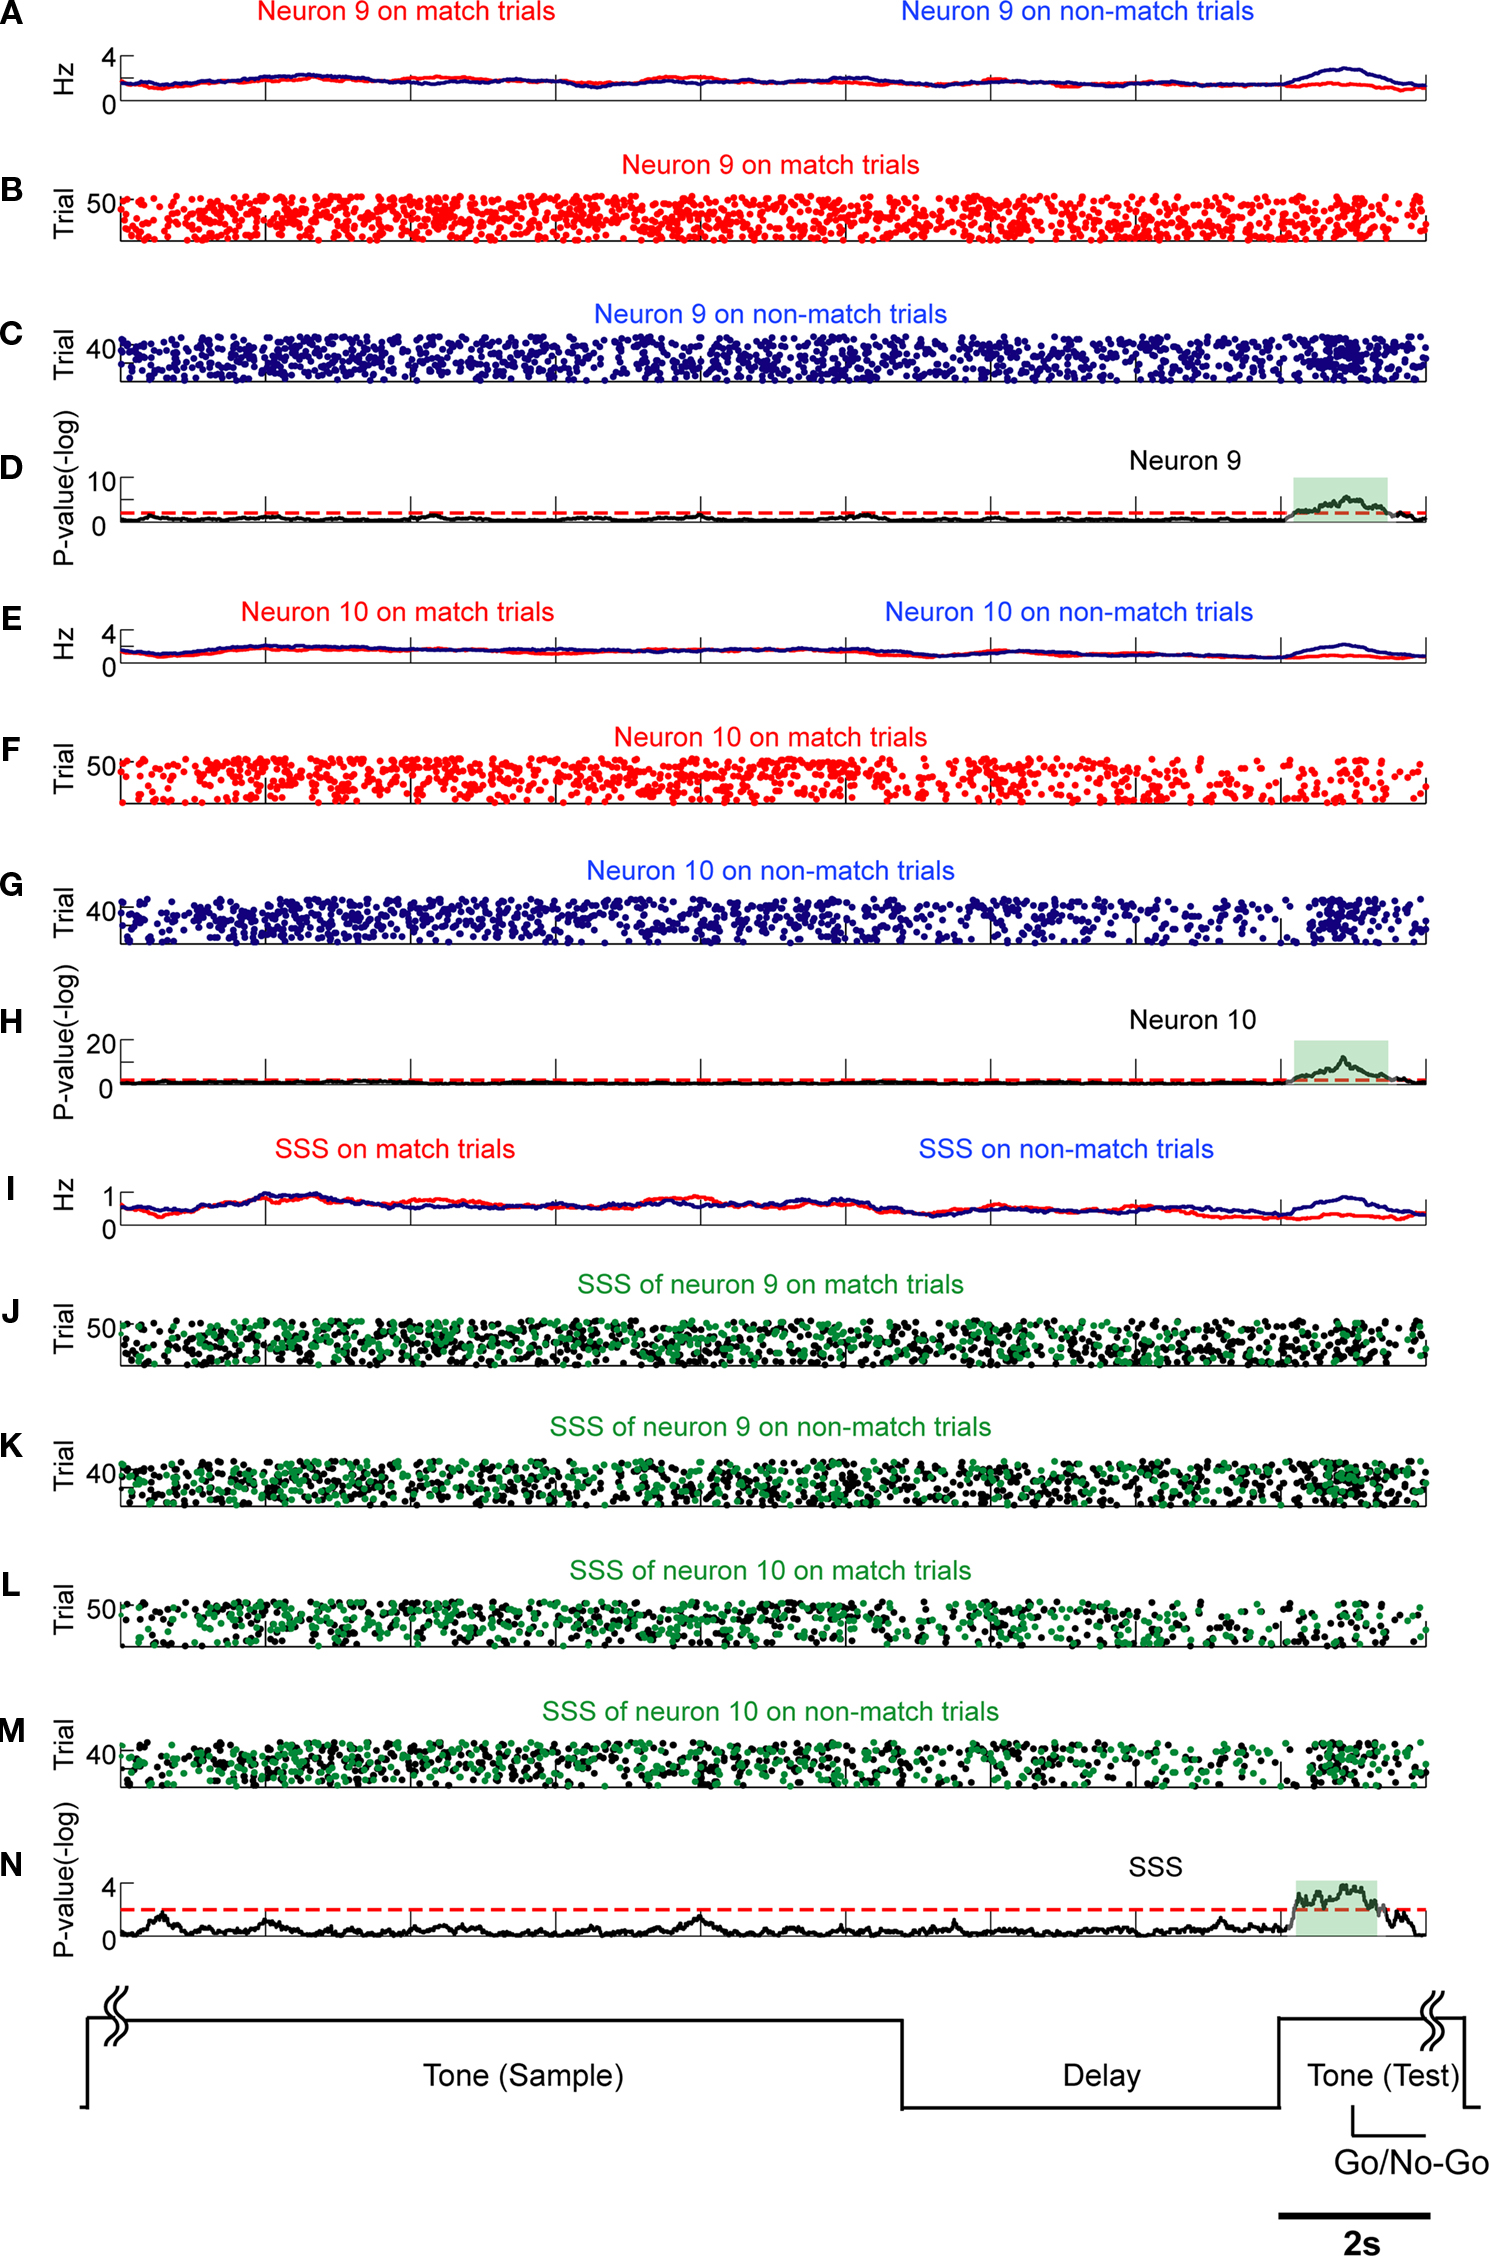
Figure 7. SSSs related to motor outputs are associated with firing rate modulations. Comparison of SSSs and rate modulations between non-match/match (go/no-go) trials was selected in this example. Each subfigure averages all correct trials of a session. Results of U-tests of 11 s of tone presentation in the preceding trial, 5 s of delay, and 2 s of tone presentation in the next trial are shown. (A) Firing rates of neuron 9 in match (red) and non-match (blue) trials. (B,C) Raster plots of spikes of neuron 9 in match (red) and non-match (blue) trials. (D) P-values of neuron 9 for a difference between rates in match trials and in non-match trials. (E) Firing rates of neuron 10. (F,G) Raster plots of neuron 10. (H) P-values of neuron 10. (I) Rates of the SSS between neurons 9 and 10. (J–M) In copies of raster plots from (B), (C), (F), and (G) (black dots), SSSs are shown as green dots. (N) P-value of the SSS between neurons 9 and 10. The significant firing rates of neurons 9 and 10 are associated with SSS. Additional details are presented in Figure 5 and described in Section ‘Materials and Methods’.
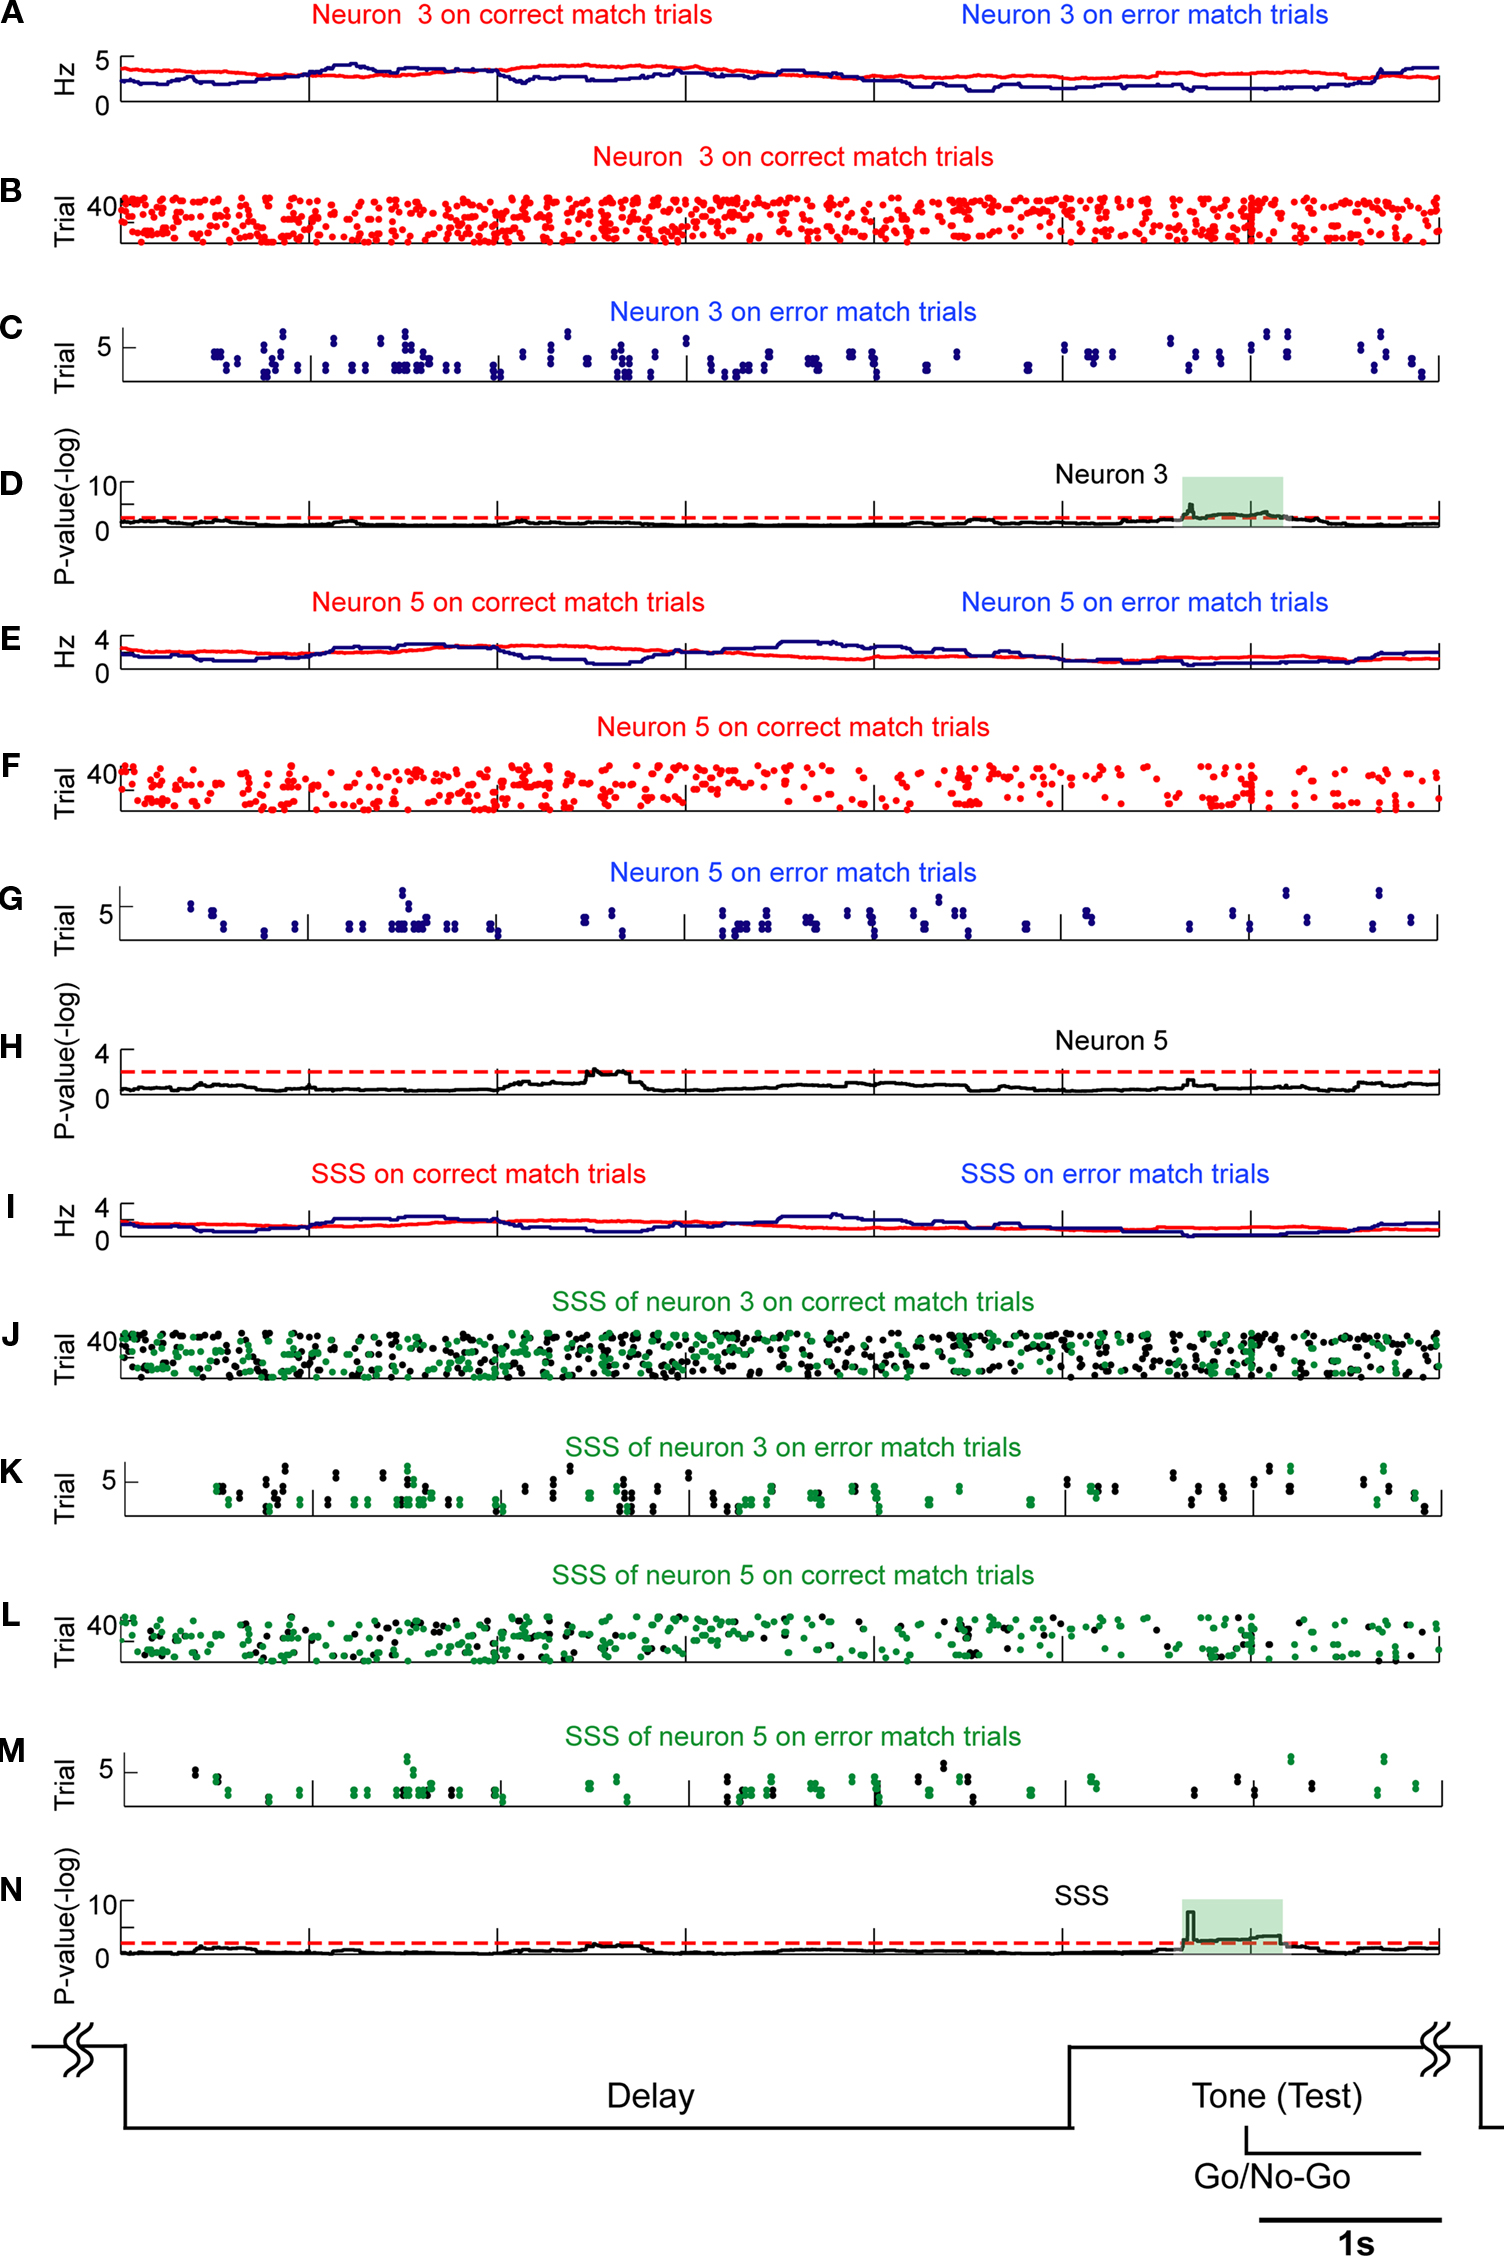
Figure 8. SSSs related to comparison of the stimuli are associated with firing rate modulations. Comparison of SSSs and rate modulations between correct match and error match trials was selected in this example. Results of U-tests of 5 s of delay and 2 s of tone presentation are shown. (A) Firing rates of neuron 3 in correct match (red) and error match (blue) trials. (B,C) Raster plots of spikes of neuron 3 in correct match (red) and error match (blue) trials. (D) P-values of neuron 3 for a difference between rates on correct match trials and on error match trials. (E) Firing rates of neuron 5. (F,G) Raster plots of neuron 5. (H) P-values of neuron 5. (I) Rates of the SSS between neurons 3 and 5. (J–M) In copies of raster plots from (B), (C), (F), and (G) (black dots), SSSs are shown as green dots. (N) P-value of the SSS between neurons 3 and 5. The significant firing rates of neuron 3 are associated with SSS. Additional details are presented in Figure 5 and described in Section ‘Materials and Methods’.
Even if SSSs play an important role in biological and computational processes, the rate modulation of individual neurons can play other roles; SSSs and rate modulations might contain independent information (Riehle et al., 1997
). We tested this hypothesis for all detected groups. Results showed that SSSs were observed with or without modulations of the firing rates of participating neurons. A summary of the analysis is shown in Figure 9
. Figures 5
–8
show that SSS occurred at the probability of 79% if at least one participating neuron show significant firing rate modulations in relation to both internal (retention and comparison) and external (stimulus input and motor output) events. This consistent relation among SSS, rate modulation, and behavioral events implies the functional significance of both SSS and rate modulation. Of six groups related to stimulus inputs, half (3/6) showed that SSS was not associated with modulations of the firing rates of participating neurons, as portrayed in Figure 10
. In each behavioral event, at least one group showed that SSSs were not related to behavioral events, even when the firing rate of participating neurons was modulated, as presented in Figure 11
. Moreover, the analysis used to identify the statistical significance of the SSS incorporates the expected rate of coincidence caused by the firing rate modulation of participating neurons. Therefore, we conclude that SSSs are not simply a consequence of the rate modulations of participating neurons.
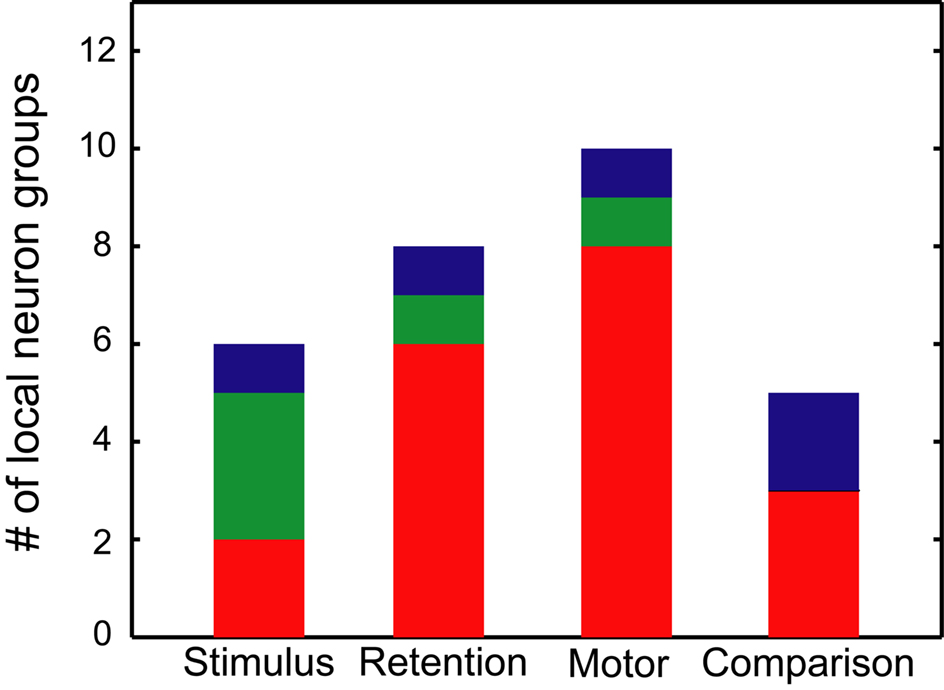
Figure 9. Relation between SSSs and rate modulations. The number of local neuron groups with significant SSSs and rate modulations is shown in relation to stimulus, retention, motor and comparison events. Red signifies the groups in which more than one pair of neurons showed SSSs that are associated with firing rate modulations of at least one of the participating neurons in relation to each behavioral event. Green signifies the groups in which more than one pair of neurons showed SSSs in relation to each behavioral event, even when no pair exhibited firing rate modulations. Blue signifies the groups in which more than one pair of neurons modulated their firing rates, even when no pair exhibited SSSs.
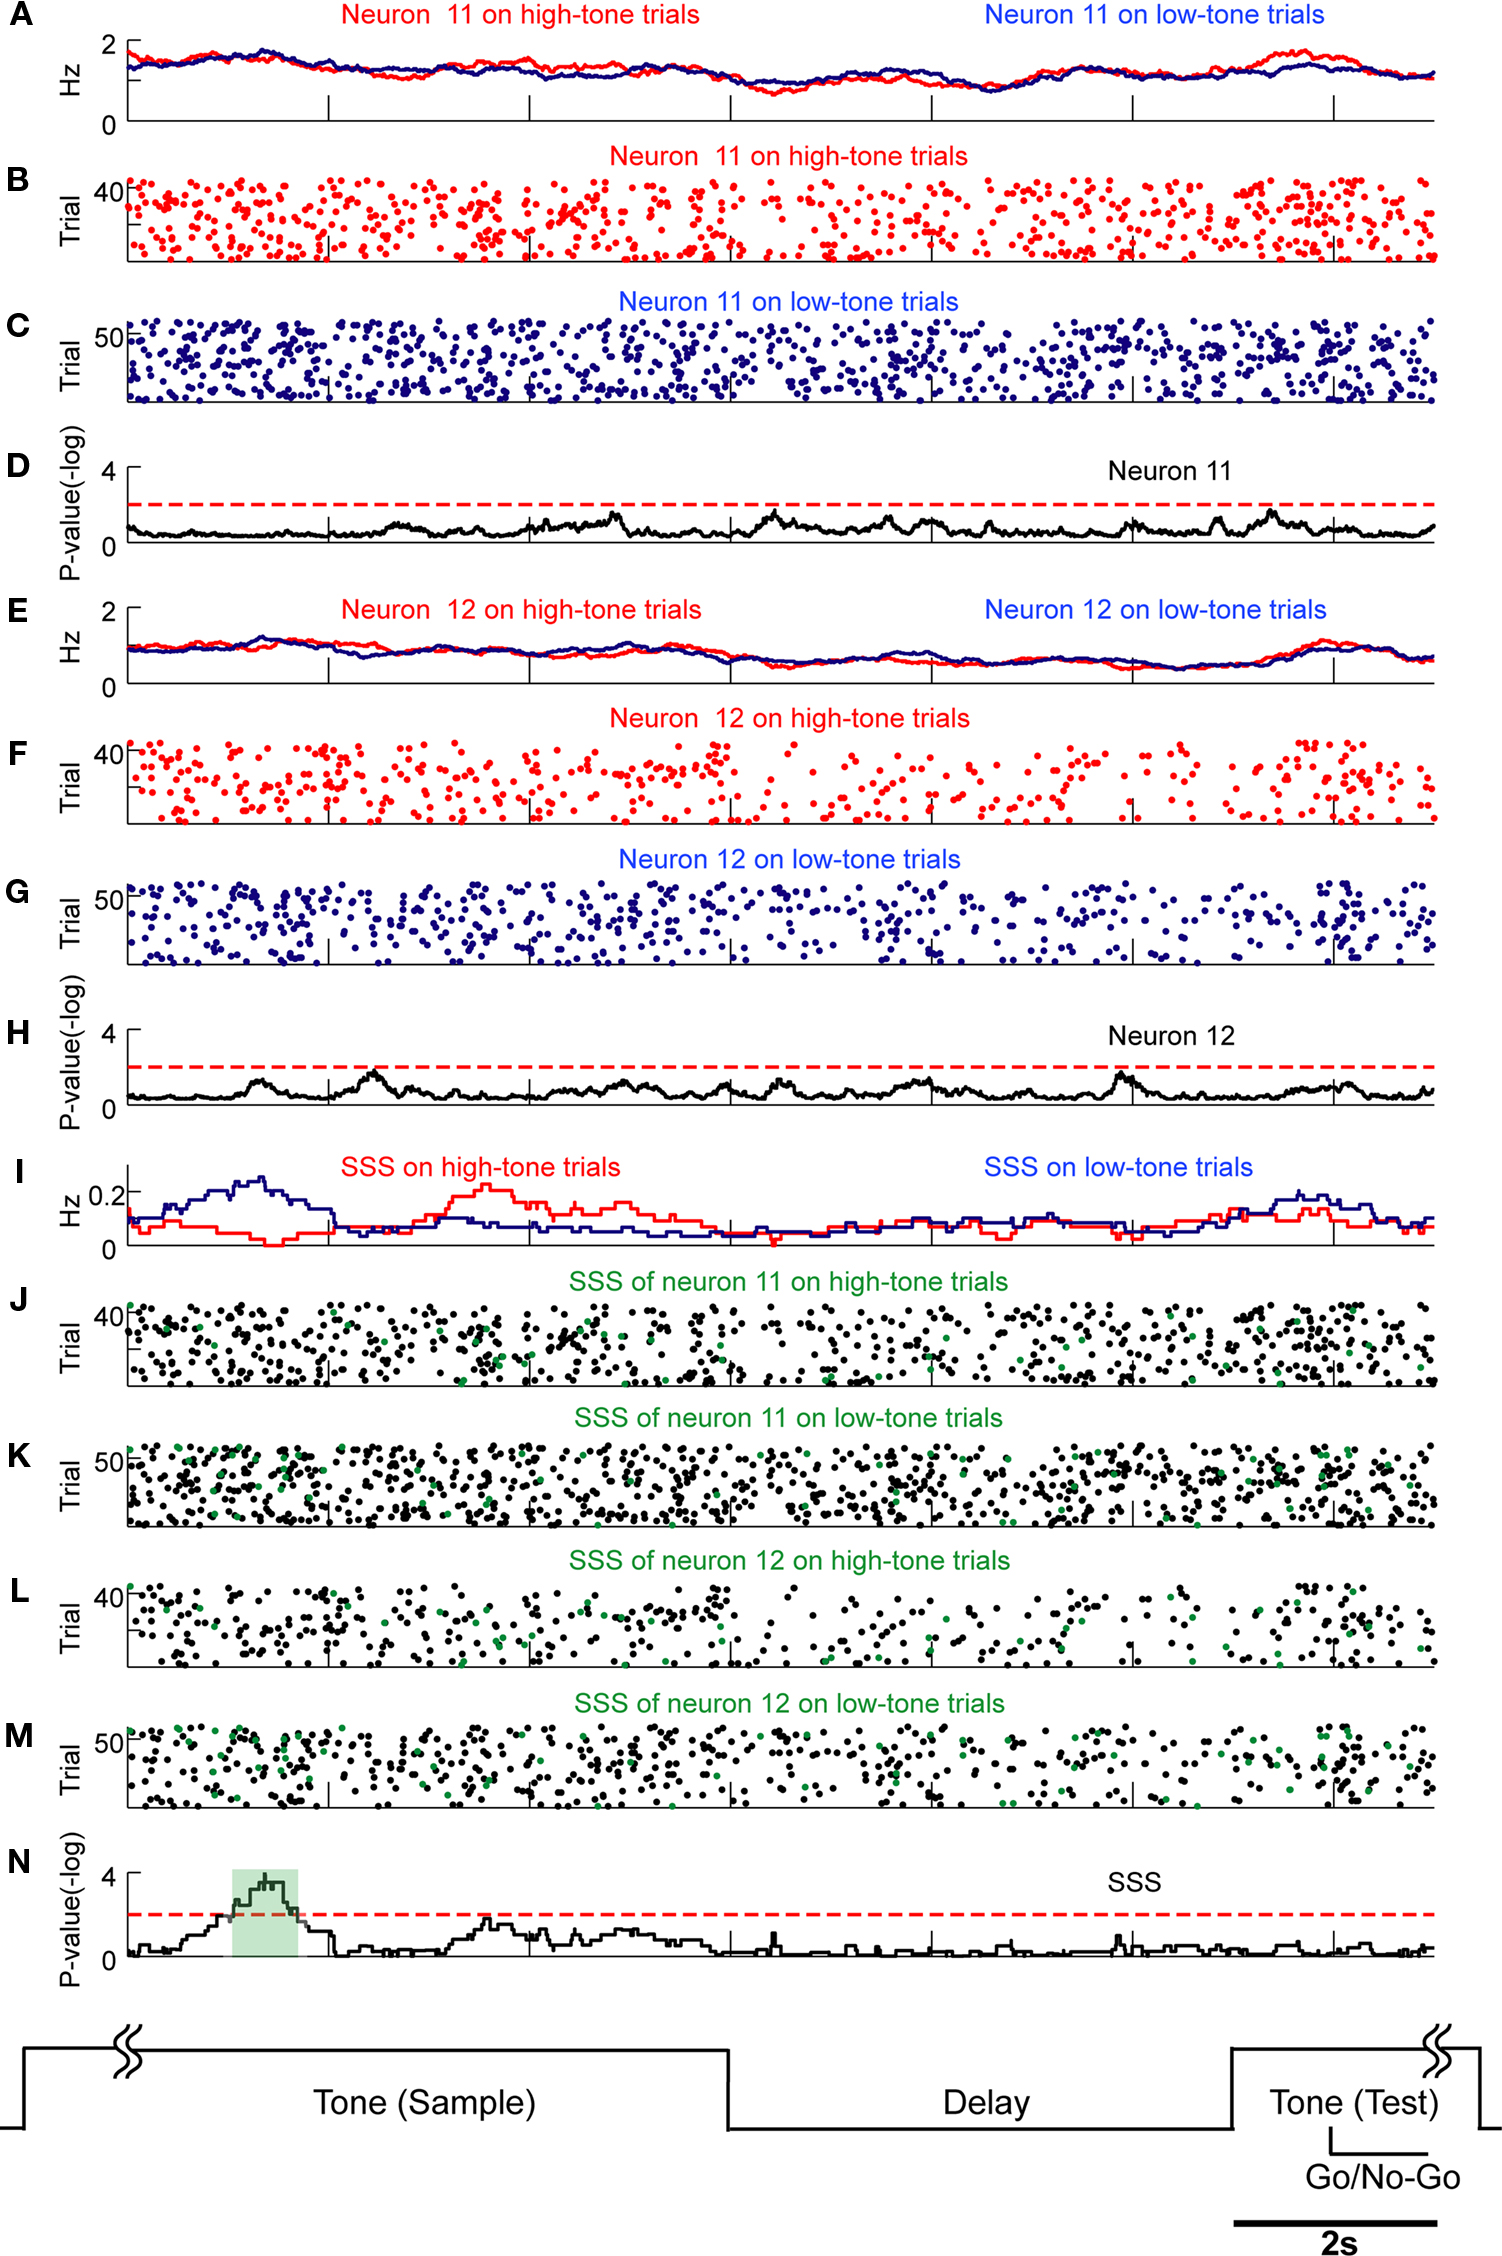
Figure 10. SSSs related to stimulus inputs are not associated with firing rate modulations. Comparison of SSSs and rate modulations between high tone (red) and low tone (blue) trials was selected in this example. Results of U-tests of 6 s of tone presentation in the preceding trial, 5 s of delay, and 2 s of tone presentation in the next trial are shown. (A) Firing rates of neuron 11 in high tone (red) and low tone (blue) trials. (B,C) Raster plots of spikes of neuron 11 in high tone (red) and low tone (blue) trials. (D) P-values of neuron 11 for a difference between rates in high tone trials and in low tone trials. (E) Firing rates of neuron 12. (F,G) Raster plots of neuron 12. (H) The P-values of neuron 12. (I) Rates of the SSS between neurons 11 and 12. (J–M) In copies of raster plots from (B), (C), (F), and (G) (black dots), SSSs are shown as green dots. (N) The P-values of the SSS between neurons 11 and 12. Significant SSSs were not associated with firing rate modulations of neurons 11 and 12. Additional details are presented in Figure 5 and described in Section ‘Materials and Methods’.
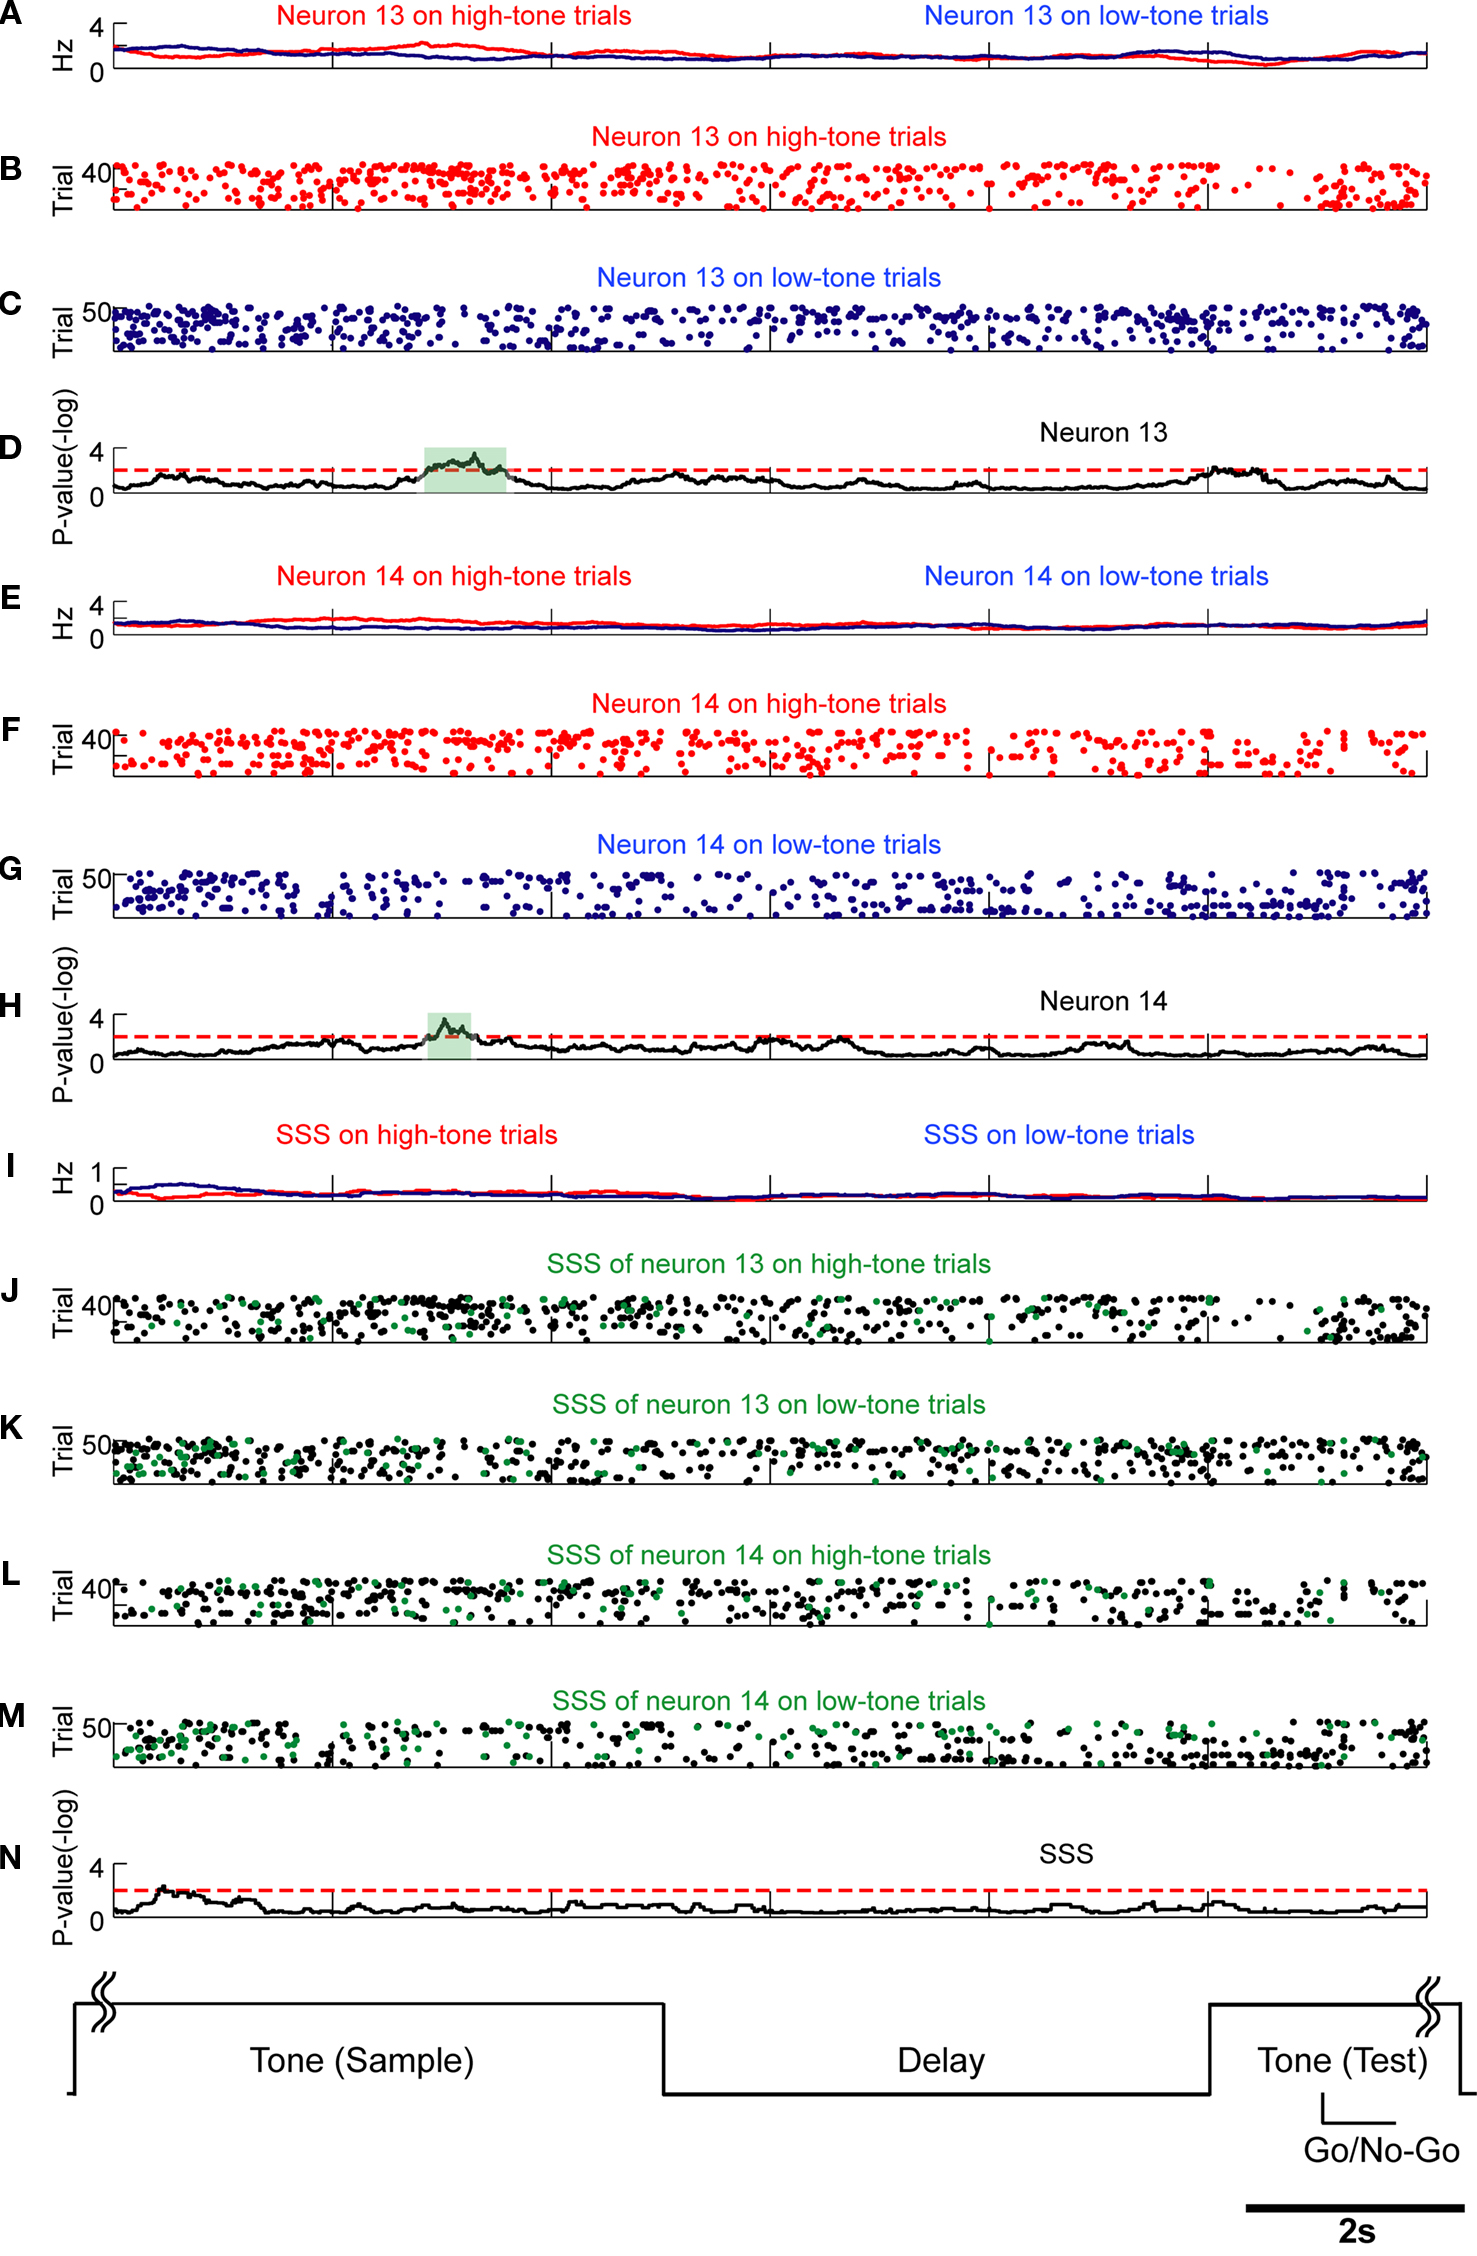
Figure 11. Rate modulations related to stimulus inputs are not associated with SSSs. Comparison of SSSs and rate modulations between high tone (red) and low tone (blue) trials was selected in this example. Results of U-tests of 5 s of tone presentation in the preceding trial, 5 s of delay, and 2 s of tone presentation in the next trial are shown. (A) Firing rates of neuron 13 in high tone (red) and low tone (blue) trials. (B,C) Raster plots of spikes of neuron 13 in high tone (red) and low tone (blue) trials. (D) P-values of neuron 13 for a difference between rates on high tone trials and on low tone trials. (E) Firing rates of neuron 14. (F,G) Raster plots of neuron 14. (H) P-values of neuron 14. (I) Rates of the SSS between neurons 13 and 14. (J–M) In copies of raster plots from (B), (C), (F), and (G) (black dots), SSSs are shown as green dots. (N) P-values of the SSS between neurons 13 and 14. Significant firing rate modulations of neurons 13 and 14 were not associated with SSSs. Additional details are presented in Figure 5 and described in Section ‘Materials and Methods’.
SSSs Among Triplets of Neurons
Similarly to pairs of pyramidal neurons, we found in our datasets that triplets of closely neighboring pyramidal neurons also co-fire with sub-millisecond precision. Of 28 triplets of closely neighboring pyramidal neurons, we found that 27 triplets have SSSs that were unrelated to behavioral events, as presented in Figure 12
. Three neurons participating in each triplet did not show firing rate modulations in relation to the same behavioral event simultaneously. However, in one group, SSSs among a triplet of neurons were significantly related to the comparison of stimuli (Figure 13
). The SSSs between one possible pair of neurons participating in the triplet were related to the same behavioral event (Figure 8
). The average occurrence probabilities of quadruplets, quintuplets, and sextuplets of neurons were <0.06%; the SSSs among four or more neurons could not be analyzed statistically because of the insufficient number of SSSs.
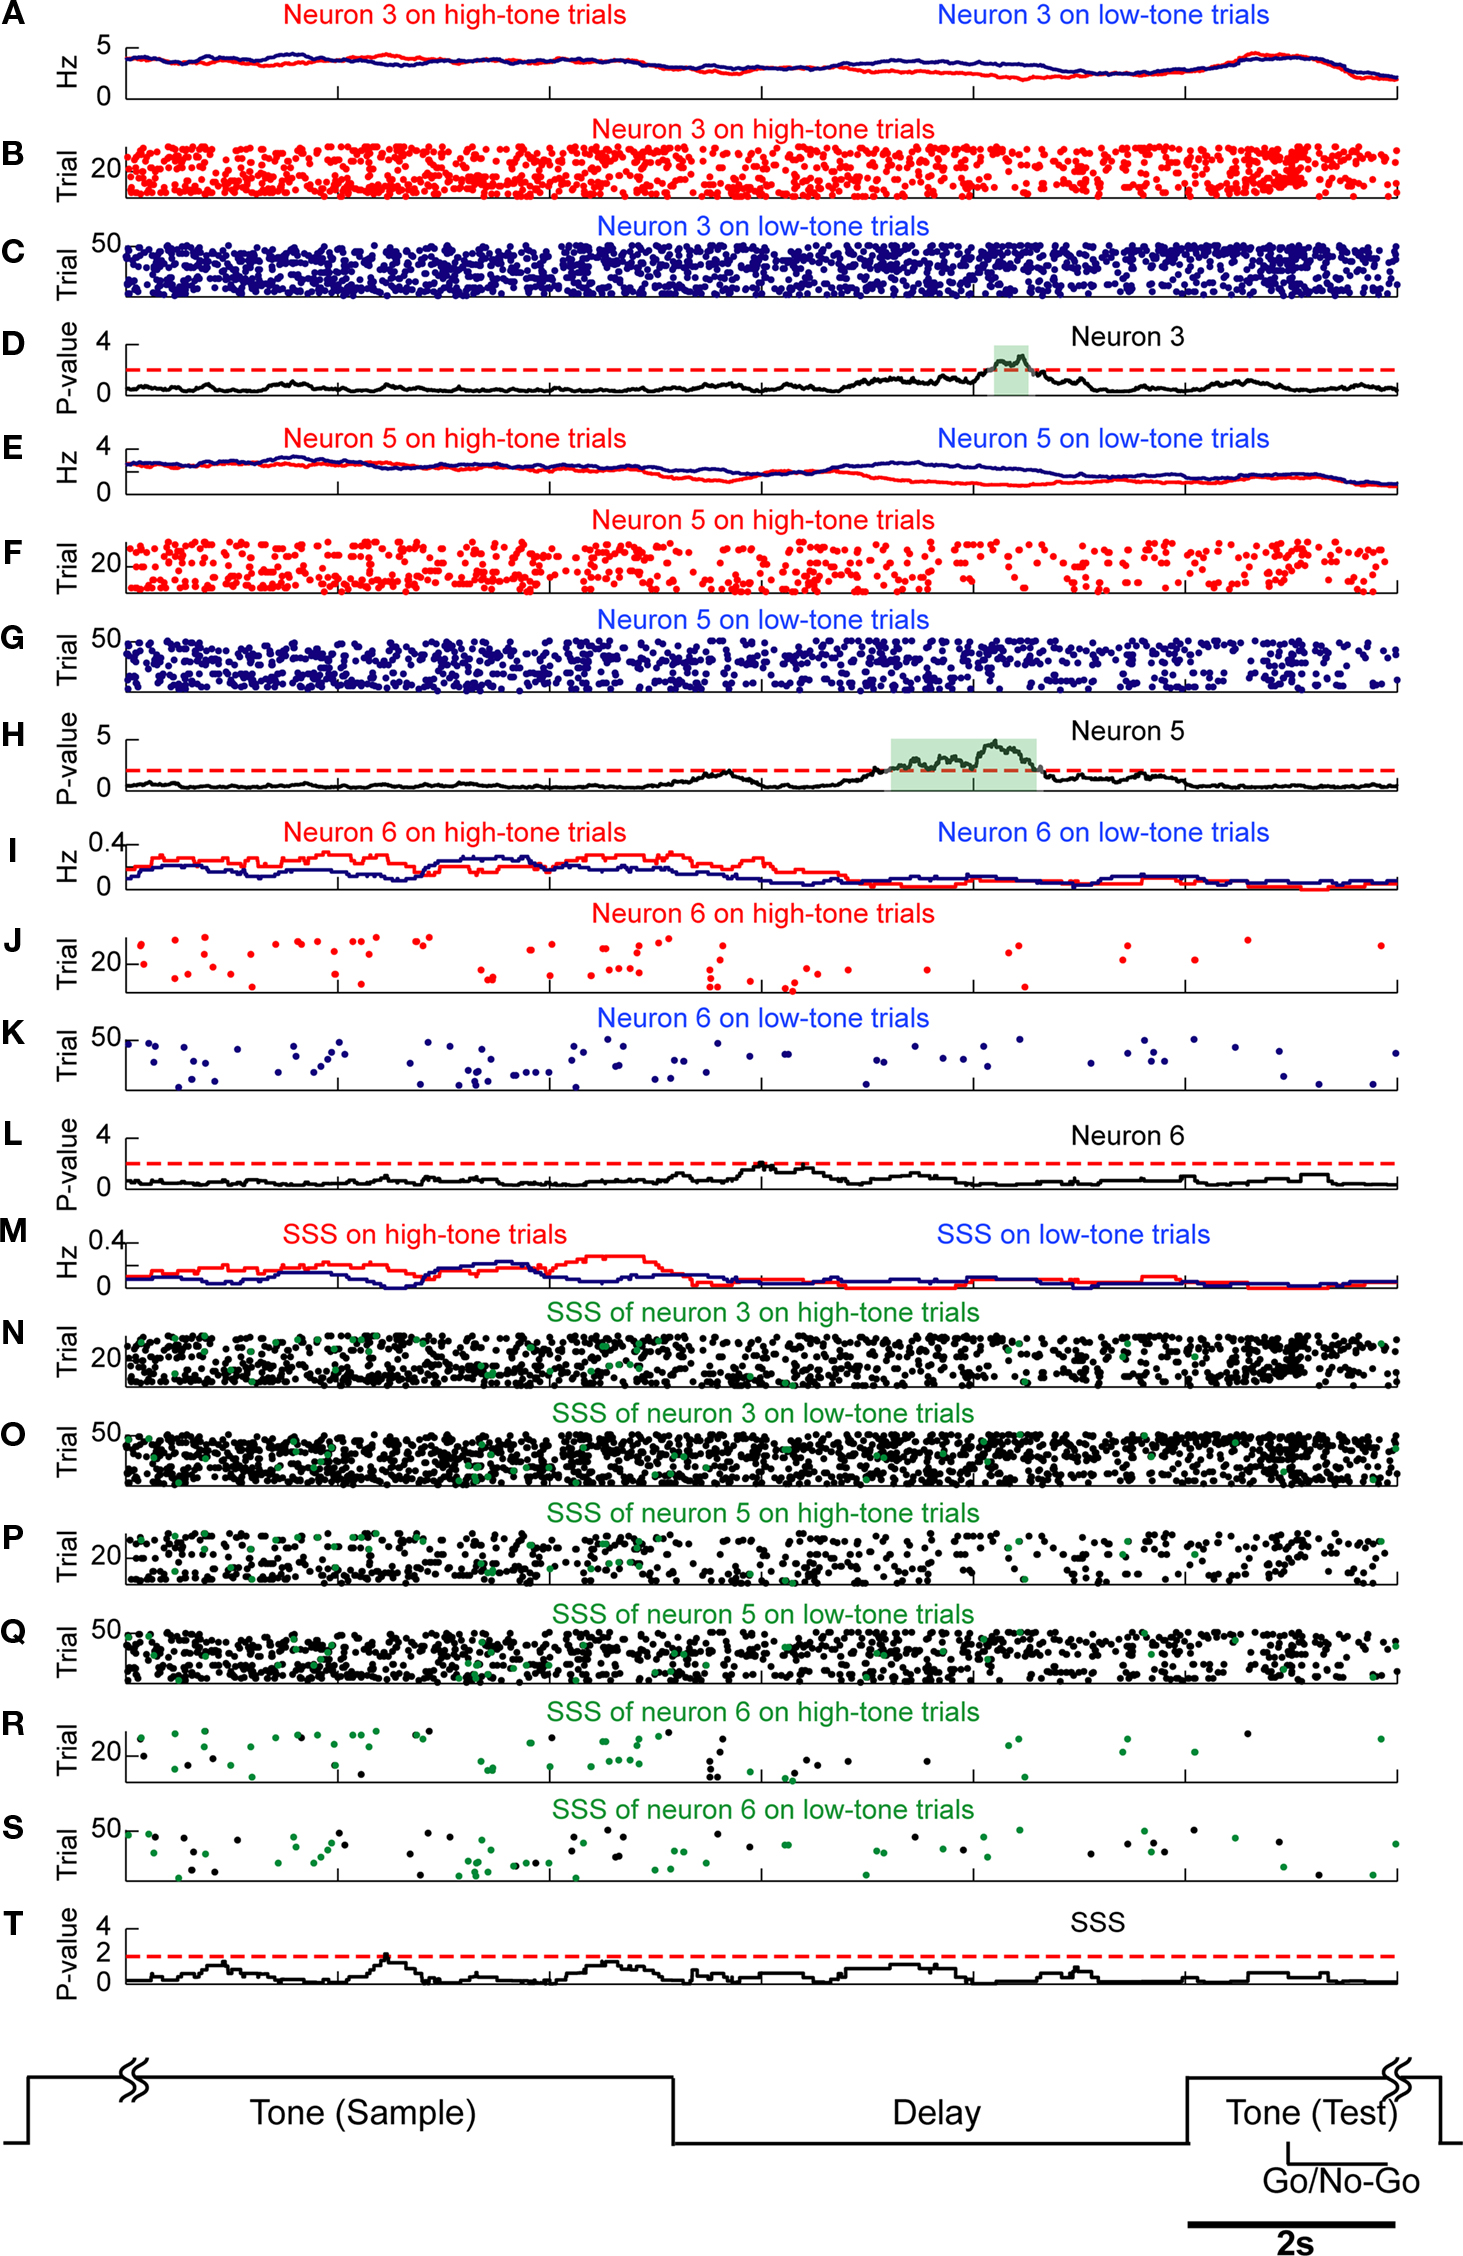
Figure 12. Rate modulations related to stimulus inputs are not associated with SSSs among a triplet of neurons. Comparison of SSSs and rate modulations between high tone (red) and low tone (blue) trials was selected in this example. Results of U-tests of 5 s of tone presentation on the preceding trial, 5 s of delay, and 2 s of tone presentation in the next trial are shown. (A) Firing rates of neuron 3 in high tone (red) and low tone (blue) trials. (B,C) Raster plots of spikes of neuron 3 in high tone (red) and low tone (blue) trials. (D) P-values of neuron 3 for a difference between rates in high tone trials and in low tone trials. (E) Firing rates of neuron 5. (F,G) Raster plots of neuron 5. (H) P-values of neuron 5. (I) Firing rates of neuron 6. (J) and (K) Raster plots of neuron 6. (L) P-values of neuron 6. (M) Rates of the SSS among neurons 3, 5, and 6. (N–S) In copies of raster plots from (B), (C), (F), (G), (J), and (K) (black dots), SSSs are shown as green dots. (T) P-values of the SSS among neurons 3, 5, and 6. The significant firing rate modulations of neurons 3 and 5 were not associated with SSSs among a triplet of neurons. Additional details are presented in Figure 5 and described in Section ‘Materials and Methods’.
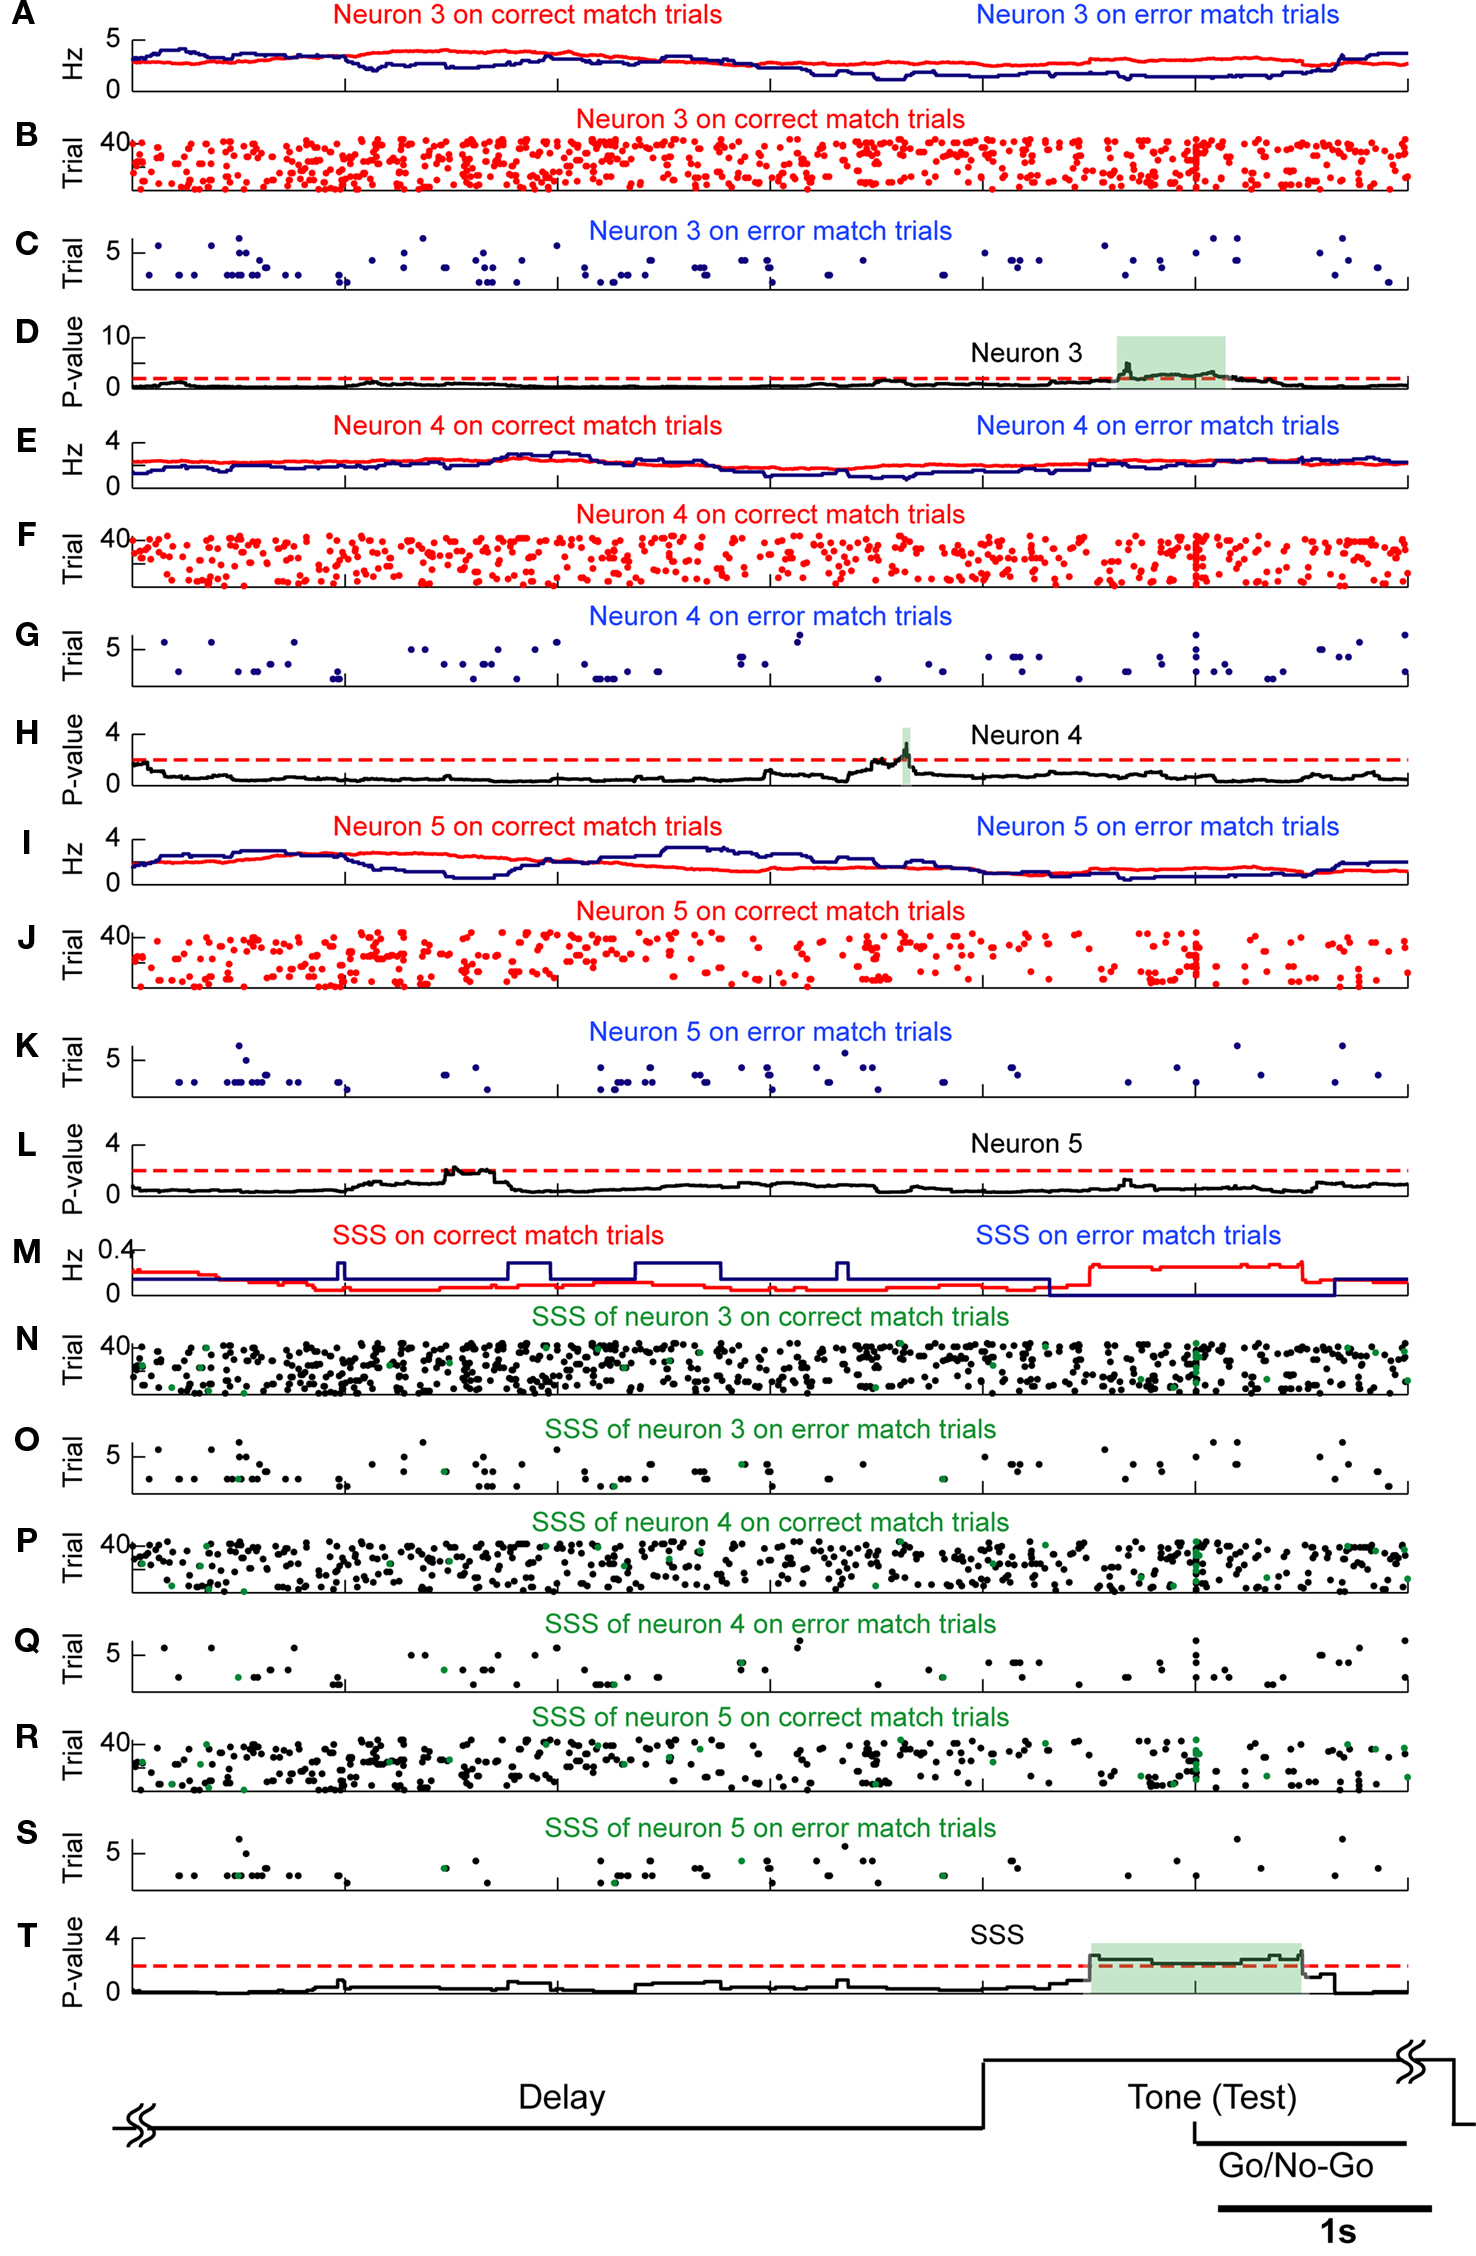
Figure 13. SSSs among a triplet of neurons related to comparison of the stimuli are associated with firing rate modulations. The comparison of SSSs and rate modulations between correct match (red) and error match (blue) trials was selected in this example. Results of U-tests of 4 s of delay and 2 s of tone presentation are shown. (A) Firing rates of neuron 3 in correct match (red) and error match (blue) trials. (B,C) Raster plots of spikes of neuron 3 in correct match (red) and error match (blue) trials. (D) P-values of neuron 3 for a difference between rates in correct match trials and in error match trials. (E) Firing rates of neuron 4. (F,G) Raster plots of neuron 4. (H) P-values of neuron 4. (I) Firing rates of neuron 5. (J,K) Raster plots of neuron 5. (L) P-values of neuron 5. (M) Rates of the SSS among neurons 3, 4, and 5. (N–S) In copies of raster plots from (B), (C), (F), (G), (J), and (K) (black dots), SSSs are shown as green dots. (T) P-values of the SSS among neurons 3, 4, and 5. The significant SSSs among a triplet of neurons were associated with firing rate modulations of neuron 3. Additional details are presented in Figure 5 and described in Section ‘Materials and Methods’.
Taken together, our findings demonstrate that robust SSSs exist between two closely neighboring pyramidal neurons in the hippocampal CA1 of behaving rats. Furthermore, SSSs are generally coupled with modulations of the firing rates of participating neurons and correlate with both internal and external behavioral events during the DNMS task. However, because SSSs related to stimulus inputs are not always accompanied with rate modulations, the SSSs are not simply a consequence of the rate modulations of participating neurons.
ICSort and Dodecatrodes Enable us to Investigate the SSSs
The combined use of ICSort and dodecatrodes is a key method used for this study. Simultaneous intracellular and extracellular measurements (Harris et al., 2000
) comparing tetrodes (Wilson and McNaughton, 1993
) to single electrodes suggest that a multi-electrode with multiple microwires can improve spike isolation performance. In addition, the dodecatrode tip diameter resembles that of a normal tetrode (Takahashi and Sakurai, 2005
). Consequently, a dodecatrode with 12 microwires (8 μm diameter) provides more accurate information about the location of neurons than a tetrode, with its four microwires (12–13 μm diameter; Figures 1
A,B). Type I error of spike sorting is caused by overlapping spikes (Harris et al., 2000
). Our previous studies (Takahashi et al., 2003a
,b
; Takahashi and Sakurai, 2005
, 2007
; Sakurai and Takahashi, 2006
) and the present results in Figure 1
, however, suggest that ICSort can separate overlapping spikes. Another major source of error for spike sorting is the dramatic changes in spike waveforms which occur during complex spike bursts (Harris et al., 2000
). In the present analysis, units showing significant spike amplitude attenuations during bursts were excluded (see Materials and Methods) because some reports of in vitro studies of dendrites (Stuart et al., 1997
) have described that, in contrast to somatic spikes, dendritic spikes imply amplitude attenuation during bursts. Results of a previous study (Takahashi and Sakurai, 2007
) suggest that the information coded by the soma and dendrite of pyramidal cells differ in the hippocampal CA1 of behaving rats. In light of these methodological considerations and considering the results presented in Figure 1
, we conclude that our datasets, compiled through the combined use of ICSort and dodecatrodes, are reliable for detection of sub-millisecond synchronization among closely neighboring neurons.
Candidates for SSS Generation
Two promising candidates exist for generating SSSs. First, reports of computational and in vitro experiments have described that sub-millisecond synchronizations can be propagated in neuronal networks only via chemical synapses, as stated in the hypotheses of synfire chains (Abeles, 1991
; Diesmann et al., 1999
), of the development of synchrony through multiple layers (Reyes, 2003
), and of common (shared) inputs from synchronized neuronal assemblies to closely neighboring neurons. Especially because of the specific anatomical structure of the hippocampus, hippocampal CA1 pyramidal cells that are the recording target of our study can receive such near-synchronous synaptic inputs from the CA3 and entorhinal cortex (Freund and Buzsaki, 1996
). Consequently, the SSS may be generated by the effect of such neuronal networks. Second, results of some in vitro studies suggest that pyramidal cells in the hippocampus are coupled electrically via axo-axonal gap junctions (Macvicar and Dudek, 1981
; Schmitz et al., 2001
) and that such electrically coupled pyramidal cells contribute to generation of fast-ripple oscillations (Draguhn et al., 1998
; Traub and Bibbig, 2000
). The neurons analyzed in our present study are pyramidal cells detected from narrow-spaced multiple microwires (dodecatrodes). Therefore, the anatomical distance between neurons of each pair might be sufficiently small to form connections via axo-axonal gap junctions. Consequently, such electrically coupled pyramidal cells via axo-axonal gap junctions might generate SSSs. Although our results suggest that SSS is not a simple consequence of firing rate modulations of participating neurons, it is not known whether electrically coupled pyramidal neurons via axo-axonal gap junctions constantly produce synchronized spikes in any state. Therefore, the possibility that electrical coupling is the origin of SSSs cannot be excluded. From these perspectives, we conclude that neuronal networks and electrically coupled pyramidal cells via axo-axonal gap junctions can support SSS generation.
The optimal bands of spike frequency for the occurrence of the SSS may be physiologically important because they correspond to the beta band (Traub et al., 1999
), a part of the gamma band (Traub et al., 1999
; Bibbig et al., 2001
; Csicsvari et al., 2003b
) and the fast-ripple oscillations (Buzsaki et al., 1992
; Siapas and Wilson, 1998
) in the several regions (Gray et al., 1989
; Vanderwolf and Zibrowski, 2001
) which are thought to play key roles in propagation and information storage. Regarding fast-ripple oscillations, some in vivo studies have suggested that they play a key role in information processing in the hippocampus during both awake and sleep states (Buzsaki, 1989
; Siapas and Wilson, 1998
; O’Neill et al., 2006
). In addition, Traub and Bibbig (2000)
suggested that fast-ripple oscillations are based on axo-axonal gap junctions between pyramidal cells. Consequently, the SSS among pyramidal neurons coupled via gap junctions might generate fast-ripple oscillation to propagate and store information. Additional experiments with local field potentials will be necessary for assessing this hypothesis.
Can Distantly Located Neurons Co-Fire with Sub-Millisecond Precision?
Although our results demonstrate that two to five closely neighboring pyramidal neurons in the hippocampus co-fire with sub-millisecond precision, it remains unknown whether SSSs exist among distantly located neurons. For this study, we performed statistical identification and classification of pyramidal neurons after whole recordings. We identified that 43% of detected pyramidal neurons originated predominantly from dendrites. They were therefore not used for final analyses. In the remaining datasets, there is no pair of pyramidal neurons simultaneously recorded using different dodecatrodes. Reports of some previous studies (Nicolelis et al., 1995
; Singer and Gray, 1995
; Vaadia et al., 1995
; Sakurai, 1996
; Riehle et al., 1997
; Harris et al., 2003
) describe that distantly located (more than 100 μm apart) neurons synchronize with greater than 1 ms precision. Therefore, it is possible that robust SSSs exist between distantly located pyramidal neurons in the hippocampus. Additional experiments using many dodecatrodes and a new technique for real-time identification and classification of dendrites might help to resolve this issue.
SSS Among Three or More Closely Neighboring Pyramidal Neurons
The results from SSS of pairs of closely neighboring pyramidal neurons suggested that a sufficient condition in which SSSs are related with the behavioral events is that firing rate modulations of both of two participating neurons are related to the same behavioral event. However, in our dataset, no triplet satisfied this condition: we were unable to observe that all three participating neurons show firing rate modulations simultaneously in relation to the same behavioral event. Therefore, this might be one reason why almost no SSS among a triplet of neurons was related to the behavioral events. On the other hand, because the dodecatrode tip diameter (ca. 70 μm) is a few times greater than that of the cell body of a pyramidal neuron, possible sources of SSS among some closely neighboring pyramidal neurons such as axons and gap junctions might be damaged severely, thereby decreasing the occurrence probability of the SSS among three or more neurons. Thinner electrodes such as silicon probes (Csicsvari et al., 2003a
) are expected to be necessary for minimizing these effects in future studies.
Possible Reasons Why Hippocampal Place Cells do not Co-Fire
In contrast to results obtained through a few studies of neighboring place cells (O’Keefe et al., 1998
; Redish et al., 2001
) undertaken without spike-separation techniques, the present study and a few others (Eichenbaum et al., 1989
; Hampson et al., 1999
) have demonstrated that the activities of neighboring pyramidal neurons synchronize. Major differences between these studies are the tasks that were used and the spike-sorting techniques. In neighboring place cell studies, neuronal activities during movement are only analyzed because, during immobility, neurons fire independently the rat’s location. In contrast, in the present study and other studies, neuronal activities during immobility were analyzed mainly by maintaining a rat in a sitting position. The behaviors strongly correlate with the EEG state, i.e., a theta rhythm appears during movement, whereas a large-amplitude irregular activity punctuated by sharp wave-ripple complexes appears during immobility (Buzsaki et al., 1983
). On the other hand, in results reported from use of conventional spike-sorting techniques ignoring the spike-overlapping problem, whether or not significant SSSs exist among closely neighboring neurons remains unknown. Moreover, results of our previous study implied that spatial information coded by the soma and dendrite differs in the hippocampal CA1 of freely foraging rats (Takahashi and Sakurai, 2007
). The conclusion that neighboring place cells do not significantly synchronize might be modified by results from studies using spike sorting along with a spike-separation technique such as that of our ICSort. Consequently, the incompatibility of the results might be attributable to the task and associated EEG state, and to technical issues associated with the spike-overlapping problem.
Firing Rate Modulations with SSSs Might be Important for Propagating Information
The occurrences of firing synchrony among closely neighboring pyramidal neurons with sub-millisecond precision were unclear before this study, as was the question of whether or not such synchronization codes salient information in the brains of behaving animals. Through this study, using the extracellular multi-unit recording technique with ICSort and dodecatrodes, we identified robust SSSs in the hippocampal CA1 of behaving rats. Several lines of evidence clarifying the firing rate modulations have provided remarkable information related to external stimuli (Hubel and Wiesel, 1977
) and behaviors (Georgopoulos et al., 1986
), as well as internal cognitive processes (Funahashi et al., 1989
). However, the impact of firing rate modulations of single neuron is too weak to depolarize downstream neurons. The synchronization of multiple neurons with sub-millisecond precision is sufficiently strong to convey information (Diesmann et al., 1999
; Reyes, 2003
) and change synaptic efficacies (Tsodyks and Markram, 1997
; Bi and Poo, 1998
). Therefore, the SSSs must propagate information sufficiently to downstream neurons. Our results suggest that the SSSs and the firing rate modulations are generally coupled and correlate with both internal and external events during the DNMS task, suggesting that the SSS is not related to any specific event, as some previous reports have suggested (Deadwyler et al., 1996
; Sakurai, 1996
; Eichenbaum et al., 1999
): hippocampal neurons show multiple representations and conjunctive encoding.
Consequently, we conclude that sub-millisecond firing synchrony in groups of closely neighboring pyramidal neurons in the hippocampal CA1 might be an important carrier for propagating information that is not easily transmitted, but which is strikingly represented by firing rate modulations of participating neurons to downstream neurons in neural circuits.
The authors declare that the research was conducted in the absence of any commercial or financial relationships that could be construed as a potential conflict of interest.
This work was supported by the JST PRESTO Program (S. Takahashi), Grand-in-Aid for Priority Research (18047012 and 16330140) and JST CREST Program (Y. Sakurai).