Multiple distinct subtypes of GABAergic neurons in mouse visual cortex identified by triple immunostaining
Department of Anatomy and Neurobiology, Washington University School of Medicine, St. Louis, MO, USA
The majority of cortical interneurons use GABA (gamma amino butyric acid) as inhibitory neurotransmitter. GABAergic neurons are morphologically, connectionally, electrically and chemically heterogeneous. In rat cerebral cortex three distinct groups of GABAergic interneurons have been identified by the expression of parvalbumin (PV), calretinin (CR) and somatostatin (SOM). Recent studies in mouse cerebral cortex have revealed a different organization in which the CR and SOM populations are partially overlapping. Because CR and SOM neurons derive from different progenitors located in different embryonic structures, the coexpression of CR+SOM suggests that the chemical differentiation of interneurons is regulated postmitotically. Here, we have taken an important first step towards understanding this process by triple immunostaining mouse visual cortex with a panel of antibodies, which has been used extensively for classifying developing interneurons. We have found at least 13 distinct groups of GABAergic neurons which include PV, CR, SOM, CCK (cholecystokinin), CR + SOM, CR + NPY (neuropeptide Y), CR + VIP (vasointestinal polypeptide), SOM + NPY, SOM + VIP, VIP + ChAT (choline acetyltransferase), CCK + NPY, CR + SOM + NPY and CR + SOM + VIP expressing cells. Triple immunostaining with PV, CR and SOM antibodies during postnatal development further showed that PV is never colocalized with CR and SOM. Importantly, expression of SOM and CR + SOM developed after the percentage of CR cells that do not express SOM has reached the mature level, suggesting that the chemical differentiation of SOM and CR + SOM neurons is a postnatal event, which may be controlled by transcriptional regulation.
When doctors talk about epilepsy, autism and schizophrenia they often explain these disorders in terms of an imbalance of the excitatory and inhibitory systems in the cerebral cortex (Lewis, 2000
; McBain and Fisahn, 2001
; Rubenstein and Merzenich, 2003
). To advance the understanding of what this means it is important to define the components of each system. This is especially challenging for the inhibitory system, which in human cerebral cortex is composed of numerous morphologically diverse types of interneurons that account for 20% of cortical neurons (DeFelipe, 2002
; Fairén et al., 1984
). For experimental reasons, the classification of interneurons may be most readily achieved in mouse cerebral cortex. Although rodent and human cortex are structurally not identical, layers develop from different precursors and interneurons have different origins (Letinic et al., 2002
; Molnár et al., 2006
), the mouse nevertheless offers a powerful model for investigating the molecular mechanisms underlying interneuron diversity (Wonders and Anderson, 2006
; Yuste, 2005
).
Lorente de Nó (1992)
was the first to draw attention to the morphological diversity of neurons in mouse cerebral cortex and used axonal projection patterns to distinguish several dozen types of interneurons. More recent electron microscopic studies have extended Lorente’s observations by demonstrating that different types of interneurons target synapses to different parts of excitatory and inhibitory neurons (Somogyi and Klausberger, 2005
; Somogyi et al., 1998
). Combining intracellular recording, dye filling and staining with antibodies against calcium binding proteins and neuromodulators, numerous studies further showed that morphologically distinct interneurons exhibit different firing patterns and express distinct molecular markers (Cauli et al., 1997
; DeFelipe, 1993
; Gonchar and Burkhalter, 1997
; Gupta et al., 2000
; Kawaguchi and Kubota, 1996, 1997
; Markram et al., 2004
; McCormick et al., 1985
; Wang et al., 2002
). Developmental studies strongly suggest that many of these phenotypes are conceived by precursor cells of the subpallial telencephalon (Marin and Rubenstein, 2001
). For example, it was shown that PV expressing interneurons are born in the medial ganglionic eminence (MGE) and after migrating to cortex, display fast spiking (FS) properties (Butt et al., 2005
; Xu et al., 2004
). A second type of MGE derived interneuron was shown to express SOM and to exhibit non-FS properties characterized by bursts of spikes that accommodate during repetitive firing (Butt et al., 2005
; Miyoshi et al., 2007
). Finally, a third type of interneuron was shown to express CR, but unlike PV and SOM neurons, originated in the caudal ganglionic eminence (CGE) and exhibited non-FS properties that lacks the ability to fire bursts (Butt et al., 2005
; Miyoshi et al., 2007
). These findings demonstrate that staining with antibodies against PV, SOM and CR is a useful tool for classifying distinct types of interneurons in rodent cerebral cortex.
The application of double labeling immunocytochemistry with a large panel of antibodies, which in addition to PV, SOM and CR included VIP, NPY and CCK revealed additional subtypes of interneurons which account for at least ten discrete chemical groups (Gonchar and Burkhalter, 1997
; Kawaguchi and Kubota, 1997
; Miyoshi et al., 2007
). The largest groups express PV, CR and SOM, which were shown in rat frontal and visual cortex to represent three non-overlapping populations (Gonchar and Burkhalter, 1997
; Kubota et al., 1994
). Recent studies in mouse cerebral cortex, however, have shown that CR and SOM are colocalized in a substantial number of interneurons (Miyoshi et al., 2007
; Xu et al., 2006
). This indicates that CR+SOM neurons coexpress molecules found in cells that are born in separate structures, and suggests that during development the chemical phenotypes may not be determined by birth place alone. An important step toward understanding the underlying developmental mechanisms is to assign mature interneurons to specific subpopulations (Miyoshi et al., 2007
). It is particularly important to obtain this information in mouse, because of the advantages this species offers for genetically manipulating inhibitory interneurons. At present, only a few multiple labeling studies have been carried out with a limited number of markers, suggesting that the description of cell types in mouse cortex is incomplete (Miyoshi et al., 2007
; Xu et al., 2006
). To provide a more comprehensive classification scheme of interneurons in mouse visual cortex we have, therefore, used triple immunolabeling with antibodies against PV, CR, SOM, VIP, NPY, CCK, ChAT, nitric oxide synthase (NOS) and calbindin (CB).
Animals
Experiments were performed in primary visual cortex (V1) of newborn (P0), 5-, 13-, 16-, 33-, 150- and 300-day-old C57BL/6J mice. All experimental protocols were approved by the Animal Studies Committee of Washington University and complied with the guidelines recommended with the National Institutes of Health.
Immunohistochemistry
Animals were anesthetized with a mixture of ketamine (86 mg/kg) and xylazine (13 mg/kg) (IP) and perfused through the heart with phosphate buffered saline (pH 7.4, PBS) containing heparin (100 units/ml), followed by a mixture of paraformaldehyde (4%) and glutaraldehyde (0.2%) in PBS. Brains were removed from the skull, postfixed for 2 hours in the same fixative (4°C), washed in PBS and sectioned at 40 μm on a Vibratome. Sections were first treated with sodium borohydride (1% in PBS, 1 hour), next with 50% ethanol (30 minutes), followed by 10% fish gelatin (Sigma, St. Louis, MO; 30 minutes) and finally transferred into primary antibody solution containing PBS and 0.2% Triton X-100. After incubating for 24–60 hours, sections were washed in PBS, treated in blocking buffer (2% fish gelatin) and incubated for 2–4 hours in dilutions of secondary antibody, conjugated to different fluorophores or to biotin. All primary and secondary antibodies (see below) were tested for optimal dilution, the absence of cross-reactivity and non-specific staining by secondary antibodies.
The following primary antibodies were used: (1) rabbit anti-gamma amino butyric acid (GABA; Sigma #A2052, 1:2,000), mouse anti-GABA (Sigma #A0310, 1:4,000), (2) rabbit anti-PV (Swant #PV28, Bellinzona/Switzerland, 1:2,000), mouse anti-PV (Swant #235, 1:2,000) and goat-anti-PV (Swant #PVG214, 1:2,000), (3) rabbit anti-CR (Swant #7699/4, 1:2,000), goat anti-CR (Swant #CG1; 1:1,000) and mouse anti-CR (Swant #6B3, 1:2,000), (4) rat anti-SOM (Chemicon #MAB354, Temecula, CA, 1:1,000) and rabbit anti-SOM (Peninsula #IHC8001, San Carlos, CA, 1:1,000), (5) rabbit anti-CCK (Ab #5135 CURE/UCLA/DDC Antibody RIA Core; 1:1,000) and mouse anti-CCK/Gastrin (#9303, CURE/UCLA/DDC Antibody/RIA Core; 1:1,000), (6) rabbit anti-VIP (Chemicon #AB982, 1:1,000) and mouse anti-VIP (Biogenesis #9535-0504, Brentwood, NH; 1:2,000–1:4,000), (7) rabbit anti-NPY (Incstar, Stillwater, MN; 1:2,000), (8) rabbit anti-NOS (Chemicon #AB1552, 1:500) and mouse anti-NOS (Alexis, San Diego, CA; ALX804-029, 1:50), (9) goat anti-ChAT (Chemicon #AB144P, 1:2,000) and (10) rabbit anti-CB (Swant D28, 1:1,000). According to the data sheets provided by the suppliers, all of the antibodies were tested for specificity and were found to have no detectable cross-reactivity with any of the molecules which we probed in our colocalization experiments. In addition, the specificity of the rabbit anti-PV and rat anti-SOM antibodies was confirmed by immunoabsorption tests done by Xu et al. (2006)
.
The secondary antibodies were: (1) donkey anti-goat (conjugated to Cy2 and Cy3, 1:500, Jackson ImmunoResearch, West Grove, PA), (2) donkey anti-rabbit (Cy3, Chemicon, 1:500; Cy5, Jackson, 1:500), (3) goat anti-rabbit (Cy2, Amersham, Arlington Heights, IL, 1:400; FITC, Chemicon, 1:200; biotinylated, Vector, Burlingame, CA, 1:200), (4) goat anti-mouse (Cy2, Jackson, 1:500), (5) donkey anti-mouse (Cy3, Cy5 Jackson, 1:500), (6) goat anti-rat (Cy2, Jackson, 1:500), and (7) donkey anti-rat (Cy3, Jackson, 1:500). Biotinylated secondary antibodies were visualized with avidin neutralite Oregon Green or avidin neutralite Texas Red (both from Invitrogen, Carlsbad, CA, 1:500)
Stained sections were mounted on glass slides, air-dried, dehydrated in ethanol, cleared in xylenes and coverslipped with Krystalon (Harleco, Gibbstown, NJ). For visualization of cortical layers and the V1 border, mounted sections were counterstained with an aqueous solution of 0.001% bisbenzimide (Sigma).
Microscopy and Data Analysis
Qualitative analyses of single, double and triple immunolabeled neurons and their laminar distributions were performed under a Nikon Eclipse 80i fluorescence microscope equipped with filter cubes for blue bisbenzimide, green Cy2/FITC, red Cy3/Texas Red and infrared Cy5 fluorescence. High numerical aperture 20× and 40× Plan Fluor Nikon objectives were used to assess coexpression of multiple labels. For illustration purposes stacks of images were taken at 0.25 μm intervals with a Biorad (MRC-1024ES) or an Olympus FX500 confocal microscope. Confocal images were assembled using MetaMorph 6.1 (Molecular Devices) and Adobe Photoshop 9.0 software to make linear adjustments of contrast and brightness.
The goal of our quantitative analyses was to determine the percentage of different subtypes of GABAergic neurons in the total population of GABAergic cells. For this purpose we first determined the extent to which calcium binding proteins and neuromodulatory markers were colocalized with GABA. This comparison liberated us from performing GABA immunolabeling in every multiple-marker experiment and provided a correction factor for calculating percentages of marker(s) expression in the total population of GABAergic neurons when coexpression of GABA with a given marker was incomplete (i.e., <100%). We then determined the number of GABA-expressing and the number of single/multiple calcium binding protein/neuromodulator-expressing neurons in 1 mm3 of V1 at different ages (i.e., P0, P5, P13, P16, P33, P300), and computed the percentage of marker-expressing cells in the total population of GABAergic neurons. Immunolabeled sections were quantitatively analyzed with a Nikon E800 fluorescence microscope equipped with a motorized stage and a color CCD camera (Microfire A/R, Optronics), which were controlled by Stereo Investigator 7.0 software (MicroBrightField, Williston, VT). For unbiased counting of single, double and triple labeled neurons we used the optical disector method with which we scored the number of new cells that come into view as we focused through a 40 μm thick section (West et al., 1991
). In each section, layers and V1 borders were outlined using distinctive cytoarchitectonic features identified by bisbenzimide counterstaining. Immunolabeled V1 neurons were sampled in at least ten 150 × 150 μm counting frames, whose locations were distributed in systematic random order. The counting rules for sampling within a frame were defined by the Stereo Investigator 7.0 software. Sampling across the full extent of V1 was performed in maximally 20 sections/animal, which were spaced 120 μm apart. The same counting rules were applied to all sections of a single animal, but the number of sections and the number of counting frames differed between animals, owing to differences in brain size (developing vs mature) and variable staining intensity. The optimal number of counting frames was determined by computing the Scheaffer coefficient of error (CE), which estimates the variance of the mean number of cells per counting frame from the true mean (Glaser and Wilson, 1998
). For many marker combinations we found that sampling of ten counting frames resulted in CE values of <0.1, indicating that the mean number of cells per counting frame was a significant representation of the distribution in the entire population. Some marker combinations were rare, making it challenging to achieve small CE values without sampling unreasonably large numbers (>20) of frames and sections (>25). In these cases, it remained undetermined whether the density of labeled neurons in the sample was a statistically significant reflection of the density in the population (i.e., whether the labeled cells represent a distinct subtype of GABAergic neuron) or whether the particular combination of markers was due to the limited sensitivity of the experimental methods.
To test whether the number of cells in each section was normally distributed, the data were fitted with a Gaussian function. Analyses of laminar distributions and developmental changes in the percentages of different cell types were assessed using ANOVA and the post hoc Fisher’s test to determine significant differences between specific groups.
Calcium Binding Proteins and Neuromodulators are Specifically Expressed in GABAergic Neurons
We have found that in V1 of adult (>90 day old) mice, PV, CR, SOM, VIP, NPY, CCK, NOS and ChAT label almost exclusively nonpyramidal neurons. All of the antibodies produced reproducible labeling of cell bodies, but labeling of dendrites was not extensive enough to provide adequate descriptions of the dendritic morphologies. Double labeling experiments with each of these markers and antibodies against GABA have shown that >95% of these interneurons are GABAergic (Figure 1
; Table 1
). PV neurons represented the largest group and accounted for 39% of GABAergic neurons contained in 1 mm3 of cortex (Table 2
). The CR and SOM groups were smaller and represented 24% and 23% of GABAergic cells, respectively (Table 2
). The next smaller groups expressed VIP (11%), NPY (8%) and CCK (5%), whereas ChAT and NOS accounted for only about 1% of GABAergic neurons (Table 2
). It is important to note that these percentages add up to more than 100%, suggesting that individual neurons express multiple substances and that the same neurons were counted more than once (see below).
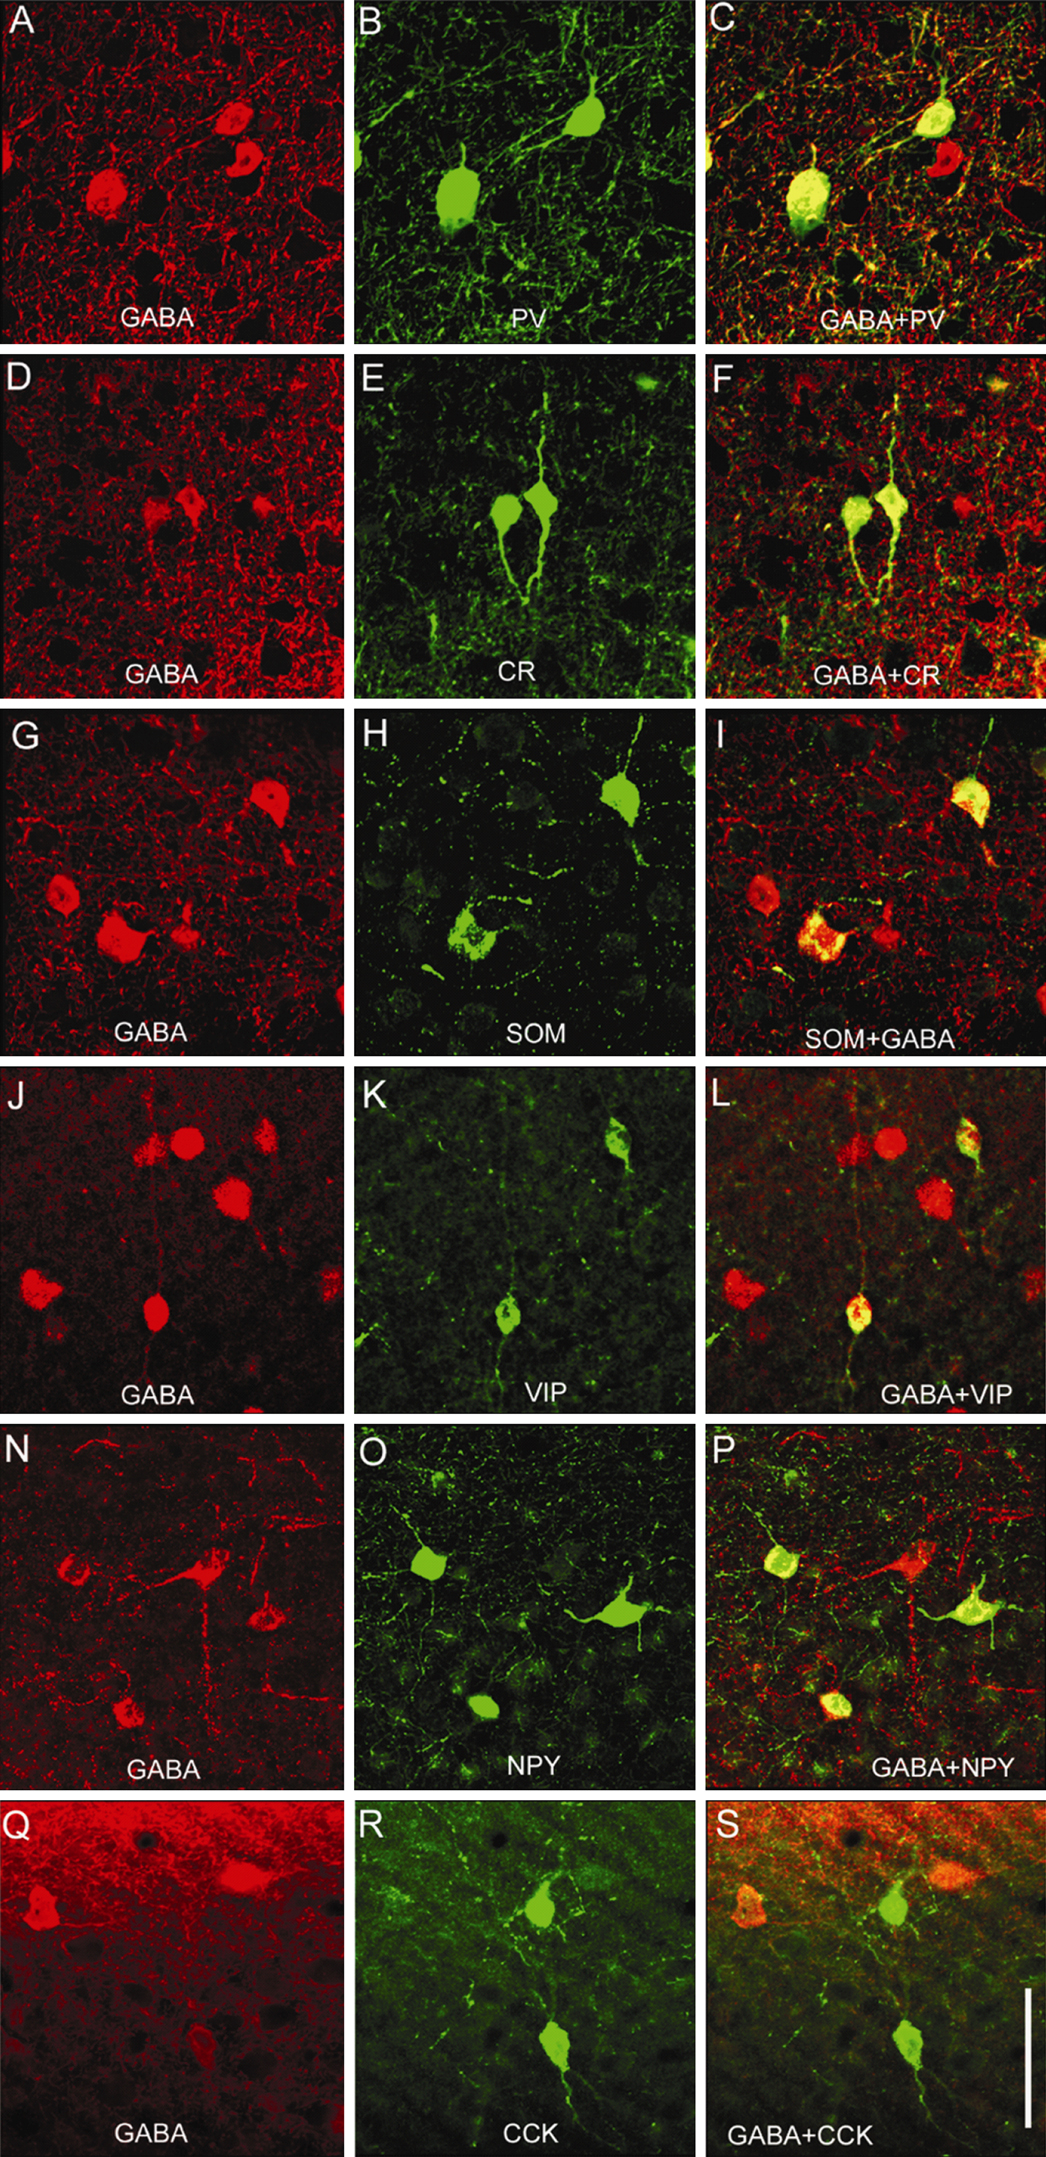
Figure 1. Expression of calcium binding proteins and neuromodulatory peptides in GABAergic neurons of adult mouse primary visual cortex (V1). Double immunolabeling of coronal sections through V1 showing that PV, CR, SOM, VIP, NPY and CCK is expressed in GABAergic neurons. Each of these markers labels only a subset of GABAergic neurons. (A–C) Colocalization of GABA and PV. (D–F) Colocalization of GABA and CR. (G–I) Colocalization of GABA and SOM. (J–L) Colocalization of GABA and VIP. (N–P) Colocalization of GABA and NPY. (Q–S) Colocalization of GABA and CCK. Scale: 25 μm.
In different layers the various groups of interneurons accounted for different percentages of GABAergic neurons. The largest group in layer 1 was represented by CR neurons (Table 2
). All of the other groups were much smaller or were absent from layer 1 (e.g., PV, NOS, ChAT) (Table 2
). Interestingly, CR, SOM, VIP, NPY and CCK neurons accounted for only 34% of GABAergic neurons in layer 1, suggesting that two thirds of GABAergic neurons in this layer were not labeled by any of the markers we have used and are therefore considered to be chemically distinct. In layer 2/3, PV neurons tended to represent a smaller percentage of GABAergic neurons than in deep layers, although the difference was not statistically significant (Table 2
). The opposite trend was found for CR, VIP and ChAT neurons, which in superficial layers accounted for larger proportions of GABAergic neurons than in deep layers (Table 2
). However, only CR neurons showed a significant (p < 0.03) difference between upper and lower layers. Finally, SOM, NPY, CCK and NOS represented similar percentages of GABAergic neurons in layers 2/3–6 (Table 2
).
Previous studies suggest that interneuron progenitor birth date correlates with laminar location (Anderson et al., 2002
; Miller, 1986
; Valcanis and Tan, 2003
). Thus, it was interesting to ask how the percentages of cells within a group are distributed across different layers. Figure 2
shows that the majority of CR, VIP, ChAT and CCK neurons were located in layer 2/3 and that these cells were significantly (p < 0.01 for comparisons of markers in layer 2/3 with markers in layers 5 and 6) less abundant in middle and deep layers. In contrast, SOM, PV and NPY neurons were distributed more evenly across superficial and deep layers (Figure 2
). NOS neurons differed from all the others in that they tended to be more abundant in deep than in superficial layers, however statistical significance (p < 0.05) was only reached between layer 2/3 and 6 (Figure 2
).
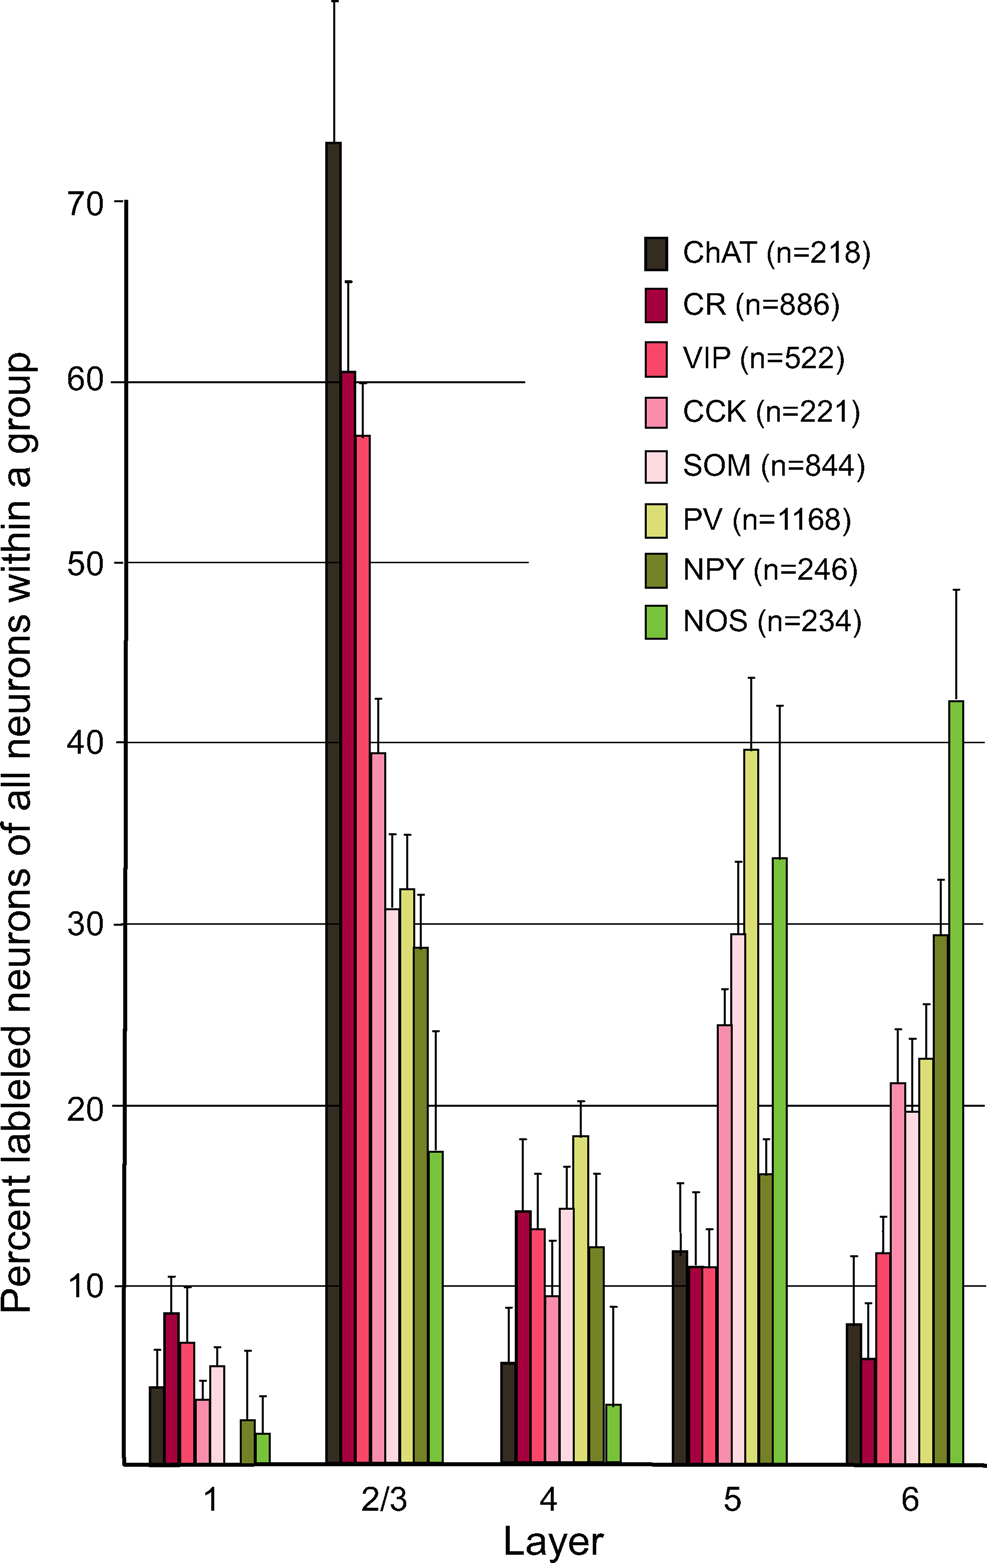
Figure 2. Laminar distribution of interneuron markers. Laminar distribution of PV, CR, SOM, VIP, NPY, CCK, NOS and ChAT immunolabeled neurons in adult mouse primary visual cortex. Y-axis represents mean ± SEM percent of all neurons labeled with the same antibody.
PV Neurons Lack CR, SOM, VIP, CCK, NPY and ChAT Immunoreactivity
To study whether PV neurons coexpress additional substances we used triple immunostaining with various combinations of antibodies against PV, CR, SOM, VIP, NPY, CCK, NOS and ChAT. Although we found that CR, SOM, VIP, NPY, CCK, NOS and ChAT were expressed in several different combinations, none of these substances overlapped with PV. This is demonstrated in Figures 3
A–E, which show that PV neurons lacked CR and SOM immunoreactivity. The absence of CR and SOM was confirmed in a population of 468 PV neurons. Conversely, we found that none of the 386 CR and 354 SOM neurons expressed PV. Triple staining with antibodies against PV, VIP and NPY further revealed that PV neurons also lacked VIP (0/267) and NPY (0/221), and that conversely PV was absent from VIP (0/247) and NPY (0/145) neurons (Figure 4
A). Finally, we found that PV neurons lacked CCK (0/114), ChAT (0/96) and NOS (0/75), and that conversely CCK, ChAT and NOS neurons did not express PV. Thus, based on PV, CR, SOM, VIP, NPY, CCK, NOS and ChAT expression, GABAergic neurons are subdivided into a group of PV-positive and a group of PV-negative neurons.
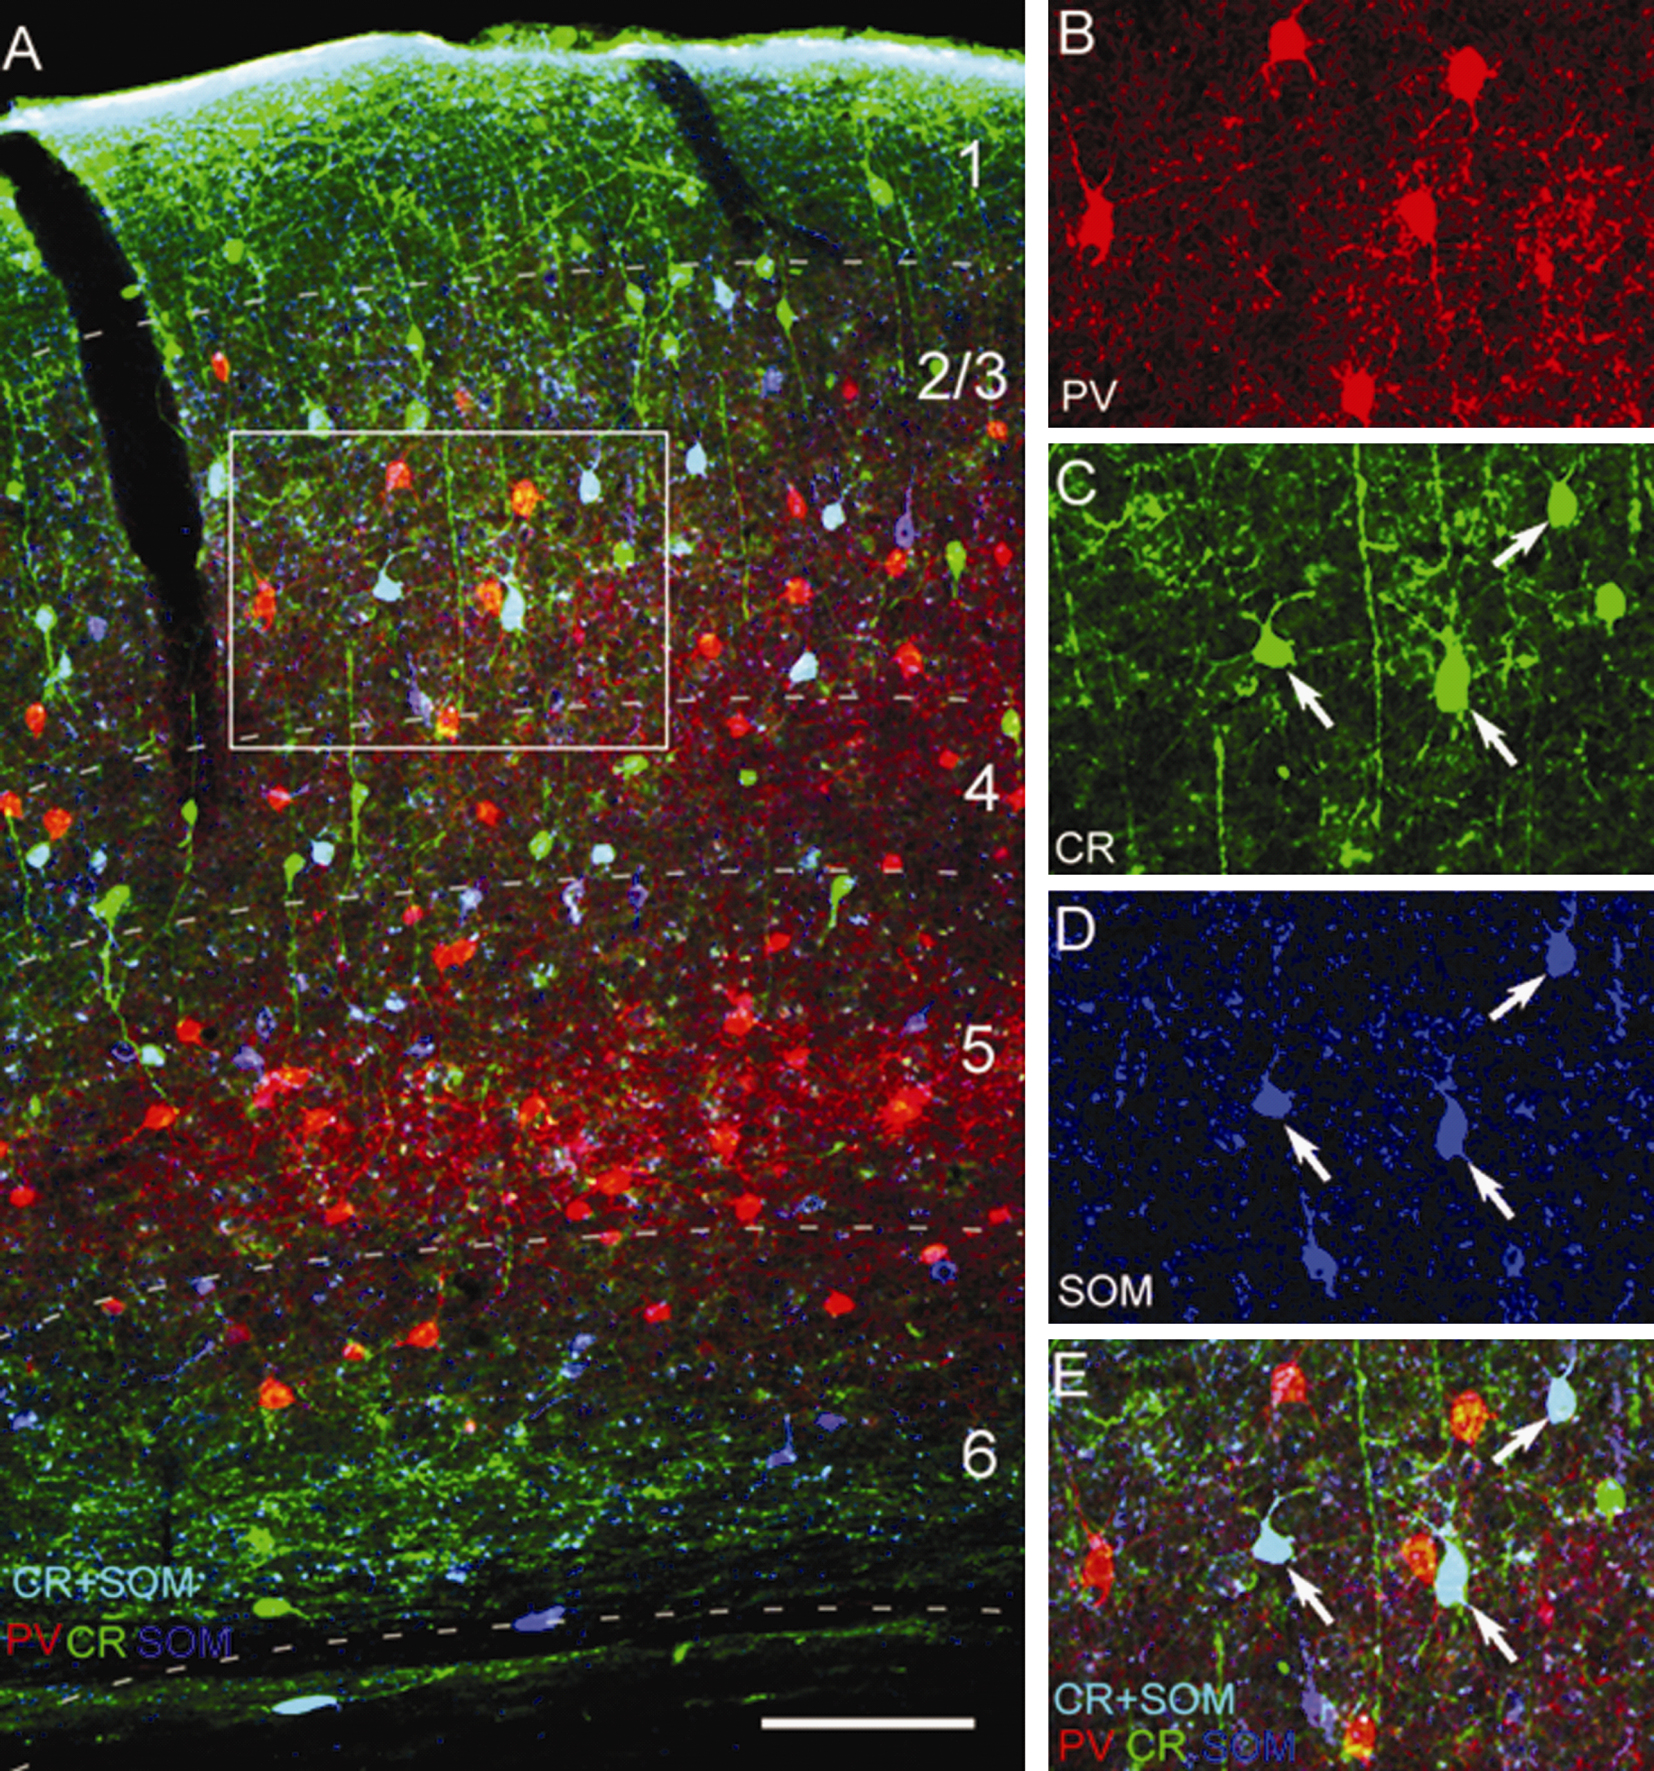
Figure 3. Triple immunolabeling with antibodies against PV, CR and SOM in adult mouse visual cortex. (A) Expression of PV (red), CR (green) and SOM (dark blue, represents false color image of infrared fluorescence) in coronal section through V1. Neurons that colocalize CR + SOM appear light blue. (B–E), Magnified images of boxed area in (A) showing immunolabeling of PV (B, E), CR (C, E), SOM (D, E) and coexpression of CR + SOM (E). Notice that PV neurons do not express CR and SOM. Scale: 100 μm.
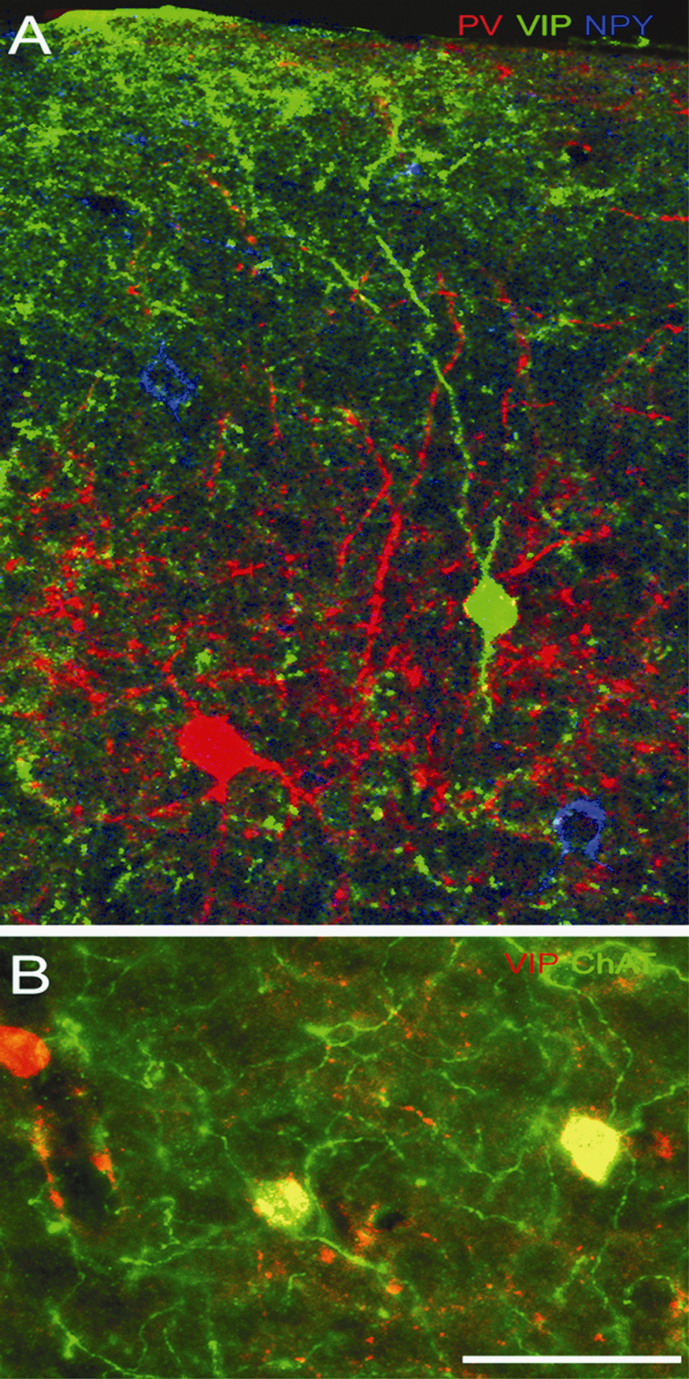
Figure 4. Triple immunolabeling with antibodies against PV, VIP, NPY and ChAT in adult mouse visual cortex. (A) Coronal section through superficial layers of V1, showing expression of PV (red), VIP (green) and NPY (blue) in separate populations of neurons. (B) VIP and ChAT expression in layer 2/3 of V1. All ChAT immunoreactive neurons express VIP (yellow), but ChAT is present only in subset of VIP neurons. Scale: 25 μm.
Double labeling studies with antibodies against CB, however, revealed that PV-positive neurons are heterogeneous. Although PV+CB expression was rare, we found that CB was contained in at least 4% (5/100) of PV neurons (Figures 5
A,C,D). The stainings further showed that CB was expressed in 9% (8/89) of CR and in 62% (62/101) of SOM neurons (Figures 5
B–D). It is important to note, however, that CB was not exclusively expressed by GABAergic neurons but was also found in pyramidal neurons which make interareal connections (data not shown).
PV-Negative Neurons Fall into Numerous Discrete Subgroups
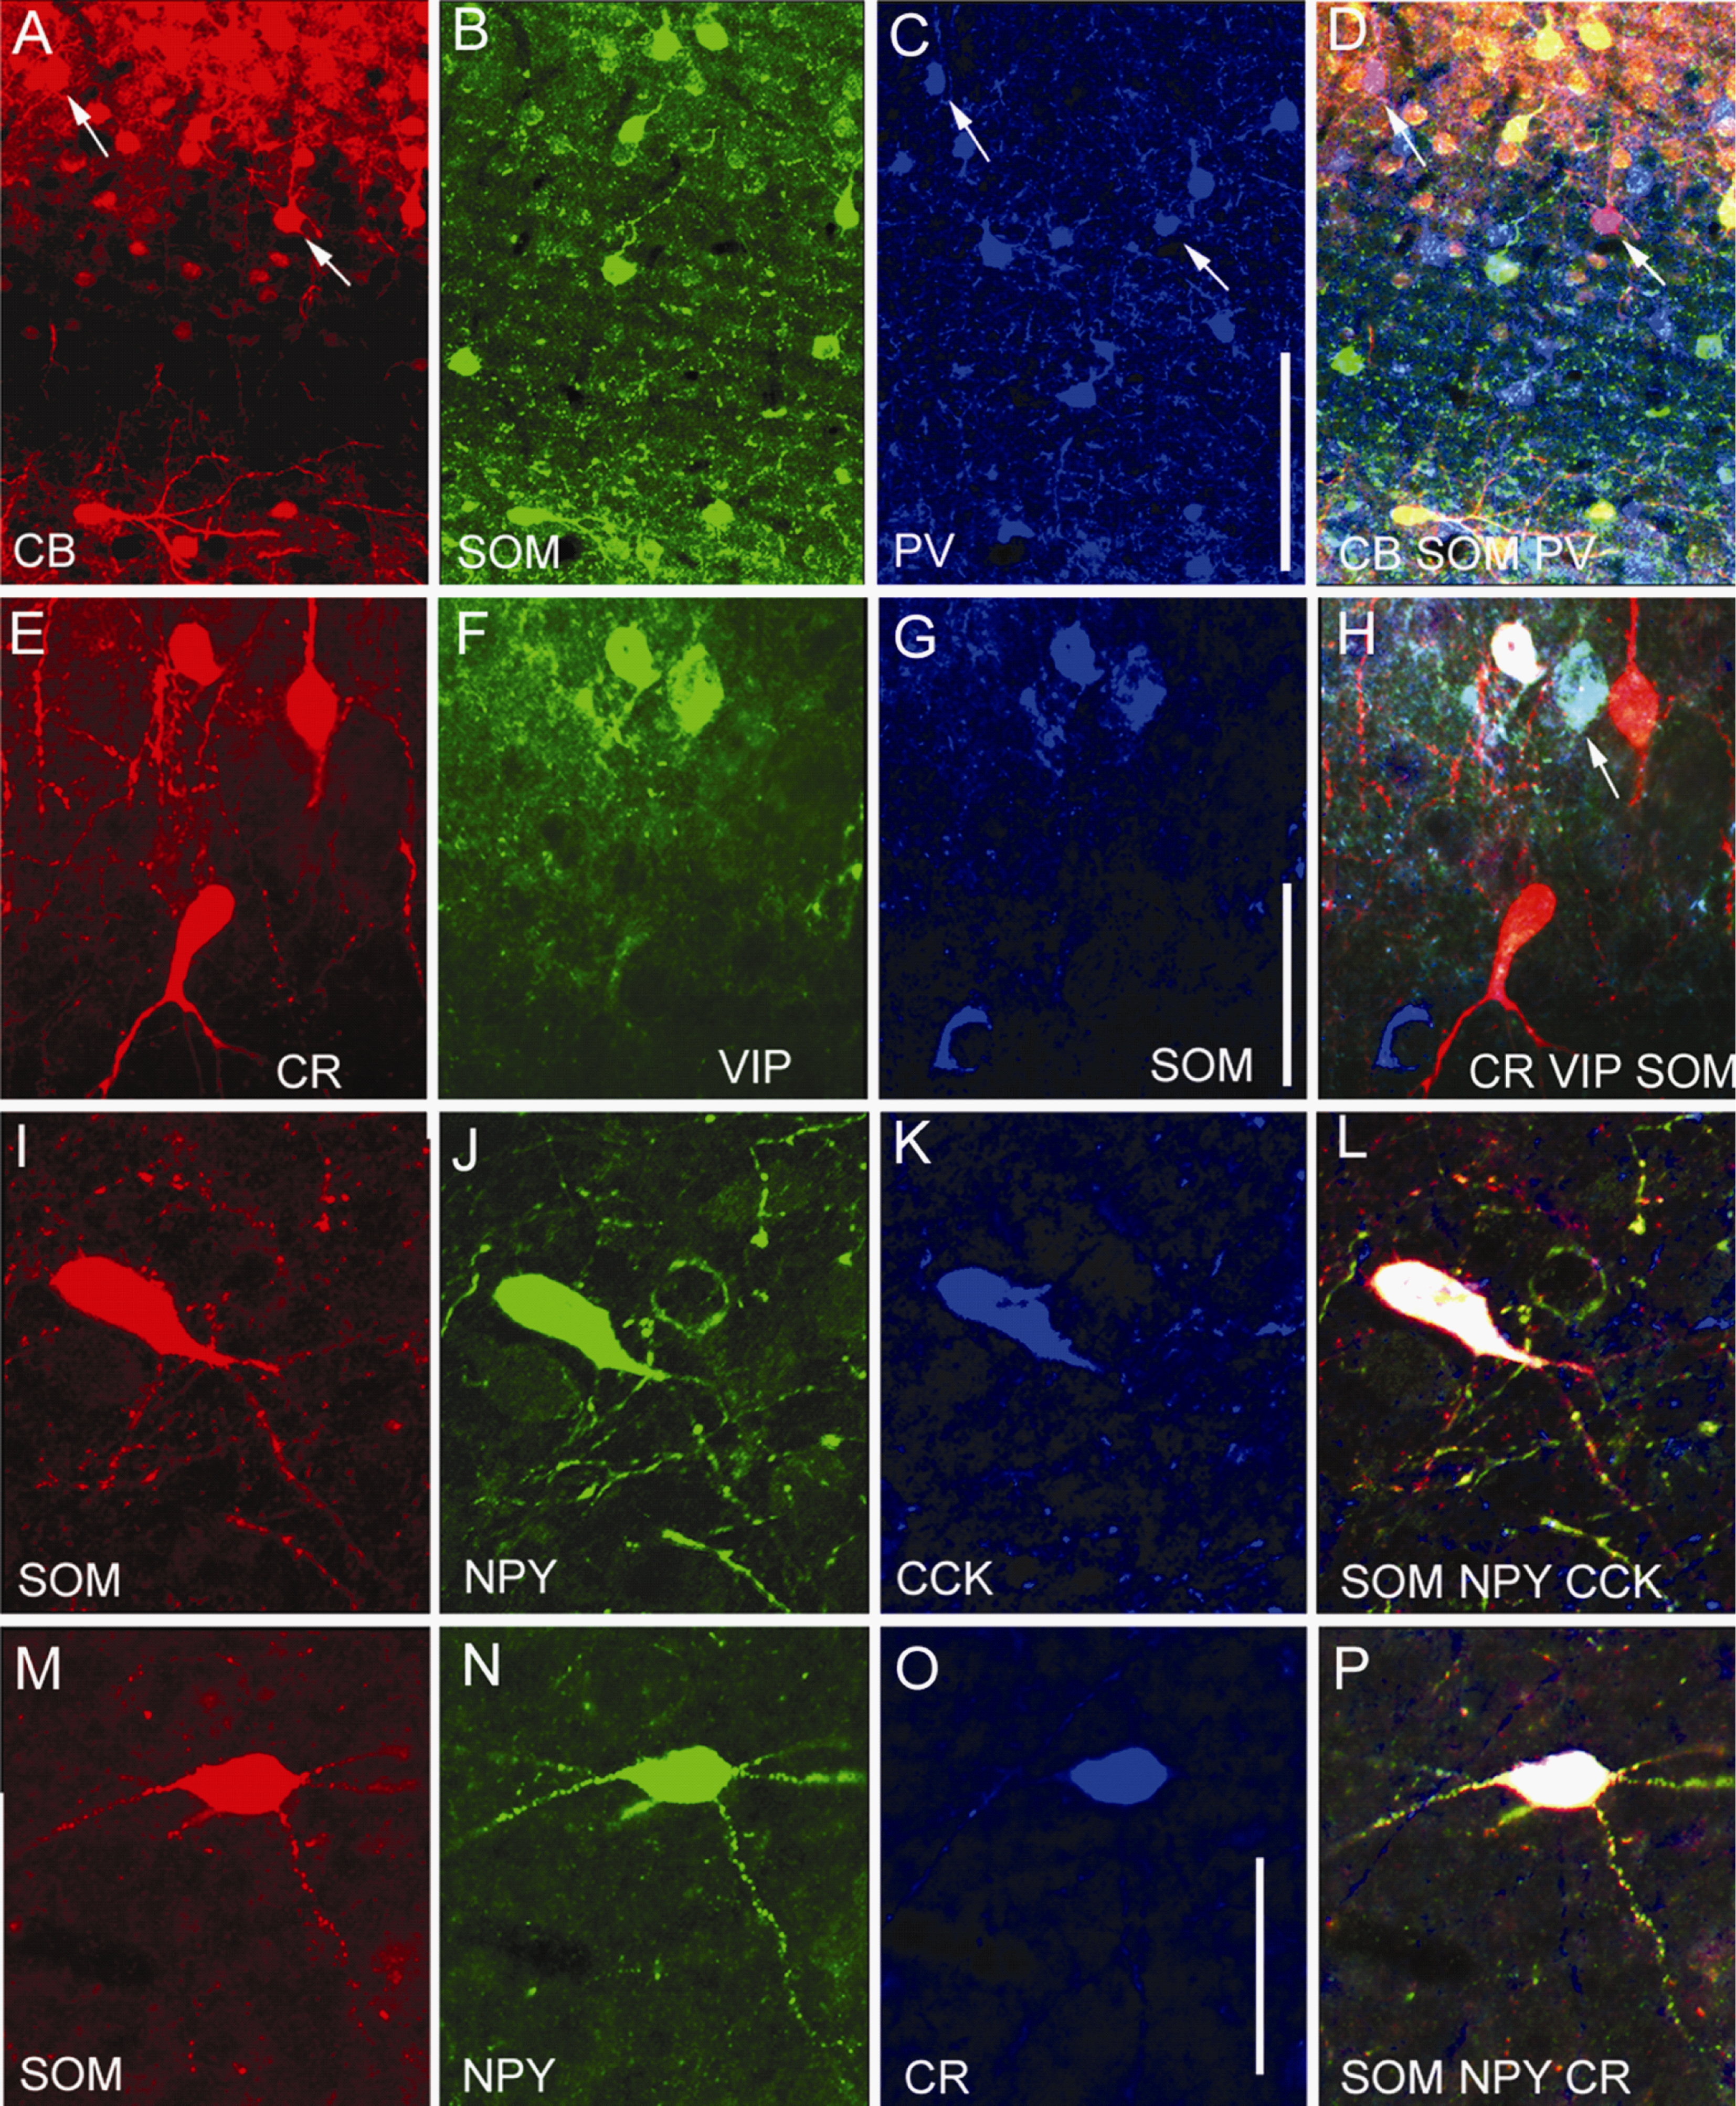
Figure 5. Triple immunolabeling with antibodies against calcium binding proteins and peptides in interneurons of coronal sections through adult mouse visual cortex. (A–D) Expression of calbindin (CB), SOM and PV. CB is colocalized in subset of PV (pink cells in D indicated by arrows in C and D) and SOM neurons (yellow cells in D). (E–H) Expression of CR, VIP and SOM. Colocalization of CR + VIP + SOM (white cell in H) and VIP + SOM (light blue cell in H) in subset of interneurons. (I–L) Expression of SOM, NPY and CCK. Colocalization of SOM + NPY + CCK (L). (M–P) Expression of SOM, NPY and CR. Colocalization of SOM + NPY + CR (P). Scales: 100 μm (A–D), 25 μm (E–L), 20 μm (M–P).
To study the coexpression patterns within the group of PV-negative neurons we have used antibodies against CR, SOM, VIP, NPY, CCK, NOS and ChAT in many different combinations of double and triple labeling experiments. Although each expression pattern was analyzed in at least three different mice in maximally 20 sections (distributed across the full extent of V1) and in 10 counting frames/section, we found that many marker combinations were rare (e.g., SOM+NPY+CCK; Figures 5
I–L), but normally distributed across sections. In fact, although a specific marker combination was observed multiple times (i.e., 162 for SOM + NPY + CCK; Table 3
), many expression patterns failed to achieve statistical significance (Scheaffer correlation coefficient >0.1) despite all reasonable attempts to increase the density of unbiased sampling (i.e., increased number of counting frames and number of sections), indicating that the mean counts in the sample were not accurate representations of the mean in the population. This suggests that, although we were able to detect specific coexpression patters, we were unable to determine with confidence the abundance of these cells. Thus, based on this criterion we consider 18 observed combinations of markers to be associations by chance (Table 3
, indicated in regular type), due to nonspecific labeling and/or misalignment of markers. However, for 12 marker combinations, which in Table 3
are indicated in bold type, the mean of the sample was a significant (Scheaffer correlation coefficient <0.1) representation of the mean distribution in the population, suggesting that they represent distinct subtypes of GABAergic neurons.
Analyses of triple labeled sections showed that neurons, which contained only a single maker were quite rare, but nevertheless formed significant groups. Most GABAergic CR, SOM, NPY, VIP, CCK, NOS and ChAT neurons, however, expressed at least one additional marker and a small number of cells colocalized as many as 3 substances (Table 3
). CR neurons fell into 7 significant groups (Table 3
). The largest expressed CR + SOM (Figures 3
C–E) and accounted for 12% of the mean number of GABAergic neurons across all layers of V1 and for about 25% of all CR and SOM neurons (Table 3
). The 4 mid-sized groups (Table 3
) contained, only CR, CR + NPY (Figures 5
N–O), CR + VIP (Figures 5
A,F,H) and CR + SOM + VIP (Figures 5
E–H), whereas the 2 smallest groups (Table 3
) coexpressed CR + CCK and CR + SOM + NPY (Figures 5
M–P). Observations in triple labeled sections further revealed significant groups of SOM-only, SOM + VIP (Figures 5
F–H) and CR + SOM neurons (Table 3
). About 3% of GABAergic cells expressed VIP + ChAT (Figure 4
B, Figure 3
). Although ChAT was absent in a substantial number of VIP neurons, it is important to note that all of the ChAT neurons expressed VIP and were GABA immunoreactive (Figure 4
B). Finally, we found a small (1.5%) group of neurons, which contained CCK + NPY (Figures 5
J–L; Table 3
). Importantly, we found no overlap between VIP and NPY (Figure 4
A, Table 3
).
CR + SOM Population Increases During Postnatal Development
Double labeling experiments in adult mouse V1 showed that 35% of CR neurons expressed SOM and conversely 37% of SOM cells expressed CR (Table 3
). This differs from rat visual cortex where CR and SOM neurons represent non-overlapping populations (Gonchar and Burkhalter, 1997
). Recently, it was shown that in mice CR and SOM neurons are generated from different embryonic structures (Butt et al., 2005
; Xu et al., 2004
). Thus, it was interesting to ask at what stage during postnatal development the CR + SOM phenotype emerges.
Observations at P0 revealed that the majority of GABAergic neurons did not express CR, SOM and PV (Figures 6 and 7
). Of the three markers, CR was most abundant, whereas SOM neurons were rare and CR + SOM and PV expressing neurons were absent. CR expressing GABAergic neurons were most numerous in layer 1 and in the cortical plate. In both structures, CR neurons accounted for roughly 25–30% of all GABAergic cells (Figure 7
). Interestingly, in newborn mice a substantial percentage of CR neurons in layer 1 (65%, 120/185) and in the cortical plate (39%, 78/201) were not GABA immunoreactive.
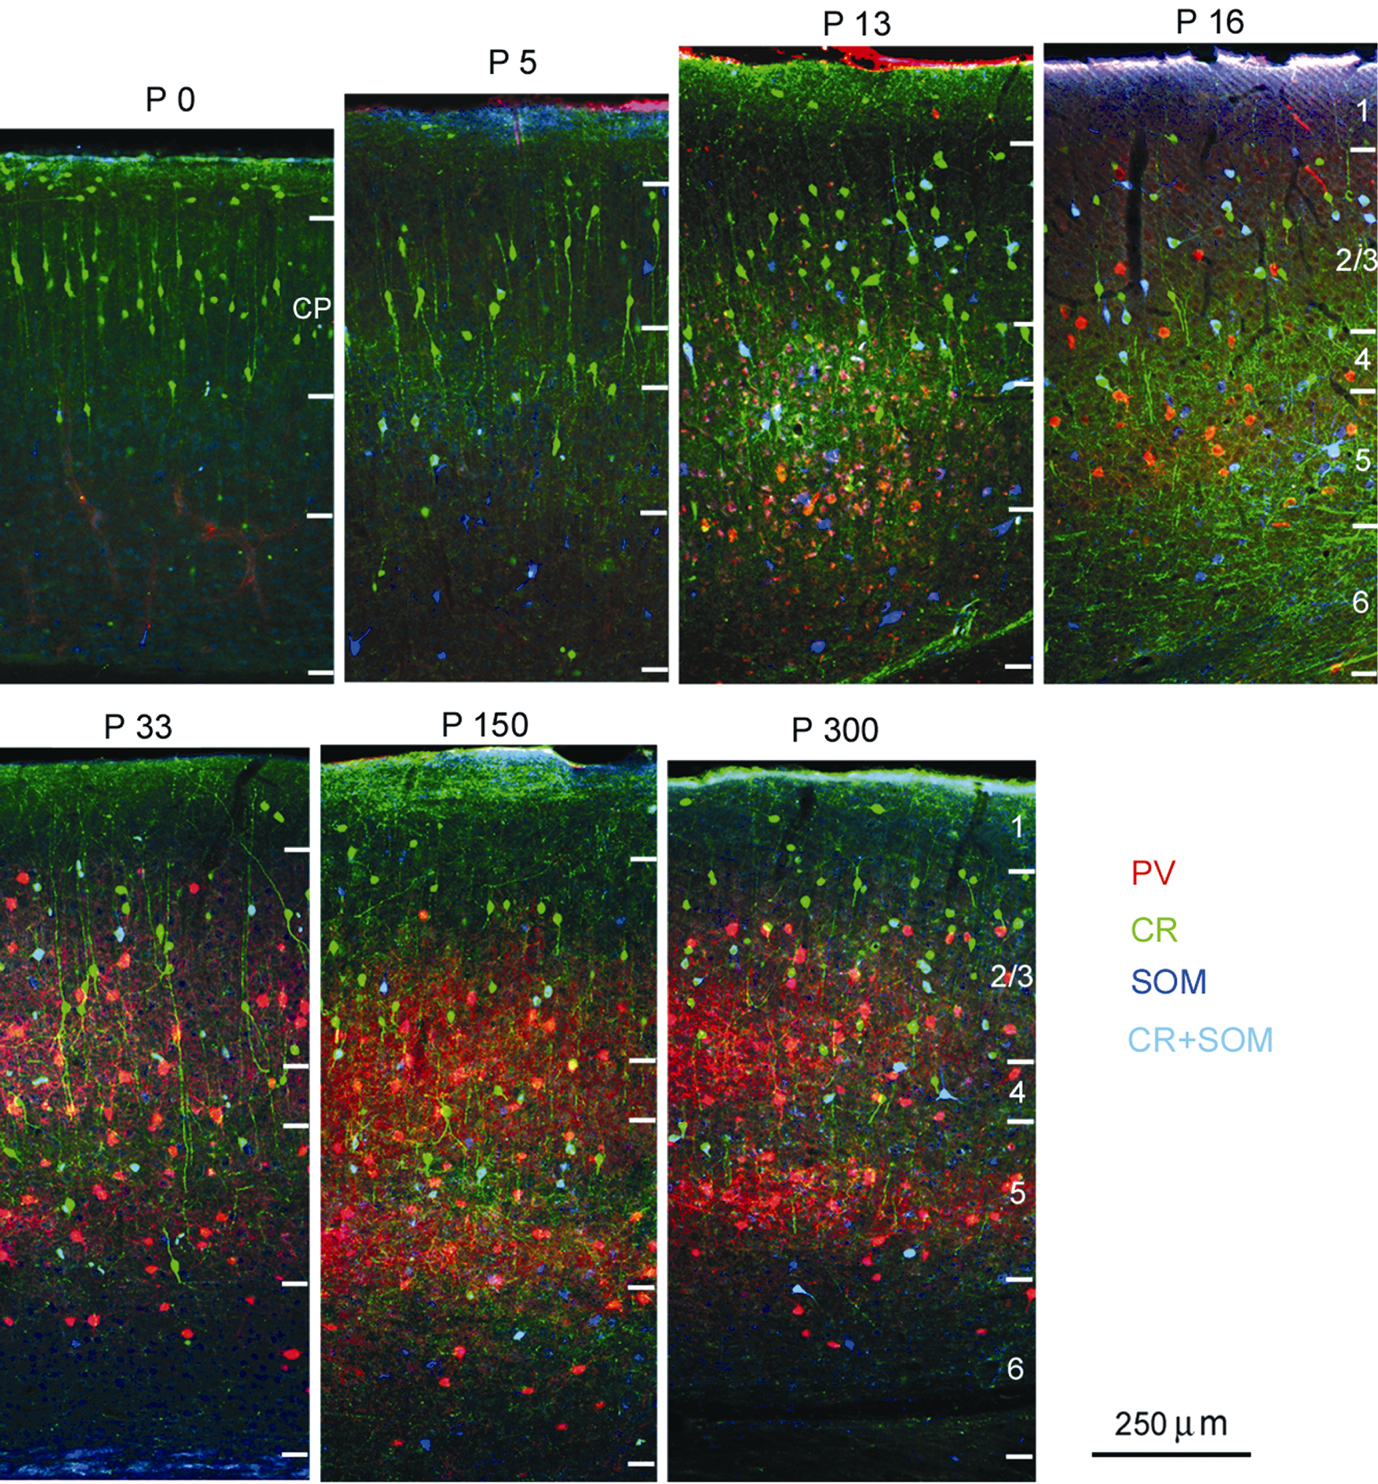
Figure 6. Triple immunolabeling with antibodies against PV, CR and SOM in coronal sections of developing mouse visual cortex. P0 indicates day of birth. P13 represents the day before eye opening. P16 corresponds to the second day after eye opening. CR expression is present at birth. SOM expression emerges at ~P5. CR + SOM coexpression (light blue) is present from the onset of SOM expression. PV expression emerges at ~P13.
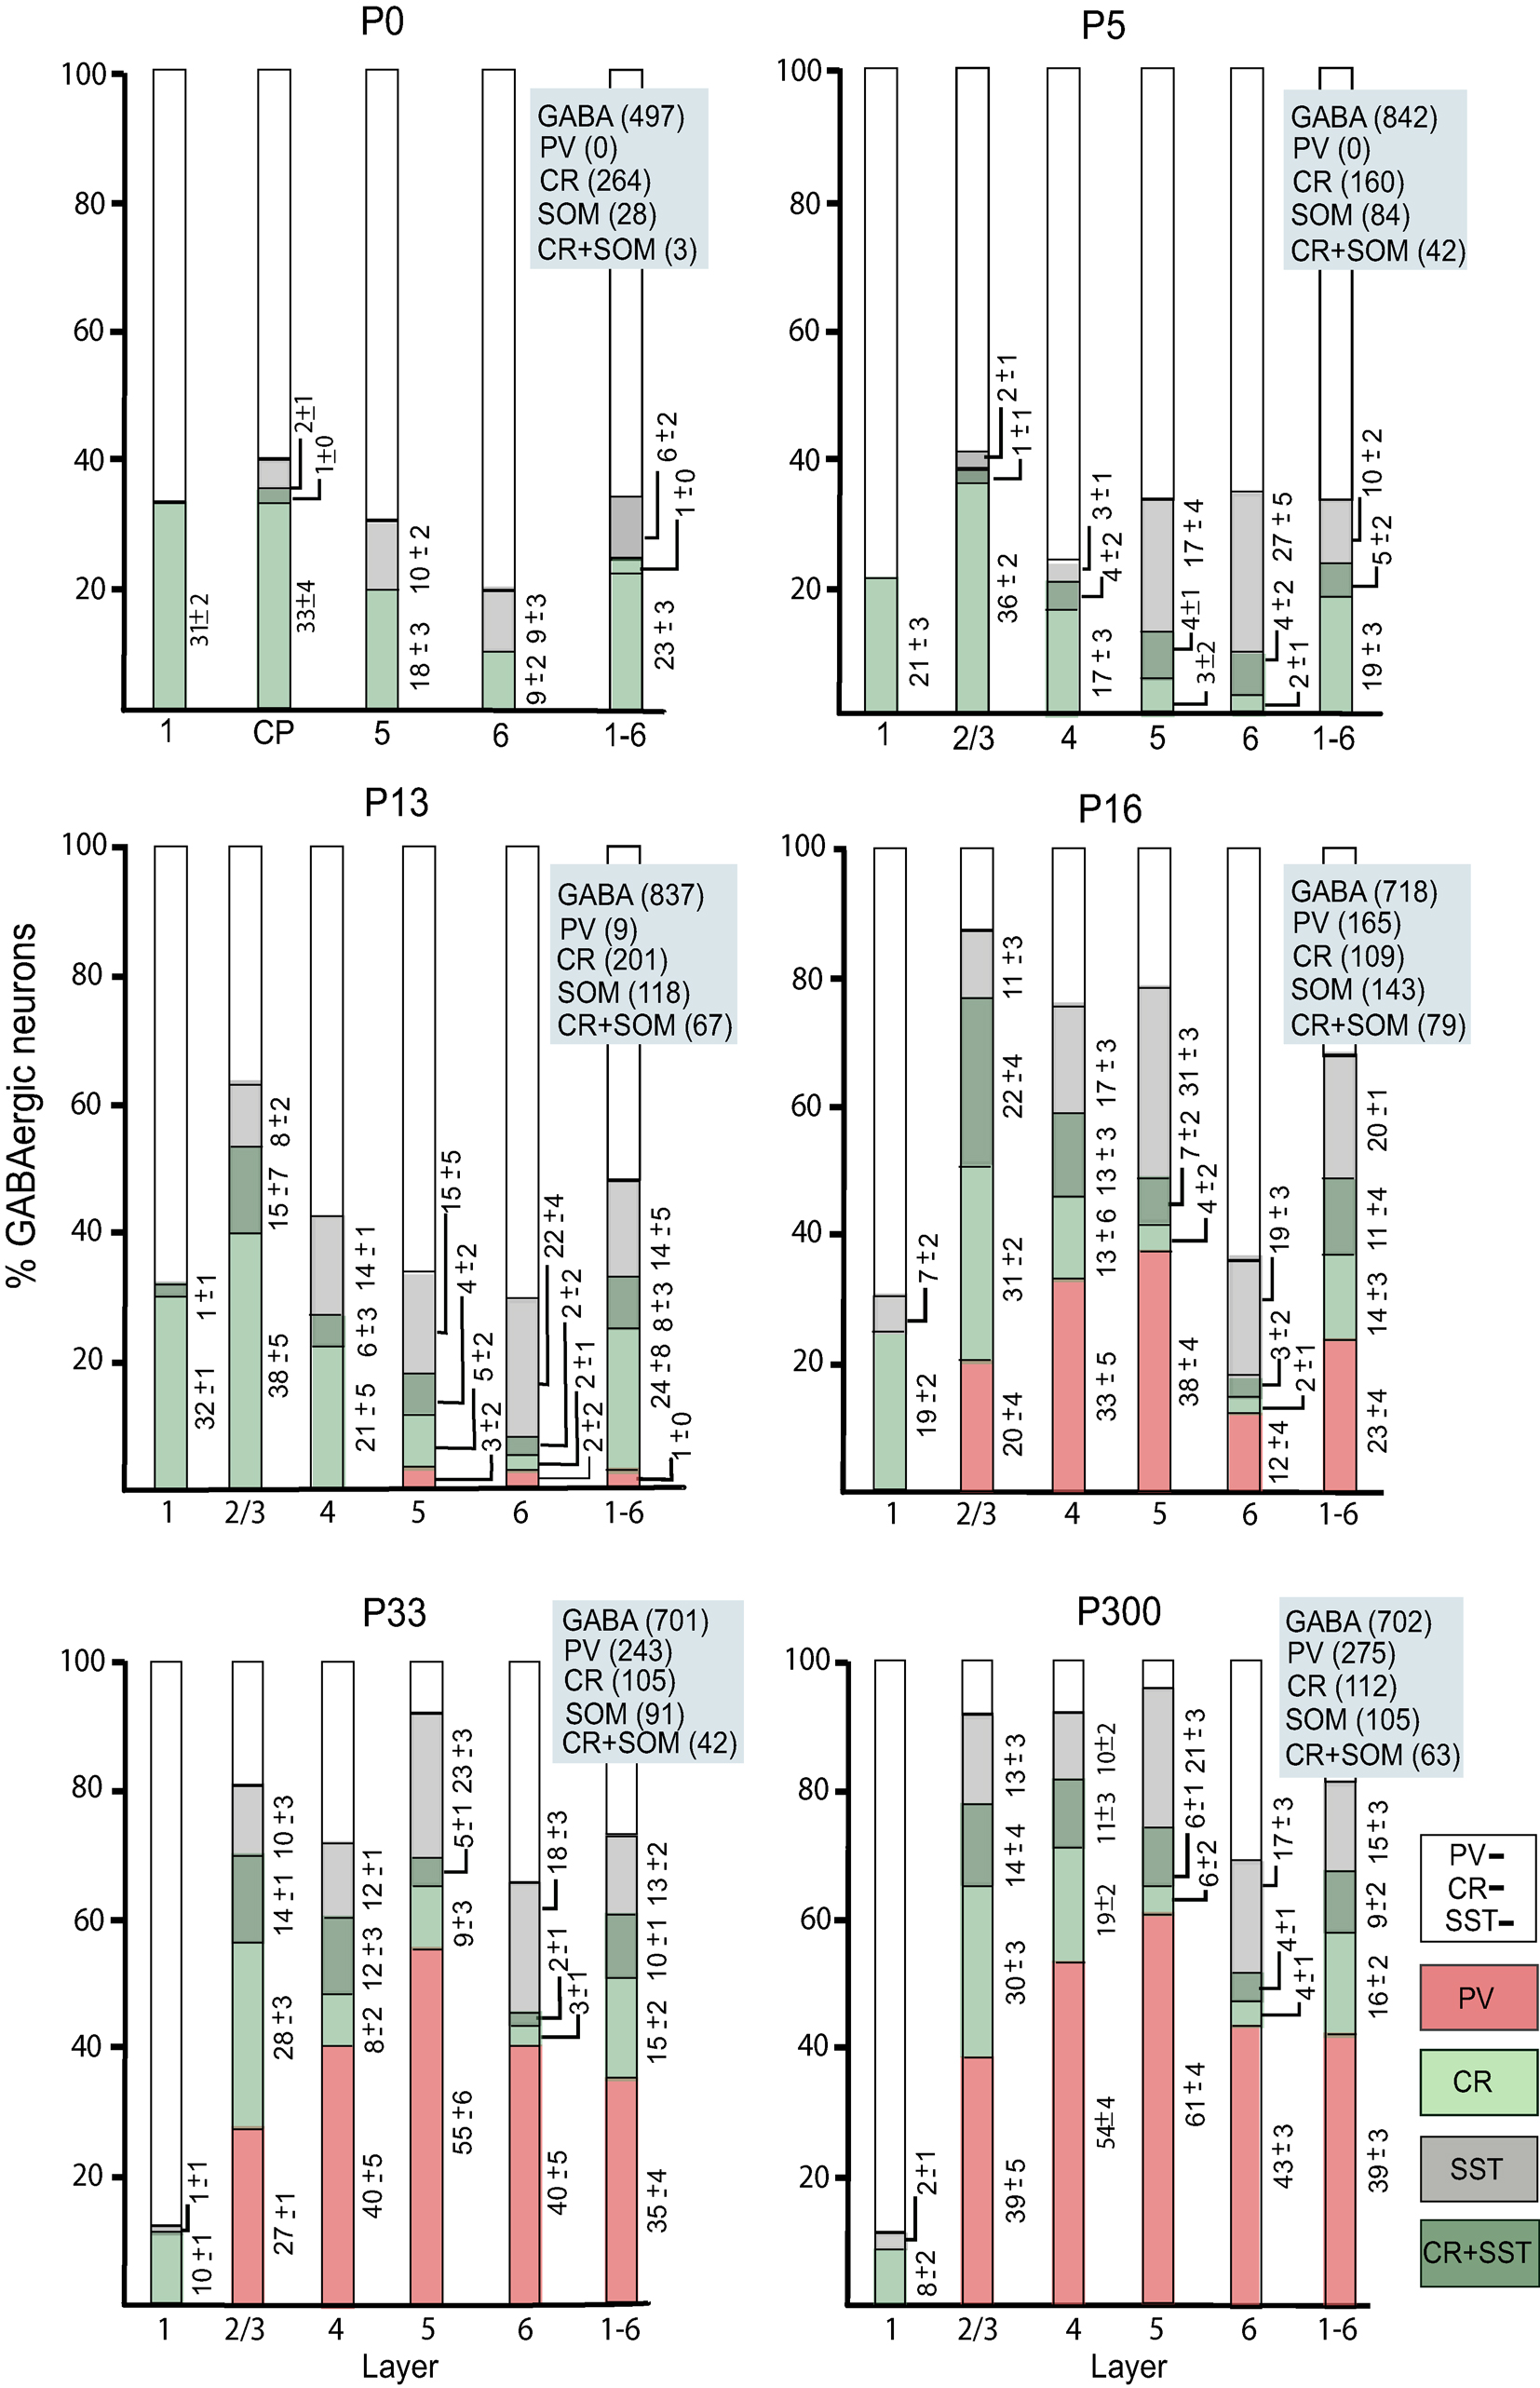
Figure 7. Percentage of PV, CR, SOM and CR + SOM neurons in population of GABAergic neurons across postnatal development of mouse visual cortex. Columns represent percentages of CR, SOM, PV and CR + SOM immunolabeled neurons in the total population of GABAergic neurons in different layers and at different postnatal ages. Numbers represent mean ± SEM percentages of each cell type in the population of GABAergic neurons across different sections and animals. The blue boxes contain the total number of cells counted for each marker. CP: cortical plate.
At P5, the overall expression pattern differed very little from that observed in newborn mice and showed that the majority of GABAergic neurons lacked CR, SOM and PV (Figures 6 and 7
). At this stage, non-GABAergic CR neurons have largely disappeared and accounted for a mere 3% (3/97) of the CR population in layers 1–6, which confirms previous observations by del Rio et al. (1995)
. Of the GABAergic neurons in layer 2/3 the largest group expressed CR (Figure 7
). In deep layers the percentage of CR neurons was much smaller. The opposite laminar distribution was observed for SOM neurons, which were more abundant in deep than in superficial layers. This distribution emerged between P0 and P5 and is due to a significant (p < 0.05) increase of the percentage of SOM neurons in deep layers (Figures 6 and 7
). In parallel with the proliferation of SOM neurons, we found a sudden appearance of neurons that coexpressed CR + SOM. Interestingly, the percentage of CR-only neurons remained constant, suggesting that CR + SOM expression is not due to the acquisition of SOM by more mature CR neurons but appears to reflect heterogeneity within the population of emerging SOM neurons.
At P13, shortly before eye opening, most GABAergic neurons expressed CR and SOM and for the first time we observed PV immunoreactive neurons in deep layers (Figure 7
). In layers 2/3 and 4 the percentage of SOM neurons was significantly (p < 0.05) increased compared to P5, and in parallel we observed a significantly larger (p < 0.01) percentage of neurons that coexpressed CR + SOM (Figure 7
). Most interestingly, the percentage of CR-only neurons remained unchanged compared to P5, suggesting that upper layer CR + SOM neurons were recruited from the pool of SOM neurons and not from the population of CR neurons (Figure 7
).
At P16, 2 days after eye opening, the majority of GABAergic neurons expressed CR, SOM and PV (Figures 6 and 7
). This striking change was due to the sudden eruption of PV expression in all layers, except in layer 1, which was always devoid of PV neurons (Figures 6 and 7
). Importantly, PV was never colocalized with CR and/or SOM, suggesting that throughout development PV neurons represent a distinct group of GABAergic neurons. Between P13 and P16, expression of CR, SOM and CR + SOM remained constant in all layers.
Between P16 and P33, the percentage of PV expressing GABAergic neurons continued to increase, whereas CR, SOM and CR + SOM expression remained constant (Figure 7
). After P33 the percentages of PV, CR, SOM and CR + SOM neurons remained unchanged until P300, which was the oldest age we have examined (Figures 6 and 7
).
We have used triple immunolabeling with antibodies against PV, CR, SOM, VIP, NPY, CCK, NOS and ChAT in an effort to find markers for distinct subgroups of GABAergic neurons in mouse V1. Based on the coexpression patterns we have found at least 13 distinct groups of interneurons that account for about 90% of GABAergic neurons in mouse visual cortex (Figure 8
). None of these markers were found in an additional group of GABAergic neurons in layer 1. VIP and NPY neurons constitute the only non-overlapping groups of GABAergic neurons, which corresponds to the organization observed in rat frontal cortex (Kawaguchi and Kubota, 1997
). However, unlike in rat in which CR and SOM labeled distinct groups of GABAergic neurons (Gonchar and Burkhalter, 1997
), we found that in adult mouse V1 maximally 19% of GABAergic neurons coexpress CR and SOM, which is in accordance with recent findings in the developing mouse cerebral cortex (Miyoshi et al., 2007
; Xu et al., 2006
). Our results further demonstrate that the mature laminar distribution of CR neurons develops shortly after birth. The development of SOM expression is slightly delayed, which matures in an inside-out laminar sequence. SOM + CR neurons develop in parallel with SOM neurons in the same inside-out fashion. Importantly, the percentage of CR-only neurons remains constant across postnatal development, suggesting that CR + SOM expression is not due to the acquisition of SOM by CR neurons but develops from the pool of SOM neurons. These results are consistent with the existence of multiple subtypes of SOM neurons, which are specified at the place and time of origin and differentiate into mature interneurons by postnatal transcriptional regulation (Butt et al., 2005
; Cobos et al., 2005
; Miyoshi et al., 2007
; Wonders and Anderson, 2006
).
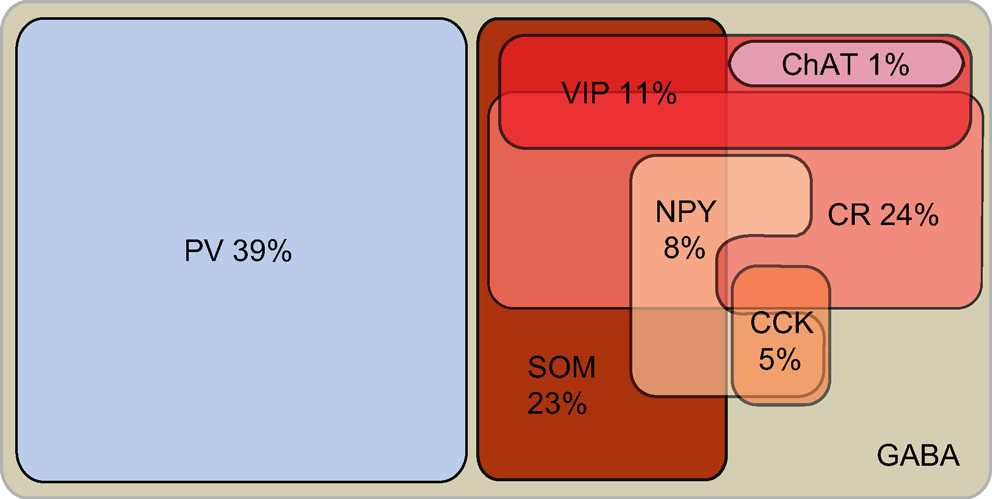
Figure 8. Distribution of cortical interneuron markers in adult mouse primary visual cortex.
Thirteen Distinct Groups of GABAergic Neurons
Based on our triple labeling experiments of interneurons we were able to distinguish 30 different staining patterns. Of these, we consistently observed 13 combinations in which the means of unbiased cell counts in the systematic random samples were statistically significant representations of the mean distribution in the population and, thus, can be considered to represent distinct subgroups of GABAergic neurons. A recent study in mouse somatosensory cortex found only 7 groups of interneurons (Miyoshi et al., 2007
). The most likely reason for the discrepancy is that the observations in somatosensory cortex were made by double labeling with a much smaller panel of antibodies. In evaluating the number of subgroups it is important to recognize that our classification is based on statistical considerations, which excludes neurons with clearly identifiable, but rare expression patterns (e.g., SOM + NPY + CCK; Figures 5
I–L) from classification as separate groups. It is, therefore, possible that we have underestimated the true number of chemically distinct groups. One additional group may be represented by GABA-only cells in layer 1.
In agreement with previous immunohistochemical studies in mouse and rat cerebral cortex (Gonchar and Burkhalter, 1997
; Kawaguchi and Kubota, 1997
; Miyoshi et al., 2007
) we found that PV marks a separate group of neurons which does not express CR, SOM, NPY, VIP, CCK, NOS and ChAT. PV neurons account for about 39% of GABAergic neurons in mouse visual cortex, which is similar to the 40% found in rat frontal cortex (Uematsu et al., 2008
). A small percentage of PV neurons express CB, which confirms previous observations in primate cerebral cortex (del Rio and DeFelipe, 1997
; Kawaguchi and Kubota, 1997
; Yan et al., 1995
) and suggests that PV neurons are chemically heterogeneous. Similar conclusions were reached previously based on the colocalization of PV with substance P and corticotrophin releasing hormone (Vruwink et al., 2001
; Yan et al., 1998
). The chemical heterogeneity of PV neurons is in accordance with their anatomical diversity, which is exhibited by multiple types of basket and chandelier morphologies (Markram et al., 2004
; Miyoshi et al., 2007
). Finally, although most PV neurons were shown to be fast spiking, multiple subtypes of PV neurons have been described including cells with burst firing properties that colocalize CB (Blatow et al., 2003
; Butt et al., 2005
; Miyoshi et al., 2007
).
In stark contrast to PV neurons we found extensive overlap of CR, SOM, CCK and ChAT in PV-negative neurons. NPY and VIP, however, were always expressed by small distinct populations of neurons, which is similar to previous observations in rat frontal cortex (Cauli et al., 2000
; Kawaguchi and Kubota, 1997
; Kubota et al., 1994
; Wang et al., 2004
). By far the largest groups of PV-negative neurons express either CR or SOM, or colocalize both substances. This differs from rat, in which CR and SOM do not overlap (Gonchar and Burkhalter, 1997
; Kubota et al., 1994
; Xu et al., 2006
), but is in accordance with recent findings in mouse somatosensory cortex (Miyoshi et al., 2007
; Xu et al., 2006
). The difference between rat and mouse is consistent with the notion that the combinations and concentrations of chemical markers in cortical interneurons are species- and region-specific (Hof et al., 1999
; Jinno and Kosaka, 2000
) and vary according to the functional specialization of the brain structure (Jones, 2000
; Silberberg et al., 2002
).
We have found that CR and SOM neurons fall into 10 discrete groups (Table 3
; Figure 8
). Two of these groups are quite small and express either CR or SOM and do not colocalize any of the other markers we have tested. In 3 groups CR and SOM are coexpressed either as a pair by themselves or in combination with one additional third marker, which is NPY or VIP. CR + SOM neurons have previously been identified immunocytochemically in mouse somatosensory cortex (Miyoshi et al., 2007
; Xu et al., 2006
). Detailed analyses of CR + SOM neurons have shown that they represent a subtype of Martinotti cell whose dendritic arbor and firing properties are different from CR-negative SOM-containing Martinotti cells (Xu et al., 2006
). The association of CR + SOM + VIP has previously only been reported for the expression of mRNA in interneurons of juvenile rat frontal cortex (Cauli et al., 1997
). CR + SOM + NPY neurons were previously identified by single cell RT-PCR and may represent a subset of Martinotti cells but do not represent small, large and nest basket cells (Cauli et al., 2000
; Markram et al., 2004
; Wang et al., 2002
). Three groups express CR together with VIP, CCK or NPY. CR + VIP and CR + CCK neurons were identified previously in rat frontal cortex (Kawaguchi and Kubota, 1997
), but CR + NPY neurons have not been observed before, except in cells that in addition express SOM (Cauli et al., 2000
). Among SOM neurons we found 2 groups, one that coexpresses NPY, which was observed previously in rat frontal cortex (Kawaguchi and Kubota, 1997
) and another which colocalizes VIP. Although this relatively large group was not observed in previous immunocytochemical studies of rat and mouse cortex (Kawaguchi and Kubota, 1997
; Miyoshi et al., 2007
), Cauli et al. (2000)
showed that in irregular spiking cells of rat frontoparietal cortex, VIP mRNA is colocalized with a small amount of SOM mRNA. Our results confirm previous observations in rat and mouse cerebral cortex that VIP and ChAT are colocalized (Eckenstein and Baughman, 1984
; von Engelhardt et al., 2007
). However, in contrast to the study by von Engelhardt et al. (2007)
in juvenile mice, we found no colocalization of ChAT and CR. One possible explanation for this discrepancy is that the coexpression is developmentally regulated and transient. Alternatively, colocalization could be restricted to the small group of GABA-negative cholinergic neurons identified by von Engelhardt et al. (2007)
. Finally, we found a small group of cells that colocalize CCK and NPY. Although this group is missing in Kawaguchi and Kubota’s (1997)
scheme, its absence has not been directly demonstrated.
A key question which we cannot answer without combining triple immunostaining with electrophysiology is how the identified chemical groups are related to the different spike firing properties of interneurons. Despite this weakness, it is interesting that a recent study in mouse somatosensory cortex described at least 10 discrete electrophysiological profiles (Miyoshi et al., 2007
), which is in a similar range as the number of chemical profiles we have identified here. More specifically, different colocalization patterns of CR, SOM, VIP, CCK, NPY and ChAT are clearly associated with distinct physiological properties (Butt et al., 2005
;Cauli et al., 1997
, 2000
; Miyoshi et al., 2007
; von Engelhardt et al., 2007
;Wang et al., 2002
, 2004
; Xu et al., 2006
), suggesting that the proposed chemical groupings reflect discrete physiological characteristics of interneurons.
Postnatal Maturation of Interneurons
We have found that in mouse visual cortex PV immunoreactivity emerges at P13, shortly before eye opening, and matures in an inside-out laminar progression. These results confirm previous descriptions of the development of PV protein and mRNA expression in developing mice and rats (de Lecea et al., 1995
; del Rio et al., 1994
). Importantly, using triple labeling with antibodies against PV, CR and SOM we found that throughout development, PV neurons never colocalize CR and/or SOM. These findings are in accordance with observations that PV neurons derive from a distinct population of progenitors in the MGE, which after migration to cortex as postmitotic neurons differentiate into fast spiking cells with basket and chandelier morphologies (Anderson et al., 2001
; Butt et al., 2005
; Klostermann and Wahle, 1999
; Patz et al., 2004
; Wichterle et al., 2001
; Xu et al., 2004
). Our results show that across development the percentages of PV neurons in different layers increase at similar rates. Given that earlier born interneurons take up residence in deep layers, whereas later born neurons settle in superficial layers (Anderson et al., 2002
; Miller, 1986
; Valcanis and Tan, 2003
), our results are consistent with recent findings that PV neurons are continuously generated throughout the genesis of interneurons (Miyoshi et al., 2007
).
A key finding of our study is that PV-negative neurons are chemically very diverse, in particular in regard to the coexpression of CR + SOM, SOM + VIP, SOM + NPY, CR + SOM + NPY and CR + SOM + VIP. During development CR, NPY and VIP neurons originate in the CGE (Flames and Marín, 2005
; but, see Anderson et al., 2001
;Wonders and Anderson, 2006
), whereas SOM progenitors are born in the MGE (Butt et al., 2005
; Miyoshi et al., 2007
; Xu et al., 2004
). How then do interneurons that originate from different precursors at different locations become phenotypic chemical hybrids? Two observations are relevant to this question. First, we found that across postnatal development the percentage of CR neurons in the different layers remains constant, whereas both the percentage of SOM and CR + SOM neurons increase (Feldman et al., 1990
; Fonseca et al., 1995
; Forloni et al., 1990
; Papadopoulos et al., 1993
). This suggests that SOM and CR + SOM expression matures after CR and develops from the inside out. Second, we observed that the increase in the percentage of SOM neurons proceeds in parallel with the increase in CR + SOM neurons, suggesting that both subtypes emerge from the same MGE precursor pool and differentiate postmitotically in the cortex. The underlying differentiation mechanisms are still incompletely understood, but recent studies suggest that it involves the differential transcriptional regulation of the expression of the homeodomain transcription factor genes Dlx1 and Lhx6 (Cobos et al., 2005
, 2006
;Wonders and Anderson, 2006
).
This research was conducted in the absence of any commercial or financial relationships that could be construed as potential conflict of interest.
We thank Katia Valkova for excellent technical assistance. This work was supported by NIH grants EY05935, NS30676, grant 123/2000B from the Human Frontier Science Foundation and the McDonnell Foundation for the Studies of Higher Brain Function.