1
Department of Biological Sciences, Vanderbilt University, Nashville, TN, USA
2
Neuroscience Graduate Program, Vanderbilt University, Nashville, TN, USA
3
Department of Psychology, Vanderbilt University, Nashville, TN, USA
4
Instituto de Ciéncias Biomédicas, Universidade Federal do Rio de Janeiro, Rio de Janeiro, Brazil
Insectivores represent extremes in mammalian body size and brain size, retaining various “primitive” morphological characteristics, and some species of Insectivora are thought to share similarities with small-bodied ancestral eutherians. This raises the possibility that insectivore brains differ from other taxa, including rodents and primates, in cellular scaling properties. Here we examine the cellular scaling rules for insectivore brains and demonstrate that insectivore scaling rules overlap somewhat with those for rodents and primates such that the insectivore cortex shares scaling rules with rodents (increasing faster in size than in numbers of neurons), but the insectivore cerebellum shares scaling rules with primates (increasing isometrically). Brain structures pooled as “remaining areas” appear to scale similarly across all three mammalian orders with respect to numbers of neurons, and the numbers of non-neurons appear to scale similarly across all brain structures for all three orders. Therefore, common scaling rules exist, to different extents, between insectivore, rodent, and primate brain regions, and it is hypothesized that insectivores represent the common aspects of each order. The olfactory bulbs of insectivores, however, offer a noteworthy exception in that neuronal density increases linearly with increasing structure mass. This implies that the average neuronal cell size decreases with increasing olfactory bulb mass in order to accommodate greater neuronal density, and represents the first documentation of a brain structure gaining neurons at a greater rate than mass. This might allow insectivore brains to concentrate more neurons within the olfactory bulbs without a prohibitively large and metabolically costly increase in structure mass.
Despite the extensive variation in brain size across mammals (by a factor of approximately 100,000 – Stolzenburg et al., 1989
; Tower, 1954
) that suggests differing cellular composition, computational capacity, and cognitive abilities across species, different mammalian orders have traditionally been pooled together in studies of brain allometry as if their brains were built according to the same scaling rules (e.g., Haug, 1987
; Zhang and Sejnowski, 2000
). Recent studies have investigated cellular scaling rules with respect to brain allometry in different mammalian orders using the novel method of isotropic fractionation which produces cell counts derived from tissue homogenates from anatomically defined brain regions (Herculano-Houzel and Lent, 2005
). These studies have determined scaling rules in species spanning a wide range of body and brain masses in rodents (Herculano-Houzel et al., 2006
) and primates (Herculano-Houzel et al., 2007
). In the order Rodentia, increased mass of the cerebral cortex, cerebellum, and remaining areas is concurrent with greater numbers of neurons along with even greater numbers of non-neurons, yielding a ratio of non-neurons to neurons that increases with brain size (Herculano-Houzel et al., 2006
). These findings corroborated previous studies describing neuronal density decreasing and the glia-to-neuron ratio increasing with increasing brain size across mammalian taxa (Cragg, 1967
; Friede, 1954
; Haug, 1987
; Hawkins and Olszewski, 1957
; Herculano-Houzel et al., 2006
; Reichenbach, 1989
; Shariff, 1953
; Stolzenburg et al., 1989
; Tower, 1954
; Tower and Elliott, 1952
; Tower and Young, 1973
). In contrast to rodent brains, which scale hypermetrically in size with their numbers of neurons, primate brain size increases approximately isometrically as a function of cell number, with no systematic change in neuronal density or in the non-neuronal/neuronal ratio with increasing brain size (Herculano-Houzel et al., 2007
). The different scaling rules that apply to rodent and primate brains result in the latter being composed of larger numbers of neurons than rodent brains of comparable size, since neuronal density decreases with increasing brain size in rodents but not in primates (Herculano-Houzel et al., 2007
).
Given these differences in cellular scaling rules in two mammalian orders representing an overlapping range of brain masses, it becomes particularly interesting to examine insectivores, which represent the smaller end of the mammalian spectrum. Although neuronal density has been described to decrease in larger insectivore cortices, accompanied by larger glia/neuron ratios (Stolzenburg et al., 1989
), no quantitative analyses have yet described cellular scaling in insectivores in a way that could be compared to rodents and primates using similar methodology (also note that two of the five species – and the two largest species in both brain and body weight – examined by Stolzenburg et al. have since been reclassified to different taxonomic orders). Comparative studies of mammalian brain evolution would be incomplete without incorporating the order Insectivora. This order includes extremely small mammals that have retained various “primitive” morphological characteristics, and some species are thought to share similarities with small-bodied ancestral eutherians. An insectivorous lifestyle was characteristic of many early mammals and the roots of the insectivore order and many other eutherian orders diverged over 65 mya (de Jong, 1998
; Eisenberg, 1981
; Novacek, 1992
). Fossil endocasts from the Triassic period also indicate that the first mammals had small brains with little neocortex (Jerison, 1990
; Kielan-Jaworowska, 1983
, 1984
, 1986
), and extant mammals with small brains and bodies have often been studied to gain insight into the organization of neocortex in early mammals (e.g., Beck et al., 1996
; Krubitzer, 1995
; Krubitzer et al., 1986
, 1993
, 1997
). Indeed, particularly in the small brains of shrews, conduction times are likely to be exceptionally short in the neocortex, allowing for small-diameter axons and dendrites to be sufficient (Ringo, 1991
; Ringo et al., 1994
; Wang et al., 2008
). Unusual sensory characteristics of insectivores, such as shrews having a reduced number of sensory areas with each area closely adjacent to one another and no room for intervening processing areas (Catania, 2005
) or star-nosed moles exhibiting record-setting efficiency in prey capture (Catania and Remple, 2005
), beg the question of how limitations of size in small mammalian brains affect computational and functional capacity.
Here we assess one component affecting computational and functional capacity in small brains by quantifying the number of neurons and non-neurons in various brain regions of insectivores. The isotropic fractionation method was used to determine the total number of neuronal and non-neuronal cells in the cerebral cortex, hippocampus, olfactory bulbs, cerebellum, and remaining areas of five species of the order Insectivora. By determining how the mass of brain structures scales with their cellular composition across these species, we investigate how the scaling rules applicable to insectivore brains compare to the rules for rodents and primates.
Animals
Adult smoky shrews (Sorex fumeus, n = 3), short-tailed shrews (Blarina brevicauda, n = 5), star-nosed moles (Condylura cristata, n = 4), hairy-tailed moles (Parascalops breweri, n = 3), and eastern moles (Scalopus aquaticus, n = 3) were wild-caught (permit #COL00087 in Pennsylvania and #1868 in Tennessee). All animal procedures followed National Institutes of Health guidelines and were performed according to the standards set by the Animal Welfare Act and the Vanderbilt University Institutional Animal Care and Use Committee. Body weight was obtained immediately upon successful trapping of each animal.
Dissection
Animals were given an overdose of sodium pentobarbital (at least 120 mg/kg) and perfused transcardially with 0.01 M phosphate-buffered saline (PBS, pH 7.2) followed by 4% paraformaldehyde in 0.01 M PBS (pH 7.2). The brains were removed from the skulls, then blocked at the level of the foramen magnum and dissected free of dura mater and superficial blood vessels followed by postfixation for 2–4 weeks by immersion in 4% phosphate-buffered paraformaldehyde. Each brain was dried of excess paraformaldehyde and weighed as a whole, then dissected. The cerebellum was dissected by cutting the cerebellar peduncles at the surface of the brainstem. The cerebral cortex in all animals was obtained by peeling away the striatum and other subcortical structures, excluding the hippocampus which was dissected separately from each hemisphere, under a Zeiss stereoscope. The olfactory bulbs were also dissected and weighed individually. All other brain structures were pooled and processed together as “remaining areas.” A representative dissection of one brain, that of an eastern mole, is shown in Figure 1
A followed by an image of the intact whole brain (Figure 1
B). Illustrations of the brains of smoky shrews, short-tailed shrews, star-nosed moles, and eastern moles are also given in order to show overall macromorphology and the relative size of each brain (Figure 1
C). In all species, left and right cortical hemispheres, olfactory bulbs, and hippocampus were counted separately and added together to estimate numbers for the whole brain and to discriminate left/right differences. An unpaired Mann–Whitney U test was run using Statview, and p > 0.5 for the cortex, hippocampus, and olfactory bulbs, showing no significant difference between left and right regions and allowing them to be pooled together for analysis of each structure.
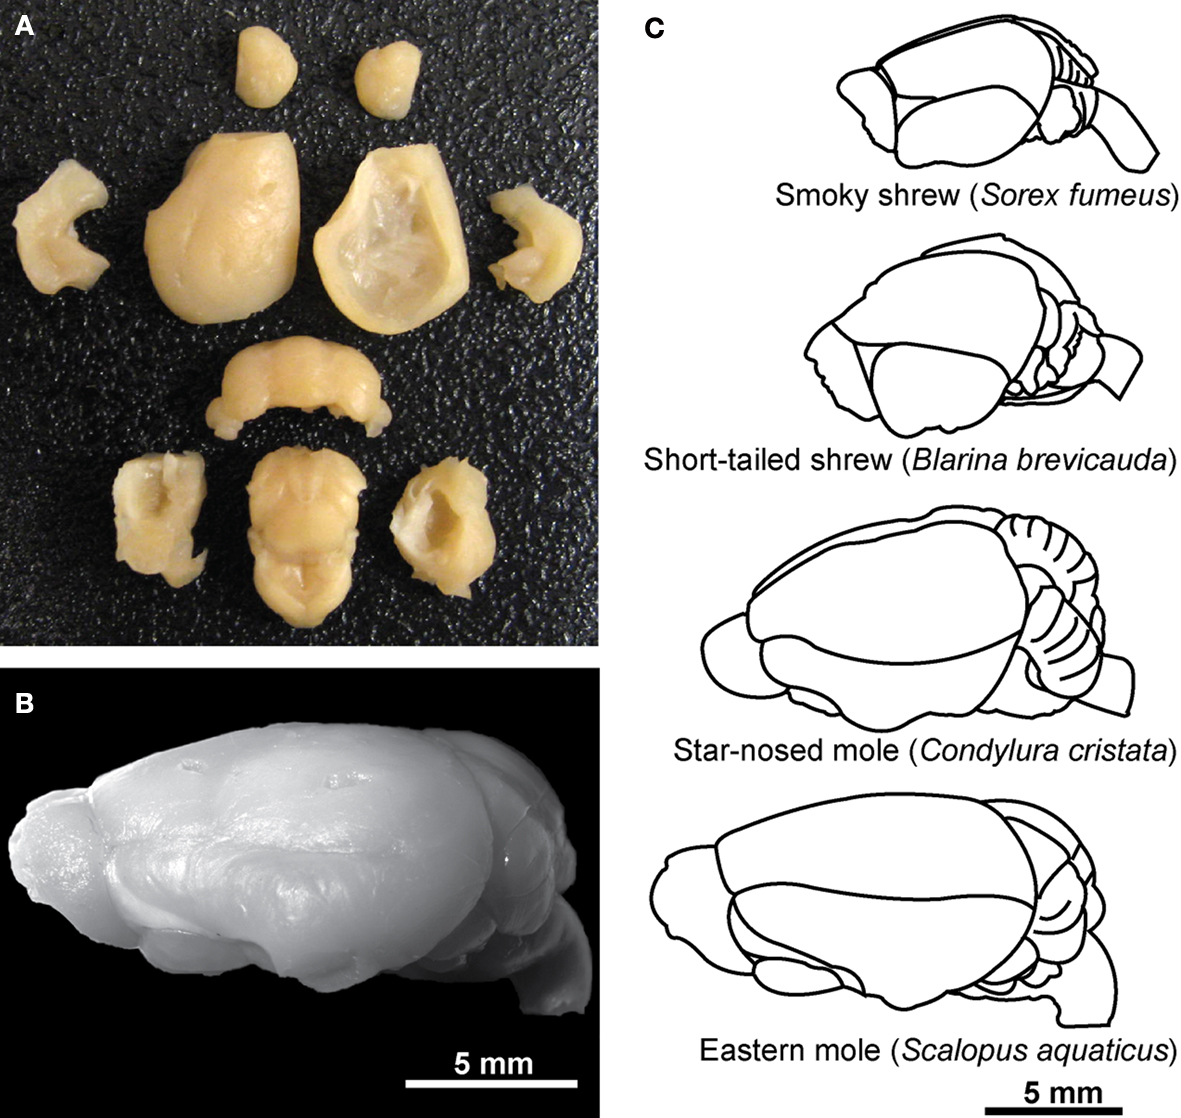
Figure 1. Dissection techniques and morphology of the insectivore brains examined in the present study. (A) Dissection of an eastern mole brain [shown whole in (B) and illustrated in (C)] illustrates brain structures of interest including, from top to bottom, the olfactory bulbs, cortex (lateral view for the left cortex and medial view for the right cortex), left and right hippocampus (shown in the second row of structures lateral to the left and right cortex, respectively), cerebellum, and the remaining areas (bottom row of structures including the striatum peeled away from the cortex at the left and right with subcortical structures in the center). (C) Representative brains of the smoky shrew, short-tailed shrew, star-nosed mole, and eastern mole are illustrated at a lateral view to show macromorphology and relative size (hairy-tailed mole brain not shown, but is similar in size to a star-nosed mole brain – see Table 1
).
Dissections followed Herculano-Houzel et al. (2006
) for rodents except that (1) olfactory bulbs were counted separately from the “remaining areas” and (2) the hippocampus was quantified separately from the cerebral cortex. Once scaling rules within the order Insectivora were determined, cell numbers for these structures were later pooled in data analysis where indicated for comparison with rodents and primates. All numbers reported refer to both left and right hemispheres combined.
Isotropic Fractionation
Total numbers of cells, neurons, and non-neuronal cells were estimated as described by Herculano-Houzel and Lent (2005)
using the isotropic fractionation method. Briefly, each dissected brain division was turned into an isotropic suspension of isolated nuclei of known, defined volume that was kept homogeneous by agitation. The total number of nuclei in suspension, and therefore the total number of cells in the original tissue, was estimated by calculating the density of nuclei in small aliquots stained with the fluorescent DNA marker DAPI (4′-6-diamidino-2-phenylindole dihydrochloride; Molecular Probes, Eugene, OR, USA; 1 mg/100 ml PBS) under the microscope. After sufficient agitation, 10 μl aliquots were removed and counted using a Neubauer improved counting chamber (double bright line; ProSciTech, Australia) under a Zeiss Axioskop fluorescence microscope. Once the total cell number was known, the proportion of neurons was determined by immunocytochemical detection of neuronal nuclear antigen (NeuN; anti-NeuN mouse IgG, 1:300 in PBS; Chemicon, Temecula, CA, USA) expressed in all nuclei of most neuronal cell types and absent in non-neuronal cells (Gittins and Harrison, 2004
; Mullen et al., 1992
). Estimates of the proportion of NeuN-positive nuclei are considered reliable because the coefficient of variation among animals of the same species is typically <0.15 (see Table 2
). Each count for DAPI and NeuN-positive cells was replicated by an independent rater, and inter-rater reliability measured >80% on all counts (and often >90%). Numbers of non-neuronal cells were derived by subtraction.
Data Analysis
All statistical analyses and regressions were performed using Statview (SAS, Cary, NC, USA), except for studentized residuals computed using MATLAB (Natick, MA, USA), using the average values obtained for each species. Nonparametric Spearman rank correlations were calculated for fractional distributions of mass, number of cells, and number of neurons across species because it was not possible to ascertain that the variables were normally distributed. Where Spearman correlations were found, regression of the data to power and linear functions were used to determine the best mathematical description of how structure mass, numbers of cells and densities are interrelated across species. All correlations and functions reported in the paper refer to comparisons across species (comparing averages for each species). Although the possibility cannot be ruled out that some correlations could conceivably become significant if a larger number of species were studied, the fact that strong correlations were obtained even across the five insectivore species studied here indicates that these are significant.
For the comparison with rodent and primate cellular scaling rules, we used the equations that apply to the average structure size and cellular composition of the six primate species described earlier (Herculano-Houzel et al., 2007
), excluding tree shrews; and calculated the equations that apply to the average structure size and cellular composition for each of the six rodent species described before (Herculano-Houzel et al., 2006
).
Across the five insectivore species studied, body mass varies approximately 12-fold, from ≈8 g in the smoky shrew to ≈95 g in eastern moles, whereas brain mass varies by a factor of approximately 6, accompanied by an increase of 5.5 times the total number of cells and 6 times the number of total neurons (Table 1
). We found that brain mass (MBR) relates to body mass (MBO) by the power function MBR = 0.046 × MBO0.743 (Figure 2
A; p = 0.0024) in accordance with studies of other mammals reporting that brain size increases more slowly than body size (Fox and Wilczynski, 1986
; Martin, 1981
). As a result, relative brain mass ranged from 2.3% in the smoky shrew to 1.0% in the eastern mole, decreasing with increasing body size (Spearman correlation, p = 0.0455).
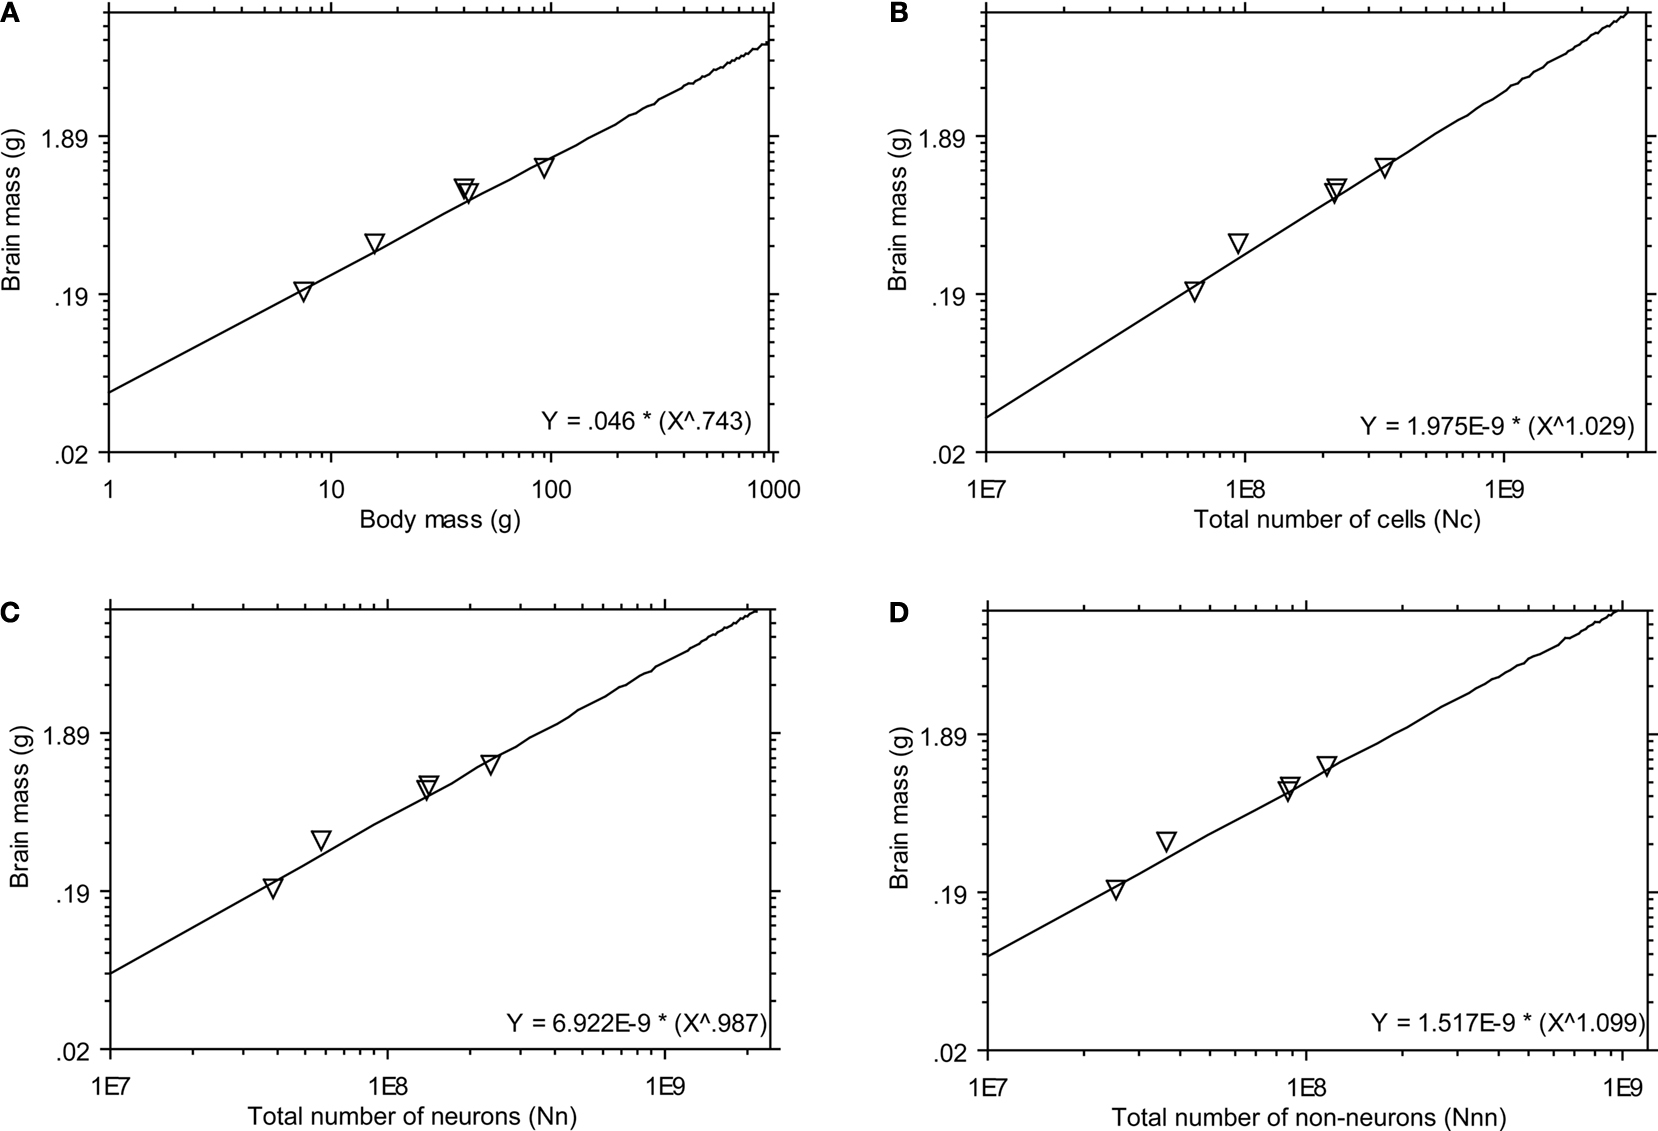
Figure 2. Scaling rules in insectivore brains. Graphs of power functions relate (A) brain mass to body mass (p = 0.0024), (B) brain mass to total number of cells in the brain (Nc; p = 0.0015), (C) brain mass to the total number of neurons in the brain (NN; p = 0.0023), and (D) brain mass to total number of non-neurons in the brain (NNN; p = 0.0010). Each point represents the average for a species.
We found that total brain mass increases linearly with the number of neurons, the number of non-neurons, and the total number of cells, since brain mass can be described equally well using either power functions with exponents close to 1 or as linear functions of the number of cells, neurons and non-neurons in the brain (exponents: 1.029, 0.987, and 1.099; r2: 0.983, 0.963, and 0.993; p-values: 0.0015, 0.0023, and 0.0010, and 0.0010, 0.0031, and 0.0002; Figures 2
B,C,D, for cells, neurons and non-neurons, respectively).
Relative Distribution of Mass and Neurons Across Brain Structures
The relative size of the cerebral cortex, hippocampus, cerebellum, olfactory bulb, and remaining areas of the brain, estimated as percent mass relative to the whole brain (%MBR), does not vary significantly with brain size across the five insectivore species analyzed here (Spearman correlations, all p-values >0.1). This indicates that the fractional distribution of mass in the insectivore brain remains relatively constant across these species, with 48.4 ± 5.2% of mass in the cerebral cortex and hippocampus, 12.6 ± 2.6% in the cerebellum, 6.3 ± 1.0% in the olfactory bulbs, and 31.6 ± 4.0% in the remaining areas (Table 2
).
The relative distribution of neurons contained in each of the brain structures of interest relative to total neurons in the brain also fails to vary significantly with brain mass across the five insectivore species. The cerebellum holds the majority of neurons in the insectivore brain, with an average 64.6 ± 9.5% of all neurons, followed by the combined cerebral cortex and hippocampus with 16.0 ± 6.0% and the olfactory bulb, with 11.2 ± 3.2% of all brain neurons, while the remaining areas hold only 8.5 ± 3.8% of all neurons, despite representing 32% of total brain mass. Remarkably, the smoky shrew and short-tailed shrew, the smallest species represented in our dataset, concentrate twice the relative number of brain neurons in their combined cerebral cortex and hippocampus than the other species (18% compared to 9–10% of all brain neurons), even though these structures have the same relative mass (36 and 48% of brain mass, respectively, compared to 33–48% in the other species).
As reported previously for rodent and primate brains (Herculano-Houzel et al., 2006
, 2007
), relative structure mass does not correlate with relative number of neurons across insectivore brains (Spearman correlation, p > 0.05). The finding that relative mass does not reflect relative number of neurons indicates that different scaling rules apply for the cerebral cortex, hippocampus, olfactory bulbs, cerebellum, and RAs of insectivores.
Structure Size as a Function of the Number Of Neurons and Non-Neurons
All structures examined increase in mass across insectivore species as linear functions of their numbers of non-neuronal cells (exponents: cortex = 1.111, hippocampus = 1.044, olfactory bulbs = 1.005, cerebellum = 1.093, RAs = 0.923; p < 0.05 for all brain structures; Figure 3
A). This finding indicates that the average size of non-neuronal cells does not change significantly with structure mass across insectivore species.
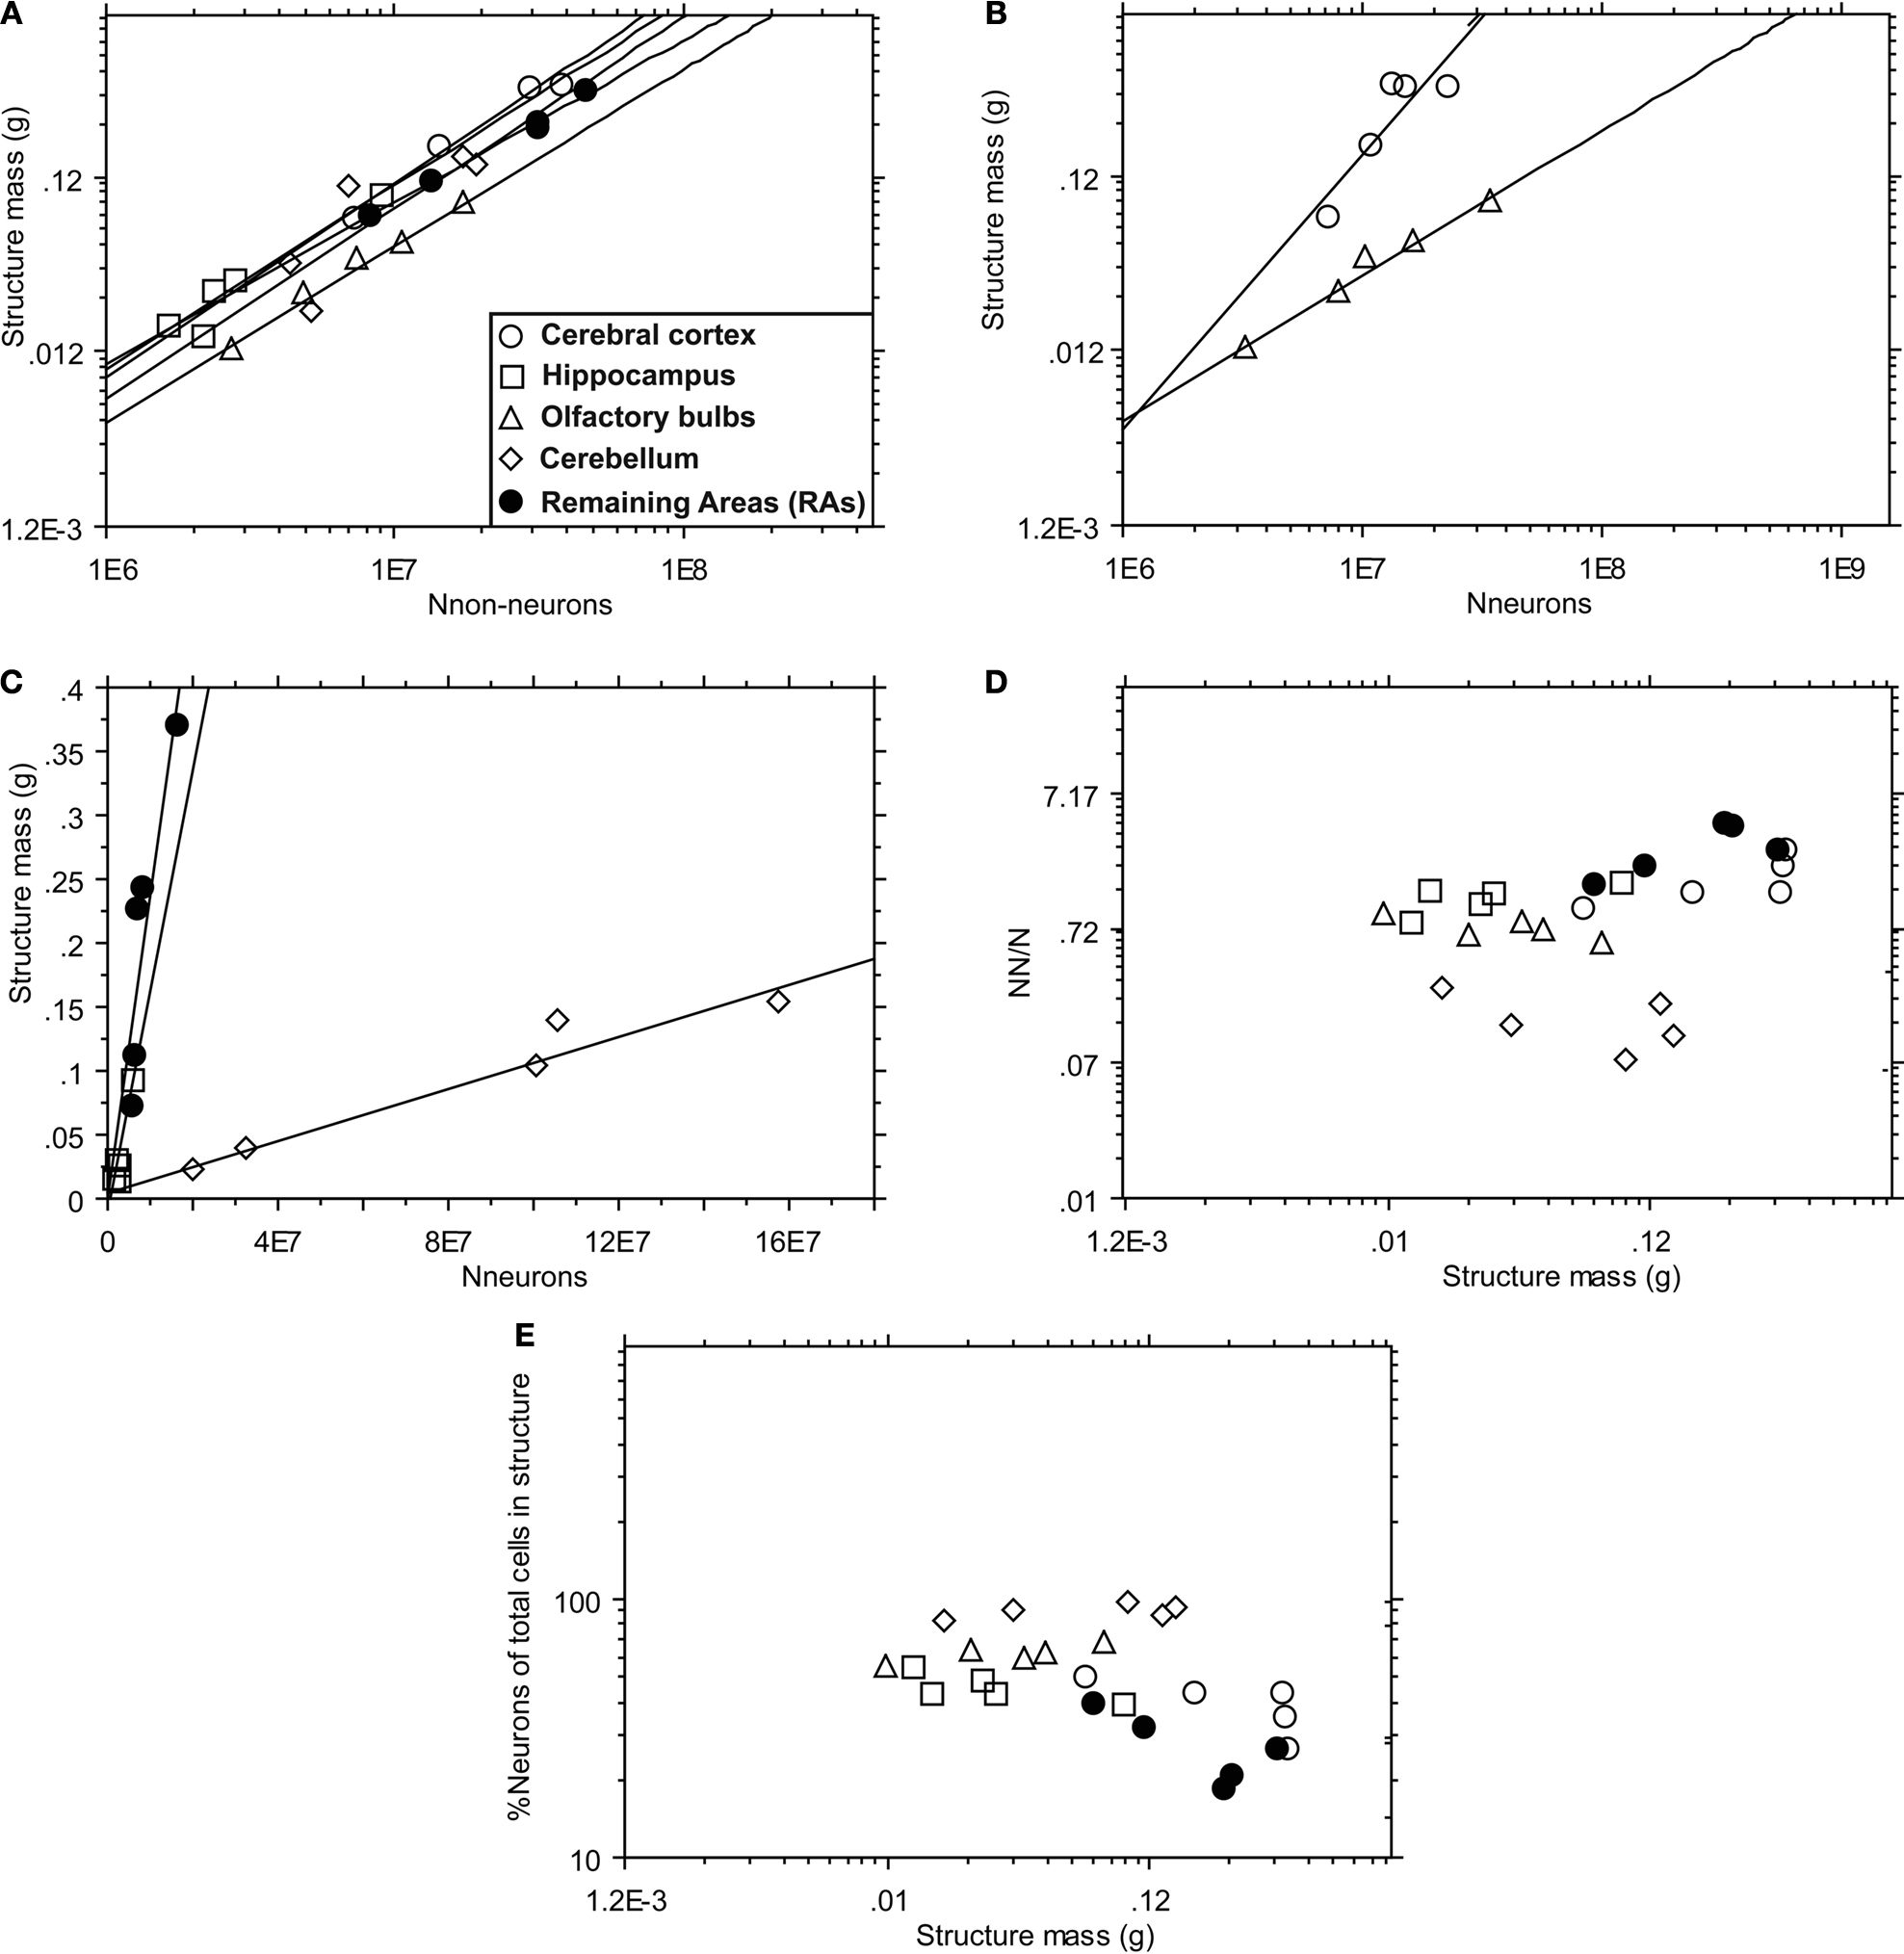
Figure 3. Power functions relate the mass of each brain structure of interest to cell scaling rules. For each area of interest, the mass of each brain structure is first expressed as a function of (A) the number of non-neurons (Nnn) in each brain structure, and (B,C) the number of neurons (Nn) in each brain structure. The ratio of non-neurons to neurons (NN/N) and the percentage of neuronal cells in each structure (%NN) are also compared to the mass of each brain structure [(D) and (E), respectively]. The key shown as an insert in (A) also applies to (B–E). (A) p < 0.05. (B) p = 0.0491 (cortex) and 0.0014 (olfactory bulbs). (C) r2 = 0.892 (hippocampus), 0.938 (cerebellum), and 0.794 (remaining areas); p-values 0.0155, 0.0068, and 0.0424, respectively. (D,E) p > 0.1. Each point represents the average for a species.
Structure mass increases across insectivore species as power (Figure 3
B) or linear (Figure 3
C) functions of their numbers of neurons (NN) depending on the brain structure. The hippocampus, cerebellum and remaining areas vary in mass linearly with their numbers of neurons (linear regressions, r2 = 0.892, 0.938, and 0.794; p-values 0.0155, 0.0068, and 0.0424, respectively; Figure 3
C). In contrast, cortical mass increases faster than the number of neurons in the structure, as a power function with an exponent of 1.571 (p = 0.0491; Figure 3
B). Remarkably, olfactory bulb mass increases more slowly than its number of neurons, as a power function of exponent 0.824 (p = 0.0014; Figure 3
B). Despite the non-linear co-variation in structure mass and numbers of neurons in these two structures, we did not find a significant co-variation of non-neuronal/neuronal cell ratio with structure mass in these or any other structure (p > 0.1; Figure 3
D), nor did we find a significant co-variation of the percentage of neurons among the cells in each structure with structure mass (p > 0.1; Figure 3
E), indicating that both measures remain relatively constant with increasing structure mass.
In light of the linear relationship between structure mass and numbers of non-neuronal cells, the finding that cortical mass increases steeply with the number of neurons in the structure indicates that average neuronal size increases as neurons become more numerous in the cerebral cortex (but not in the hippocampus). Strikingly, average neuronal size in the olfactory bulb is predicted to decrease as this structure gains neurons across species. We therefore examined how neuronal density in the insectivore brain varies across species with structure mass.
Cell Densities
As expected from the scaling rules described above, non-neuronal density does not co-vary with structure mass across species in any of the brain structures examined (p > 0.1; Figure 4
A), remaining relatively constant with increasing structure mass. Similarly, neuronal density does not co-vary with structure size in the hippocampus, cerebellum and remaining areas across species (regression to power functions, p = 0.2533, 0.5963, and 0.1114, respectively; Figure 4
B). Neuronal density in the cerebral cortex decreases significantly with cortical mass (exponent = −0.513, p = 0.0492; Figure 4
B). Neuronal density in the olfactory bulb initially appears not to vary significantly as a function of bulb mass (p = 0.2873). However, further inspection of Figure 4
B suggests that the star-nosed mole is an outlier in the group, with a much smaller neuronal density in the olfactory bulb than would be expected based on the other four insectivore species examined. This is supported by a studentized residual result of 3.3439 for the star-nosed mole, classifying it as an outlier (for all other species residuals are <1). If the star-nosed mole species is removed from the comparison, we find that neuronal density in the olfactory bulb increases linearly with bulb mass (r2 = 0.942, p = 0.0295; Figure 4
C).
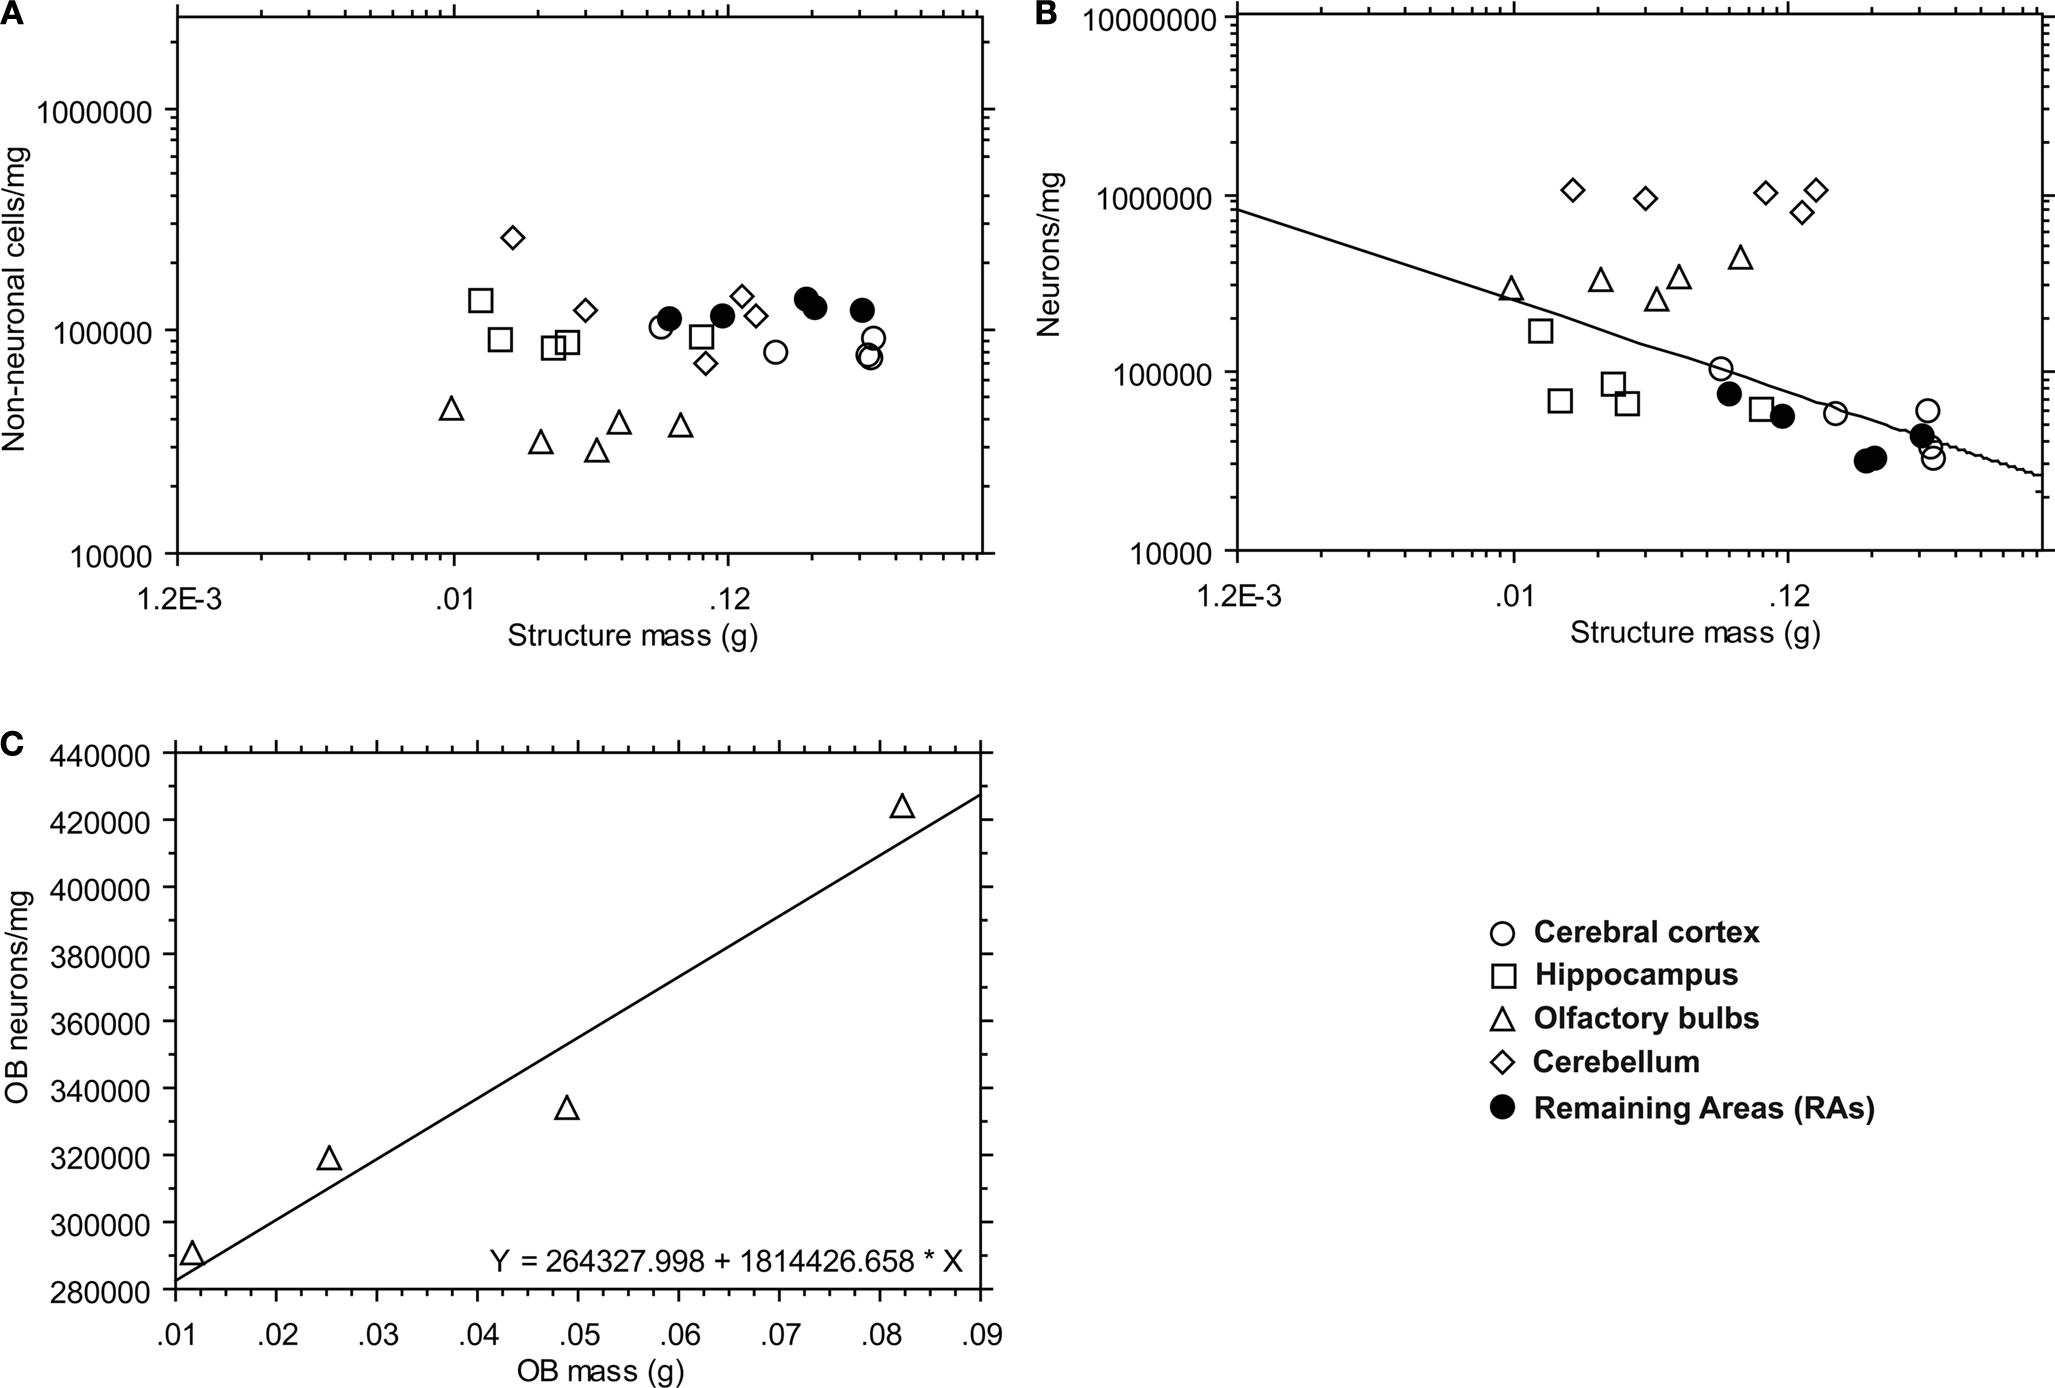
Figure 4. Variation in neuronal and non-neuronal density as a function of mass. (A) Non-neuronal density (number of non-neurons, NNN, per milligram of structure mass) is expressed as a function of the mass of each brain structure (p > 0.1 for all structures). (B) Neuronal density (number of neurons, NN, per milligram of structure mass) is expressed as a function of the mass of each brain structure (p > 0.1 for the hippocampus, olfactory bulbs, cerebellum, and remaining areas; p < 0.05, cerebral cortex). (C) Neuronal density in the olfactory bulbs is expressed as a function of olfactory bulb mass (p < 0.05) with the exclusion of the star-nosed mole outlier seen in (B). The key shown applies to (A–C). Each point represents the average for a species.
Comparison with Rodents and Primates
In order to determine how the scaling rules for insectivores compare with those obtained for rodents (Herculano-Houzel et al., 2006
) and primates (Herculano-Houzel et al., 2007
), we combined the insectivore numbers obtained for the cerebral cortex and hippocampus and examined how combined cortical mass (as examined in rodents and primates) scales with numbers of neurons and non-neurons. We find that the exponent of 1.520 that describes how the insectivore cortex scales with its number of neurons is closer to the exponent of 1.744 found in rodents than to the exponent of 1.077 found in primates (although p > 0.05 for insectivores; Figure 5
A). Insectivores appear to overlap with the rodent species (mouse, hamster and rat) that fall within the same brain mass range. On the other hand, the non-neuronal scaling rules observed for rodent, primate, and insectivore cerebral cortex are all approximately linear, with exponents of 1.114, 0.963, and 1.142, respectively (p = 0.0018 for insectivores; Figure 5
B).
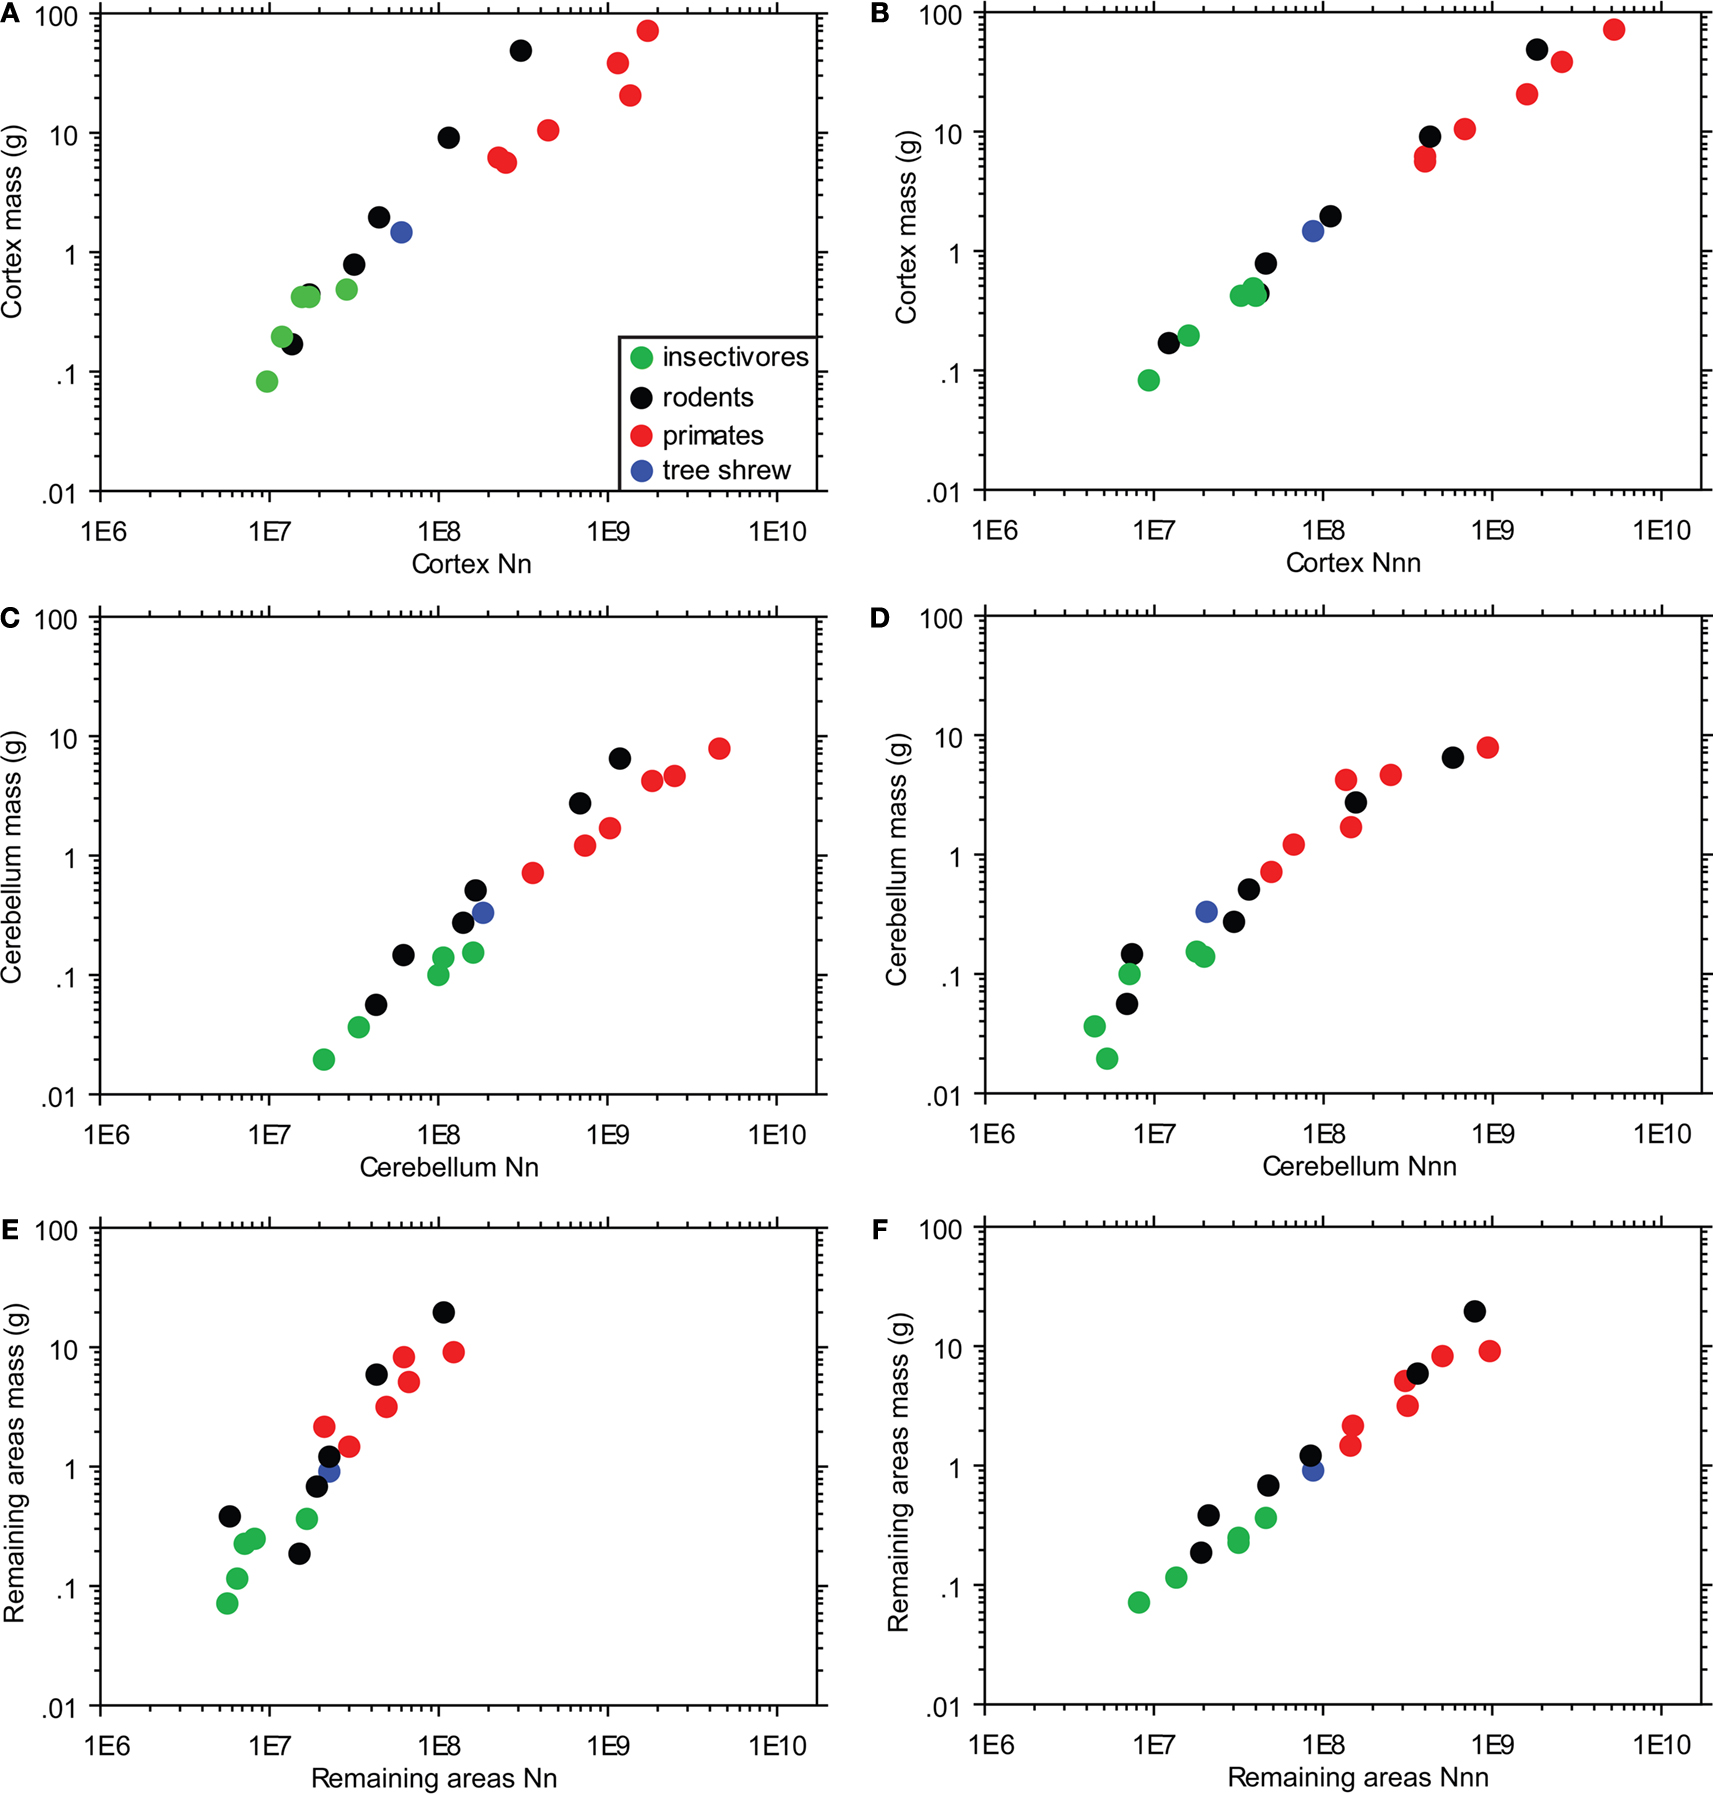
Figure 5. Cellular scaling rules in primates, rodents and insectivores. Structure mass is compared to the number of neurons (A,C,E) or non-neurons (B,D,F) in three brain structures, the cortex [hippocampus and cerebral cortex combined (A,-B); cerebellum (C,D); and remaining areas (E,F)]. Insectivores were found to scale with rodents in cortical neuronal numbers (A), with primates in cerebellar neuronal numbers (C), and with both rodents and primates (but with a higher degree of scatter) in neuronal numbers for the remaining areas [(E) – but note that olfactory bulbs are included for rodents and insectivores but excluded for primates]. All three orders scale similarly for non-neuronal numbers across all brain structures examined (B,D,F). Tree shrews have been added for comparison. The key shown in A also applies to (B–F). Each point represents the average for a species.
The linear neuronal scaling rules that apply to the insectivore cerebellum (exponent, 1.028; p = 0.0012), in contrast, are similar to those found in primates (exponent, 0.990), and different from the rodent scaling rules (exponent, 1.372; Figure 5
C). Remarkably, the insectivore and primate data points seem to align, despite the non-overlapping range of cerebellar sizes. As described for the cortex, the same non-neuronal scaling rules seem to apply to the cerebellum of rodents, primates and insectivores (Figure 5
D; p < 0.05 using a linear regression model).
Whereas linear neuronal scaling rules apply to insectivore remaining areas (including the olfactory bulb; p < 0.05) and primate remaining areas (without the olfactory bulb; Herculano-Houzel et al., 2007
), in rodents the remaining areas (which included the olfactory bulb) were found to increase in mass faster than in neurons (Herculano-Houzel et al., 2006
). However, a comparison of the three mammalian orders together shows a more scattered distribution than that found for cerebral cortex or cerebellum, suggesting that similar scaling rules might actually apply to the remaining areas across rodents, primates and insectivores alike (Figure 5
E). Again for the remaining areas, the same, approximately linear non-neuronal scaling rules seem to apply to rodents, primates, and insectivores (exponents 1.153, 1.013, and 0.926, respectively; p < 0.01 for all orders; Figure 5
F).
Insectivore Cellular Scaling Rules
Here we describe that, as a whole, insectivore brains increase in mass as a linear function of their numbers of neuronal and non-neuronal cells. Linear scaling rules, however, do not apply to all brain regions. Whereas the hippocampus, cerebellum and remaining areas are found to increase individually as linear functions of their respective numbers of neurons, with neuronal densities that do not co-vary (remain relatively constant) with structure size, the insectivore cerebral cortex gains mass faster than it gains neurons (with decreasing neuronal densities), and the olfactory bulbs gain neurons faster than mass (with increasing neuronal densities). The linear whole brain scaling can be attributed to the fact that the cerebellum, which indeed scales linearly in size with its number of neurons, accounts for over 60% of all brain neurons, whereas the cerebral cortex and olfactory bulb, each representing about 12% of all brain neurons, show scaling rules that oppose each other.
Some of our findings are consistent with previous studies. For instance, Stolzenburg et al. (1989)
found that the neuronal density in the insectivore cerebral cortex decreases with increasing brain size whereas non-neuronal density does not (but again note that two of the five species included by Stolzenburg et al. – the two largest species examined – have since been reclassified to different taxonomic orders). However, in our dataset the inverse relationship between brain size and the ratio of non-neurons to neurons (Haug, 1987
; Stolzenburg et al., 1989
) does not reach significance. Importantly, we show that, as in rodents and primates (Herculano-Houzel et al., 2006
, 2007
), the relative size of any brain structure does not reflect its relative number of neurons even in the case of extremely small mammals, and therefore should not be used as a proxy for numbers of neurons in comparative studies.
Insectivore Cellular Scaling Rules Compared to Rodents and Primates
The insectivore neuronal scaling rules show interesting differences from and similarities to the rules that apply to rodents and primates. Whereas the insectivore cerebral cortex shares scaling rules with rodents (Figure 5
A), scaling of the insectivore cerebellum shares its neuronal scaling rules with primates (Figure 5
C), and the remaining areas appear to scale similarly across all three mammalian orders (Figure 5
E).
Surprisingly, larger insectivore olfactory bulbs appear to have higher neuronal densities, which implies smaller cells on average (Figures 3
B,C and 4
B,C). This is the first documentation of a brain structure gaining neurons faster than it gains mass across species and, to the best of our knowledge, no such increase in neuronal density with structure size has been described in the literature. This hypometric scaling relationship would presumably allow insectivore brains to concentrate more neurons within the olfactory bulbs without a prohibitively large (and metabolically costly) gain in structure mass, which may be advantageous for such small mammals. In rodents, all brain structures show increasing neuronal size with increasing structure mass (the cortex and remaining areas to a greater degree than the cerebellum; Herculano-Houzel et al., 2006
) whereas in primates all values were approximately linear (although olfactory bulbs were not examined; Herculano-Houzel et al., 2007
).
In contrast to neuronal scaling rules, the same scaling rules for non-neuronal cells apply to all three orders such that the brain mass scales with the number of non-neuronal cells in a linear fashion (Figures 5
B,D,F). The same rules apply to all brain structures quantified individually from insectivores (Figure 3
A). This implies that the average non-neuronal cell size stays constant with increasing structure and brain size across species, and indicates that non-neuronal scaling rules, in contrast to the neuronal scaling rules, have been conserved in evolution even as insectivores, rodents, and primates diverged.
Implications for Scaling Rules in the Insectivore Order
In comparing insectivores with primates and rodents, it seems that non-neuronal scaling rules apply across all three orders and have been maintained in evolution after these orders diverged. Insectivore neuronal scaling rules, in contrast, are shared by rodents for the cortex (Figure 5
A); by primates for the cerebellum (Figure 5
C); and possibly by all three orders for the remaining areas (Figure 5
E). Therefore it appears that common scaling rules exist between insectivore, rodent, and primate brain areas, and it is possible that insectivores represent the common aspects of each order. Overall, insectivores appear to share certain scaling rules involving cortical, cerebellar, and remaining areas with rodents and primates. This indicates that, with the exception of the olfactory bulb, the smaller brain sizes of insectivores do not demand an entirely distinct set of cellular scaling rules. Therefore, the cellular scaling rules that apply to insectivores might represent the ancestral rules that applied to early mammals. In support of this, the brain of the tree shrew, a species often considered to be close to the common ancestor for rodents and primates, sits at the intersection between rodent, primate, and insectivore relationships between numbers of neurons and structure mass (Figures 5
A,C,E).
There is a wealth of diversity in the anatomical and behavioral specializations found among insectivores despite the constraints involved with including the lower limits of mammalian body size (Schmidt-Nielsen, 1984
) and brain size. Auditory and visual modalities appear to be relatively poorly developed and of limited use in moles and shrews, with neural resources instead being disproportionately invested in the somatosensory and olfactory modalities to allow successful navigation of tunnels and localization of prey. Shrews are predominantly terrestrial and, like rodents, depend primarily on their well-developed array of mystacial vibrissae for tactile information (Catania, 2000
). In contrast, moles are fossorial, spending much of their lives underground in tunnel systems. The moles examined in the present study – star-nosed moles (C. cristata), hairy-tailed moles (P. breweri), and eastern moles (Scalopus aquaticus) – prefer different habitats but have overlapping ranges. Perhaps most interesting among the somatosensory adaptations of moles are the array of sensory receptors located at the tip of the snout (or throughout the star, in the case of star-nosed moles) known as Eimer’s organs (Catania, 1995a
; Eimer, 1871
; Giacometti and Machida, 1965
; Halata, 1972
; Quilliam, 1966
; Shibanai, 1988
; Van Vleck, 1965
). Eimer’s organs are epidermal specializations associated with encapsulated corpuscles, Merkel cell-neurite complexes, and free nerve endings (Catania, 1995a,b, 1996
; Halata, 1972
; Marasco and Catania, 2007
; Marasco et al., 2007
) that are represented in a continuum of specialization ranging from examples of least to most specialized (eastern and star-nosed moles, respectively; Catania, 1995a
).
Although insectivore rhinariums function as specialized somatosensory adaptations in many respects, little is known about the olfactory capabilities of insectivores beyond their disproportionately large olfactory bulbs and piriform cortex (Stephan et al., 1991
). It has been suggested that the main olfactory bulb is more developed in terrestrial, subterranean, and fossorial insectivores than in semiaquatic species (Stephan et al., 1991
). This may account for the star-nosed mole, the only semi-aquatic insectivore species of the 5 examined in the present study, representing an outlier in the present comparison between olfactory bulb mass and neuronal density (Figure 4
B). Yet despite the decreased neuronal density in the olfactory bulbs of star-nosed moles this species possesses the remarkable adaptation of underwater olfaction that, thus far, has only been documented in star-nosed moles and one other semi-aquatic insectivore species, the water shrew (Catania, 2006
). Indeed, the star-nosed mole has approximately the same olfactory bulb mass as (and comparable body mass to) the hairy-tailed mole, a fossorial insectivore, yet hairy-tailed moles have an average of nearly 160% of the olfactory bulb neurons of star-nosed moles, and approximately 130% of the neuronal density (Table 2
). Furthermore, across the five insectivore species studies, despite the olfactory bulbs representing a percentage of total brain mass similar to that of the hippocampus, the olfactory bulbs contain approximately twice the percentage of total brain neurons, further reinforcing the principle that the relative size of a brain structure does not necessarily reflect relative number of neurons that it contains.
The authors declare that the research was conducted in the absence of any commercial or financial relationships that could be construed as a potential conflict of interest.
We would like to thank Christine Collins for helpful discussions regarding methodology, and Jessica Wenzler for technical assistance. This research was supported by NIH grant #DE014739 and NSF grant #0844743 to Kenneth C. Catania as well as FAPERJ Jovem Cientista and CNPq – Edital Universal awarded to Suzana Herculano-Houzel.
Tower, D. B. (1954). Structural and functional organization of mammalian cerebral cortex; the correlation of neurone density with brain size; cortical neurone density in the fin whale (Balaenoptera physalus L.) with a note on the cortical neurone density in the Indian elephant. J. Comp. Neurol. 101, 19–51.