What are the effects of severe visual impairment on the cortical organization and connectivity of primary visual cortex?
1
Center for Neuroscience, University of California, Davis, USA
2
Department of Ophthalmology and Vision Science, University of California, Davis, USA
3
Department of Psychology, University of California, Davis, USA
The organization and connections of the primary visual area (V1) were examined in mice that lacked functional rods (Gnat−/−), but had normal cone function. Because mice are nocturnal and rely almost exclusively on rod vision for normal behaviors, the Gnat−/− mice used in the present study are considered functionally blind. Our goal was to determine if visual cortex is reorganized in these mice, and to examine the neuroanatomical connections that may subserve reorganization. We found that most neurons in V1 responded to auditory, or some combination of auditory, somatosensory, and/or visual stimulation. We also determined that cortical connections of V1 in Gnat−/− mice were similar to those in normal animals, but even in normal animals, there is sparse input from auditory cortex (AC) to V1. An important observation was that most of the subcortical inputs to V1 were from thalamic nuclei that normally project to V1 such as the lateral geniculate (LG), lateral posterior (LP), and lateral dorsal (LD) nuclei. However, V1 also received some abnormal subcortical inputs from the anterior thalamic nuclei, the ventral posterior, the ventral lateral and the posterior nuclei. While the vision generated from the small number of cones appears to be sufficient to maintain most of the patterns of normal connectivity, the sparse abnormal thalamic inputs to VI, existing inputs from AC, and possibly abnormal inputs to LG and LP may be responsible for generating the alterations in the functional organization of V1.
The importance of sensory input to the developing brain is manifest in individuals with congenital loss of a sensory system, such as deafness or blindness. In addition to the obvious loss of abilities associated with the affected sensory system, previous studies demonstrate that sensory behaviors mediated by the remaining systems are enhanced (e.g. see Bavelier and Neville, 2002
; Pascual-Leone et al., 2005
; Bavelier et al., 2006
; Collignon et al., 2009
for review), indicating that functional reorganization occurs at one or more levels of the nervous system. This idea is supported by recent non-invasive imaging studies in humans that demonstrate the neocortex associated with the lost sensory system becomes activated by the spared modalities. For example, studies in blind humans indicate that auditory localization tasks activate occipital cortex in regions normally involved in visual localization and motion detection (Weeks et al., 2000
), and that occipital cortex is activated with electrotactile stimulation of the tongue (Ptito et al., 2005
), Braille reading and vibrotactile stimulation (Sadato et al., 1996
; Burton et al., 2002
, 2004
). While all of these studies demonstrate dramatic cross-modal plasticity, the anatomical substrate for this plasticity is not completely understood (see Karlen et al., 2010
for review).
To date, animal models of congenital blindness generally examine the effects of complete loss of activity, or loss of the sensory apparatus, on cortical and subcortical structures. These studies have shown that the neocortex undergoes dramatic organizational changes in that cortex normally devoted to processing visual input is taken over by the spared sensory systems (e.g. Yaka et al., 1999
; Izraeli et al., 2002
; Kahn and Krubitzer, 2002
; Piche et al., 2007
). Further, studies of connections indicate that the primary visual area (V1) receives inputs from a variety of non-visual cortical and subcortical structures associated with the spared modalities (Izraeli et al., 2002
; Karlen et al., 2006
).
While these studies demonstrate the dramatic functional and anatomical changes that occur with complete loss of vision, they are not necessarily appropriate models for the changes that may occur with many forms of human blindness. In fact, a more clinically relevant issue is the effect of limited vision during development since most “blind” humans are severely visually impaired and do not have a complete loss of vision. The question we address in this study is: What are the effects of limited visual experience on the global organization and connectivity of primary visual cortex?
To address this question we have used rod transducin-α knockout mice (Gnat−/−) that lack rod-mediated vision but have spared cone-mediated vision. Since most visually mediated natural behavior relies on rod vision in the nocturnal mouse, lack of rod photoreceptor function constitutes a major sensory loss, with a minimal sparing of vision, as seen in many forms of human blindness. Despite the rearing conditions of both our mutant mice and our controls (12-h light/dark cycle) and the limited visual experience of laboratory mice compared to mice reared in a completely natural environment, the generalization of our model to some forms of human blindness is appropriate given the observed effects on visually mediated behavior that this mutation produces (Hunt et al. 2007
). In a related study, we examined the visually mediated behavior of both normal and Gnat−/− mutants at different light levels. We find that although rearing conditions of both normal and Gnat−/− mutants are somewhat different than their natural environment, there were very large differences in their visually mediated behavior under low light conditions (e.g. natural environmental conditions). Normal mice can perform visually mediated acuity tasks under bright lights, as can our mutant mice in which the cones are fully functional. What is extraordinary is that under very dim light conditions, control mice can perform acuity tasks very well and very rapidly, while the Gnat−/− mice could not perform these tasks at all. Thus they are severely visually impaired under the low light levels in which they naturally live (Hunt et al., 2007
).
In the present study we used multi-unit electrophysiological techniques to assess the global organization of the primary visual area in Gnat−/− mice combined with neuroanatomical tracing techniques to uncover the anatomical basis for the functional organizational changes observed in these visually impaired animals.
Animals
Seven normal (C57BL6; Charles River) and eight transducin-α knockout mice (Gnat−/−; Calvert et al., 2000
) aged 3–6 months were used in these experiments. Four of the seven normal animals and five of the eight knockout mice were used to study the cortical, callosal and thalamocortical connections of V1. Only cases in which injections were restricted to area 17 and included all cortical layers were used. Injections that were too deep and invaded underlying subcortical structures were not used in this study. Three normal mice and three knockout mice were used to examine the sensory domain allocation of V1 and surrounding cortex.
In the Gnat−/− mice, rod photoreceptor activity has been silenced by the genetic deletion of the alpha subunit of the heterotrimeric G-protein, transducin (Gtα). Unlike many other knockouts that abolish or severely attenuate rod phototransduction (e.g. PDEγ −/−Tsang et al., 1996
; rhodopsin −/−, Humphries et al., 1997
; RPE65 −/−, Redmond et al., 1998
; Lem et al., 1999
), the lack of Gtα in these mice is not associated with photoreceptor degeneration. Individual rod photoreceptors of Gnat−/− mice fail to respond to light, indicated by the fact that the corneal ERG completely lacks the rod-mediated signals (Figure 1
), and yet loss of Gtα does not cause significant changes in retinal circuitry (Calvert et al., 2000
).
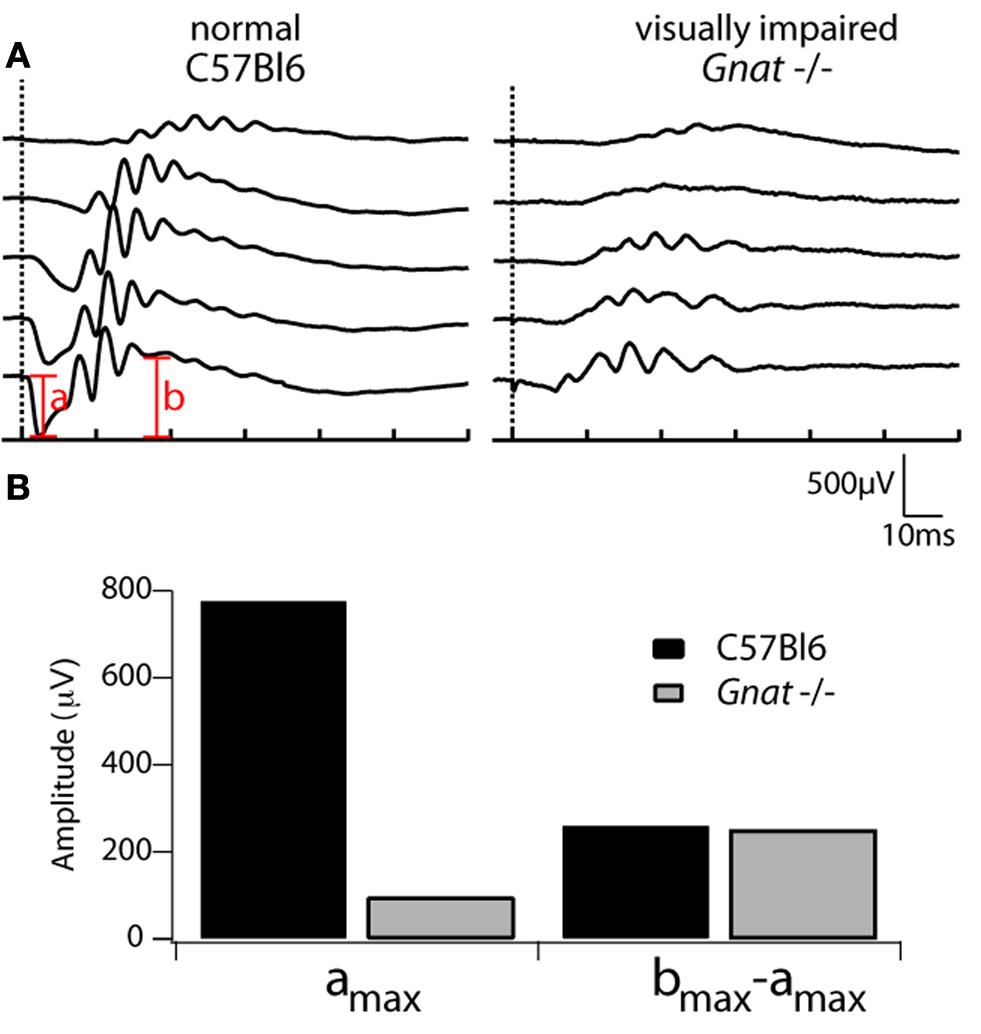
Figure 1. ERG recordings in C57Bl6 and Gnat−/− mice. (A) Electroretinogram (ERG) recordings from a C57Bl6 control mouse and a Gnat−/− mouse. Brief (2 μs) flashes of 500 nm light (10 nm FWHM) were delivered at the time indicated by the vertical dashed lines. Light intensities activated 5–158,000 rhodopsins (R*)/flash and varied by 1.2 log units (normal) but much brighter flashes were needed for Gnat−/− mice, activating from 5,000–5 × 10⁶ R*/flash. The a-wave, which is primarily mediated by rods (“a”) and b-wave, which is primarily mediated by ON-bipolar cells (“b”), are indicated in red. (B) Comparison of maximal a-wave and normalized b-wave amplitudes averaged from two wild type and two Gnat−/− mice. amax was measured from the pre-flash baseline to the peak of the a-wave at the brightest flash strength. Because there is minimal a-wave in Gnat−/− mice, bmax comparison was made from the pre-flash baseline to the peak of the b-wave over a similar range of light intensities (bmax–amax).
Furthermore, Gnat−/− mice perform well on behavioral measures of visual function in full light, consistent with cone photoreceptor mediated vision (Sampath et al., 2005
), but are severely impaired in visually mediated behavior at low light intensities, consistent with rod photoreceptor mediated vision (Hunt et al., 2007
). Thus, the essential role for Gtα in rod function and the known limited changes in retinal circuitry make these animals an ideal model to examine the cortical consequences of severe congenital visual impairment, with some light perception, a condition similar to that of most legally blind individuals. The Gnat−/− mice are of a mixed SV129/BALB/c background. Much of the work on rod photoreceptor physiology has been obtained using C57BL6 and Sv129 strains, which do not show any obvious differences in photoreceptor sensitivity (Tsang et al., 1998
). There is very little known about strain-related differences in cortical connectivity and functional organization, but there is some recent data that indicates that different strains of mice have some differences in the size and shape of the posteromedial barrel subfield and V1 (Airey et al., 2005
; 2006
). However, these types of changes in shape and size could not account for the large differences in functional within-area organization observed between normal and Gnat−/− mice in the present study. In addition, given the remarkable similarity between the functional organization and connectivity of V1 in two different rodent species such as mice and rats, it is unlikely that strain differences would produce greater differences in the phenotype than species differences.
All animals were treated in accordance with institutional and NIH guidelines for the Care and Use of Laboratory Animals and all protocols were approved by the Institutional Animal Care and Use Committee (IACUC) at UC Davis. C57BL6 mice were obtained from Charles River and transducin-α knockout mice were given to us by Dr. Janis Lem (Tufts University), and are currently maintained in a breeding colony at UC Davis. All mice are kept on a 12-h light/dark cycle.
Electroretinograms
Electroretinograms (ERGs) were performed on five normal and Gnat−/− mice. All mice were dark-adapted overnight and corneal ERGs were recorded as reported previously (e.g. Lyubarsky et al., 1999
). Briefly, while in the dark, mice were anesthetized with ketamine hydrochloride (50 mg/kg IM) and xylazine (10 mg/kg IM), and placed on a warmed platform in the light path. The pupil of one eye was dilated with one drop of 1% tropicamide (Bausch & Lomb, Tampa, FL, USA). The cornea was bathed in sterile methylcellulose solution (Goniosol, Iolab Pharmaceuticals, Claremont, CA, USA), and then a coiled 0.01 mm platinum wire was gently placed on the cornea. A tungsten electrode (0.01-mm diameter, 5MW; A–M systems, Inc., Sequim, WA, USA) was inserted subcutaneously on the forehead and served as the reference. Brief (2 ms) dim flashes of 500 nm light of calibrated intensities were delivered through a light guide held 4–6 cm from the eye and terminating in a ganzfeld dome. The light was calibrated using a silicon photodiode (UDT Instruments, Orlando, FL, USA). The elicited potentials were amplified, lowpass filtered (Butterworth, 1 kHz cutoff frequency; CWE Inc., Ardmore, PA, USA), and digitized (1322A; Axon Instruments, Sunnyvale, CA, USA) at 5 kHz.
Multi-Unit Electrophysiological Recordings
Electrophysiological recordings were performed on three normal mice and three Gnat−/− mice (3- to 6-months old), and procedures used were similar to those previously described by Hunt and colleagues (Hunt et al., 2006
). At the beginning of these experiments, mice were anesthetized using urethane (1.25 g/kg, IP) and given atropine (0.04 mg/kg, IM), dexamethasone (2 mg/kg, IM) and doxopram hydrochloride (20 mg/ml, IM). During all surgical procedures, body temperature, heart rate, and respiration rate were monitored and hydration was maintained with subcutaneous injections of Ringers solution every 3–5 h. The head was stabilized for electrophysiological recordings by making a small hole in the skull and inserting a screw into the hole, gluing the screw in place, and then attaching it to a metal bar, which was attached to a magnetic stand on the surgical table. Once the head was stabilized, a large portion of skull over visual cortex and adjacent somatosensory cortex was removed. A digital image of the exposed cortex was taken (Pixera Corporation, Los Gatos, CA, USA) to relate electrode penetrations to the cortical vasculature pattern.
A tungsten microelectrode (1–5 MΩ at 1 kHz) was used to make recordings 200–400 microns from the pial surface, in layer 4 of cortex. Neural activity was amplified, filtered, and then heard through a loudspeaker and visualized on an oscilloscope. Electrode penetrations were made at multiple sites across the neocortex. Stimulus preference at each recording site was noted and receptive fields were drawn for sites responsive to somatosensory stimulation. Visual stimuli included full-field flashes, moving bars or circles of light, or full-field illumination turned on and off. Auditory stimuli included clicks and tones presented full-field. Somatosensory stimuli were applied to the skin with a fine probe or brush for cutaneous receptors or taps to the body, muscle manipulation and displacements of limbs and joints for deep receptors. All stimuli were tested at every recording site. Selected sites were marked using a fluorescent dye (10% FluoroRuby; Invitrogen, Carlsbad, CA, USA) for later identification in the histological processed tissue to aid in aligning sections.
At the end of the recording session the animal was euthanized with an overdose of sodium pentobarbital (Beuthanasia, 250 mg/kg, IP) and transcardially perfused with 0.9% saline, followed by 4% paraformaldehyde in 0.1 M phosphate buffer, pH 7.4 (PB). The brain was removed from the skull and the cortex was separated from the brainstem and thalamus and flattened between two glass slides. The tissue was post-fixed overnight in 4% paraformaldehyde, 30% sucrose in PB.
Neuroanatomical Tracer Injections
For these experiments, mice were anesthetized with isoflorane (1–2% with 1 l O2/min), given atropine (0.04 mg/kg, IM) and dexamethasone (2 mg/kg, IM) and placed in a stereotaxic frame. During the surgical procedure sterile conditions were used and body temperature, heart rate, and respiration rate were monitored. An incision in the skin over the midline of the skull was made and a small hole was drilled over V1 of each hemisphere. Neuroanatomical tracers, 0.4 ul of 10% solutions for each tracer, were pressure injected using a glass micropipette attached to a picospritzer (General Valve Corp., Fairfield, NJ, USA). The injection was centered in layer 4 (200–400 μm below the pial surface), and analysis of histological tissue indicated that the core of the injection included all cortical layers (see below). In one hemisphere two different fluorescent tracers, FluoroEmerald (FE; Invitrogen, Carlsbad, CA, USA) and FluoroRuby (FR; Invitrogen, Carlsbad, CA, USA), were injected at two different sites, and one tracer, biotinylated dextran amine (BDA; Invitrogen, Carlsbad, CA, USA) was injected in the other hemisphere. These tracers are transported both retrogradely and anterogradely in 1 week and cause little or no necrosis.
One week following the injection of anatomical tracers, the mice were euthanized and perfused as described above. The brain was removed from the skull and the cortex was separated from the brainstem and thalamus and flattened between two glass slides. The tissue was post-fixed overnight in 4% paraformaldehyde, 30% sucrose in PB.
Histology
Flattened cortex was sectioned tangential to the pial surface (30 microns) on a freezing microtome. For electrophysiological experiments the sections were processed for myelin using the protocol described by Gallyas (1979)
. For neuroanatomical tracer experiments alternate sections were mounted for fluorescence microscopy, processed for myelin, or processed for cytochrome oxidase (CO, Wong-Riley and Carroll, 1984
) and BDA, using standard avidin-biotin development (Vectastain Elite; Vector Laboratories, Burlingame, CA, USA).
The brainstem and thalamus was sectioned coronally on a freezing microtome into 40 micron sections and alternate sections were mounted for fluorescence microscopy, stained for Nissl, or processed for CO and BDA as described above.
Data Analysis for Electrophysiological Experiments
To directly relate electrophysiological recording results to architectonic boundaries identified in histologically processed tissue, a camera lucida was used to draw the myeloarchitectonic boundaries for the entire series of sections stained for myelin. These drawings included the tissue outline, artifacts, blood vessels, and the fluorescent probes inserted during the experiment.
The surface blood vessel patterns in the digital images of the cortex were used so that the relative location of recording sites to each other, and fluorescent probe marked locations could be appreciated. Histological sections that contain areal boundaries, fluorescent probes and some of the recovered recording sites were stacked using blood vessels that run perpendicular to the pial surface. In this way the entire series of sections is used to determine architectonic boundaries and related these boundaries to electrophysiological recording sites. This method has been used by our own laboratory and a number of other laboratories when generating global maps in the visual, somatosensory, auditory and motor cortex in a variety of mammals (e.g. Hunt et al., 2006
; Campi et al., 2007
; Burish et al., 2008
).
Data Analysis of Neuroanatomical Tracer Experiments
In all cases, neuroanatomical results were related to architectonic boundaries identified in histologically processed tissue (e.g. Krubitzer and Calford, 1992
; Kahn et al., 2000
; Karlen et al., 2006
). Briefly, a fluorescent microscope attached to an Accustage MD3 digitizer and a PC equipped with MD Plot software (Accustage, Shoreview, MN) was used to plot injection sites, labeled cell bodies and areas containing axon terminals in the cortex and thalamus for the entire series of sections mounted for fluorescence microscopy and processed for CO-BDA. Injection sites included the dense core of label at the center of the site as well as the halo of cells around the site. A detailed account of injection site identification has been previously described (Krubitzer et al., 1998
). The full extent of the area containing axon terminals was plotted but the density of the terminals was not measured and in many cases was not uniform in density across the entire area. The plots also included tissue outlines and blood vessels. Plots of the entire series of sections, from pial surface to white matter were used to make our reconstructions. A camera lucida attached to a Zeiss Stemi SV6 stereoscope was used to determine areal borders for the fluorescent composites by matching blood vessels and tissue outlines using the entire series of myelin stained sections of each hemisphere. Only injections that included all cortical layers, but not underlying subcortical structures or white matter were used. The entire series of sections from the fluorescent plots with architectonic boundaries was made into a single composite by matching blood vessels, probes and tissue artifacts, and a comprehensive reconstruction of each hemisphere was made. These reconstructions contained tissue outline, injection sites, labeled cell bodies, and architectonic boundaries.
For the thalamus, individual fluorescent sections were plotted for the entire series as described above. For each section, CO stained tissue, and adjacent sections stained for Nissl were used to delineate architectonic boundaries of thalamic nuclei. For the cortex and the thalamus, all labeled cells in each area of the cortex or nuclei of the thalamus were counted and were expressed as a percentage of the total number of cells found in the hemisphere or in the thalamus (Figure 5
).
Electroretinograms (ERGs)
Corneal electroretinography is a standard, non-invasive method for assessing retinal function in vivo. In these studies we recorded ERGs from five normal (C57BL6) and Gnat−/− mice that were subsequently used for electrophysiological and/or anatomical studies. One representative family of responses from these mice is shown in Figure 1
. Unlike the ERGs observed in normal mice, Gnat−/− mice completely lack the a-wave and rod b-wave (middle traces, Figure 1
), while the cone-mediated responses to brighter flashes are unaffected. These results confirm results from previous studies (Calvert et al., 2000
).
Electrophysiological Recording and Architectonic Analysis
The goal of our electrophysiological recording experiments was to generate global maps of V1 and determine if neurons in V1 of Gnat−/− mice responded exclusively to visual stimulation, as they do in normal mice, or if neurons responded to more than one modality of stimulation. Thus, we did not attempt to define the topographic organization of V1 in these studies. Further, given the lack of rod function and their behavioral deficits in low light conditions, all stimuli were presented under photopic light conditions. In normal mice, neurons in all but one of three cases responded exclusively to visual stimulation of the contralateral visual field (Figure 2
). Only in one case did neurons at one recording site respond to both visual and somatosensory stimulation. On the other hand, in the three Gnat−/− cases there were only 3 sites in two of the cases (Figure 3
) that contained neurons that responded exclusively to visual stimulation of the contralateral hemifield. Rather, in Gnat−/−mice neurons at most sites responded to auditory stimulation, some sites responded only to somatosensory stimulation and/or auditory stimulation and stimulation of another modality (Figure 3
). There was no apparent organization of modalities into distinct regions of V1. Instead, these unimodal or multimodal neurons were scattered throughout V1. Finally compared to normal animals, there were more sites that contained neurons that were unresponsive to any type of stimulation under our recording conditions.
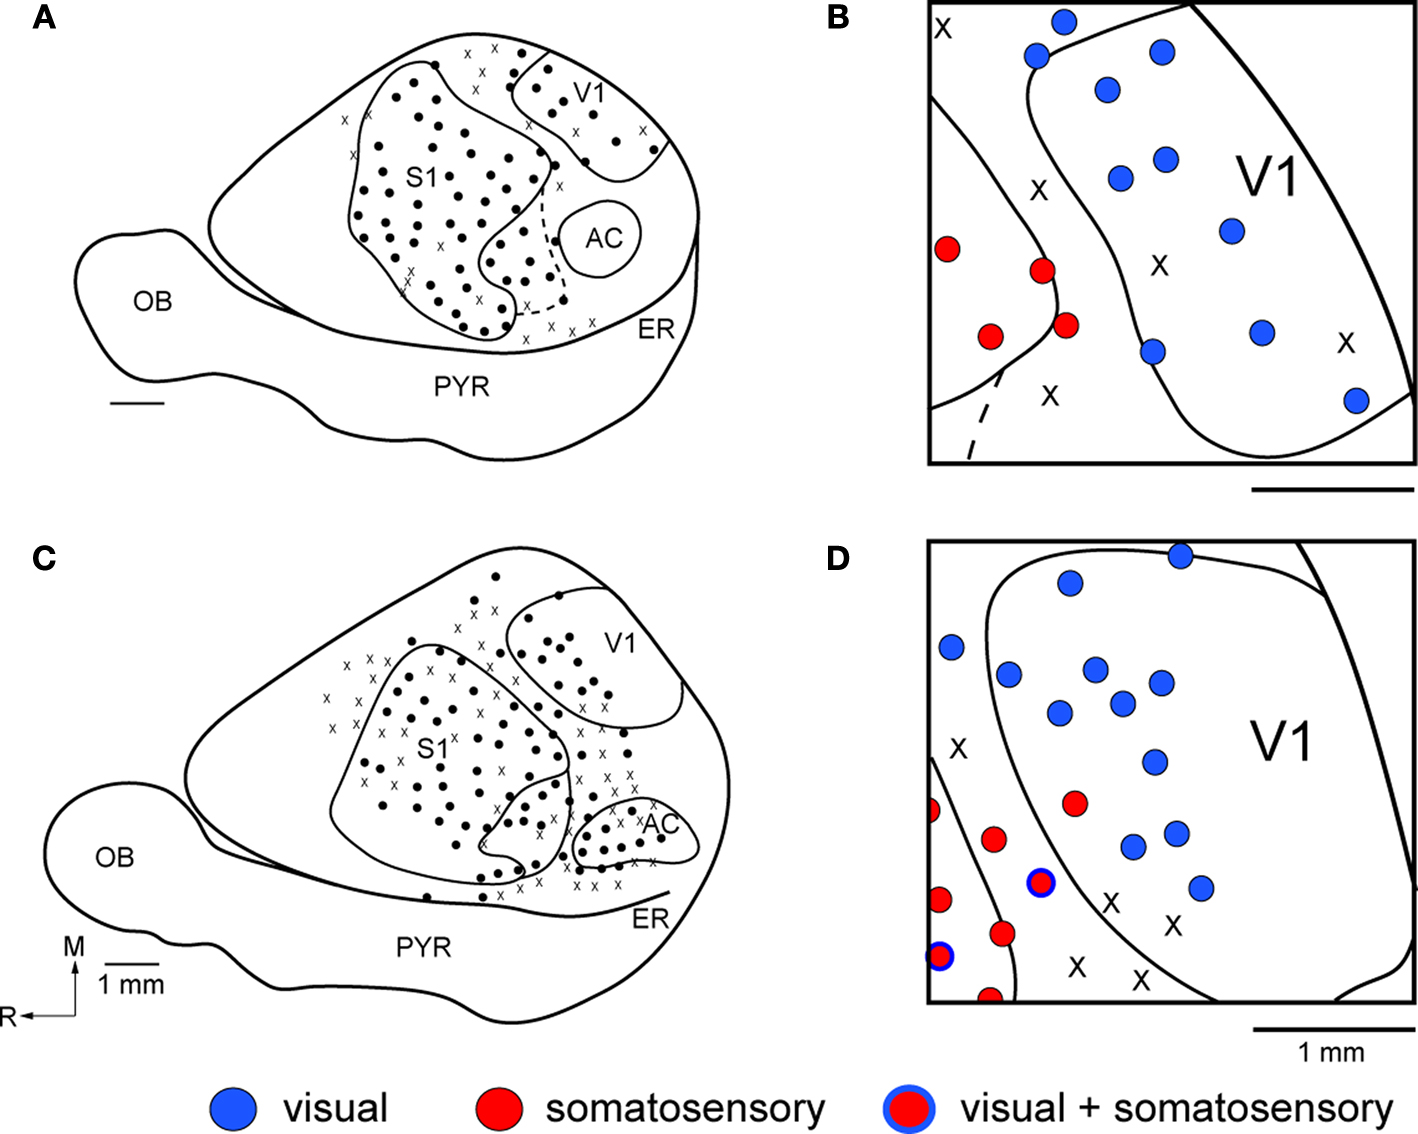
Figure 2. Functional Organization of V1 in Normal Mice. Reconstructions of multi-unit electrophysiological recordings from 2 C57Bl6 mice are shown in which boundaries of primary sensory areas, as determined by myeloarchitecture, are denoted by black lines and recording sites are denoted by black dots indicating the location of recording sites (A,C). Enlargements of the recording sites in visual cortex are shown in which recording sites are denoted by color coded dots indicating the sensory modality mapped to that location (B,D). Neurons in V1 respond solely to visual stimulation, except for one site in which neurons responded to somatosensory stimulation. Medial is to the top and rostral is to the left in all images. X = No Response. Scale bars = 1 mm.
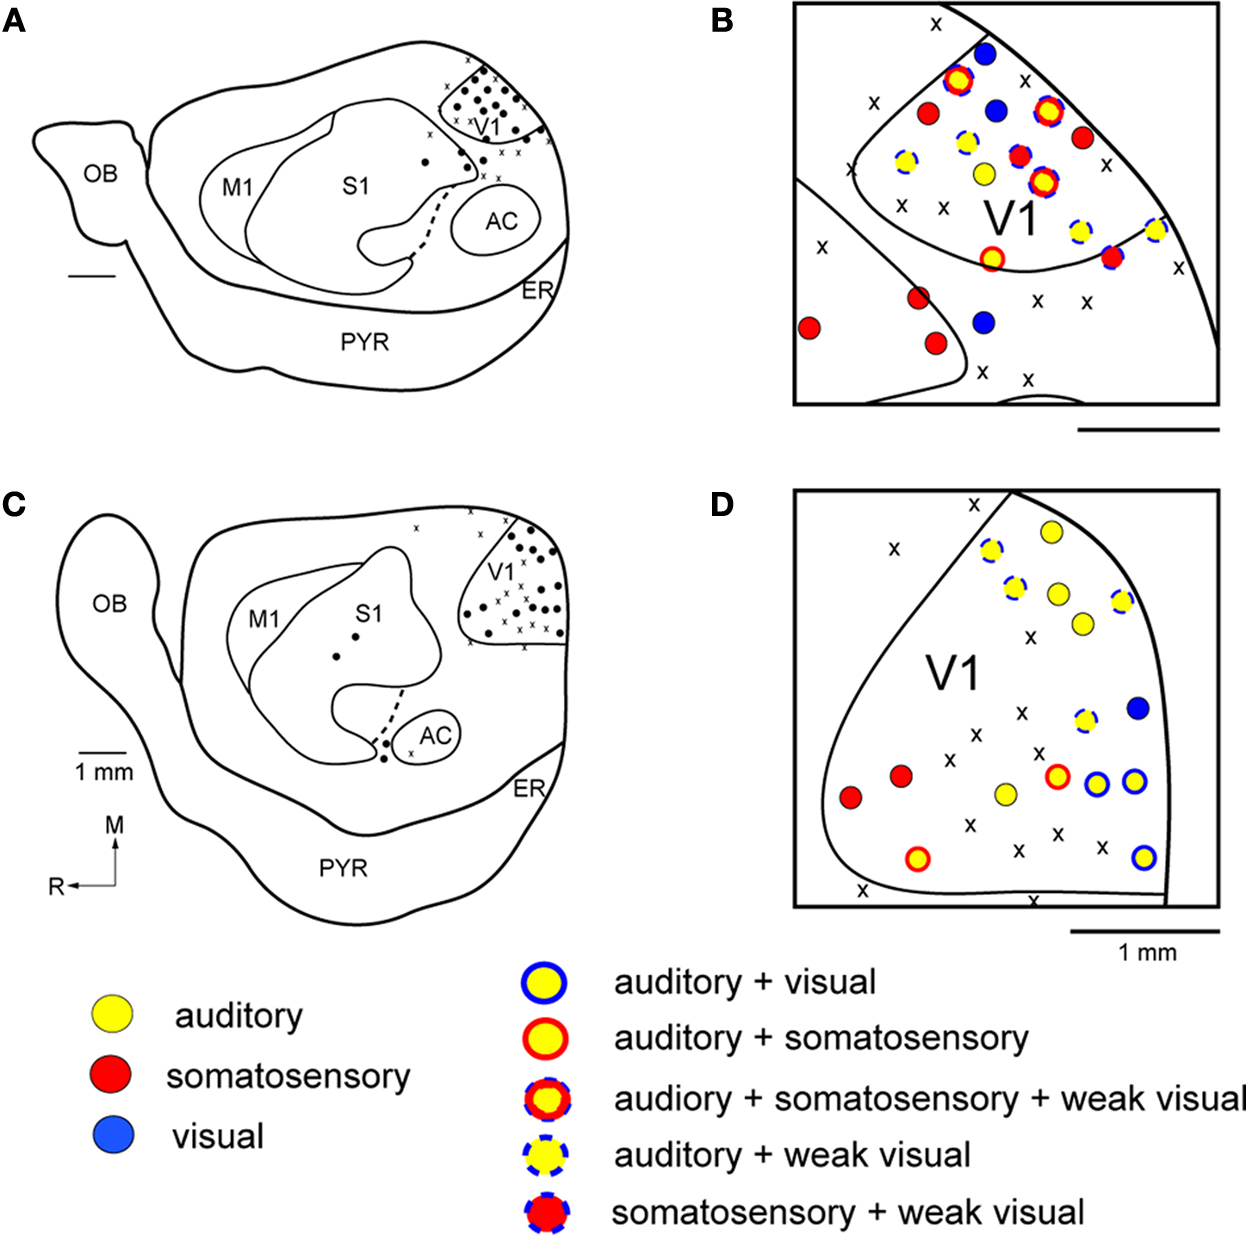
Figure 3. Functional Organization of V1 in Gnat−/− Mice. Reconstructions of multi-unit electrophysiological recordings from 2 Gnat−/− mice are shown in which boundaries of primary sensory areas, as determined by myeloarchitecture, are denoted by black lines and recording sites are denoted by black dots indicating the location of recording sites (A,C). Enlargements of the recording sites in visual cortex are shown in which recording sites are denoted by color coded dots indicating the sensory modality mapped to that location (B,D). Unlike normal animals, in which neurons in V1 respond solely to visual stimulation, in Gnat−/− mice neurons at only a few recording sites responded only to visual stimulation. At most other sites in which neurons were responsive, they responded to auditory stimulation, somatosensory stimulation or some combination of modalities of stimulation. Medial is to the top and rostral is to the left in all images. X = No Response. Scale bars = 1 mm.
Receptive fields for neurons responsive to visual stimulation were not obtained, but in all cases visual stimuli were presented to the contralateral visual field. Receptive fields for neurons responsive to somatosensory stimulation were obtained for neurons in V1 and these were on the contralateral face and vibrissa and were responsive to cutaneous stimulation. However, no apparent somatotopic organization was observed.
In both normal and Gnat−/− mice, electrophysiological recording sites were directly related to tissue stained for myelin (Figure 4
). As described previously for mice and other rodents (see Campi et al., 2009
for review), the primary visual area stains darkly for myelin (Caviness, 1975
; Wagor et al., 1980
). In normal animals, this darkly myelinated region is co-extensive with the primary visual area in which neurons respond almost exclusively to visual stimulation. Previous studies in which receptive fields for neurons were plotted and reconstructed into a comprehensive map demonstrate that there is a complete representation of the contralateral hemifield like that described for V1 in other mammals (e.g. Wagor et al., 1980
). In Gnat−/− mice, neurons in the darkly myelinated region responded to multimodal stimulation.
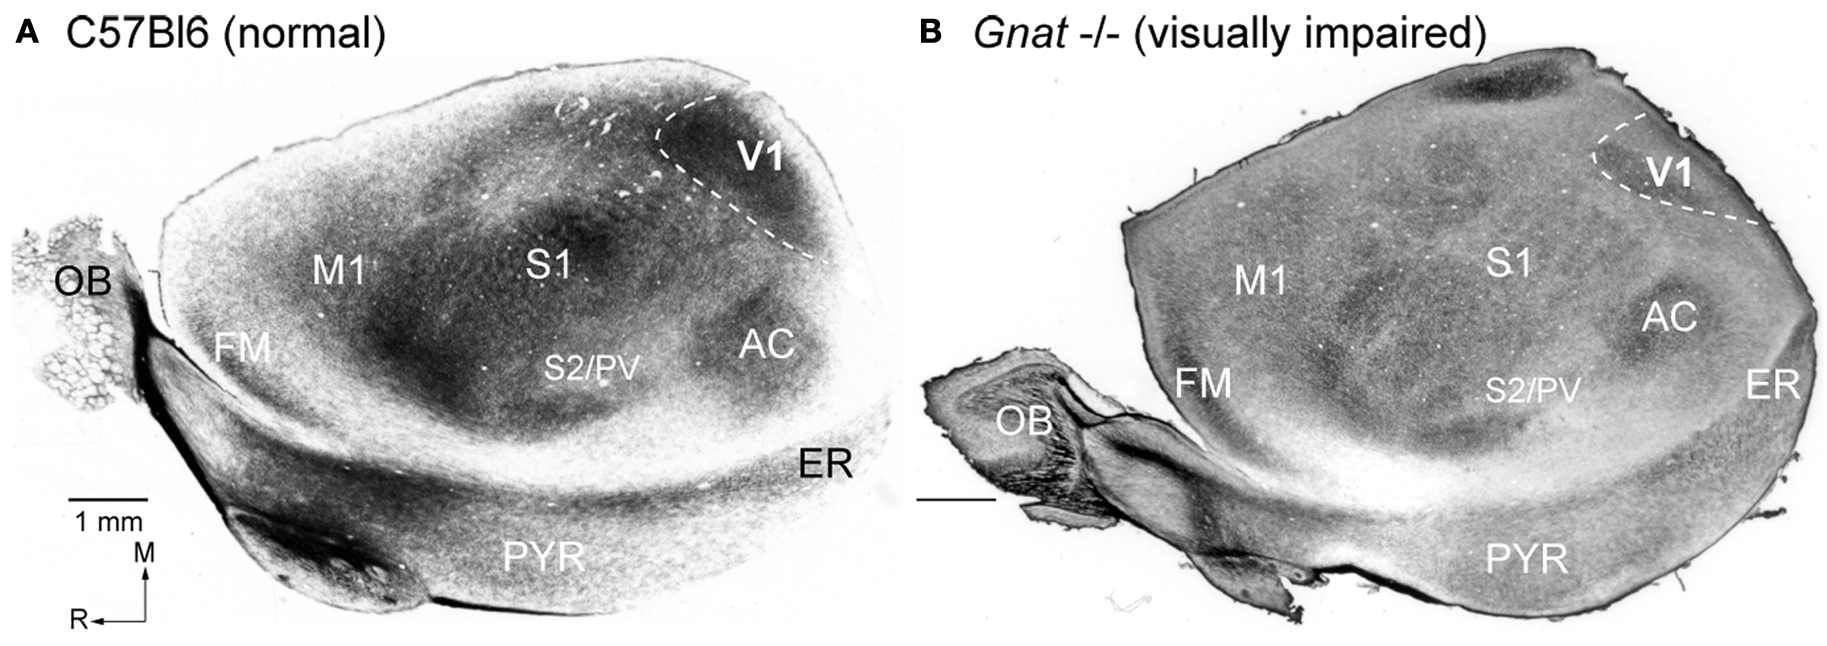
Figure 4. Myeloarchitecture of the Cortex in C57Bl6 and Gnat−/− Mice. Digital images of flattened cortex sectioned tangential to the pial surface and processed for myelin, illustrating some of the cortical area borders in C57Bl6 (A) and Gnat−/− (B) mice. Although cortical field boundaries are determined from the entire series of sections, many of the boundaries of cortical fields can often be observed on a single section. The primary visual area (V1) is the darkly myelinated region at the caudal pole of cortex (dashed white lines). In the Gnat−/− mouse, the rostral boundaries of V1 are clearly visible, but in this particular section the caudal boundaries are not as clear. However, at the caudal pole the dense myelination of layer 4, indicative of area 17 is clearly visible. The primary somatosensory area (S1) is a darkly myelinated region that is interrupted by myelin light regions separating major body parts. Auditory cortex (AC) is a darkly myelinated oval in the temporal pole of the cortex and is co-extensive with several auditory areas including the primary auditory area (A1) and the anterior auditory field (AAF). M1 is a moderately myelinated area just rostral to S1. Medial is to the top and rostral is to the left in all images. Scale bars = 1 mm.
Other regions of cortex were also distinct in sections stained for myelin. These included the primary somatosensory area (S1), auditory cortex (AC), and the primary motor area (M1). The architectonic appearance of S1 has been well described in mice as well as other rodents (Woolsey, 1967
; Nussbaumer and Van der Loos, 1985
; Hunt et al., 2006
). As in other mammals, S1 is a darkly myelinated region that is interrupted by myelin light regions separating major body parts (Figure 4
). AC is a darkly myelinated oval in the temporal pole of the cortex. This region has been well described in a variety of rodents including mice and is co-extensive with several auditory areas including the primary auditory area (A1) and the anterior auditory field (AAF) (Caviness, 1975
; Stiebler et al., 1997
). Finally, M1 is a moderately myelinated area just rostral to S1.
Corticocortical Connections
Injections of neuroanatomical tracers were made in V1 in both normal and Gnat−/− mice. In our comparisons we attempted to match the size and placement of injections within V1 in both groups of mice. Ipsilateral cortical connections of V1 in normal mice that were found outside of the halo of our injection site were predominantly intrinsic with 71.2% ± 3.9% (mean ± SD, Figure 5
) of all labeled cells within the hemisphere found within V1 (Figure 6
). Cortex immediately adjacent to V1 both medially and laterally contained 11.72% ± 1.5% (mean ± SD, Figure 5
) of all labeled cells and these regions are generally associated with visual processing and include areas 18a and 18b (Hall et al., 1971
; Tiao and Blakemore, 1976
; Wagor et al., 1980
; Malach, 1989
). Area 18a is considered by some laboratories to be co-extensive with the second visual area, V2 (See Coogan and Burkhalter, 1993
; Rosa and Krubitzer, 1999
; Wang and Burkhalter, 2007
for alternative schemes of extrastriate cortex). Label in areas 18a and 18b was scattered throughout each field, with only a hint of density differences (e.g. Case 08-81) described in other investigations (e.g. Miller and Vogt, 1984
; Olavarria and Montero, 1984
; Malach, 1989
; Coogan and Burkhalter, 1993
; Wang and Burkhalter, 2007
). Cortex immediately lateral to area 18a also contained labeled cells and this region of cortex is also considered to be associated with visual processing, but has been subdivided differently by different investigators. In two cases, label in lateral visual cortex was most dense at the boundary with area 18a (Case 08-81, Case 08-78). In addition to connections with visual cortex, V1 in all of our normal mice also had sparse projections from AC (1.2% ± 0.4%; mean ± SD, Figure 5
); labeled cells in AC were scattered throughout the field (Figure 6
). Connections were also observed with cortex on the medial wall, just rostral to area 18b. These connections were dense caudally, and tapered to sparse projections rostrally. Sparse connections were observed with cortex just medial to M1, lateral to A1, and in S1 in all three cases. In two cases, sparse connections were observed with entorhinal cortex and in one case connections were observed with a densely myelinated field in frontal cortex just rostral to M1, which we term FM.
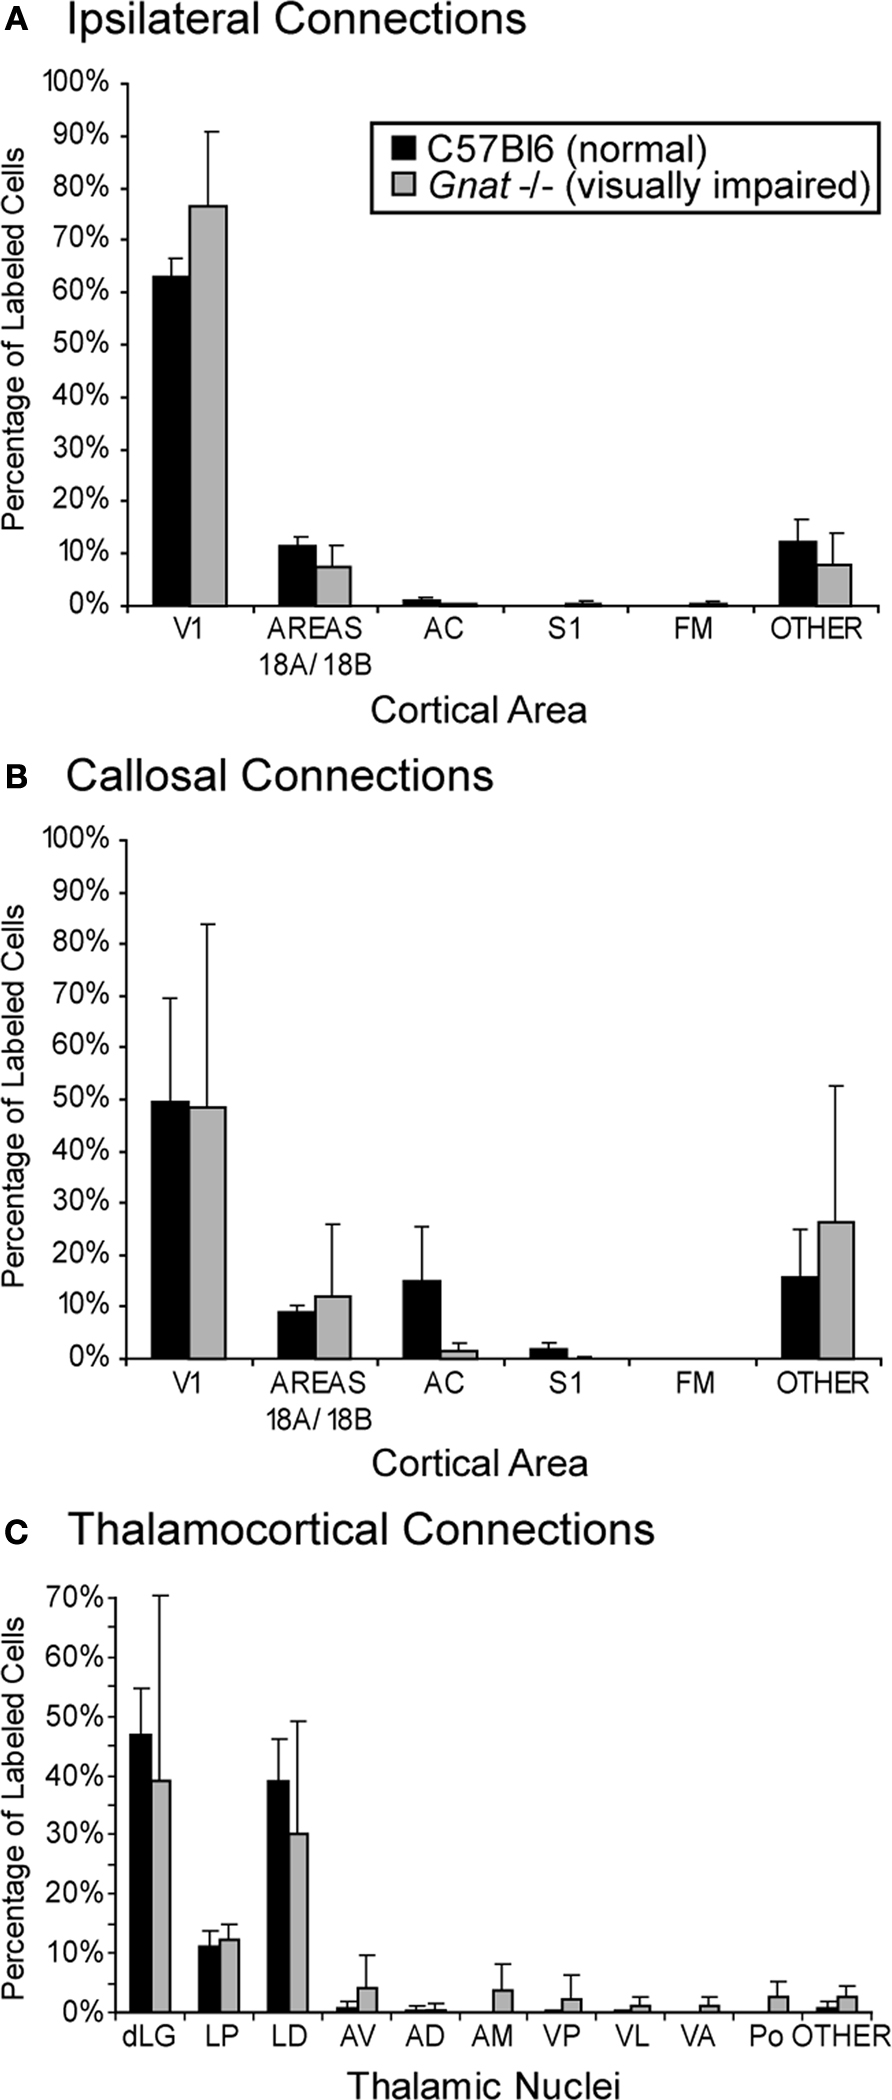
Figure 5. Quantification of Retrogradely Labeled Cell Bodies. Bar graphs indicate the percentage of labeled cells (mean ± SD) in ipsilateral cortex (A), contralateral cortex (B), and thalamus (C) resulting from neuroanatomical tracer injections in V1. Ipsilateral cortical connections of V1 in C57Bl6 and Gnat−/− mice were predominantly intrinsic connections within V1 and connections with areas 18a and 18b. Callosal connections of V1 in C57Bl6 and Gnat−/−mice also showed a large percentage of labeled cells within V1 and areas 18a and 18b. In addition, C57Bl6 mice also showed an intermediate amount of label within auditory cortex. The majority of labeled cells found in the thalamus for C57Bl6 and Gnat−/− mice are found in the thalamic nuclei associated with visual processing (dLG, LP, and LD). In addition to these normal connections, Gnat−/− mice also show inappropriate connections with a number of thalamic nuclei. See Table 1
for list of abbreviations.
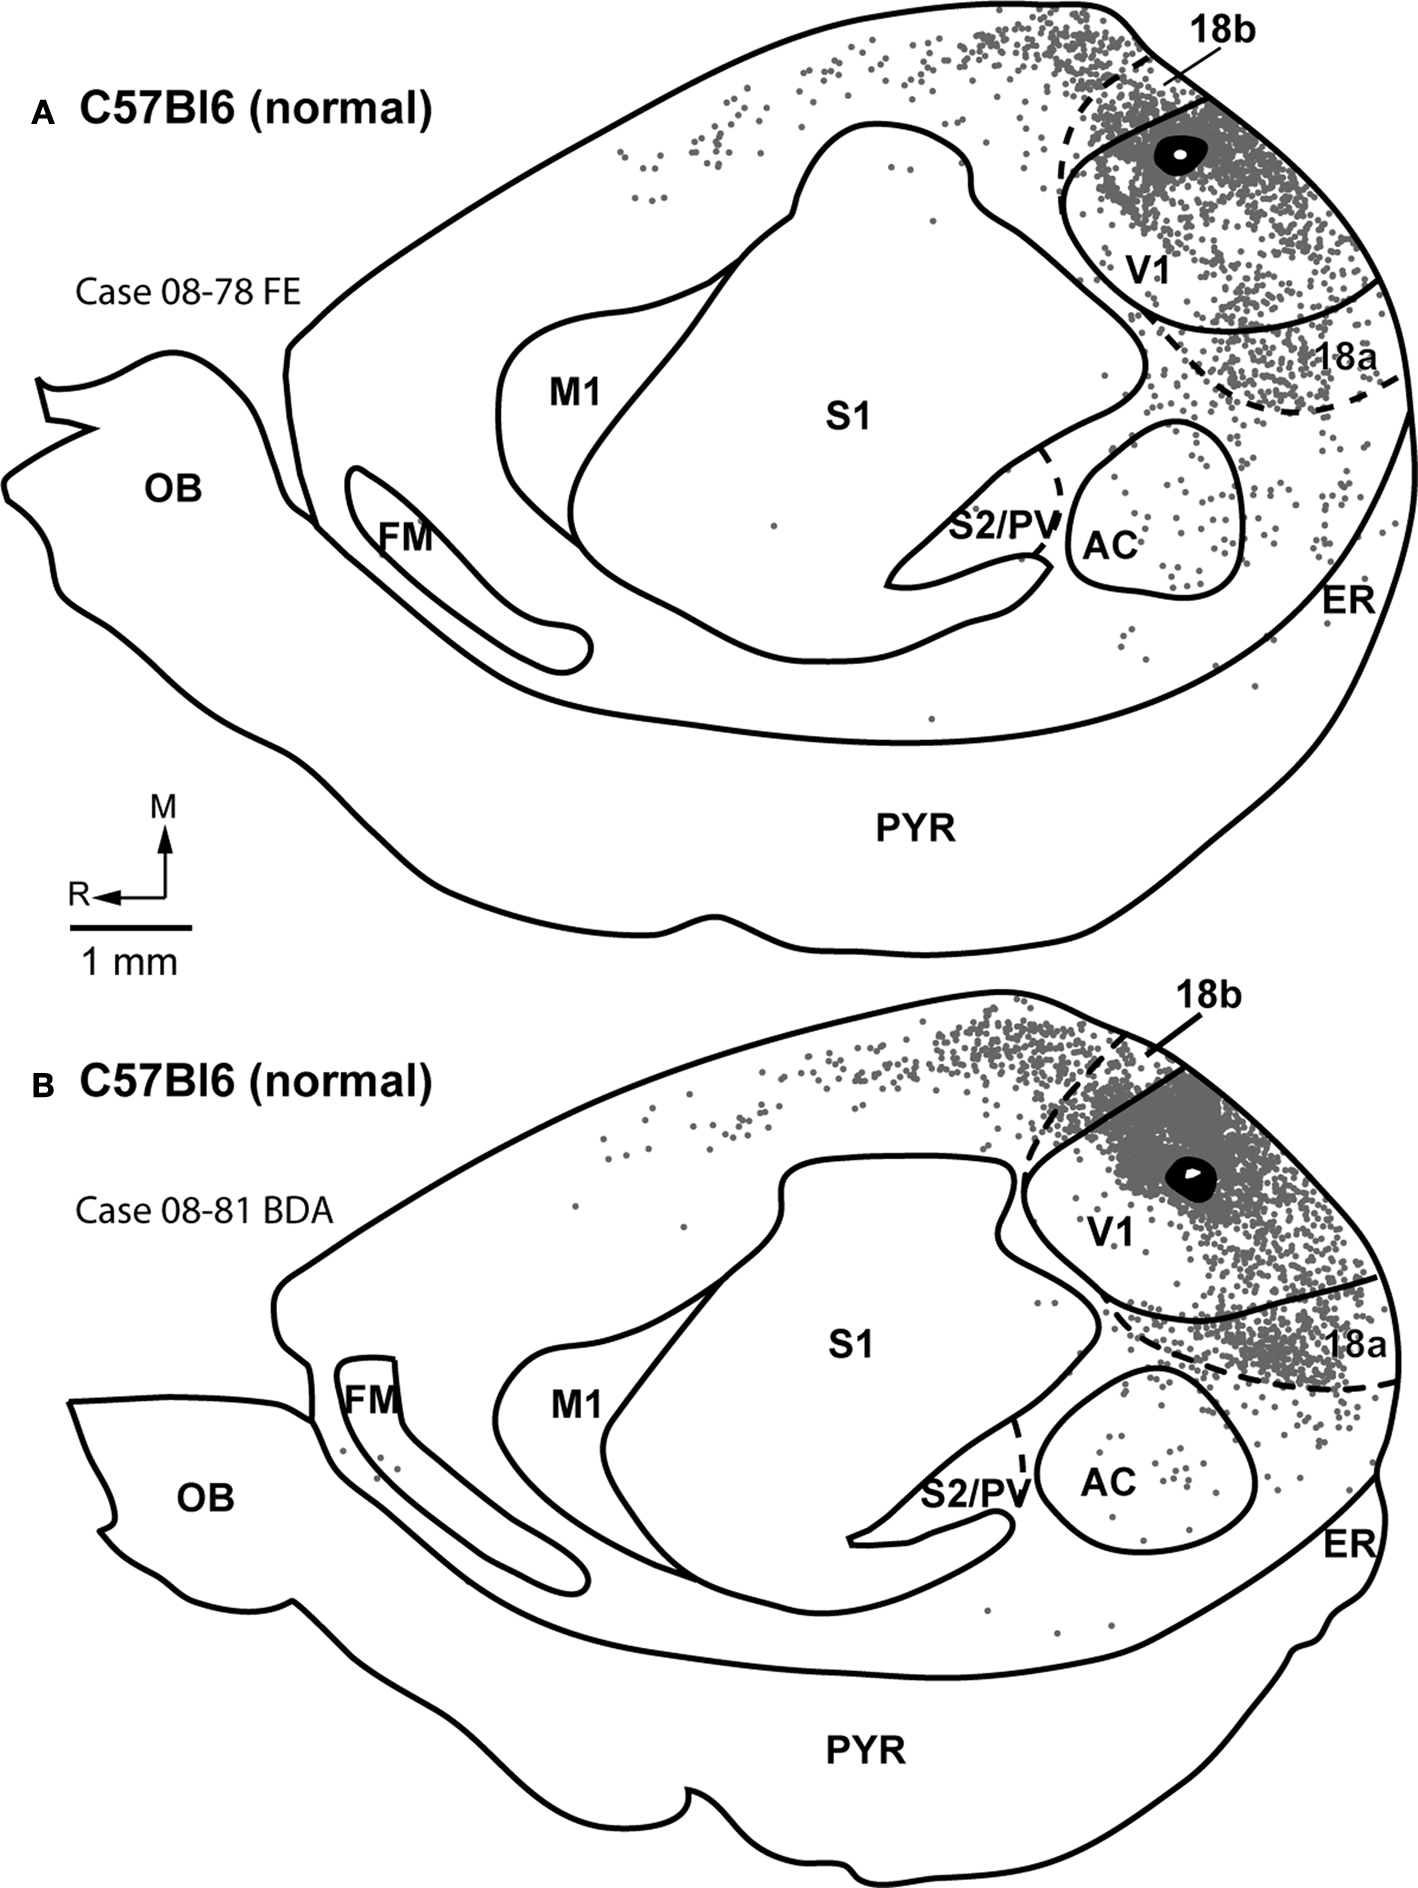
Figure 6. Ipsilateral Cortical Reconstructions of Neuroanatomical Tracer Injections in C57BL6 V1. Reconstructions of cortical connections in C57Bl6 mice (A,B) showing the location of retrogradely labeled cell bodies from neuroanatomical tracer injections in V1 relative to the architectonically defined cortical fields. The dots mark the locations of labeled cell bodies. The locations of the injection sites are marked by black ovals and cortical field boundaries are represented by the thin black lines and dashed lines denote approximate boundaries. Labeled cells are located primarily in V1 and in extrastriate cortex including Area 18a and 18b. Medial is to the top and rostral is to the left in all images. See Table 1
for list of abbreviations. Scale bar = 1 mm.
Patterns of corticocortical connections in Gnat−/− mice were similar to those of normal mice (Figure 7
). The majority of V1 connections were from other portions of V1 (82.2% ± 11.8%; mean ± SD, Figure 5
) outside the halo of our injection, and from extrastriate cortex including areas 18a laterally, and area 18b medially (7.4% ± 4.2%; mean ± SD; Figure 5
). These connections were dense in two cases and relatively sparse in two cases. As in normal mice, connections with cortex just lateral to area 18a were relatively dense in two cases and sparse in two cases. Connections were also observed with cortex on the medial wall, just rostral to area 18b. Sparse connections were also observed with AC (0.2% ± 0.3%; mean ± SD, Figure 5
) in three of the four cases and with cortex just medial to M1 in three of the four cases. In two cases, label was identified in S1 and in three cases labeled cells were identified in the heavily myelinated region just rostral to M1 in frontal cortex. Finally, in two cases, entorhinal cortex was moderately labeled.
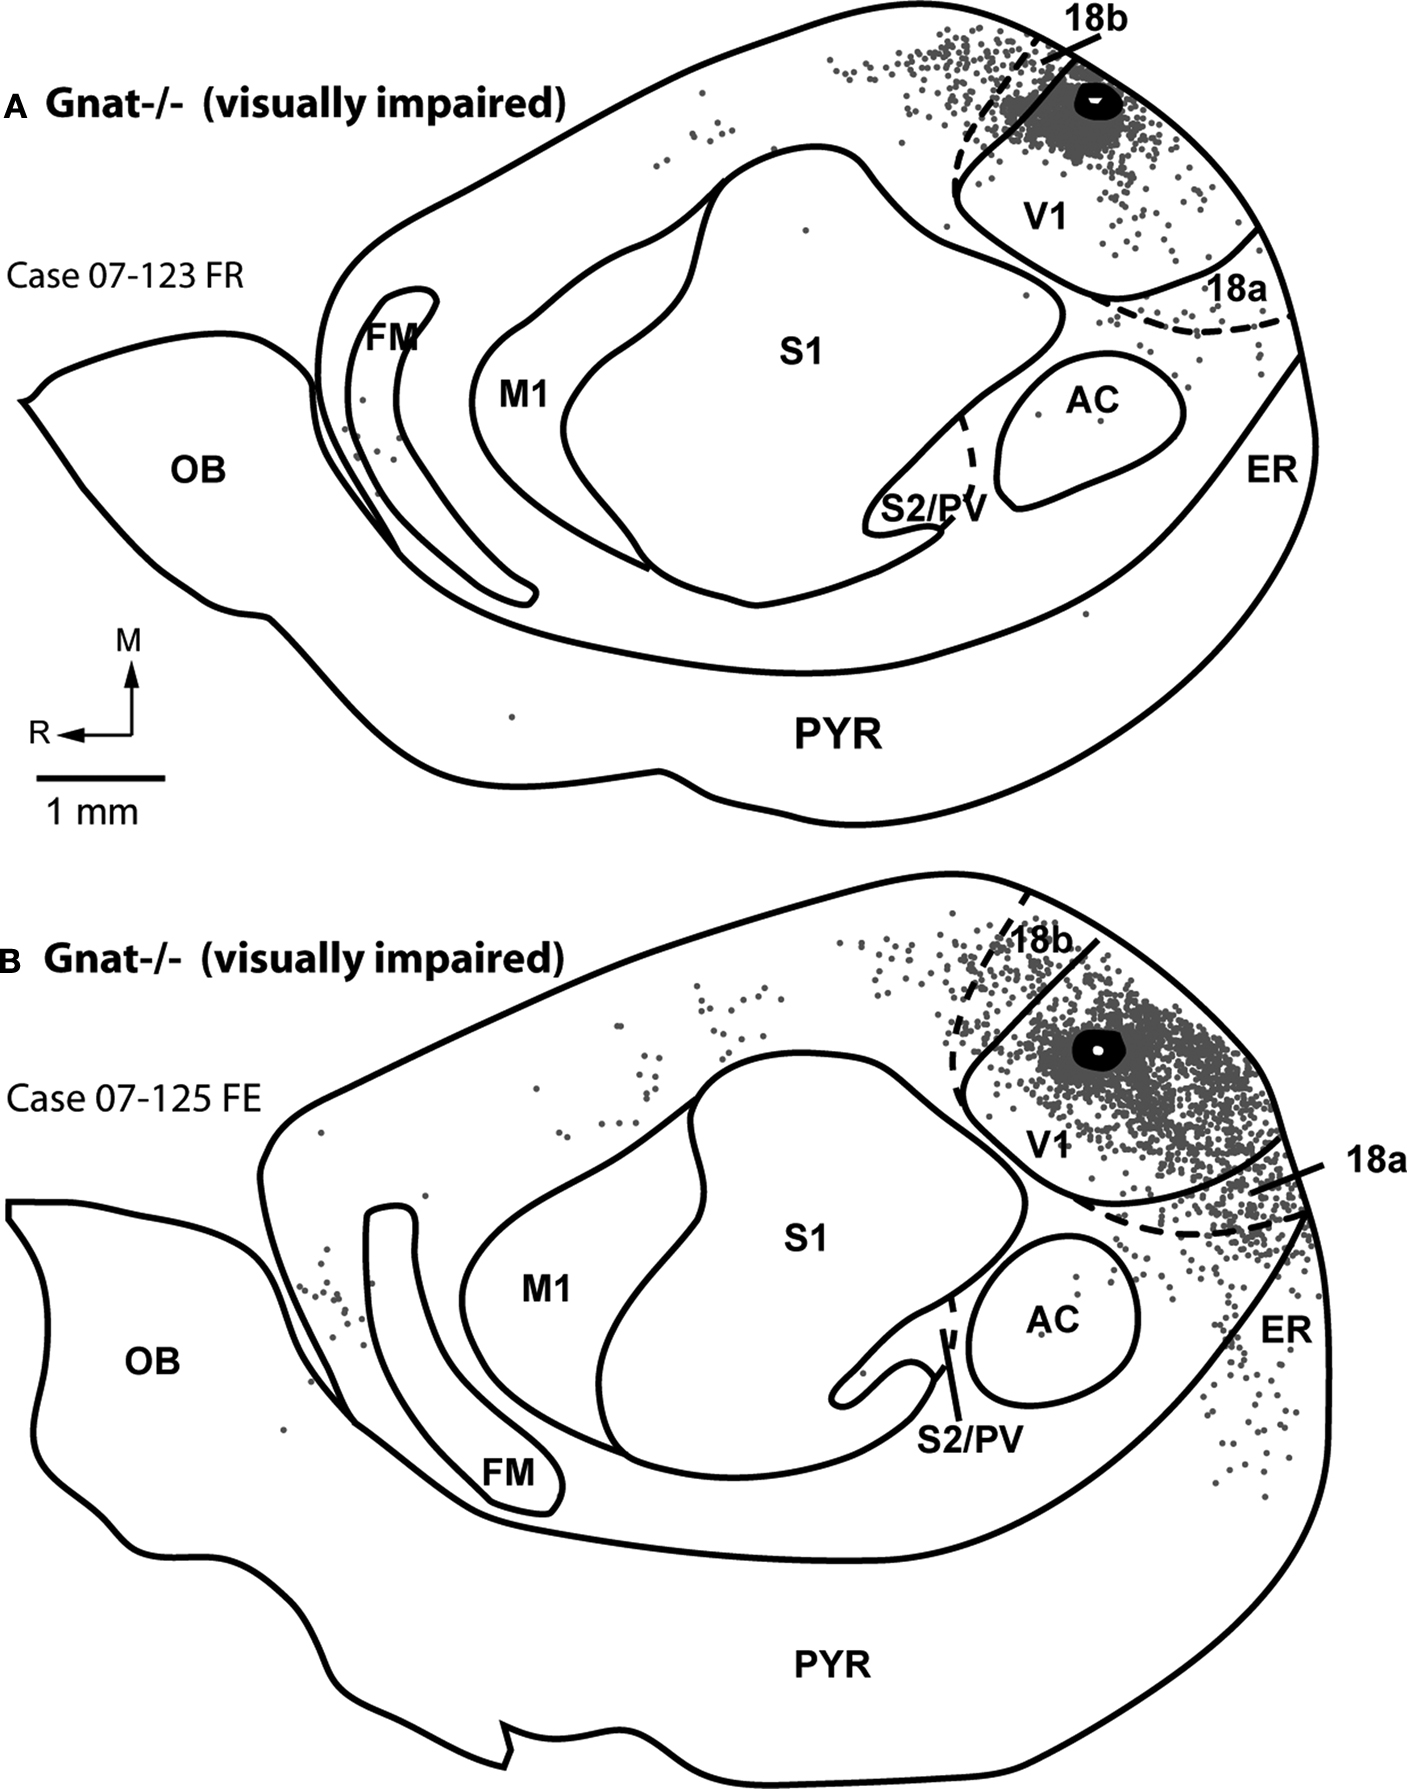
Figure 7. Ipsilateral Cortical Reconstructions of Neuroanatomical Tracer Injections in Gnat−/− V1. Reconstructions of cortical connections in Gnat−/− mice (A,B) showing the location of retrogradely labeled cell bodies from neuroanatomical tracer injections in V1 relative to the architectonically defined cortical fields. The dots mark the locations of labeled cell bodies. The locations of the injection sites are marked by black ovals and cortical field boundaries are represented by the thin black lines and dashed lines denote approximate boundaries. Labeled cells are located primarily in V1 and in extrastriate cortex including areas 18a and 18b. Medial is to the top and rostral is to the left in all images. See Table 1
for list of abbreviations. Scale bar = 1 mm.
Callosal Connections
Labeled cells were reconstructed in the contralateral hemisphere in both normal and Gnat−/− mice. In normal mice, injections in the medial portion of V1 resulted in labeled cells mostly in a rostrolateral and caudolateral location of V1 (e.g. Figure 8
A; Case 08-78). In the case in which the injection was in the center of V1 labeled cells in V1 in the contralateral hemisphere were scattered throughout the field (Figure 8
B; Case 08-81). Labeled cells were also found in the contralateral area 18b and area 18a. In some cases, these cells were mostly focused in a dense patch in area 18a and in one case the label was sparse and cells were located mostly in the middle portion of 18a (Case 08-81).
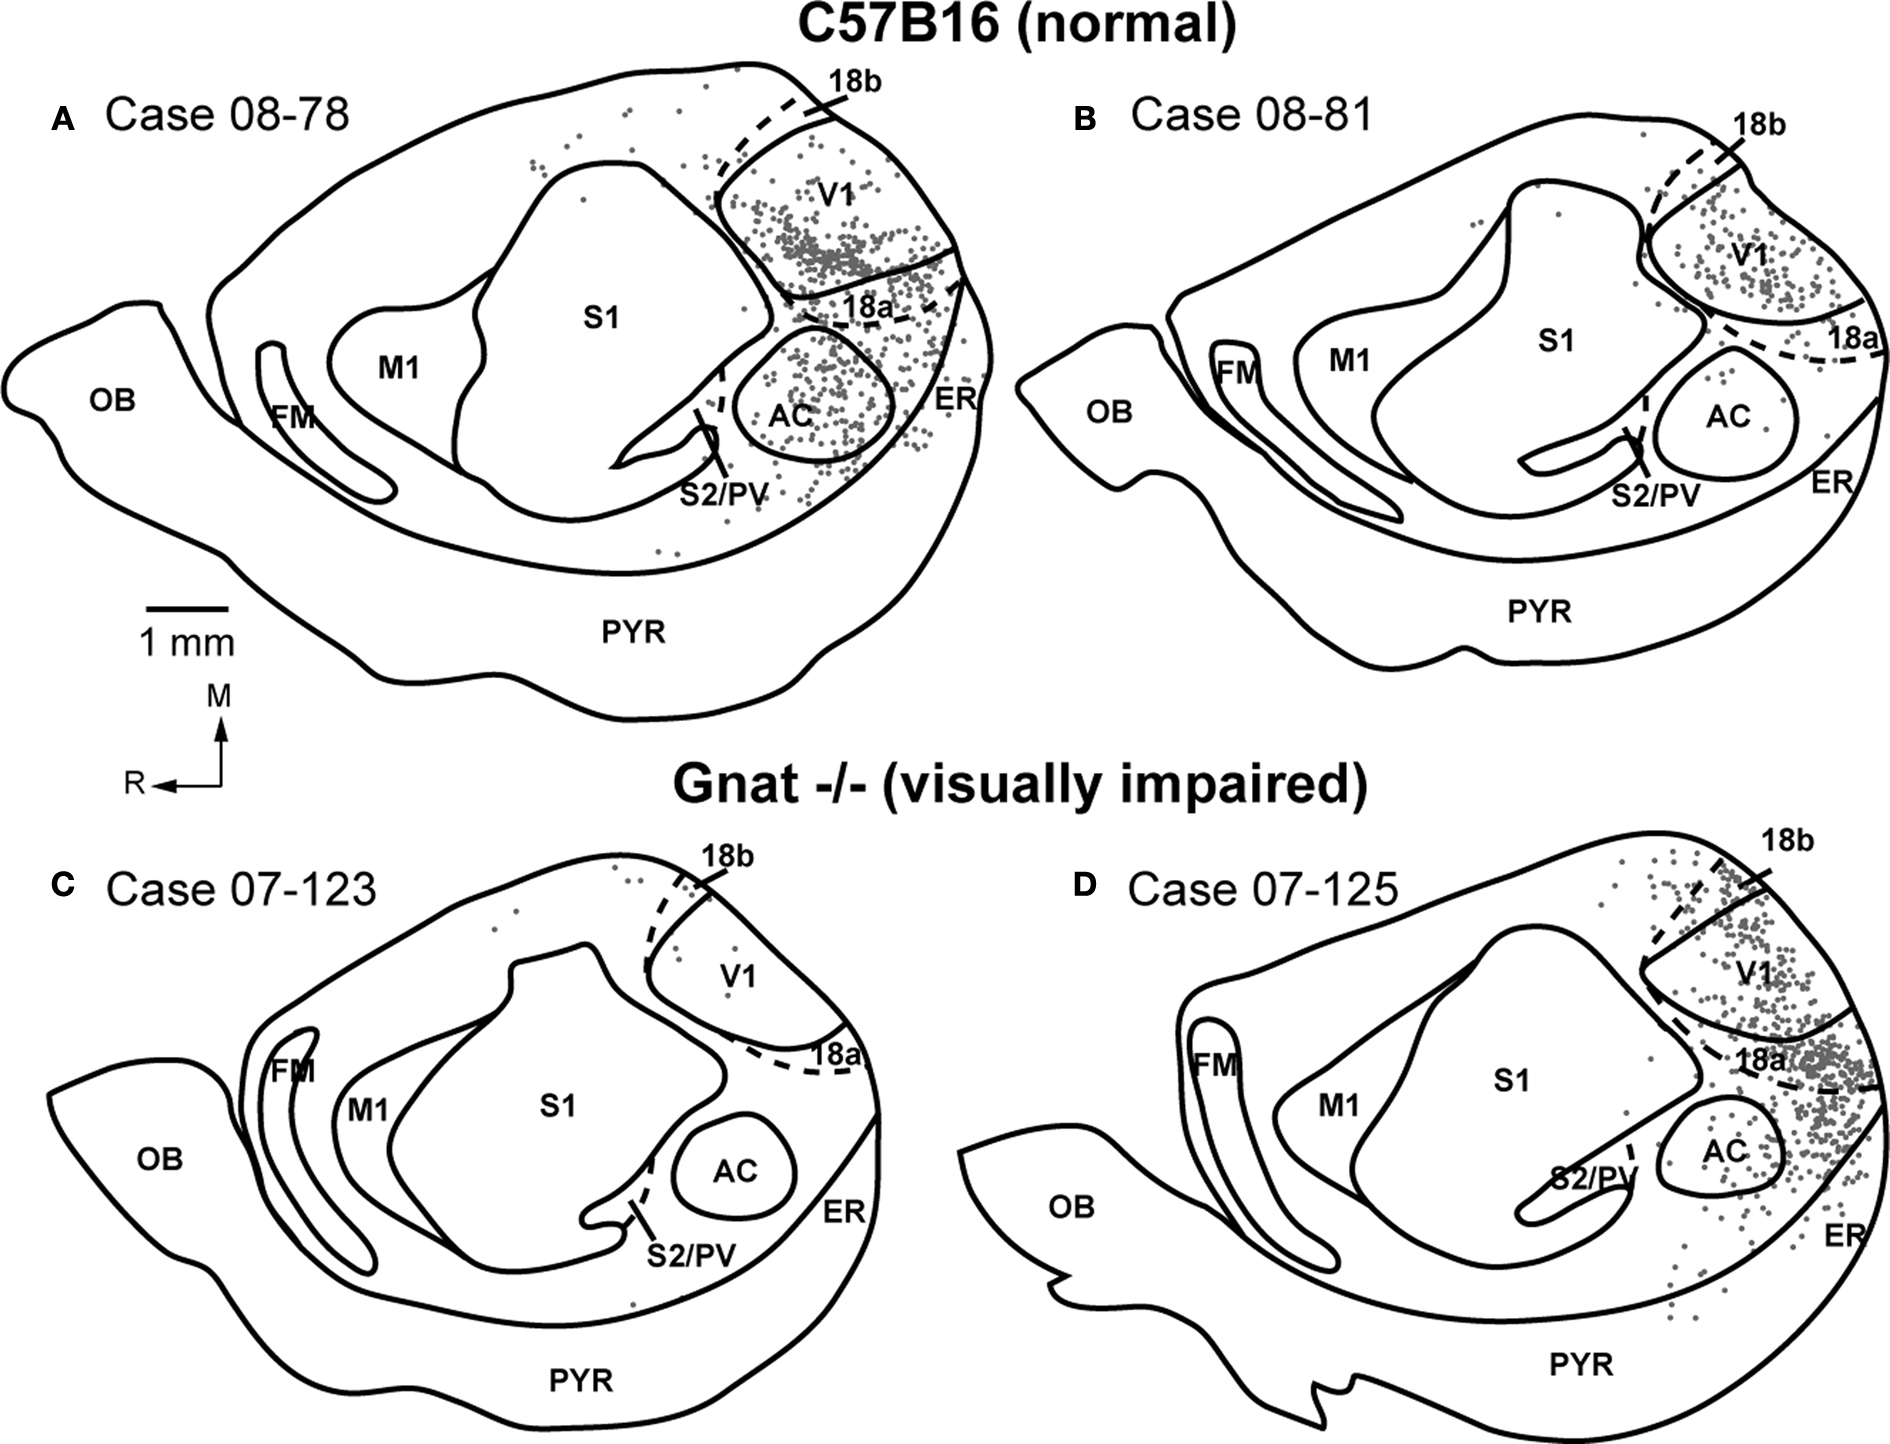
Figure 8. Contralateral Cortical Reconstructions of Neuroanatomical Tracer Injections in V1. Reconstructions of cortical connections in C57Bl6 (A,B) and Gnat−/− (C,D) mice showing the location of retrogradely labeled cell bodies from neuroanatomical tracer injections in V1 relative to the architectonically defined cortical fields. The dots mark the locations of labeled cell bodies. The locations of the injection sites are marked by black ovals and cortical field boundaries are represented by the thin black lines and dashed lines denote approximate boundaries. Medial is to the top and rostral is to the left in all images. See Table 1
for list of abbreviations. Scale bar = 1 mm.
The callosal connections in Gnat−/− mice were also similar to those observed in normal mice with a few subtle differences (Figure 8
). In Gnat−/− mice, injections in the medial portion of V1 resulted in labeled cells located in two patches, in mediocaudal V1 and at the middle portion of V1 (not shown). Injections centered in V1 resulted in labeled cells in contralateral V1 that were scattered throughout the field (e.g. Figure 8
; Case 07-125) in a pattern similar to that observed for a similarly placed injection site in normal mice (Compare Figures 8
B,D). The remaining two injections resulted in sparse cells in the contralateral cortex with scattered cells in V1 and on the medial wall just rostral to area 18b (Figure 8
C). In addition, labeled cells were also found in contralateral area18b and area 18a. In two cases, these cells were found in dense patches.
Thalamocortical Connections
Labeled cells were reconstructed in the thalamus for both normal and Gnat−/− mice. Retrogradely labeled cells in the thalamus resulting from injections in V1 fluoresced brightly with little nonspecific background label (Figure 9
). In both normal (Figure 10
) and Gnat−/− (Figure 11
) mice the majority of labeled cells were found in the dorsal lateral geniculate (dLG) (47% ± 0.08% and 39% ± 0.31% respectively; mean ± SD; Figure 5
), LP (11% ± 0.02% and 12% ± 0.03% respectively; mean ± SD; Figure 5
), and LD (39% ± 0.07% and 30% ± 0.19% respectively; mean ± SD; Figure 5
). These results indicate that the normal thalamocortical visual pathways are maintained in the Gnat−/− mice. In contrast to normal mice, Gnat−/− mice also had label in inappropriate thalamic nuclei accounting for 18% of the labeled cells in the thalamus, the location of this label varied. For all but one of the injections in Gnat−/− mice, inappropriate label was found in the anterior group nuclei: AV (4% ± 0.06%), AD (1% ± 0.01%), and AM (4% ± 0.05 %; mean ± SD). This is in contrast to normal mice in which only one injection resulted in a few cells in AV (1%), and none in AD or AM. We also found a difference between normal and Gnat−/− mice in the percentage of labeled cells in Po, VP, VL/VA. In all but one injection in Gnat−/− mice, label was observed in both Po (3% ± 0.02; mean ± SD) and VL/VA (2% ± 0.01%; mean ± SD). Normal mice had no labeled cells in these nuclei. In half of the injections in Gnat−/− mice labeled cells were observed in VP (2% ± 0.04%; mean ± SD), and no cells were observed in VP in normal mice.
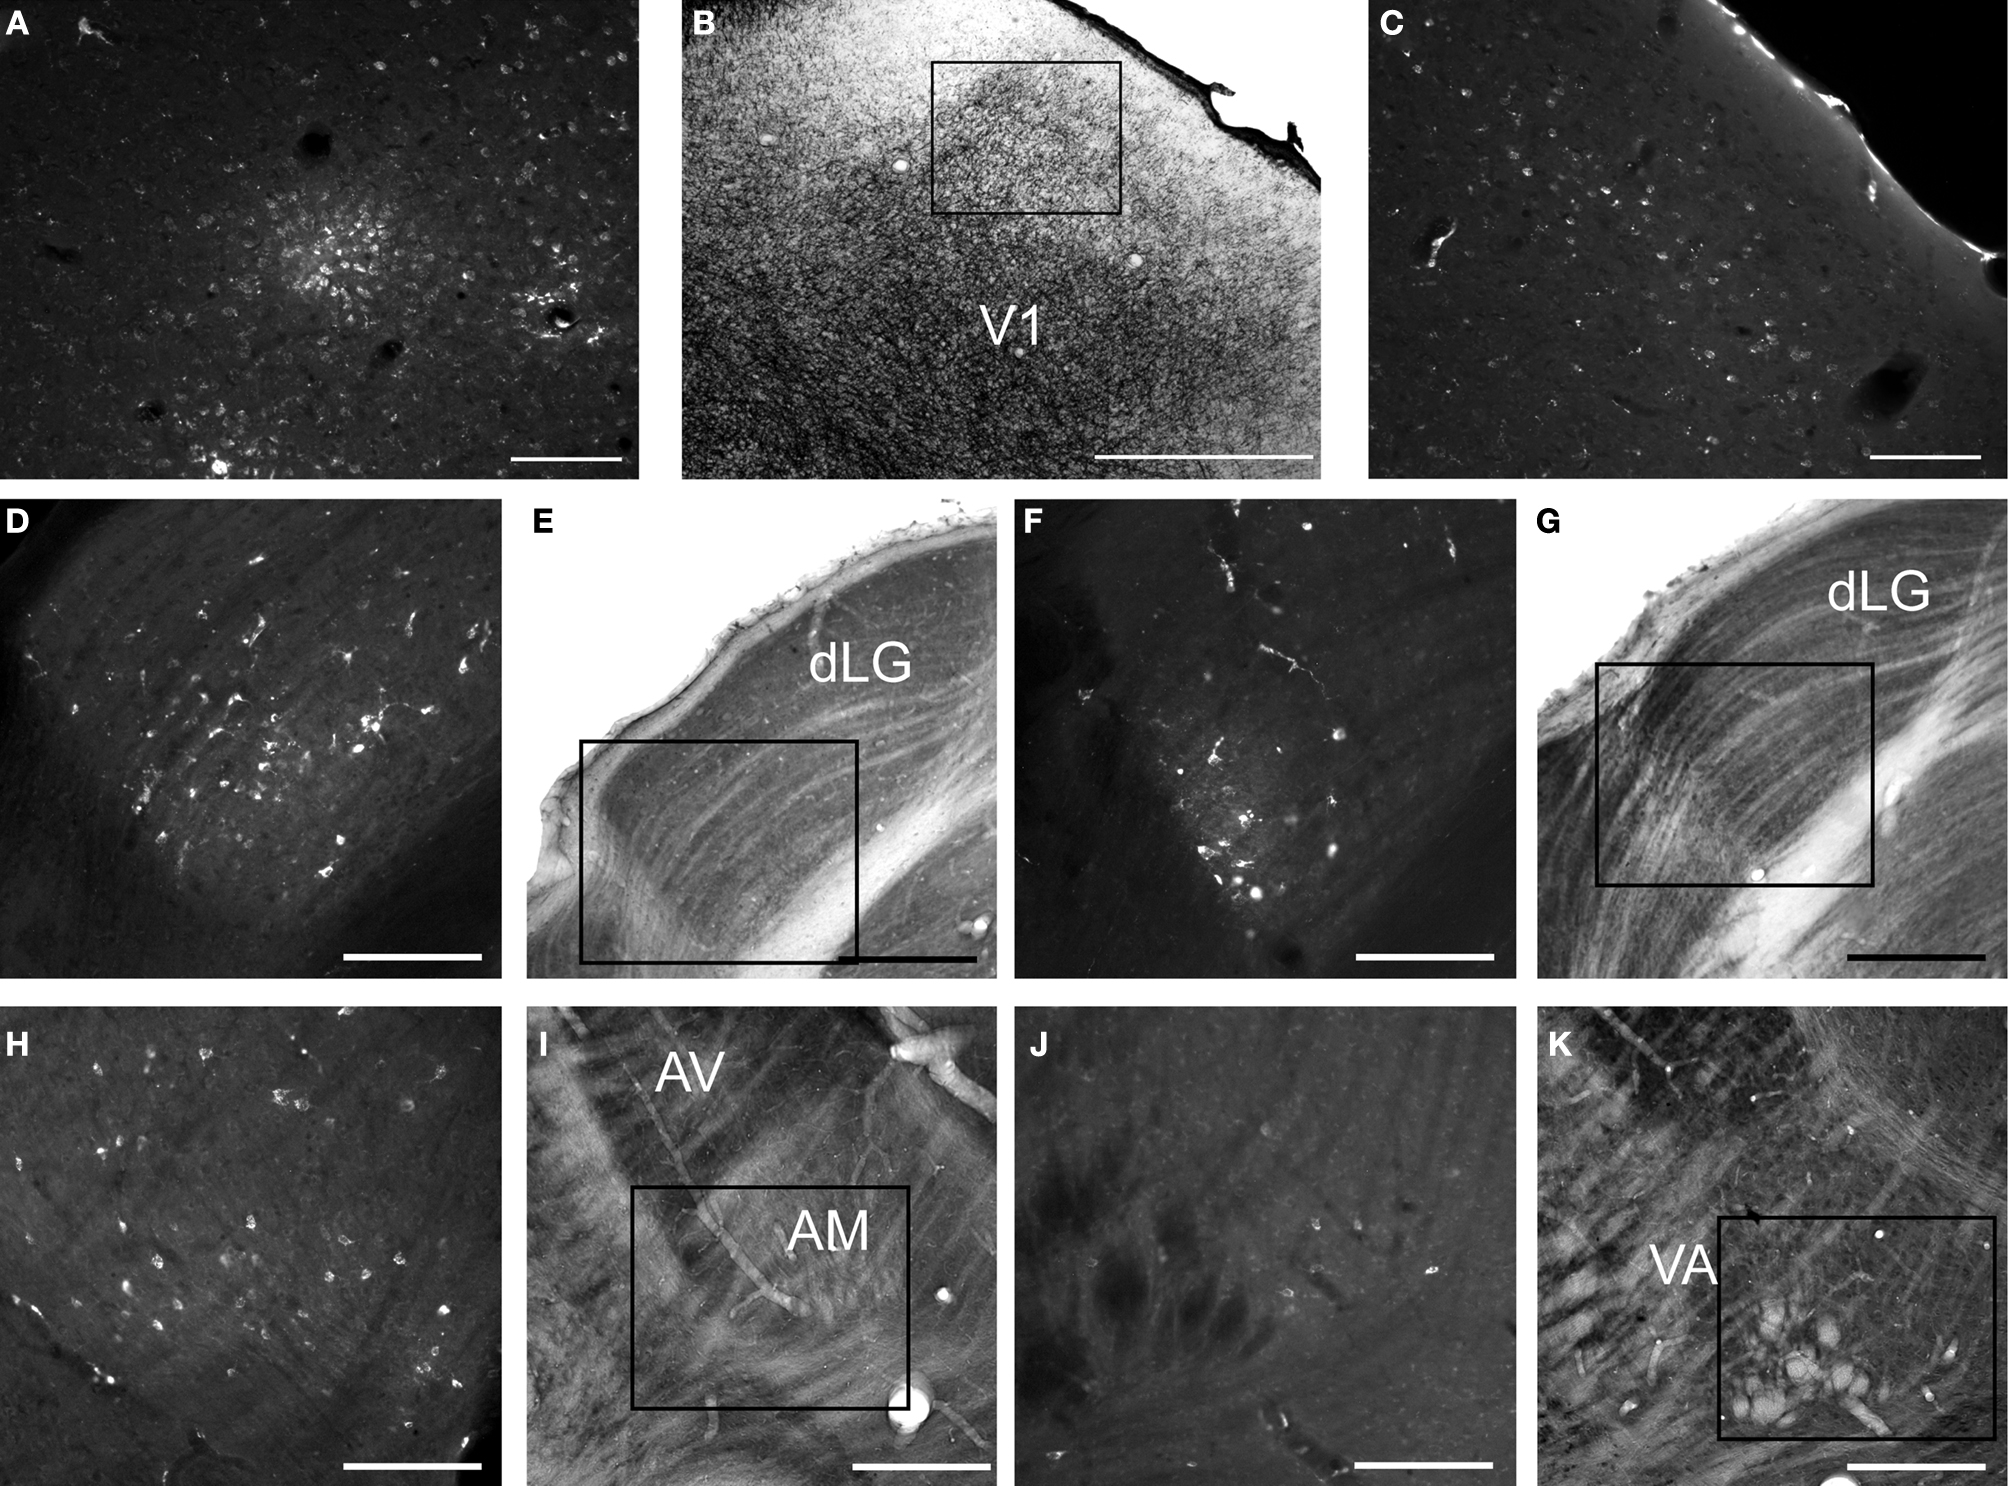
Figure 9. Digital Images of Cortical and Thalamic Label in C57Bl6 and Gnat−/− Mice. Digital images of cortical and thalamic label in C57Bl6 (A,C,D) and Gnat−/− (F,H,J) mice showing retrogradely labeled cells. Adjacent myelin (B) or cytochrome oxidase (E,G,I,K) stained sections are used to define the borders of specific cortical areas and thalamic nuclei. A representative example of an injection site of FluoroEmerald (FE) is shown in A to illustrate the restricted size of injections. The box in panel B is the area on the myelin stained section in which the injection site (A) is located. Representative examples of FE labeled neurons located in ipsilateral V1 show clearly labeled cell bodies. In the thalamus, a similar pattern of labeled cells is found in the dLG in C57Bl6 (D) and Gnat−/− (F) mice. Gnat−/− mice show numerous labeled cells in anterior group nuclei (H) and in VA (J) while C57Bl6 mice have little or no label. In all images, medial is to the left and dorsal is to the top. Labeled cells in F,H and J are from an injection of FluoroRuby. See Table 1
for list of abbreviations. Panel A–E are from case 08-78 and panels F–K are from case 07-125. Scale bar = 100 um for A,C–K, 1 mm for B.
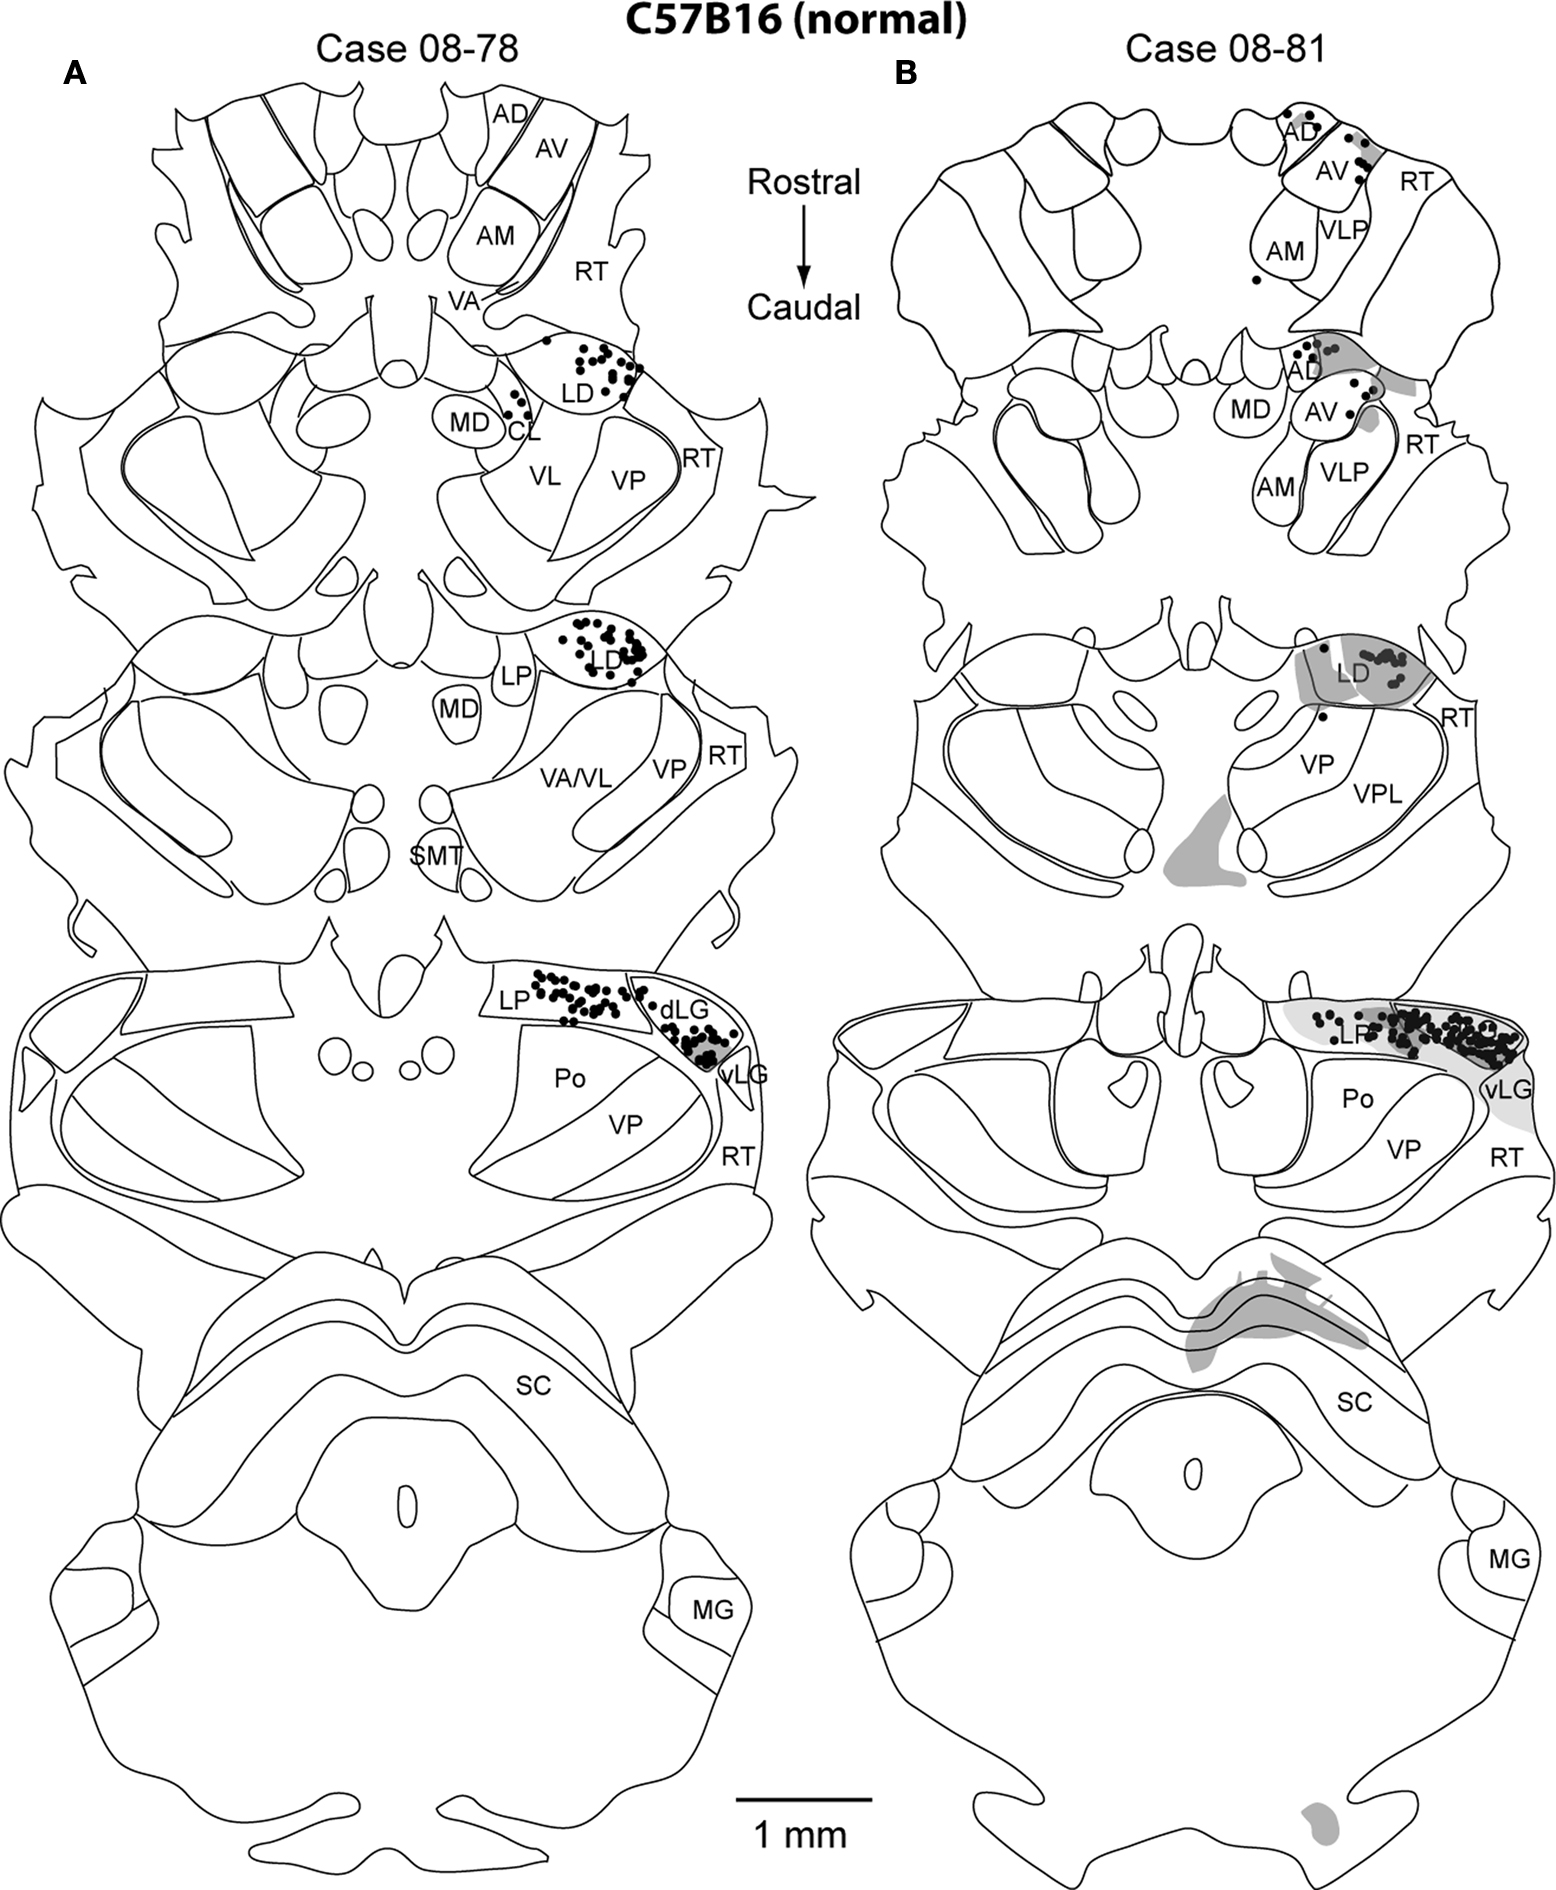
Figure 10. Thalamic Reconstructions of Neuroanatomical Tracer Injections in C57Bl6 V1. Reconstructions of a series of thalamic sections sectioned in the coronal plane representing label from 2 injection sites in C57Bl6 (A,B). The normal thalamocortical visual pathways (dLG, LD, LP) are found in the C57Bl6 mice. The dots mark the locations of labeled cell bodies and the shaded regions are areas of anterograde axonal arborization fields. These shaded regions mark the area of distribution of cortical afferents, but do not indicate density differences. Thin lines represent cytoarchitectonic borders drawn from adjacent Nissl and cytochrome oxidase stained sections. The sections are ordered from rostral (top) to caudal (bottom) with dorsal to the top. See Table 1
for list of abbreviations. Scale bar = 1 mm.
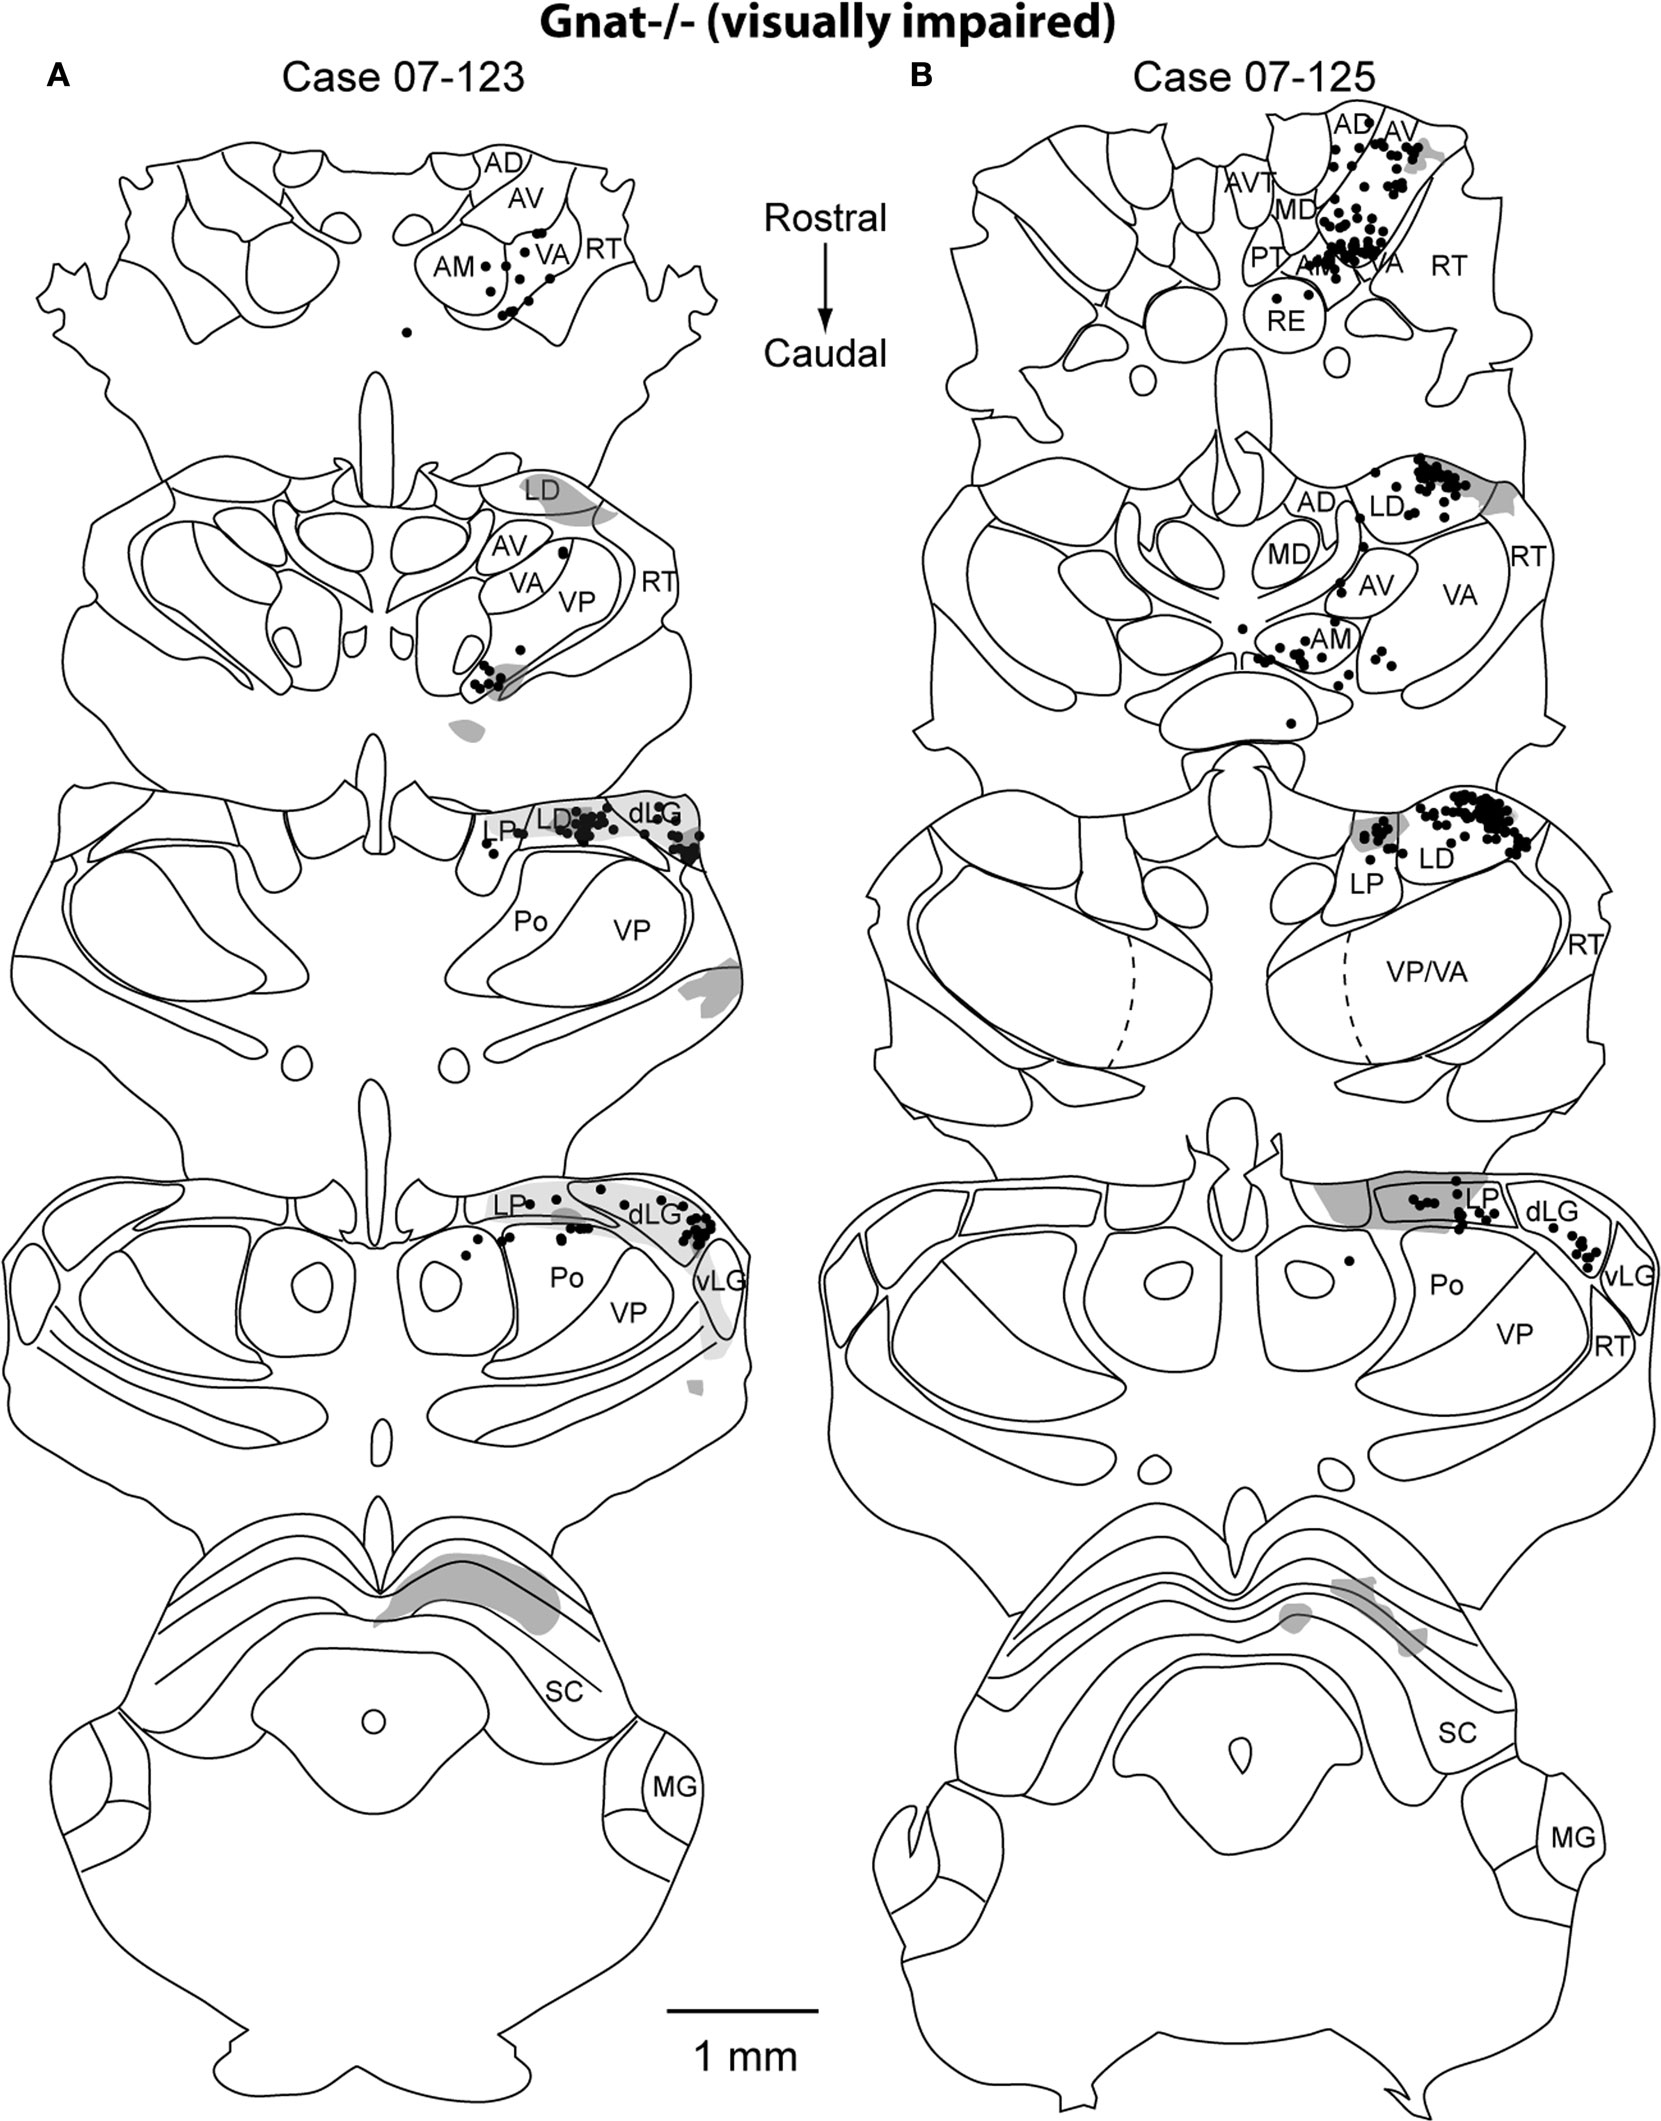
Figure 11. Thalamic Reconstructions of Neuroanatomical Tracer Injections in Gnat−/− V1. Reconstructions of a series of thalamic sections sectioned in the coronal plane representing label from 2 injection sites in Gnat−/− mice (A,B). The normal thalamocortical visual pathways (dLG, LD, LP) are found in the Gnat−/− mice. In addition, inappropriate connections are observed in Gnat−/− mice including label found in anterior group nuclei (AD, AV, AM), VA, and VP. The dots mark the locations of labeled cell bodies and the shaded regions are areas of anterograde axonal arborization fields. These shaded regions mark the area of distribution of cortical afferents, but do not indicate density differences. Thin lines represent cytoarchitectonic borders drawn from adjacent Nissl and cytochrome oxidase stained sections. The sections are ordered from rostral (top) to caudal (bottom) with dorsal to the top. See Table 1
for list of abbreviations. Scale bar = 1 mm.
In addition to labeled cells, the axonal terminal fields were also reconstructed in the thalamus (Figures 10 and 11
). In both normal and Gnat−/− mice dense axonal terminations were found in the dLG, vLG, LP, LD and superior colliculus (SC). These results are consistent with the normal visual pathways being maintained in the Gnat−/− mice. In addition to expected pattern on axonal terminations, Gnat−/− mice also had terminations in the anterior group nuclei, VA, RT, and ZI that were not observed in normal mice.
In the present investigation we examined the consequences of visual impairment on the cortical organization and connectivity of primary visual cortex in a mouse model that lacks rod-mediated vision. We found that there was a functional reorganization of V1 in that neurons responded mostly to auditory, somatosensory stimulation, or some combination of stimulation of these modalities. Only a few recording sites contained neurons that responded exclusively to visual stimulation. In addition, we also found that V1 in the Gnat−/− mice receives some abnormal thalamic inputs. However, despite the severity of their visual impairment, there appeared to be little change in the corticocortical connections and most of the normal projections from visual nuclei of the thalamus were preserved.
We appreciate that the rearing conditions of both our control and Gnat−/− mice are not equal to their natural environment since the light cycle is regular (12 h light on/off), and the temporal and spatial patterns of their activity are often different from their natural counterparts. While these rearing conditions may have some impact on our results (and the results of all studies in which mutants are used as models of human disease), we believe the impact would be relatively small. Since our controls are reared under similar conditions as the mutants, the slight alterations in connectivity and large alterations in functional organization are due predominantly (although perhaps not exclusively) to the lack of rod function. This is supported by related studies in our laboratory on visually mediated behavior in full light versus low light levels in control and Gnat−/− mice. Despite the non-natural environment in which our control mice are reared, and the limited types of behaviors that they can perform in the cage in which they are reared, their acuity and performance under low light, natural conditions is extraordinary, while the Gnat−/− mutants cannot perform visually mediated tasks under low light conditions at all (Hunt et al., 2007
). Thus, despite the rearing conditions, the effects of the mutation clearly reveal themselves in both the cortical organization and behavior, making this a valid model for severe visual impairment.
These results have some similarities to results in animal model systems in which there is a complete loss of vision. In animals that have undergone bilateral enucleation, neurons in visual cortical areas become responsive to other modes of stimulation (e.g. Yaka et al., 1999
; Izraeli et al., 2002
; Kahn and Krubitzer, 2002
; Piche et al., 2007
). For example, in bilaterally enucleated cats, neurons in area 17 (V1) and in visual areas ALLS and AMLS respond to auditory stimulation (Yaka et al., 1999
). Similar results have been reported in bilaterally enucleated hamsters (Izraeli et al., 2002
) and bilaterally enucleated rats (Piche et al., 2007
). In bilaterally enucleated short-tailed opossums, neurons in area 17 as well as extrastriate cortex respond to auditory, somatosensory, or auditory and somatosensory stimulation (Kahn and Krubitzer, 2002
; Karlen et al., 2006
).
In addition to experimental manipulations, several groups have examined the organization of visual cortex in naturally blind animals such as the blind mole rat (Bronchti et al., 2002
) and anophthalmic mice (Piche et al., 2004
; Laemle et al., 2006
). Two-deoxyglucose and electrophysiological recording studies have demonstrated that V1 in blind mole rats contains neurons that respond to auditory stimulation (Bronchti et al., 2002
). In anophthalmic mice, auditory evoked responses have been recorded in V1 and activation of c-Fos is observed in V1 with auditory stimulation (Piche et al., 2004
; Laemle et al., 2006
). Further, in animals such as prairie voles in which vision appears to play a limited role in life style compared to audition, V1 has been demonstrated to be functionally multimodal with many neurons responding to auditory stimulation (Campi et al., 2007
). In blind humans, positron emission tomography (PET) studies indicate that auditory localization tasks activate occipital cortex in regions normally involved in visual localization and motion detection (Weeks et al., 2000
), and that occipital cortex is activated with electrotactile stimulation of the tongue (Ptito et al., 2005
). Functional magnetic resonance imaging (fMRI) studies in the blind indicate that Braille reading activates occipital cortex and vibrotactile stimulation elicits activations throughout visual cortex (Sadato et al., 1996
; Burton et al., 2002
, 2004
). Together results from animal models, naturally blind animals, and congenitally blind humans, demonstrate that cortex that would normally process visual inputs is transformed into cortex that processes inputs from one or more of the spared modalities. However, as noted in the introduction, animals with complete loss of visual inputs may not be ideal models for humans with severe visual impairments, since most legally blind individuals actually have some light perception (Thylefors et al., 1995
; Gilbert and Foster, 2001
). Thus, one might expect some differences between the animal models above and models in which some vision is spared.
The results from the present investigation in which visual cortex was explored in mice that still retained functional cones and thus cone-mediated vision demonstrate that there are in fact two important differences compared with models in which there is a complete lack of visually driven or spontaneous activity. The first major difference is that the functional organization is not as dramatically altered as in models in which vision is completely abolished. We found that while most neurons in V1 responded to stimulation of other modalities, particularly auditory stimulation, there were a few sites in which neurons responded exclusively to visual stimulation and sites where neurons responded weakly to visual simulation and some other modality of stimulation. It is not surprising that in our mouse model neurons responded to flashes and bars of bright light since their cone function is normal. Further, in related studies it was found that Gnat−/− mice performed similarly to normal mice on visually mediated tasks performed in bright light (e.g. Hunt et al., 2007
), but had dramatic deficits when performing tasks at low light levels (Hunt et al., 2007
). Normal mice perform these visually mediated behaviors very well at very low light levels (e.g. Sampath et al., 2005
; Hunt et al., 2007
). Future experiments to determine the precise topographic organization of V1 and its neural response properties will provide important insight into how the different modalities map onto a cortex that is normally dominated by vision, and if and how these maps are functionally optimized to produce species-specific behaviors in the absence of normal sensory input. Of course the details of the organization of V1 in blind humans who retain some light perception has not been explored with modern imaging techniques, but it would be interesting to see if V1 in humans has retained some pattern of organization related to spared vision.
The second major difference between results from the current model and those with a complete loss of vision is one of connectivity. At the level of the cortex, recent experiments in bilaterally enucleated opossums demonstrate that functionally reorganized V1 receives abnormal projections from the primary somatosensory (S1) and primary auditory (A1) areas, as well as from other non-visual areas (Karlen et al., 2006
). As in the current study, these connections are variable. In early blind humans, functional connections between S1 and V1 and surrounding visual areas have been described (Wittenberg et al., 2004
) using transcranial magnetic stimulation of S1, and then measuring resulting activation in V1 using PET. Other studies that examine connections in early blind humans using diffusion tensor imaging (DTI) showed high variability between subjects; some appeared to have normal connections while others showed large abnormalities in their patterns of cortical connections (Shimony et al., 2006
). This variability may reflect heterogeneities in the cause and in the age of onset of blindness, or be the result of different rearing conditions of the different individuals. Taken together, the data in non-human mammals indicates that corticocortical connections of V1 are dramatically altered with early and complete loss of vision, but that corticocortical connections in mammals with some spared vision are normal. In blind humans, connections may be partially altered, but these changes in connectivity are highly variable.
It should be noted that multisensory cortical projections to V1 have been observed in normal animals in which V1 is functionally multisensory, such as prairie voles (Campi et al., 2009
). Such projections have also been observed in one study of V1/V2 connections in normal cats (Hall and Lomber, 2008
) and in studies of V1 in normal monkeys (e.g. Falchier et al., 2002
; Rockland and Ojima, 2003
). It is interesting that in the present investigation that neurons at many sites in V1 in Gnat−/− mice responded to auditory stimulation. In both normal and Gnat−/−mice AC of both hemispheres projects to V1 with variable densities. Thus, the anatomical substrate for the altered responsivity of neurons in V1 is already present in Gnat−/−mice, and may be masked in normal animals.
Thalamocortical projections to V1 have also been shown to be aberrant in bilaterally enucleated and anophthalmic animals as well as animals with naturally reduced visual pathways. For example, in the bilaterally enucleated opossum, V1 receives the normal thalamic inputs from the dLG and LP nucleus, as well abnormal thalamic inputs from the ventral posterior (VP) and medial geniculate (MG) nucleus, associated with somatosensory and auditory processing respectively (Karlen et al., 2006
). It is interesting that as in the present study, in bilaterally enucleated opossums V1 receives input from nuclei in the anterior group normally associated with the limbic system. We have ruled out hippocampal involvement in our injection sites by examining the entire series of sections including subcortical structures such as the hippocampus. It is not clear why these nuclei project to V1 in animals with lost or severely impaired vision, but it is possible that they receive aberrant inputs from other sensory modalities (see below). In anophthalmic mice and bilaterally enucleated rats, normal projections from dLG to V1 are observed, as well as abnormally dense projections to the posterior thalamus, including LP, possibly VP, and MG (Godement et al., 1979
; Negyessy et al., 2000
; Laemle et al., 2006
). A recent investigation in anophthalmic mice also demonstrates a direct projection from the inferior colliculus to the primary visual area (Laemle et al., 2006
). In naturally blind animals, such as the blind mole rat, V1 receives thalamic input from the dLG, as well as VP (Cooper et al., 1993
; Rehkamper et al., 1994
). In early blind humans, recent DTI studies reveal that geniculocortical connections are greatly reduced (Shimony et al., 2006
). Other changes in connectivity were not observed, but this is likely due to the limitations of current DTI technology in visualizing small connection pathways. Our studies demonstrate that there are alterations in the patterns of thalamocortical connections of V1, but most of the inputs from the thalamus (i.e. from the dLG and LP) are like those in normal animals, and may be responsible for the aspects of normal V1 organization that are retained in animals with severe visual impairments with some spared vision.
However, it is possible that while geniculocortical connections are preserved, inputs to thalamic nuclei such as the dLG, LP and nuclei in the anterior group are altered. For example, Asanuma and Stanfield (1990)
showed that in both congenitally blind mice and those bilaterally enucleated at birth, ascending somatosensory projections from the dorsal column nuclei innervate the dLG. In bilaterally enucleated hamsters (Izraeli et al., 2002
; Piche et al., 2004
) and in the blind mole rat (Doron and Wollberg, 1994
), the inferior colliculus is the major source of input to the dLG. It is not known if connections in humans with congenital blindness are like those of our animal model, but we hypothesize that this is the case. If so, it is exciting to consider the possibilities that early rehabilitation may play in optimizing functional maps in V1 for multisensory integration necessary to perform species relevant tasks with a major, but not complete, loss of input from one modality.
The authors declare that the research was conducted in the absence of any commercial or financial relationships that could be construed as a potential conflict of interest.
We wish to thank Christopher Kessler and Deborah Hunt for contributing to these experiments. This work was supported by the National Science Foundation (0743924) to Leah Krubitzer and the National Institutes of Health (R01-NS35103) to Leah Krubitzer, (R01-EY14047) to Marie E. Burns and (T32 EY015387) to DeLaine D. Larsen
Calvert, P. D., Krasnoperova, N. V., Lyubarsky, A. L., Isayama, T., Nicolo, M., Kosaras, B., Wong, G., Gannon, K. S., Margolskee, R. F., Sidman, R. L., Pugh, E. N. Jr., Makino, C. L., and Lem, J. (2000). Phototransduction in transgenic mice after targeted deletion of the rod transducin alpha -subunit. Proc. Natl. Acad. Sci. U.S.A. 97, 13913–13918.
Humphries, M. M., Rancourt, D., Farrar, G. J., Kenna, P., Hazel, M., Bush, R. A., Sieving, P. A., Sheils, D. M., McNally, N., Creighton, P., Erven, A., Boros, A., Gulya, K., Capecchi, M. R., and Humphries, P. (1997). Retinopathy induced in mice by targeted disruption of the rhodopsin gene. Nat. Genet. 15, 216–219.