1
Dipartimento di Neuroscienze, Università Politecnica delle Marche, Ancona, Italy
2
Department of Neurology and Neuroscience, Johns Hopkins University, Baltimore, MD, USA
3
Fondazione di Medicina Molecolare, Università Politecnica delle Marche, Ancona, Italy
GLT-1 eGFP BAC reporter transgenic adult mice were used to detect GLT-1 gene expression in individual cells of CA1, CA3 and SI, and eGFP fluorescence was measured to analyze quantitatively GLT-1 promoter activity in different cells of neocortex and hippocampus. Virtually all GFAP+ astrocytes were eGFP+; we also found that about 80% of neurons in CA3 pyramidal layer, 10–70% of neurons in I-VI layers of SI and rare neurons in all strata of CA1 and in strata oriens and radiatum of CA3 were eGFP+. Analysis of eGFP intensity showed that astrocytes had a higher GLT-1 promoter activity in SI than in CA1 and CA3, and that neurons had the highest levels of GLT-1 promoter activity in CA3 stratum pyramidale and in layer VI of SI. Finally, we observed that the intensity of GLT-1 promoter activity in neurons is 1–20% of that measured in astrocytes. These results showed that in the hippocampus and neocortex GLT-1 promoter activity is observed in astrocytes and neurons, detailed the distribution of GLT-1 expressing neurons, and indicated that GLT-1 promoter activity in both astrocytes and neurons varies in different brain regions.
Glutamate is the main excitatory neurotransmitter in the mammalian CNS, where it plays a key role in numerous functions (Conti and Weinberg, 1999
; Danbolt, 2001
). Extracellular glutamate concentration is regulated by five high-affinity plasma membrane transporters (EAATs), which belong to SLC1 family: GLAST (EAAT1, SLC1A3), GLT-1 (EAAT2, SLC1A2), EAAC1 (EAAT3, SLC1A1), EAAT4 (SLC1A6) and EAAT5 (SLC1A7) (Kanai and Hediger, 1992
, 2004
; Pines et al., 1992
; Storck et al., 1992
; Fairman et al., 1995
; Kanner, 2006
; Torres and Amara, 2007
). GLT-1 is responsible for the largest proportion of total glutamate uptake in the forebrain (Rothstein et al., 1996
; Tanaka et al., 1997
); accordingly, the lack of GLT-1 determines excitotoxicity, whereas its increase is neuroprotective (Tanaka et al., 1997
; Guo et al., 2003
; Rothstein et al., 2005
).
Early localization studies showed that GLT-1 is primarily localized to astroglial membranes (Danbolt et al., 1992
; Levy et al., 1993
; Rothstein et al., 1994
; Torp et al., 1994
; Chaudhry et al., 1995
; Lehre et al., 1995
; Minelli et al., 2001
). However, several studies reported the presence of GLT-1 in neurons, e.g. in pyramidal cells of hippocampal CA3 region and parietal cortex (Torp et al., 1994
, 1997
; Schmitt et al., 1996
, 2002
; Berger and Hediger, 1998
; Brooks-Kayal et al., 1998
; Mennerick et al., 1998
; Plachez et al., 2000
; Chen et al., 2004
; Berger et al., 2005
). In addition, GLT-1 protein has been documented in a significant percentage of axon terminals in different brain regions (Chen et al., 2004
; Furness et al., 2008
; Melone et al., 2009
). Recently, Danbolt and co-workers re-evaluated the percentage of axon terminals expressing GLT-1 in CA1 stratum radiatum, and found that about 50% of them are GLT-1-positive (GLT-1+); they also showed that about 80% of terminals exhibit GLT-1-mediated D-aspartate uptake, even though the density of GLT-1 molecules in neurons appears about ten times lower than in astrocytes (Furness et al., 2008
). The expression of GLT-1 in such an elevated percentage of neurons may have important functional effects, and could change our understanding of the physiology of glutamatergic synapses.
In this context, it would be of some interest to know whether the promoter of the GLT-1 gene is active in neurons and its degree of activation. Here, we used GLT-1 BAC promoter reporter transgenic mice that express enhanced green fluorescent protein (eGFP) under the transcriptional control of the GLT-1 promoter (Regan et al., 2007
) to quantify the distribution of cells displaying GLT-1 promoter activation in CA1, CA3 and SI cells of adult mice, and the relative levels of GLT-1 promoter activity.
Animals
Adult heterozygous GLT-1 eGFP BAC promoter reporter transgenic mice were used in this study. Heterozygous offsprings were obtained from homozygous GLT-1 eGFP BAC transgenic mice bred with C57BL/6 wild-type mice (Regan et al., 2007
). Animals care and handling were approved by the Ethical Committee for Animal Research of Università Politecnica delle Marche.
Mice were anesthetized with an intraperitoneal injection of 12% chloral hydrate and perfused transcardially with a flush of saline solution, followed by 4% freshly depolymerised paraformaldehyde in 0.1 M phosphate buffer (PB). Brains were removed, post-fixed in the same fixative for 3–7 days, and cut in the parasagittal plane in 50-μm thick sections with a Vibratome. Sections were mounted, air dried and coverslipped with Vectashield mounting medium (H-1000; Vector).
Immunocytochemistry
Sections were first incubated in normal goat serum (NGS) (10% in PB; 1 h) and then overnight at room temperature in a solution containing primary antibodies directed to glial fibrillary acidic protein (GFAP; 1:800; Sigma; six mice, two sections/animal) or neuronal specific nuclear protein (NeuN; 1:200; Chemicon; six mice, two sections/animal). The next day, after several rinses in PB, sections were incubated in NGS (10% in PB; 20 min) and then in a solution containing an anti-mouse tetramethylrhodamine isothiocyanate (TRITC)-conjugated secondary antibody (1 h; 1:150; Molecular Probes). Sections were finally washed with PB, mounted, air dried and coverslipped with Vectashield mounting medium (H-1000; Vector). In control experiments primary antibodies were omitted.
Data Collection
Data were collected from CA1, CA3 and first somatic sensory cortex (SI) using a Leica (TCS SP2) confocal laser microscope. To improve signal/noise ratio, 10 frames of each image were averaged. For low magnification confocal microscopy, images were collected with an air dry 10× lens and aligned to obtain composite images of hippocampus and SI using Adobe Photoshop CS2 (Adobe System, San Jose, CA, USA). For high resolution confocal microscopy (applied to eGFP co-localization and intensity studies; see below) images were acquired with a HCX PL APO 63× oil-immersion lens (1.4 numerical aperture), a pinhole of 1 Airy Unit, an image size of 512 × 512 pixels and a pixel size of 0.423 μm, with the exception of the astrocyte intensity studies in which the pixel size was 0.230 μm. Acquisition of astrocytic and neuronal eGFP signals was optimized through the ‘Q LUT’ button, which permitted direct visualization of pixel saturation; photomultiplier gain was set so that the brightest pixels were just slightly below saturation, and the offset such that the darkest pixels were just above zero. To avoid bleed-trough between green and red fluorescence, images were acquired sequentially.
eGFP co-localization studies
For astrocytes, eGFP/GFAP fields were randomly selected from stratum oriens (so), pyramidale (sp), and radiatum (sr) of CA1 and CA3 (6 fields/layer/animal for each region). In SI, microscopic fields (10 fields/layer/animal) were randomly selected from layer I and VI, where GFAP immunoreactivity is robust (Hajós, 2008
). For neurons, sampling of eGFP/NeuN fields of CA1 and CA3 was carried out as for eGFP/GFAP studies, whereas in SI microscopic fields were sampled in all cortical layers (10 fields/layer/animal).
eGFP intensity studies
For the analysis of eGFP intensity in both astrocytes and neurons we used eGFP/NeuN labelled sections. Sampling was carried out in all hippocampal and cortical layers (10 fields/layer/animal for each hippocampal region and 10 fields/layer/animal for SI). We used eGFP positive (+)-NeuN+ cells for the analysis of eGFP intensity in neurons, and eGFP+-NeuN- cells for that of astrocytes. The rationale for considering eGFP+-NeuN- cells as astrocytes is that in pilot studies we observed that in layers I-VI of SI and in strata oriens, pyramidale, and radiatum of CA1 and CA3 CNPase+ cells (i.e., oligodendrocytes) and CD11b+ cells (i.e., microglial cells) were never eGFP+. Details on immunocytochemical procedure are given in the legend to Figure 2
.
Data Analysis
eGFP co-localization studies
For each merged image, a threshold level of fluorescence for green and red channel was determined by setting a background intensity value. Background intensity values for green and red channel corresponded to 0.5 of the median of single channel intensity (estimated with Adobe Photoshop CS2); then, background values were subtracted from each channel, yielding a thresholded image. Background intensity was chosen within a range of values (from 0.25 to 0.75 of the median) which did not affect measurement accuracy (Melone et al., 2005
; Ronneberger et al., 2008
); background subtraction resulted in null intensity pixel value in eGFP- structures, e.g. blood vessels (Regan et al., 2007
).
Thresholded images were split into green and red channel and then analyzed with NIH ImageJ Software (http://rsb.info.nih.gov/ij
). A region of interest (ROI) of 5 × 5 μm was used to asses pixel positivity within neuron somata on the green channel, while a ROI of 3 × 3 μm was used for astrocytes. Cells with an average pixel intensity ≥1 arbitrary units were considered positive for eGFP expression and were therefore included in the analysis. Co-localization of eGFP+ cells with NeuN and GFAP was calculated as the percentage of eGFP+/NeuN+ and eGFP+/GFAP+ cells on the total of NeuN+ and GFAP+ cells.
eGFP cellular intensity studies
In these studies, as in eGFP co-localization studies, background value was set at 0.5 of the median level of the entire image. In a series of pilot studies, we studied the relationship between eGFP intensity values of cells and mean intensity of the whole microscopic field; we found that astrocytic and neuronal intensity levels measured were positively correlated to the mean intensity levels of acquired images (r = 0.965 for astrocytes, P = 0.008; r = 0.860 for neurons, P = 0.028; n = 10 images). Therefore, in order to obtain intensity values not affected by the mean intensity of images, we transformed intensity measures by matching the cellular with the background intensity (Icell/Ibackground), as described by Marrs et al. (2001)
. After this transformation, correlation between intensity values was not significant (P = 0.226 for astrocytes; P = 0.103 for neurons), thus supporting the validity of the procedure. Then we normalized the data using the formula:
where v stood for the value of Icell/Ibacground to be normalized, NIv for Normalized Intensity of v, vmin and vmax for minimum and maximum values of v, NImin and NImax are the new minimum and maximum normalized values of v, i.e. 0 and 1 (Han and Kamber, 2006
).
Statistical Analysis
Comparison between CA1, CA3 and SI (obtained by collapsing data from all layers of each region) was performed by one way ANOVA (α = 0.05) with Bonferroni-Dunn post test (α = 0.017 due to Bonferroni correction for multiple comparisons). Comparisons among layers within CA1 and CA3 were performed with one way ANOVA (α = 0.05) with Bonferroni-Dunn post test (α = 0.017). Comparison between CA1 and CA3 data was assessed also with two way ANOVA considering hippocampal regions as the between factor and hippocampal layers as the within factor. Post tests used to study significant differences among levels of the between and the within factors were paired t-test and one way ANOVA. Comparison among layers of SI was assessed by one way repeated measures ANOVA (α = 0.05) and Bonferroni-Dunn post test (α = 0.003) was applied. Statistical analysis was performed with SPSS (v.13.0; SPSS Inc, IL, USA).
In line with the description of Regan et al. (2007)
, we observed numerous cells displaying GLT-1 promoter activity (eGFP+ cells) in SI and hippocampus (Figures 1
A,B). Double-labelling studies with GFAP and NeuN antibodies (see below for details) showed that eGFP+ cells were in most cases astrocytes and not rarely neurons (Figures 1
C,D), whereas double-labelling studies with CNPase and CD11b antibodies revealed that in SI and hippocampal gray matter eGFP+ cells were never oligodendrocytes or microglial cells (Figure 2
). In addition, we observed that the intensity of eGFP+ cells varied remarkably, with neurons exhibiting low eGFP fluorescence intensity (Figures 1
E,F). We therefore studied quantitatively both the presence and the intensity of eGFP fluorescence in astrocytes and neurons of CA1, CA3 and SI of adult GLT-1-eGFP BAC reporter mice.
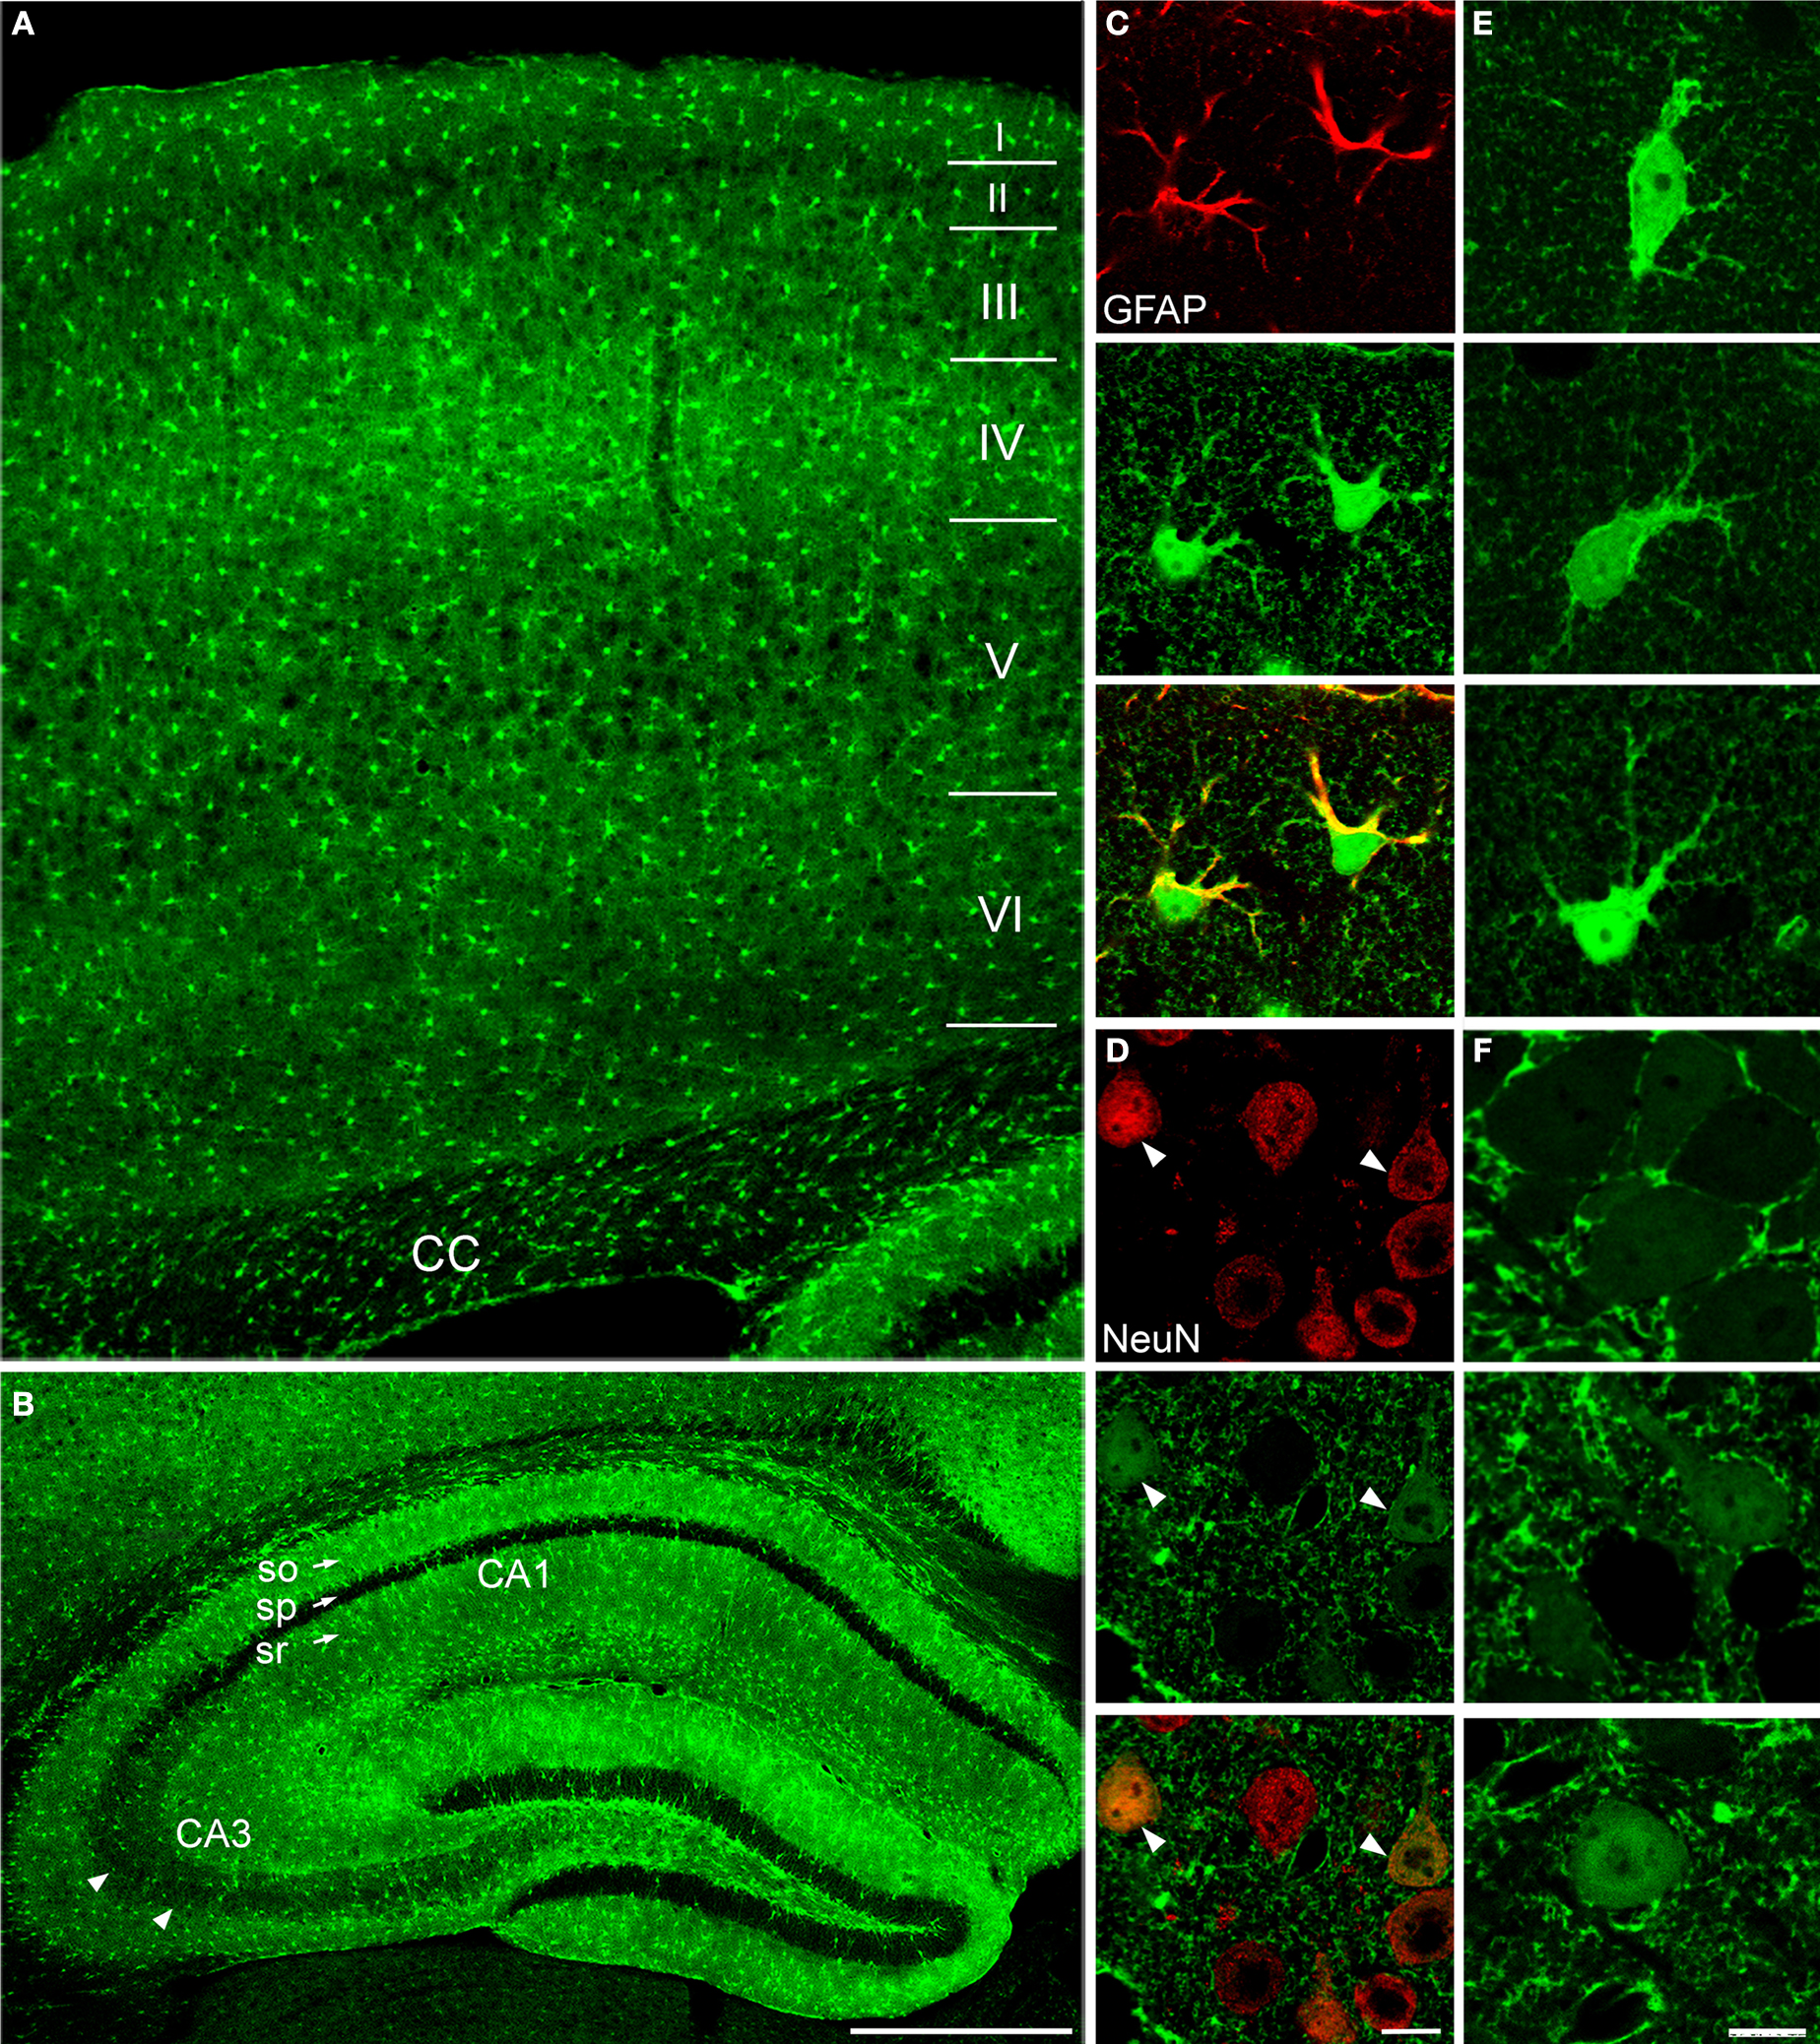
Figure 1. GLT-1 promoter activity in SI and hippocampus. Numerous eGFP+ cells, indicative of GLT-1 promoter activity, are present in white and grey matter of SI (A) and hippocampus (B). eGFP+ cells comprise both astrocytes and neurons. (C), example of eGFP+ cells in layer I of SI expressing the astrocytic marker GFAP; (D), example of eGFP+ cells in layer VI of SI expressing the neuronal marker NeuN. (E,F) show that the intensity of eGFP+ cells is highly variable, i.e. they have different degree of GLT-1 promoter activity; images in (E) show three astrocyte-like eGFP+ cells from CA1 stratum oriens (upper), CA3 stratum radiatum (middle) of hippocampus and layer VI of SI (bottom); images in (F) show three neuron-like eGFP+ cells of CA3 stratum pyramidale of hippocampus (upper) and layer VI of SI (middle and bottom). Abbreviations: CC, corpus callosum; so, stratum oriens; sp, stratum pyramidale; sr, stratum radiatum. Roman numerals indicate neocortical layers. Scale bar (A,B): 150 μm; scale bar (C–F): 10 μm.
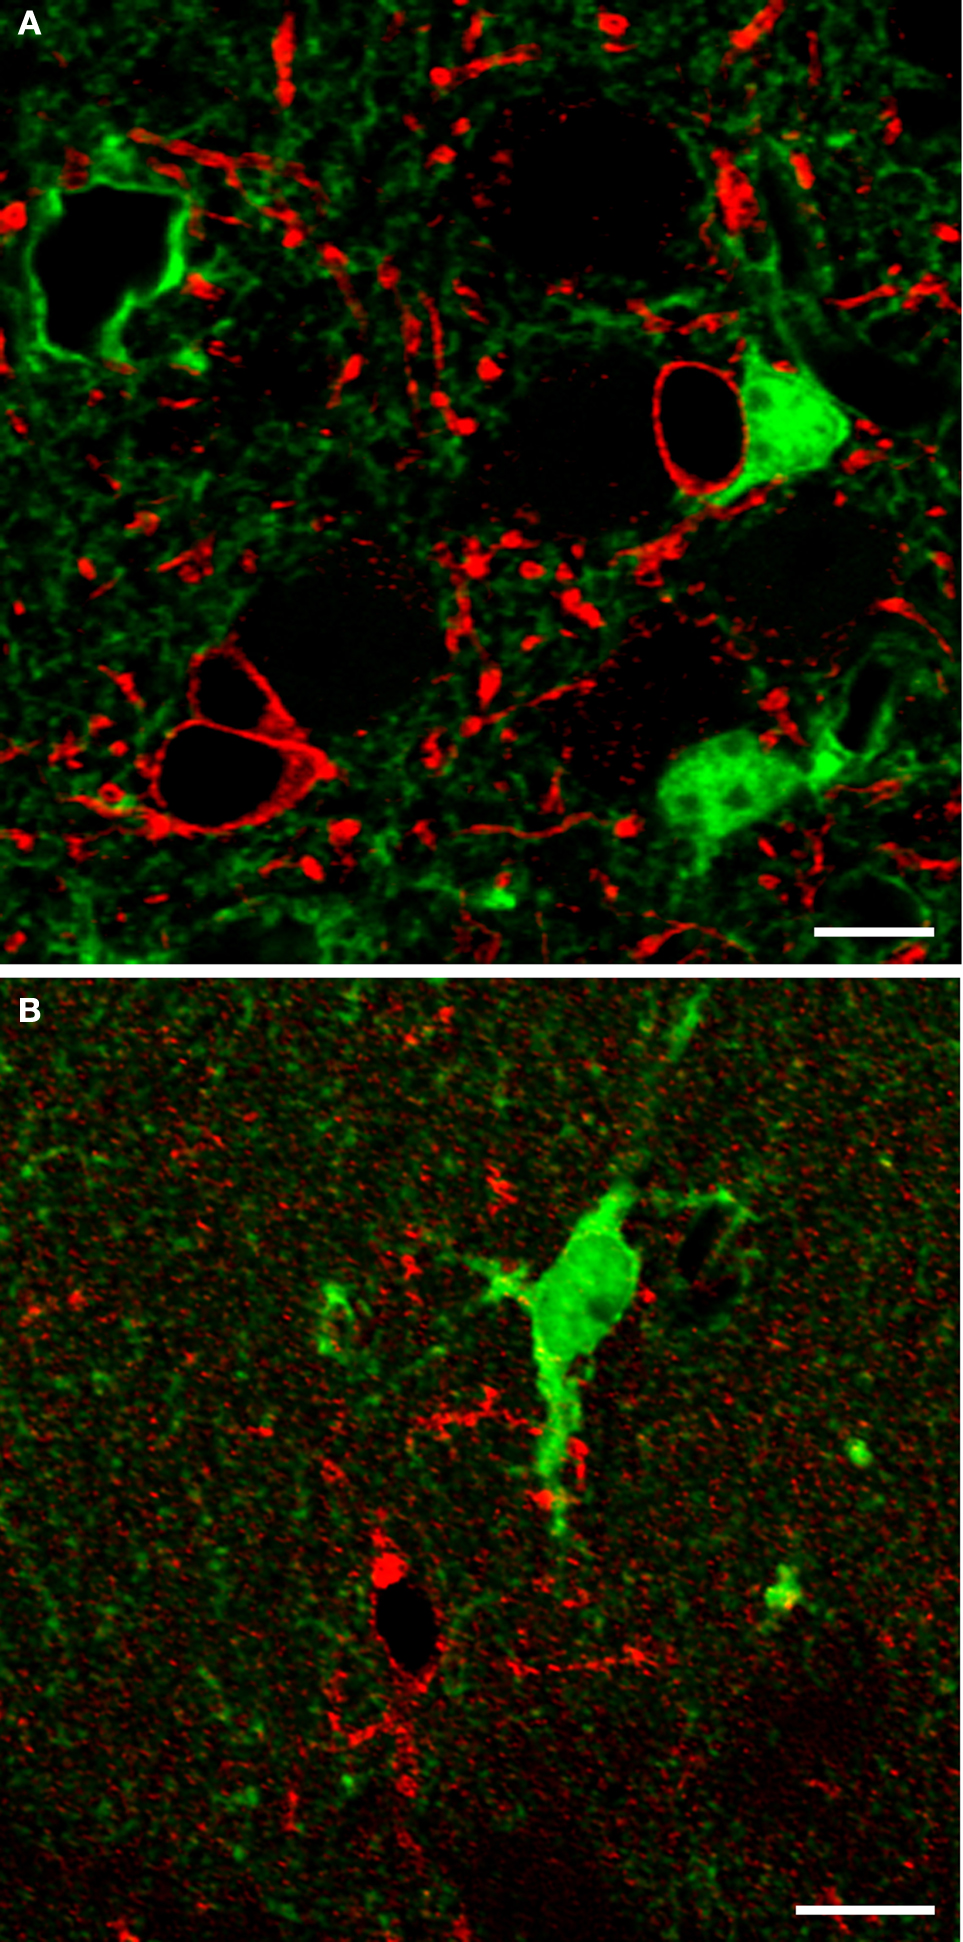
Figure 2. In layers I-VI of SI and in strata oriens, pyramidale and radiatum of CA1 and CA3 cells immunoreactive to CNPase (A; n = 180), a marker of oligodendrocytes, or CD11b (B; n = 130), a marker of microglial cells, were not eGFP+. Sections were incubated in NGS (10% in PB; 1 hr) with 0.2% Triton-X and then overnight at room temperature in a solution containing primary antibodies directed to CNPase (1:100; Millipore; two mice, two sections/animal) or CD11b (1:100; Serotec; two mice, two sections/animal). Anti-mouse TRITC-conjugated secondary antibody (1 h; 1:150; Molecular Probes) were used. In control experiments primary antibodies were omitted. (A) SI layer VI; (B) CA1 stratum oriens. Scale bars: 10 μm.
GLT-1 Promoter Activity in Astrocytes and Neurons
We first examined the presence of eGFP reporting for GLT-1 in GFAP+ and NeuN+ cells of CA1, CA3 and SI (Table 1
). GFAP/eGFP co-localization studies (Figure 1
C) revealed that in CA1 and CA3 (stratum oriens, so; stratum pyramidale, sp; stratum radiatum, sr), and SI (layers I and VI) 96.5 ± 1.4%, 95.5 ± 1.3%, and 97.5 ± 0.04% of GFAP+ cells were eGFP+, in the order. Statistical analysis showed that GFAP/eGFP co-localization was not significantly different in these regions. NeuN/eGFP co-localization studies (Figure 1
D) showed that in CA1, CA3 and SI 5.5 ± 1.6%, 34.5 ± 9.0%, and 37.0 ± 3.7% of all NeuN+ neurons were eGFP+, in the order (Figure 3
). NeuN/eGFP co-localization was higher in CA3 and SI than in CA1 (P = 0.0008 and P < 0.0001, respectively), and in CA3 it was similar to SI (P = 0.7).

Figure 3. Percentage of NeuN/eGFP co-localization varies across different cortical regions. NeuN/eGFP+ double-labelled cells are significantly more numerous in CA3 and SI than in CA1. Values are mean ± sem. Data collapsed from all layers of each region from six animals. ***P < 0.001.
Next, we studied the laminar distribution of GFAP/eGFP+ and NeuN/eGFP+ cells in CA1, CA3 and SI. The distribution of GFAP/eGFP+ cells was similar in different layers of CA1 and CA3 (so, sp, and sr) and SI (layers I and VI), whereas that of NeuN/eGFP+ cells exhibited striking differences. In particular, in CA1 NeuN/eGFP+ cells were 6.5 ± 2.3% in so, 1.8 ± 0.9% in sp, and 8.2 ± 4.1% in sr (Figures 4
A,D, white columns); in CA3 they were 10.9 ± 4.5% in so, 85.8 ± 2.9% in sp, and 6.7 ± 2.8% in sr (Figures 4
B,D, black columns); and in SI they were 13.8 ± 6.2%, 18.6 ± 3.5 %, 31 ± 4.7%, 51.3 ± 6.6%, 37.1 ± 1.4%, and 70 ± 3.0% in layers I-VI (Figures 4
C,E). NeuN/eGFP co-localization was different in CA3 layers (P < 0.0001), with sp exhibiting the highest degree of co-localization (P < 0.0001 with CA3 so and sr), but not in CA1 layers (P = 0.3), and it was higher in CA3 sp than in the same layer of CA1 (P < 0.0001) (Figure 4
D). In SI, NeuN/eGFP co-localization was different between layers (P < 0.0001), with layer VI significantly higher than layers I-III and V (P < 0.0001) and layer IV (P = 0.0007) (Figure 4
E).
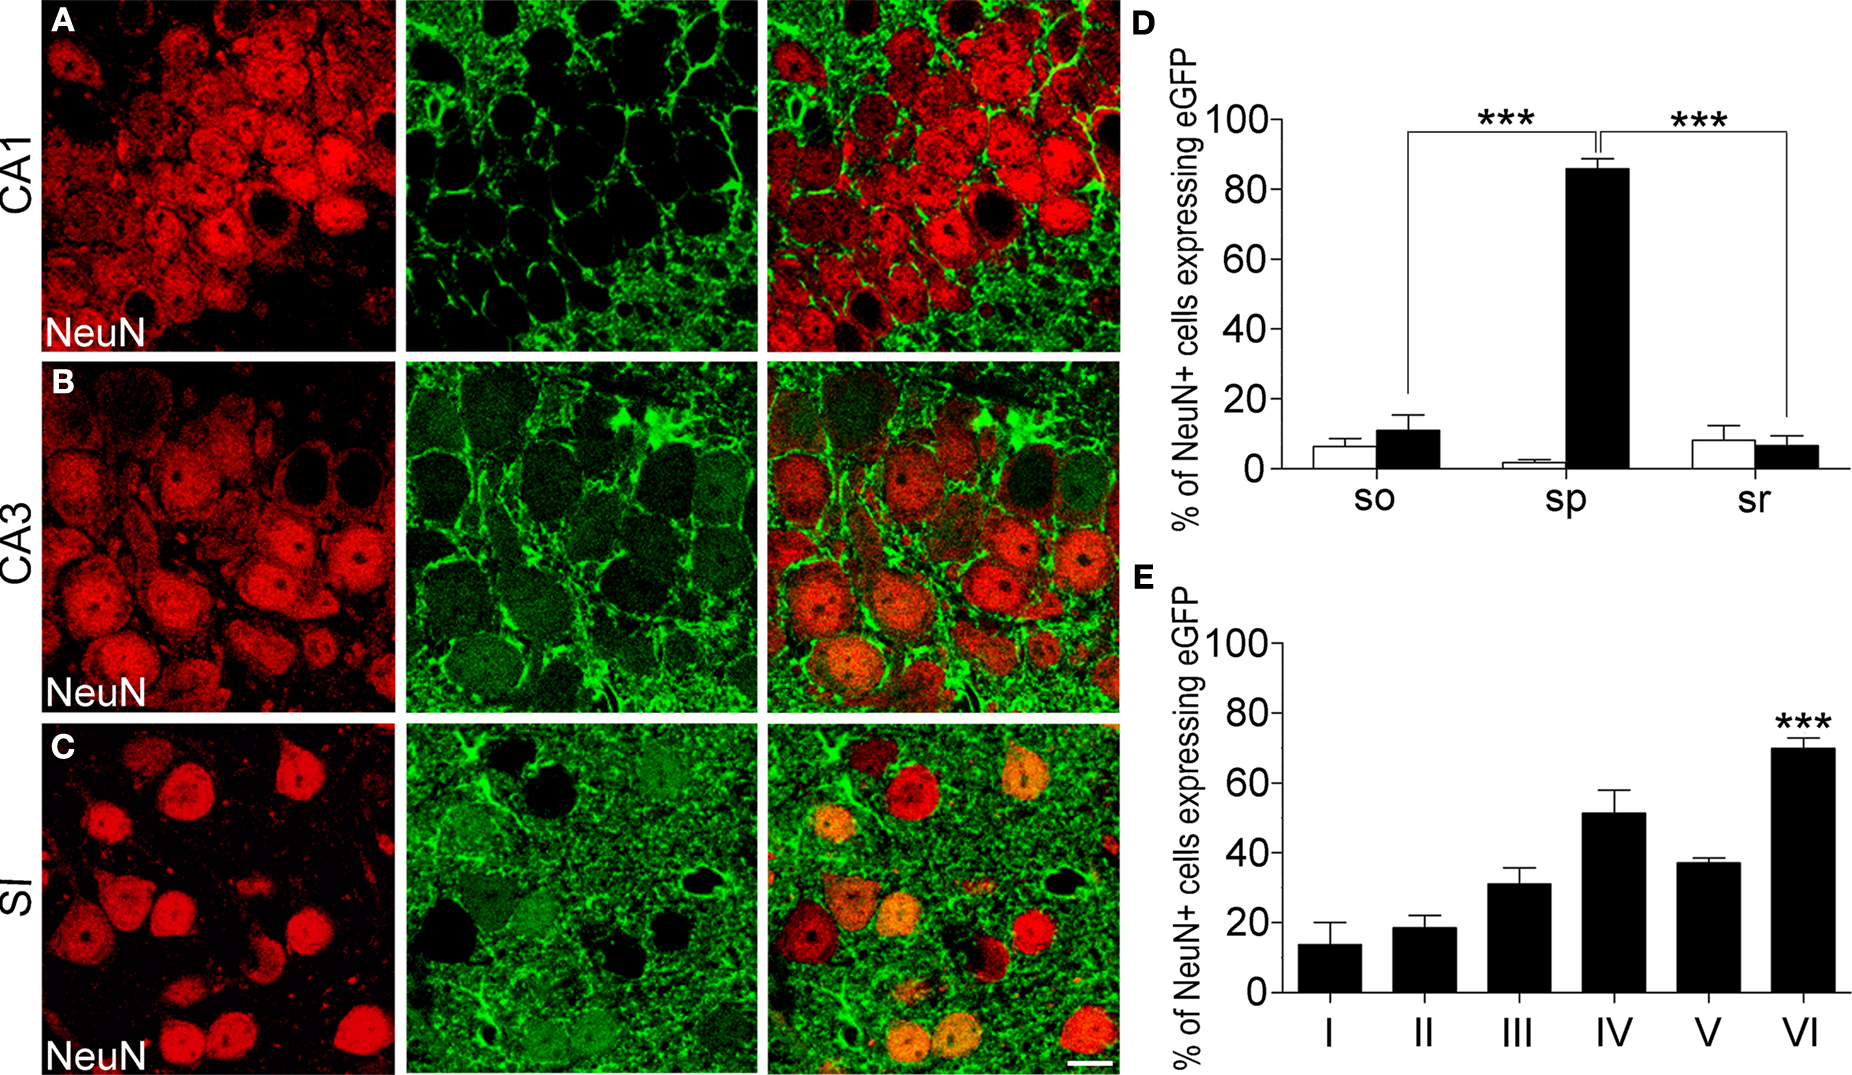
Figure 4. NeuN/eGFP co-localization in hippocampus and neocortex. (A,B) examples of NeuN/eGFP co-localization in stratum pyramidale of CA1 and CA3. Note the presence of cells expressing eGFP in CA3 but not in CA1. (D) percentage of NeuN/eGFP co-localization in stratum oriens (so), pyramidale (sp), and radiatum (sr) of CA1 (white columns) and CA3 (black columns). (C) NeuN/eGFP co-localization in layer VI of SI. (E) percentage of NeuN/eGFP co-localization in layers I-VI of SI (mean ± sem). *** P < 0.001. Scale bar: 10 μm.
Intensity of eGFP-GLT-1 Fluorescence in Astrocytes and Neurons
Since astrocytes and neurons displayed different levels of eGFP fluorescence intensity, i.e., of GLT-1 promoter activity (Figures 1
E,F), we analyzed eGFP fluorescence intensity in different layers of CA1, CA3, and SI (Table 1
). To do this, we measured fluorescence intensity within eGFP+ cell bodies and calculated its normalized intensity (NI), as described in Material and Methods. Mean NI of astrocytes was different between regions (P < 0.0001): it was higher in SI than in CA1 (∼35%, P < 0.0001) and CA3 (∼47%, P < 0.0001), but it was similar in CA1 and CA3 (P = 0.13) (Figure 5
A). Mean NI of neurons was different between regions (P = 0.0492) and higher in SI than in CA1 (up to ∼50%, P < 0.0146) but not in CA3 (Figure 5
B).
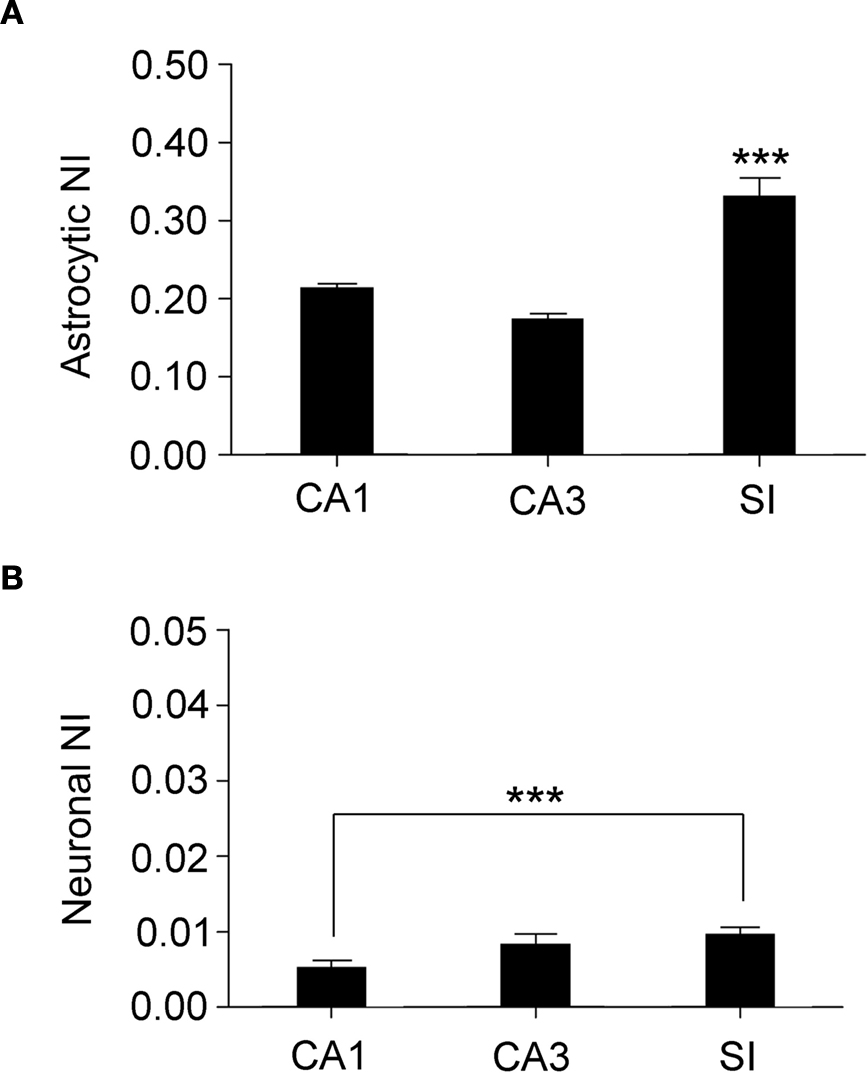
Figure 5. Regional analysis of fluorescence intensity in astrocytes and neurons. (A) shows normalized intensity (NI) in astrocytes from CA1, CA3, and SI; (B) illustrates NI in neurons from the same regions. Note that neuronal NI is lower than astrocytic NI in all regions. Values are mean ± sem. ***P < 0.001.
In CA1 and CA3, analysis of astrocytic NI revealed laminar differences (P = 0.0002 for CA1; P = 0.0015 for CA3); NI was lower in astrocytes of so than in those of sp (∼15%, P < 0.0001) and sr (∼10%, P = 0.0031) of CA1, whereas it was lower in astrocytes of sr of CA3 than in so (∼13%, P = 0.0152) and sp (∼20%, P = 0.0004) (Figure 6
A). Two way ANOVA revealed significant differences in astrocytic NI between CA1 and CA3 (P < 0.0001): each CA1 layer had an higher NI than the corresponding CA3 layer (∼10% for so, P = 0.0075; ∼16% for sp, P = 0.0114; ∼14% for sr, P = 0.0001) (Figure 6
A). The discrepancy between the results of one and two way ANOVA (see above) is determined by the fact that in one way ANOVA data from so, sp, and sr were collapsed, whereas in two way analysis, mean values of each layer were compared. In SI, no differences of astrocytic NI were noted. Neuronal NI in so, sp, and sr of CA1 and CA3 showed no laminar differences; however, in CA3 sp NI was higher than in CA1 sp (∼60%, P = 0.0007) (Figure 6
B). In SI, intensity of eGFP+ neurons showed significant laminar differences (P < 0.0001): layer VI was higher than layers I (∼72%, P < 0.0001), II (∼74%, P = 0.0001), III (∼70%, P = 0.0001), IV (∼55%, P = 0.0002), and V (∼46%, P = 0.0017) (Figure 6
C).
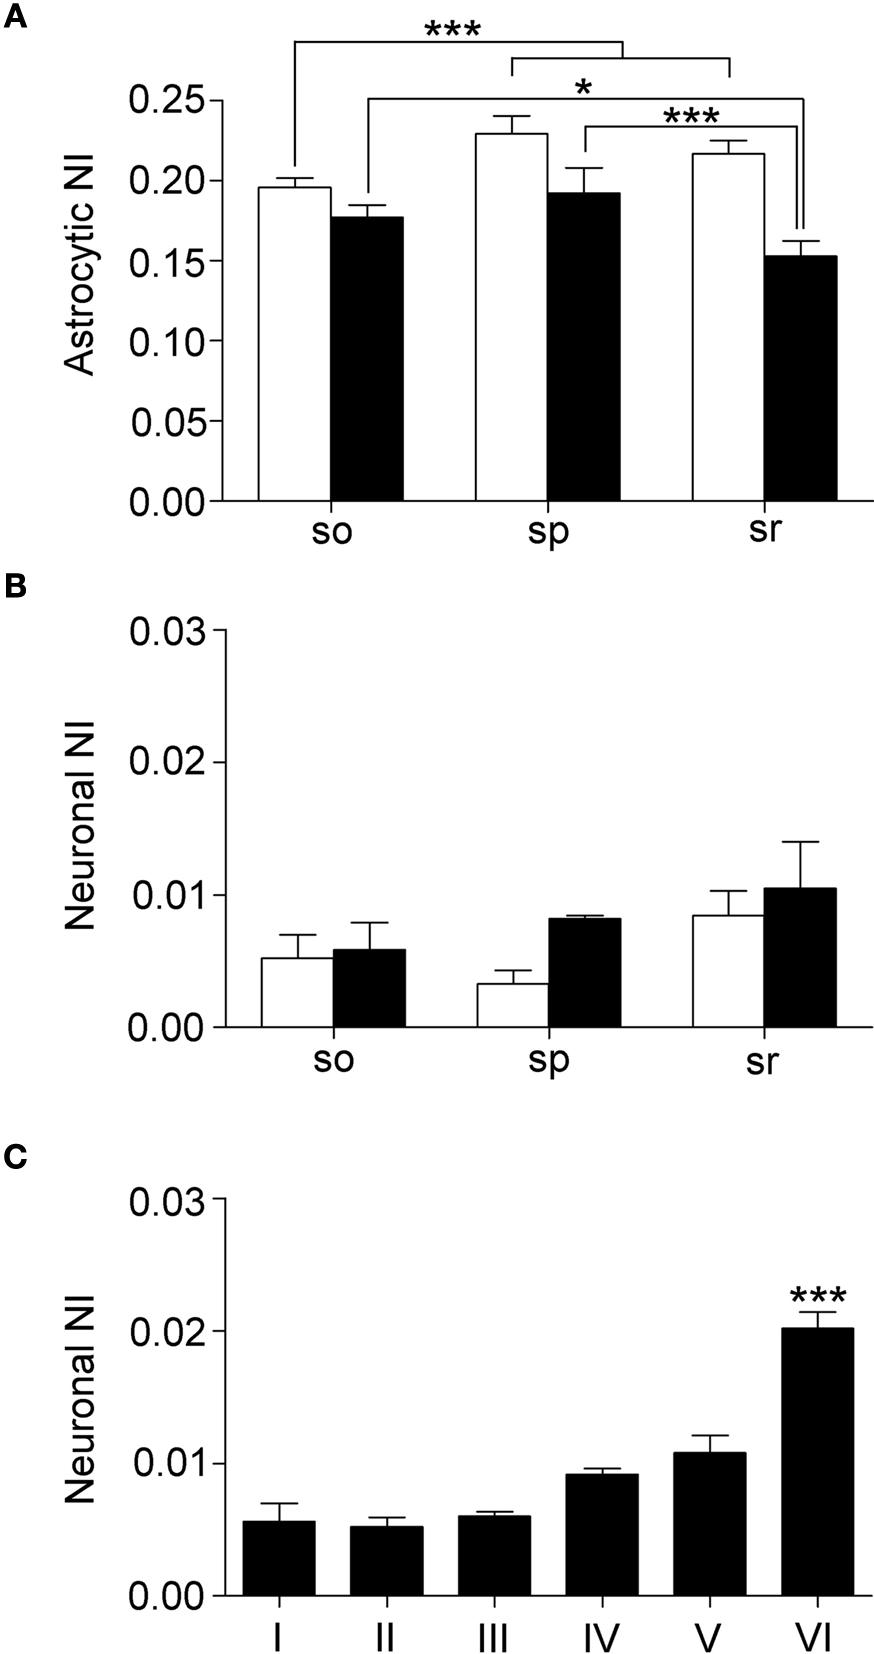
Figure 6. Laminar analysis of fluorescence intensity in astrocytes and neurons. (A) shows NI in astrocytes from stratum oriens (so), pyramidale (sp), and radiatum (sr) of CA1 (white columns) and CA3 (black columns). (B) illustrates neuronal NI in stratum oriens (so), pyramidale (sp), and radiatum (sr) of CA1 (white columns) and CA3 (black columns). (C) neuronal NI in layers I-VI of SI. Values are mean ± sem. *P < 0.05, ***P < 0.001.
Finally, to compare GLT-1 promoter activity in neurons and astrocytes, we calculated the ratio between neuronal and astrocytic NI (NIneurons/NIastrocytes; NIn/NIa). In CA1, CA3 and SI, mean NIn/NIa was 0.027 ± 0.004, 0.055 ± 0.01, and 0.033 ± 0.003, in the order; these values indicated that GLT-1 promoter activity in neurons was 2.7, 5.5, and 3.3% of those measured in astrocytes. Statistical analysis showed a significant difference between regions (P = 0.0275), with CA3 NIn/NIa higher than CA1 (P = 0.0150) but not than SI NIn/NIa. Laminar evaluation of NIn/NIa revealed differences in SI (P < 0.0001), with NIn/NIa higher in layer VI (0.07 ± 0.01) than in layers I (0.01 ± 0.005, P < 0.0001), II (0.017 ± 0.003, P < 0.0001); III (0.023 ± 0.006, P < 0.0001); IV (0.037 ± 0.008, P = 0.0003), and V (0.036 ± 0.007, P = 0.0003).
These studies in GLT-1 eGFP BAC reporter transgenic mice showed that virtually all GFAP+ astrocytes and numerous neurons exhibited GLT-1 promoter activity; that the degree of activation was much higher in astrocytes than in neurons; and that GLT-1 promoter activity was highly variable across regions and layers.
GLT-1 Promoter Activity in Astrocytes and Neurons
There is a long history, albeit a controversial one, on the cellular localization of GLT-1, the major glutamate transporter in the mammalian brain, and particularly on its postulated neuronal expression, as briefly summarized in Introduction. Here, we have used GLT-1 eGFP BAC reporter transgenic mice to investigate GLT-1 promoter activation in astrocytes and neurons, as this preparation allows both the visualization of individual cells whose GLT-1 promoter is active and its quantitation. The latter feature appears particularly attractive on considering that GLT-1 eGFP fluorescence appears well correlated to GLT-1 mRNA (Yang et al., 2009
), GLT-1 protein expression (Regan et al., 2007
), and, most importantly, to GLT-1 function (Regan et al., 2007
).
We showed that virtually all GFAP+ astrocytes expressed GLT-1 promoter activity, in line with existing data on GLT-1 localization in hippocampus and neocortex (Rothstein et al., 1994
; Chaudhry et al., 1995
; Lehre et al., 1995
; Schmitt et al., 1996
; Danbolt, 2001
), and confirmed that astrocytes are the predominant cell type expressing GLT-1. We also showed that intensity of eGFP-GLT-1 fluorescence in astrocytes was much higher than in neurons; in CA3 sp and in layer VI of SI fluorescence intensity in neurons represented 4% and 7% of astrocyte values, respectively. Interestingly, Furness et al. (2008)
have recently estimated that GLT-1 protein levels in axon terminals are about 10% of those measured in astrocytes. The similarity between our data and those of Furness et al. (2008)
provides further support to the notion that the degree of GLT-1 promoter activity appears correlated to protein expression (Regan et al., 2007
).
We have also observed that a considerable number of neurons in CA3 pyramidal layer (∼ 80%) and in layers I-VI of SI (10–70%) exhibits GLT-1 promoter activity. These results extend those of previous studies that described qualitatively the presence of GTL-1 mRNA in hippocampal and neocortical neurons (Torp et al., 1994
, 1997
; Schmitt et al., 1996
; Berger and Hediger, 1998
; Chen et al., 2004
; Berger et al., 2005
), and are compatible with the unexpected observation that ∼ ¾ of nerve terminals in CA1 stratum radiatum (Schaffer collaterals from CA3 pyramidal neurons) exhibit GLT-1-mediated D-aspartate uptake (Furness et al., 2008
). Therefore, it is conceivable that the activation of eGFP GLT-1 promoter observed in more than 80% of pyramidal neurons of CA3 may be translated into GLT-1 protein in nerve terminals forming synapses in CA1, although this remains to be demonstrated. The discrepancy between the distribution of GLT-1 promoter activity revelead by eGFP positivity and that of GLT-1 protein reported in numerous immunocytochemical studies is conceivably related to the low levels of GLT-1 protein found in neurons, which makes it difficult to detect it immunocytochemically (Schmitt et al., 1996
; Chen et al., 2004
; Furness et al., 2008
). This view is supported by the observation that eGFP-GLT-1 fluorescence in neurons was in general very low (present results) and that an high resolution confocal microscopy analysis of terminals expressing vesicular glutamate transporter 1 (VGLUT1) in CA1 stratum radiatum showed that only few of them (<5%) were also GLT-1 positive (de Vivo, Melone, Rothstein, and Conti unpublished observations). Alternatively, it is possible that in neurons exhibiting low levels of eGFP-GLT-1 fluorescence the activation of the promoter is not followed by production of GLT-1 protein.
The percentage of neurons exhibiting eGFP- GLT-1 activity was significantly higher in CA3 pyramidal neurons and in layer VI neurons than in those of other regions or layers. Whereas CA3 pyramids were known to express GLT-1 at their axon terminals (Chen et al., 2004
; Furness et al., 2008
), the unexpected presence of numerous layer VI neurons showing eGFP-GLT-1 fluorescence raises stimulating questions on their functional significance. Since most layer VI neurons project to the thalamus (Jones, 1984
) and contribute to the filtering of the thalamo-cortical flow of information, it is conceivable that GLT-1 may play a role in the gating of thalamically-mediated afferent information to the neocortex.
Variations of eGFP-GLT-1 Intensity
Quantitative analysis of eGFP-GLT-1 fluorescence intensity in hippocampal and neocortical neurons and astrocytes revealed significant variations across brain regions and layers as well as between cells of the same region or layer, as previously noticed (Rothstein et al., 1994
; Lehre et al., 1995
; Milton et al., 1997
; Regan et al., 2007
; Holmseth et al., 2009
). Mean normalized fluorescence values indicated that astrocytes in SI had a higher GLT-1 promoter activity than CA1 and CA3 astrocytes (SI > CA1 > CA3). Moreover, laminar analysis of astrocytes eGFP promoter activation in different SI layers showed a similar degree of activation, whereas in CA1 and CA3 significant differences were observed between strata oriens, pyramidale and radiatum. Neurons had the highest level of eGFP fluorescence in layer VI of SI and in CA3 stratum pyramidale, and showed laminar differences only in SI.
A large number of endogenous and exogenous molecules regulates GLT-1 expression in in vitro and in vivo conditions (Gegelashvili and Schousboe, 1997
; Robinson, 1998
; Anderson and Swanson, 2000
; Beart and O’Shea, 2007
; Lauriat and McInnes, 2007
). In human astrocytes several GLT-1 regulators, including EGF, TGF-α, and dBcAMP, exert their effects by acting on the GLT-1 promoter (Su et al., 2003
; Li et al., 2006
). If the same transcriptional mechanism operates in neurons, the high variability of eGFP GLT-1 observed here in astrocytes and neurons reflects in all likelihood the differential regulation of GLT-1 promoter. It is conceivable that such a differential regulation, though largely constitutive, is at least in part induced dynamically by differential homeostatic needs in both physiological and pathophysiological conditions, in line with the crucial role GLT-1 plays in regulating extracellular glutamate and in shaping excitatory transmission (Tong and Jahr, 1994
; Conti and Weinberg, 1999
; Danbolt, 2001
; Tzingounis and Wadiche, 2007
). In this context, it is worth mentioning that a few dozen transporters distributed quasi-randomly inside the cleft attenuate AMPARs activation (Zheng et al., 2008
), and that GLT-1 up-regulation affects synaptic plasticity (Omrani et al., 2009
).
Thus, the variability of eGFP intensity described here raises the possibility that GLT-1 eGFP BAC reporter transgenic mice may reveal themselves useful tools to investigate quantitatively the regulation of GLT-1 promoter activation in in vivo physiological or pathophysiological conditions.
The authors declare that the research was conducted in the absence of any commercial or financial relationships that could be construed as a potential conflict of interest.
Supported by MIUR and Università Politecnica delle Marche.
Furness, D. N., Dehnes, Y., Akhtar, A. Q., Rossi, D. J., Hamann, M., Grutle, N. J., Gundersen, V., Holmseth, S., Lehre, K. P., Ullensvang, K., Wojewodzic, M., Zhou, Y., Attwell, D., and Danbolt, N. C. (2008). A quantitative assessment of glutamate uptake into hippocampal synaptic terminals and astrocytes: new insights into a neuronal role for excitatory amino acid transporter 2 (EAAT2). Neuroscience 157, 80–94.
Holmseth, S., Ha, S., Real, K., Lehre, K. P., Leergaard, T. B., Bjaalie, J. G., and Danbolt, N. C. (2009). The concentrations and distributions of three C-terminal variants of the GLT1 (EAAT2; slc1a2) glutamate transporter protein in rat brain tissue suggest differential regulation. Neuroscience 162, 1055–1071.
Regan, M. R., Huang, Y. H., Kim, Y. S., Dykes-Hoberg, M. I., Jin, L., Watkins, A. M., Bergles, D. E., and Rothstein, J. D. (2007). Variations in promoter activity reveal a differential expression and physiology of glutamate transporters by glia in the developing and mature CNS. J. Neurosci. 27, 6607–6619.
Rothstein, J. D., Dykes-Hoberg, M., Pardo, C. A., Bristol, L. A., Jin, L., Kuncl, R. W., Kanai, Y., Hediger, M. A., Wang, Y., Schielke, J. P., and Welty, D. F. (1996). Knockout of glutamate transporters reveals a major role for astroglial transport in excitotoxicity and clearance of glutamate. Neuron 16, 675–686.
Rothstein, J. D., Patel, S., Regan, M. R., Haenggeli, C., Huang, Y. H., Bergles, D. E., Jin, L., Dykes Hoberg, M., Vidensky, S., Chung, D. S., Toan, S. V., Bruijn, L. I., Su, Z. Z., Gupta, P., and Fisher, P. B. (2005). Beta-lactam antibiotics offer neuroprotection by increasing glutamate transporter expression. Nature 433, 73–77.
Tanaka, K., Watase, K., Manabe, T., Yamada, K., Watanabe, M., Takahashi, K., Iwama, H., Nishikawa, T., Ichihara, N., Kikuchi, T., Okuyama, S., Kawashima, N., Hori, S., Takimoto, M., and Wada, K. (1997). Epilepsy and exacerbation of brain injury in mice lacking the glutamate transporter GLT-1. Science 276, 1699–1702.