Stars and stripes in the cerebellar cortex: a voltage sensitive dye study
- 1 Institute of Life Sciences, and Interdisciplinary Center for Neural Computation, Hebrew University, Israel
- 2 Department of Physiology and Neuroscience, New York University School of Medicine, USA
The lattice-like structure of the cerebellar cortex and its anatomical organization in two perpendicular axes provided the foundations for many theories of cerebellar function. However, the functional organization does not always match the anatomical organization. Thus direct measurement of the functional organization is central to our understanding of cerebellar processing. Here we use voltage sensitive dye imaging in the isolated cerebellar preparation to characterize the spatio-temporal organization of the climbing and mossy fiber (MF) inputs to the cerebellar cortex. Spatial and temporal parameters were used to develop reliable criteria to distinguish climbing fiber (CF) responses from MF responses. CF activation excited postsynaptic neurons along a parasagittal cortical band. These responses were composed of slow (∼25 ms), monophasic depolarizing signals. Neither the duration nor the spatial distribution of CF responses were affected by inhibition. Activation of MF generated responses that were organized in radial patches, and were composed of a fast (∼5 ms) depolarizing phase followed by a prolonged (∼100 ms) negative wave. Application of a GABAA blocker eliminated the hyperpolarizing phase and prolonged the depolarizing phase, but did not affect the spatial distribution of the response, thus suggesting that it is not the inhibitory system that is responsible for the inability of the MF input to generate beams of activity that propagate along the parallel fiber system.
Introduction
Spatial patterns of activity in the nervous system are formed by the spatial organization of the incoming input and the structure of the local network. The unique morphological organization of the cerebellar cortex in which Purkinje cell (PC) dendrites and parallel fibers (PFs) are organized orthogonally is an ideal structure in which to study spatial patterns of activity.
The intrinsic properties of the neurons in the cerebellar cortex and their interconnections are well documented (Barbour, 1993 ; D'Angelo et al., 1998 ; Forti et al., 2006 ; Llinas and Sugimori, 1980a , b , Llinas and Sugimori, 1992 ; Mann-Metzer and Yarom, 1999 ; Midtgaard 1992 ; Isope and Barbour, 2002 ). Furthermore the two types of inputs, the climbing fibers (CF) and the mossy fibers (MFs), have been extensively studied and their effect on the principal cerebellar cortical neurons, the Purkinje cells, has been described in detail.
These detailed studies stand in sharp contrast to the sporadic reports on the spatial organization of these two inputs. These studies include characterization of the patterns of PC spiking activity (Bower and Woolston, 1983 ; Lang et al., 1999 ; Sasaki et al., 1989 ), anatomic tracing of the input axons (Sugihara et al., 2001 ; Voogd and Glickstein, 1998 ), or indirect measurement of functional organization using pH imaging (Dunbar et al., 2004 ; Gao et al., 2003 ). In a previous study Cohen and Yarom (1998) used voltage sensitive dye imaging to record presumptive MF responses, however, direct, careful measurement of synaptic activity elicited by both inputs has never been done.
Several lines of evidence have demonstrated that the CF input is organized in parasagittal bands. These include: (1) Correlations in complex spike activity of PCs are higher in the parasagittal axis than in the medio-lateral axis (Lang et al., 1999 ; Sasaki et al., 1989 ). (2) Staining of olivary neurons showed that CFs that are arranged in a bundle terminate in a restricted parasagittal area in the cerebellar cortex (Sugihara et al., 2001 ; Voogd and Glickstein, 1998 ). (3) pH changes in the cerebellar cortex that are driven by activation of the contra-lateral inferior olivary nucleus are arranged in parasagittal bands (Dunbar et al., 2004 ; Gao et al., 2003 ).
The MF input, which exerts its effect via the granule cells, was believed to be organized longitudinally along the PF axis (Eccles et al., 1967 ; Marr, 1969 ). However, the receptive fields for tactile stimulation are best described as patch-like structures as opposed to the beam-like organization expected from the arrangement of the PFs (Bower and Woolston, 1983 ). Patch-like responses to white matter (WM) stimulation were also described in a previous study using voltage sensitive dye imaging (Cohen and Yarom, 1998 ).
Three mechanisms have been proposed to account for the lack of beams of Purkinje cell activity. (1) PF asynchrony; the differences in conduction velocity of the PFs limits the synchronized input to a rather short distance from its focal origin (Llinas, 1982 ). (2) Low functional connectivity between PFs and Purkinje cells (Isope and Barbour, 2002 ) and multiple connections along the ascending part of the granule cells axons ensure a patch like response. (3) Molecular layer inhibition: A fast activation of the inhibitory network prevents the activation of PCs along the beam (Bower, 2002 ) see also (Santamaria et al., 2007 ). These three mechanisms are not mutually exclusive.
Here we use voltage sensitive dye imaging in the isolated cerebellum of a Guinea pig to directly measure and characterize the spatial organization of cerebellar cortical responses to the activation of CFs and MFs, and to characterize the role of the molecular layer inhibitory interneurons in shaping these responses.
Materials and Methods
Experimental procedures
Optical measurements from the isolated cerebellar preparation have previously been described (Cohen and Yarom, 1999 ). Briefly, the intact cerebellum and brain stem of young (100–200 g) Guinea pigs were removed from the animals after anesthesia with sodium pentobarbital (30 mg∕Kg). A cannula was inserted into one of the vertebral arteries, through which the preparation was perfused with oxygenated physiological solution (composed of 124 mM NaCl; 5 mM KCl; 1.3 mM MgSO4; 1.2 mM KH2PO4; 26 mM NaHCO3; 10 mM Glucose; 2.4 mM CaCl2; and 5% dextran (T70 Amersham Biosciences)). The cut ends of other main arteries were tied with surgical thread to ensure efficient perfusion. The chamber was also superfused with physiological solution (without dextran) that was heated to 28–30°C. Drugs (DNQX and GABAzine, Sigma) were added directly to the recording chamber.
The voltage sensitive dye RH-414 (molecular probes), dissolved in physiological solution to a final concentration of 2 µg∕µl, was pressure injected using a glass pipette into one of the cerebellar folia to form a stained spot of ∼2 × 3 mm.
Optical signals were recorded from an array containing 128 photodiodes placed at the focal plane of an Olympus microscope (BXFM). Each diode in the array detected light from an area of 70 × 70 µm when using a 20× objective. Tungsten∕halogen lamp (15 V∕150 W) was used as a light source and a filter set (Chroma, 31011) with an excitation filter of 480 nm, a dichroic mirror of 525 nm, and an emission filter of 630 nm was used to excite the dye and record the response. Signals were amplified by a homemade AC-coupled amplifier with a time constant of 200 ms, and then sampled and digitized with 12-bit accuracy at a resolution of 5–10 KHz (Microstar Laboratories, DAP 3400a). Data are presented as traces of absolute change in fluorescence as a function of time at each location.
Concentric bipolar electrodes (FHC) were used to electrically stimulate either the PFs at the surface of the cerebellum, or CFs and MFs about 0.5 to 1 mm deep in the white matter (WM). The stimulus was a single monophasic electrical shock of between 0.1 and 0.2 ms. Field potentials were recorded using glass micropipettes filled with physiological solution, and sharp electrodes filled with 2 M K-Acetate (50–80 MΩ), were used for intracellular recordings. In all electrical recordings, we used an AxoClamp 2B amplifier (Axon Instruments) in current clamp mode. The signal was low-pass filtered at 3 KHz and digitized at 5–10 KHz using a National Instruments A∕D board (PCI-MIO-16XE-10). For data acquisition we used homemade programs operating in the LabVIEW environment. Housing and surgical procedures were in accordance with the Hebrew University Institutional Animal Care and Use Committee.
Data analysis
Data were analyzed using homemade software written in LabVIEW and Matlab. For the spatial and temporal analysis we defined responding diodes as those whose signal to noise ratio (signal amplitude divided by the standard deviation of the noise) exceeded the mean + 1SD. A responding area was defined as a continuous region of responding diodes. For temporal analysis the average trace of all diodes in the responding area was used. Duration was measured at half amplitude and latency at 20% of the amplitude. For spatial analysis we employed principal component analysis of the x, y coordinates of the diodes in the responding area to compute two parameters: the elongation index and the orientation of the response (see Figure 3 D). Elongation index was defined as the ratio of the eigenvalues of the first and second principal components of each response (the ratio between the lengths of the two red lines in Figure 3 D). The orientation was defined as the angle between the first eigenvector of the WM response and the medio-lateral axis (defined by the response to PF stimulation). For the analysis of the dependence of spatial parameters on stimulus intensity, responding diodes were defined as those whose signal to noise ratio was above a certain threshold that was set for all stimulus intensities in each experiment.
Results
We first determined the properties of the different inputs by characterizing the spatio-temporal organization of the optical responses. To this end, an area of 3 × 3 mm was stained with the voltage sensitive dye RH-414. A concentric bipolar electrode was placed on the surface of the cerebellar cortex to stimulate the PF system, and a second stimulating electrode was inserted into the WM just underneath the stained area to stimulate CF and MF. Field potentials were routinely measured and in some experiments intracellular membrane potential was also recorded. It should be noted that the source of the optical signal is not clear. Using synaptic blockers we showed (Cohen and Yarom, 1999 ) that the optical signal in response to surface stimulation is exclusively postsynaptic. Application of DNQX also eliminated the responses to WM stimulation (data not shown). However, the relative contribution of synaptic potentials and intrinsic postsynaptic activity to the optical signal is difficult to assess. Nor is it possible to determine the relative contribution of different cell types to the optical signal. Considering the large membrane area of PC dendrites, it is nevertheless reasonable to assume that they contribute significantly to the signal. Moreover, as demonstrated below, several features of the optical responses correlate very nicely with unique features of PC responses.
Optical responses to white matter stimulation
Surface stimulation elicited a propagating beam of activity along the PF axis that was followed by lateral inhibition (see Cohen and Yarom, 2000 ). WM stimulation elicited a variety of responses that differed in their temporal and spatial features. However, two distinct classes of responses could be readily distinguished. Examples of these two classes are presented in Figure 1 . One class (Figure 1 A) was characterized by a parasagittal organization and a relatively prolonged duration (more than 20 ms at half amplitude). The second class displayed a biphasic response, characterized by a short (usually less than 10 ms) positive phase followed by a prolonged negative component, and was spatially organized in a radial structure (Figure 1 B). We argue that the first and the second classes represent responses to CF and MF activation, respectively.
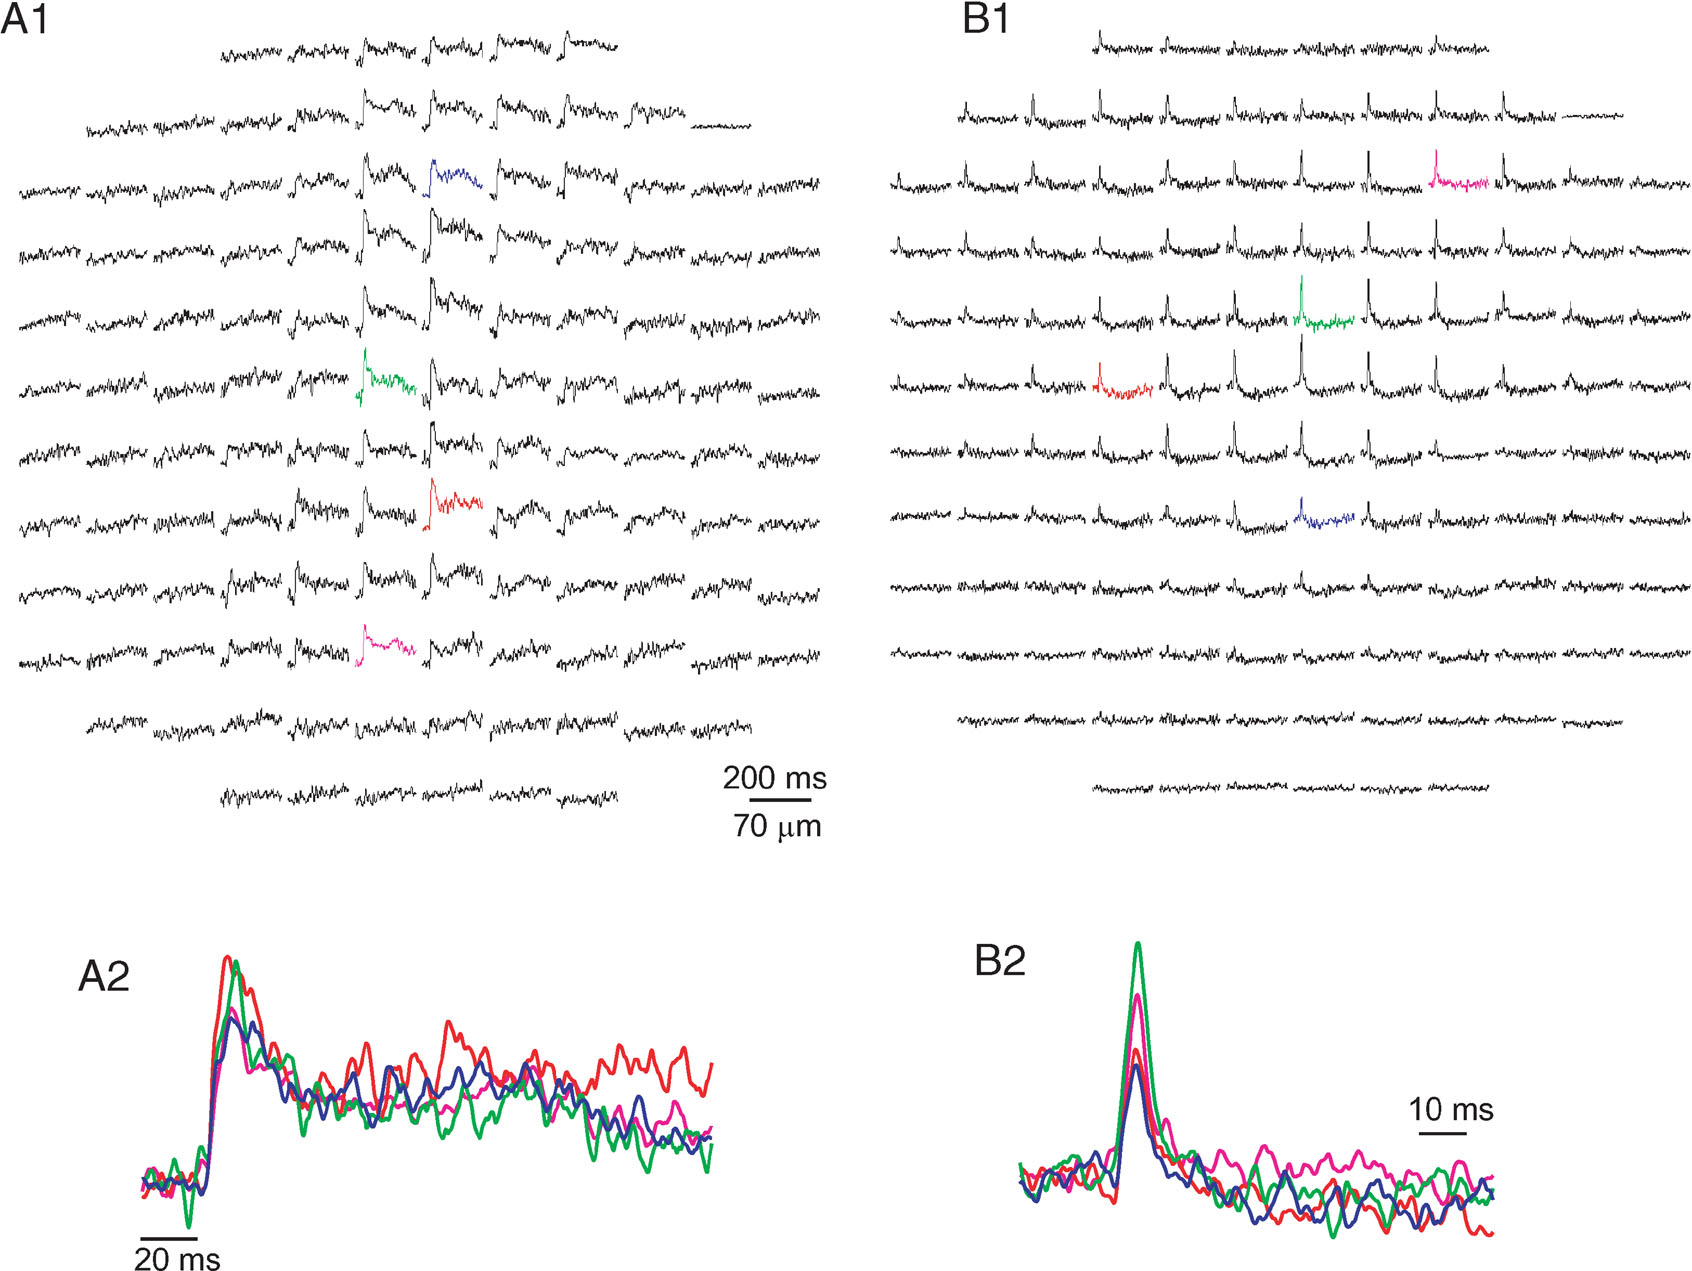
Figure 1. The two classes of responses to white matter stimulation. Responses are displayed as a change in fluorescence as a function of time in 128 sites in the cerebellar cortex. Each diode collects light from an area of 70 × 70 µm with a 20× objective (NA 0.5). All presentations are arranged such that the medio-lateral axis is from right to left. And all presentations show the average of three stimulus repetitions. (A) A response organized in a parasagittal band of excitation, with half duration of 29 ms. The colored diodes from A1 are shown in an enlarged scale in A2. Note the prolonged second positive wave that followed the initial fast response. (B) A radial patch of activity that is composed of a brief excitatory component (5 ms at half amplitude) followed by a prolonged inhibitory component. The colored diodes in B1 are shown in an enlarged scale in B2. Responses of the type shown in A were attributed to CF activation, and responses of the type shown in B to MF activation.
It is interesting to note that occasionally, a late second depolarizing phase was encountered in both types of responses (see Figure 1 A2). Figure 2 demonstrates the waveform similarity between these late optical responses (Figure 2 B) and the late depolarizing responses that are unique to PC dendrites (2A), thus strongly suggesting that the dendrites of PCs contribute significantly to the optical signal. The individual traces of intracellular recordings (2A1) and their average (2A2) show a delayed peak voltage at 200 ms from stimulus onset (arrow). A similar peak can be recognized in the optical recordings (2B) where superimposed traces recorded in the four photodiodes are displayed.
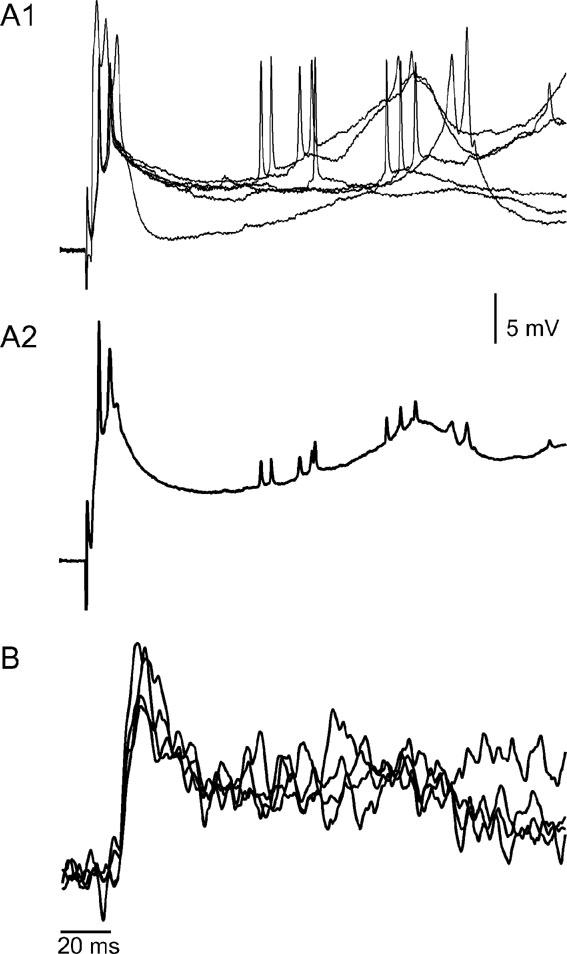
Figure 2. The voltage correlates of the prolonged positive optical signals. (A) Six superimposed traces of intracellular recordings from a PC dendrite (A1) and their average (A2), showing the response to CF stimulation. Note that the initial brief response is followed, after a variable delay, by a prolonged wave of depolarization that occasionally reached threshold and generated a short burst of action potentials. (B) An optical recording from a different experiment showing a waveform similar to that of A2. Traces from four diodes are superimposed.
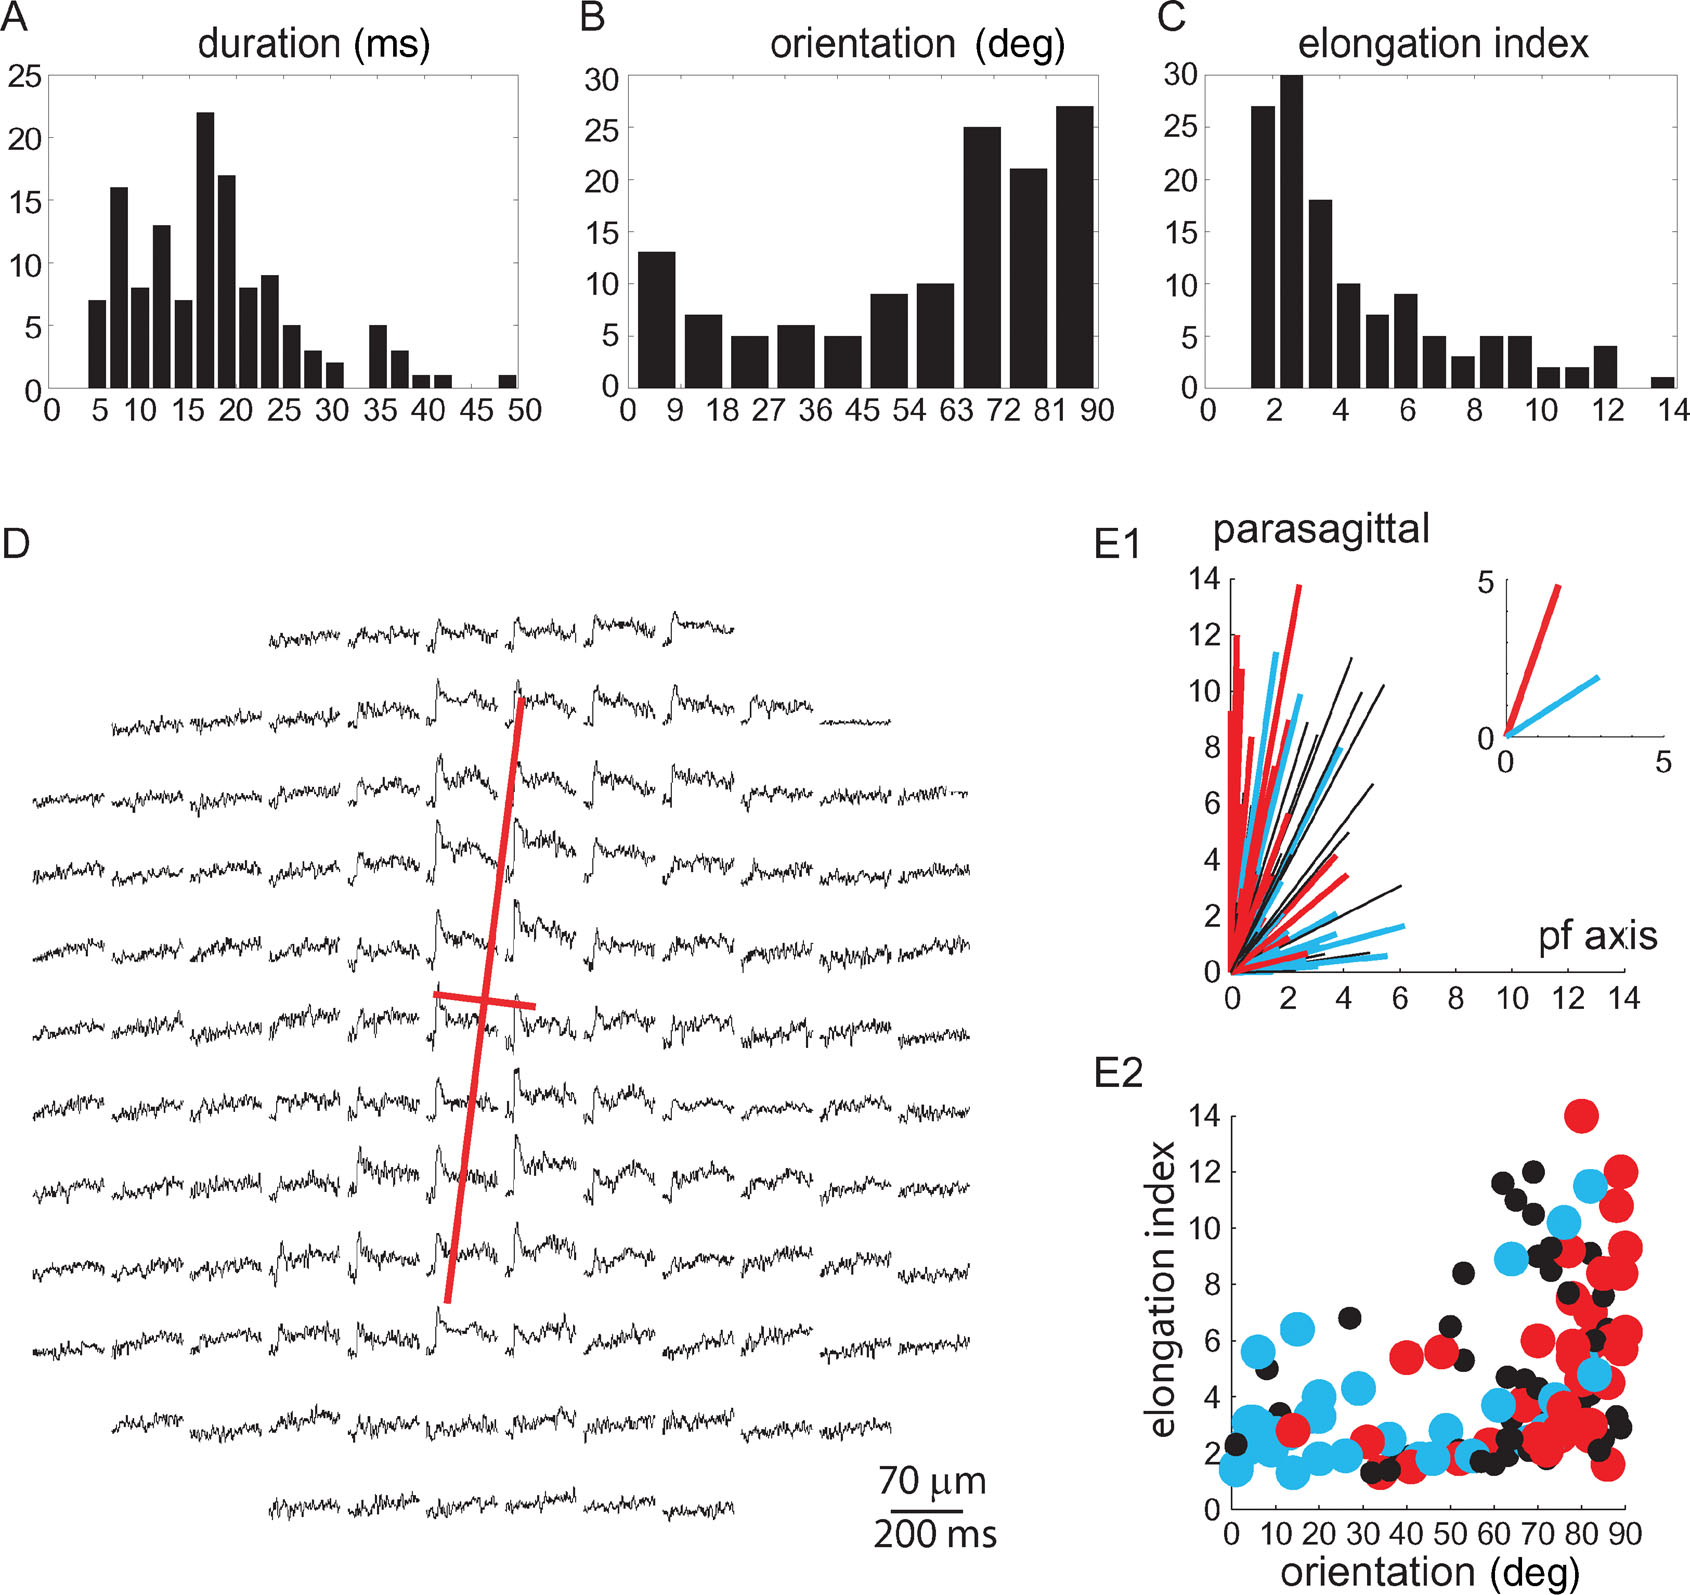
Figure 3. Classification of WM responses. (A–C) Distribution histograms of the duration at half amplitude, orientation, and elongation index of 128 responses to WM stimulation obtained from 67 experiments. (D) The principal components (red lines) of the response to WM stimulation are superimposed on the spatio-temporal display of the response. (E1) Polar plot illustrating spatial organization of the 128 responses. Each line represents a single response, with its length being the elongation index, and its angle the orientation. Red lines represent responses with durations longer than 21 ms, and blue lines represent responses with durations shorter than 12 ms. Black lines represent responses with durations between 12 and 21 ms. The average of the red and blue responses is shown in the inset. (E2) The elongation index of each response is plotted against its orientation. Duration is indicated by colors as in E1. Note that long duration responses, which tend to be elongated, are oriented parasagittally.
Although the two classes of responses could be distinguished, the categorization of single responses was sometimes difficult. Furthermore, most of the optical responses to WM stimulation are likely to represent a combined response, with different relative contributions of both CFs and MFs. Even the simultaneously recorded field potentials could not be used to classify the responses because they could not always be identified and occasionally were uncorrelated with either the temporal or the spatial features of the responses. Namely, the multi peak field potentials (Figure 5 C) or biphasic responses (Figure 4 C) that correspond to CF and MF activation, respectively, were not always associated with parasagittal-oriented responses or patchy responses, respectively. This discrepancy is most likely due to the relatively small number of neurons that generate the electrical recording compared to the number of neurons contributing to the optical recording.
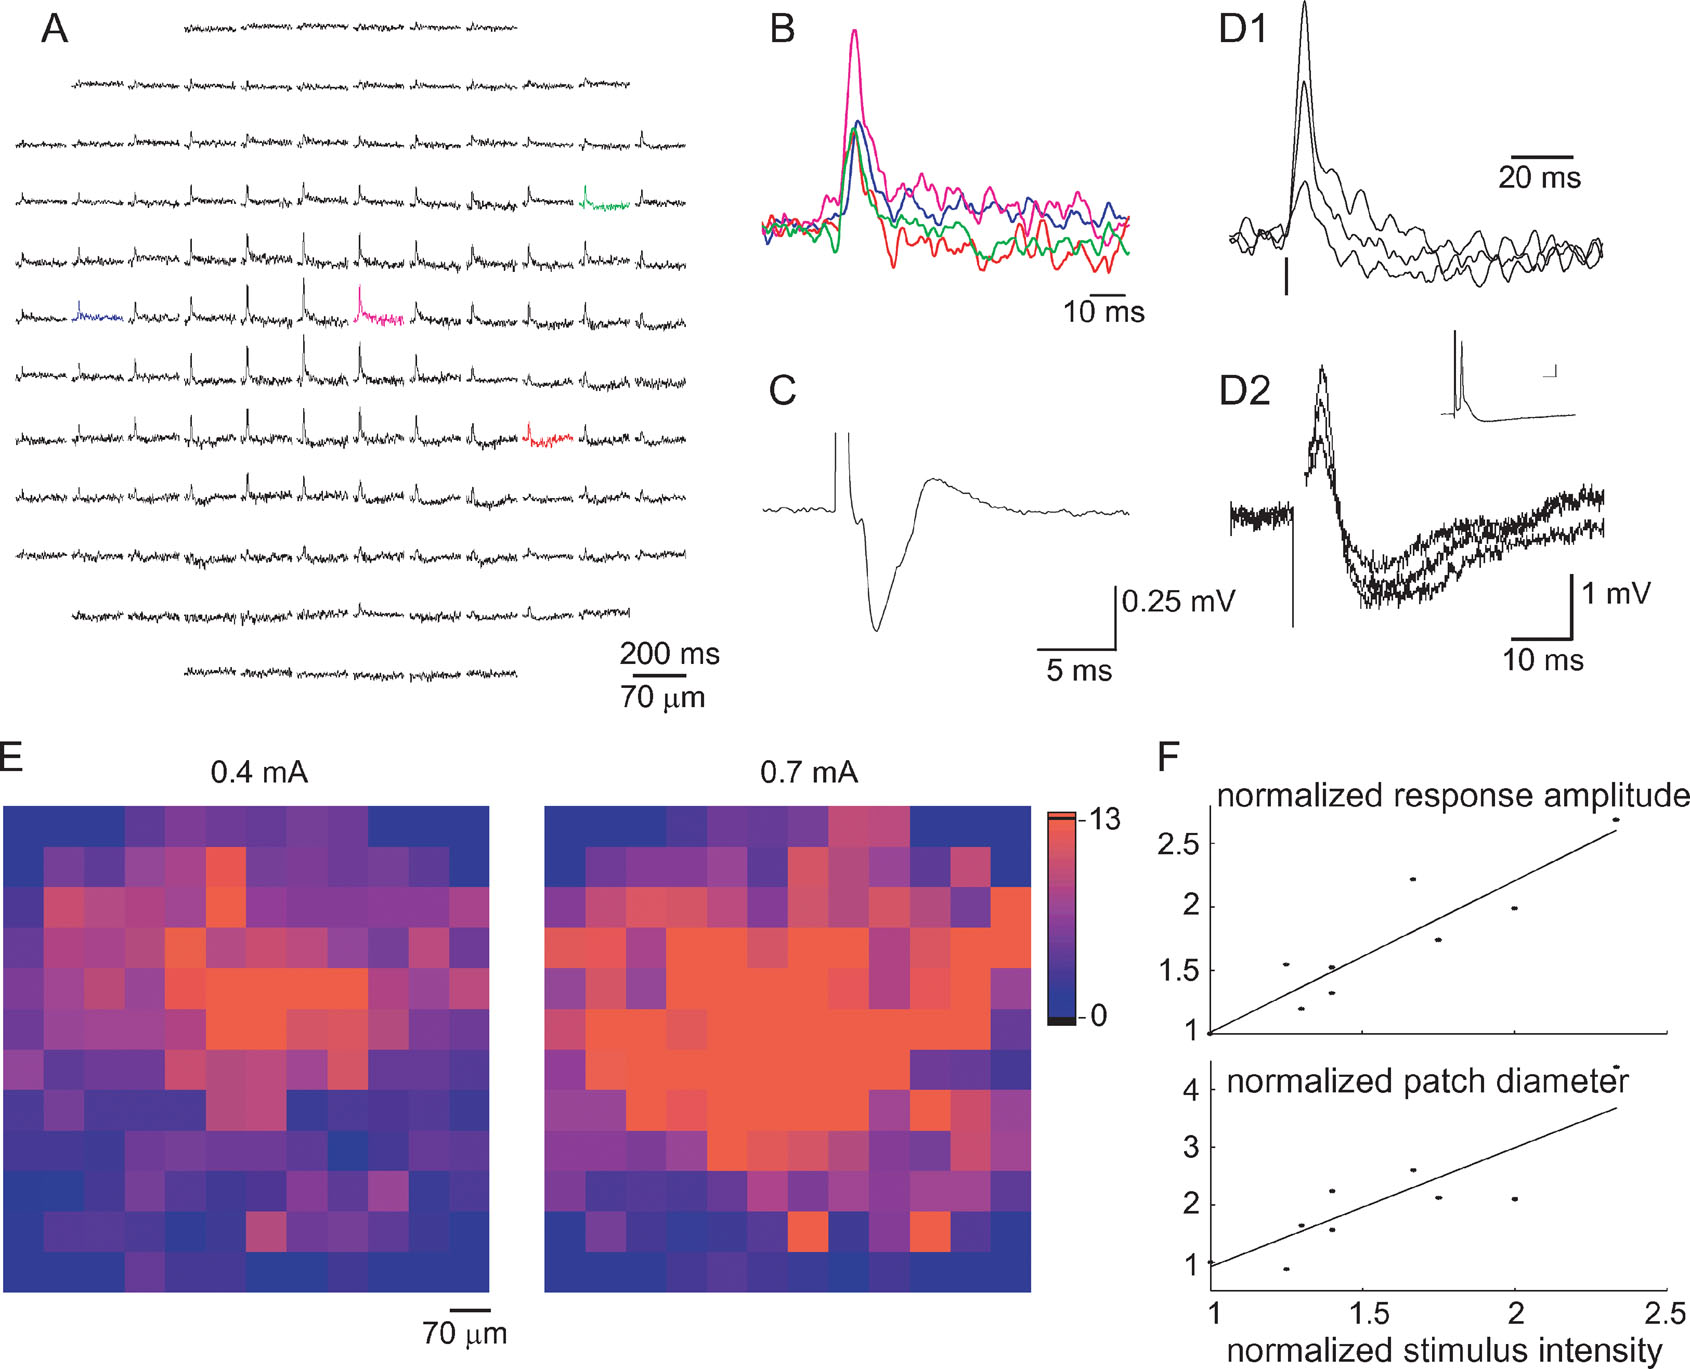
Figure 4. Characterization of mossy fiber responses. (A) An optical response measured by the photodiode array that has been classified as a MF response. The response is spatially organized in a radial patch in which inhibition is evident mainly in the periphery. (B) Four superimposed traces from the colored diodes in A displayed in an enlarged scale, demonstrating the time course of the response. (C) A MF evoked field potential. (D) Comparison between optical responses (D1) to responses recorded intracellularly from a PC (D2) to three stimulus intensities. Inset in D2 shows a suprathreshold stimulus that evoked a simple spike (scales 5 ms and 5 mV). Note the difference in the duration of the hyperpolarized phase of the response. Vertical lines mark stimulus time. (E) Responses to 0.4 and 0.7 mA stimulation presented in a color code of the signal to noise ratio. The color in the location of each diode corresponds to the response amplitude divided by the standard deviation of the noise in the specific diode. (F) Response amplitude (upper panel) and the diameter of the responding patch (lower panel) are plotted against stimulus intensity. The diameter is defined as the average of the two eigenvalues. Data pooled from five experiments and normalized to the values corresponding to the lowest stimulus intensity are used in each experiment.
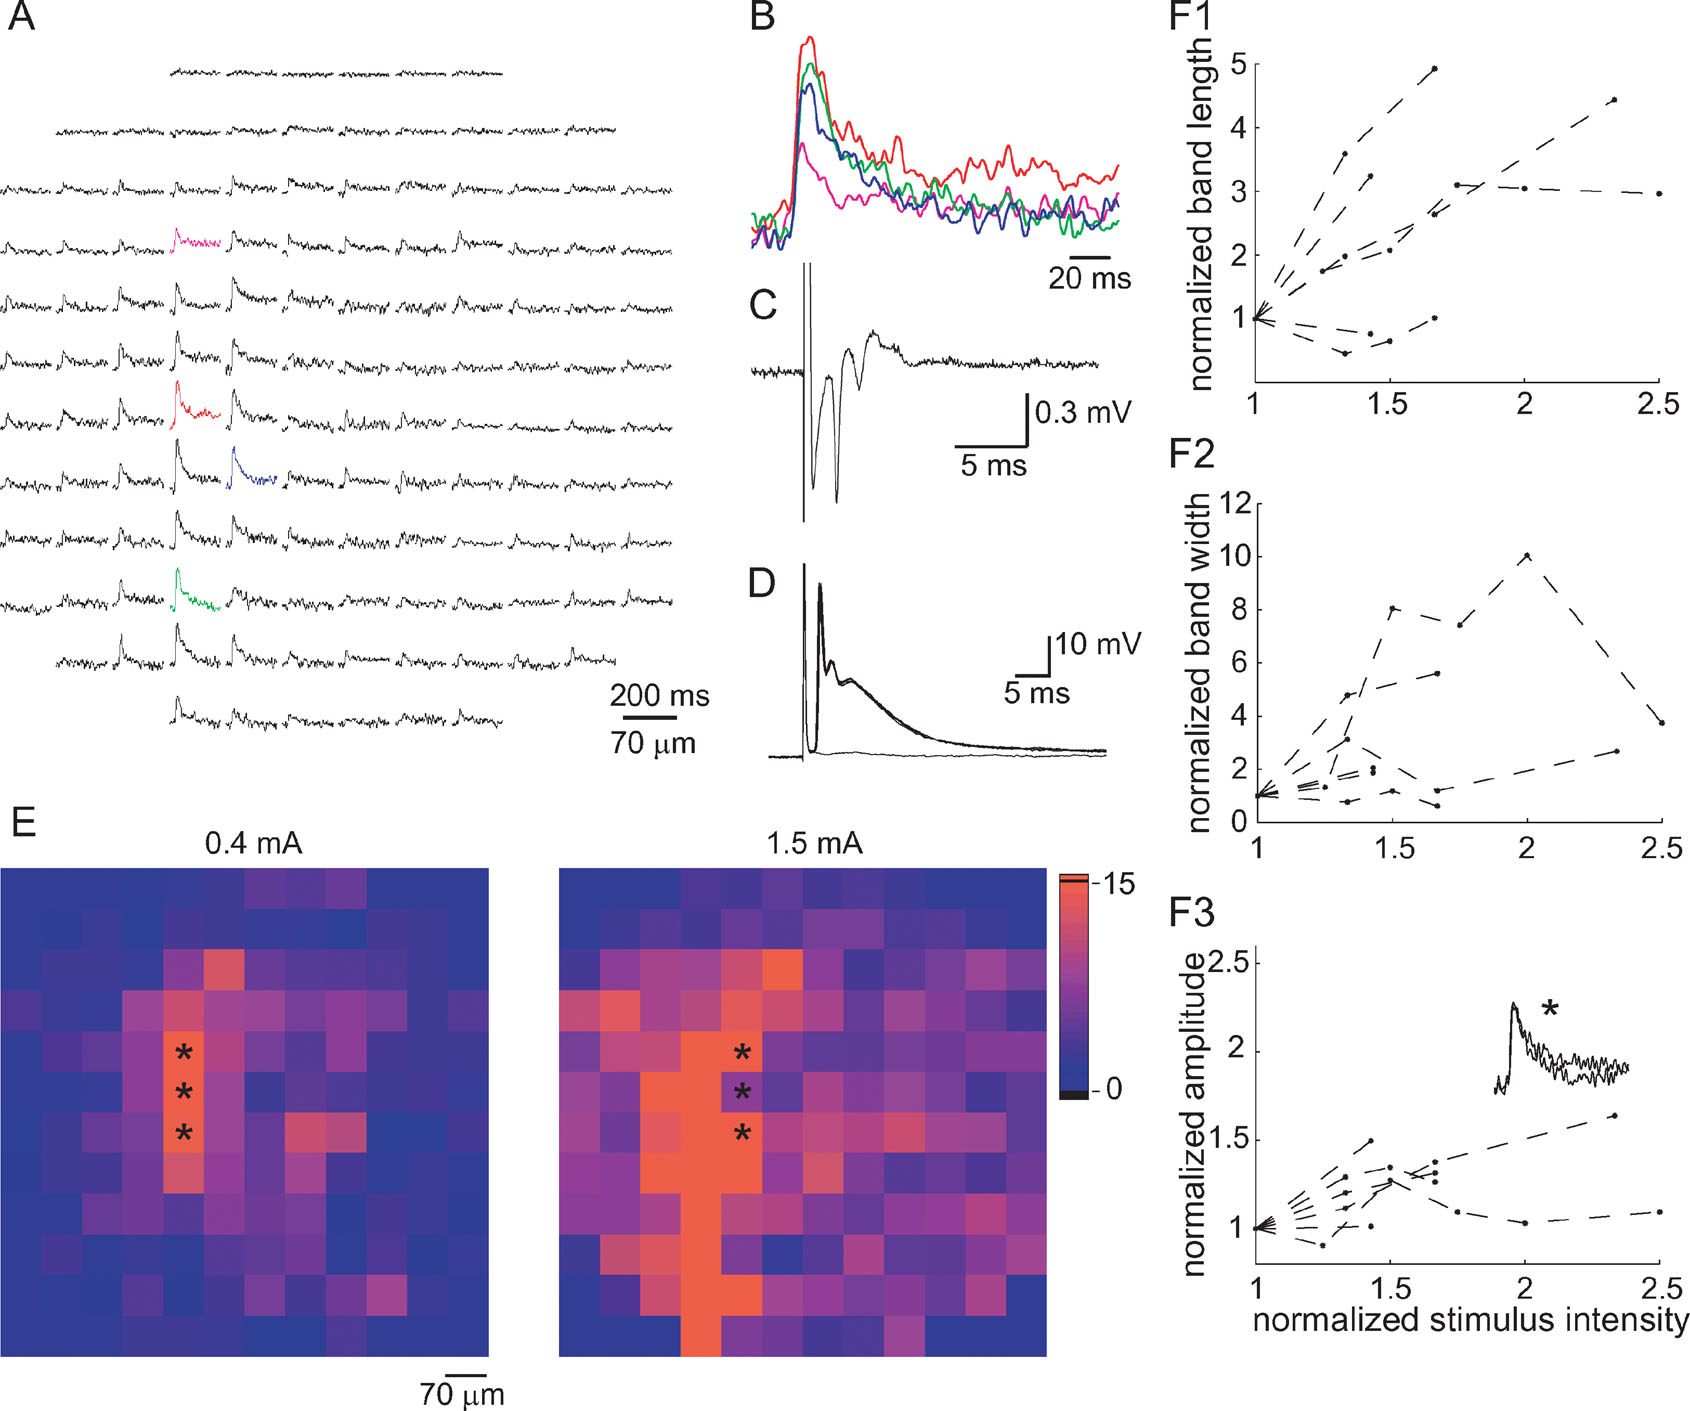
Figure 5. Characterization of climbing fiber responses. (A) An optical response measured by the photodiode array that has been classified as a CF response. (B) Four superimposed traces from the colored diodes in A displayed in an enlarged scale, demonstrating the time course of the response. (C) A complex spike-like field potential at the area scanned by the photodiode array. (D) Six superimposed traces of membrane voltage recorded from a PC, showing the all-or-none nature of the complex spikes. Note that the optical signal is significantly longer than that of the electrical signal. (E) Color-coded presentation of the increase in the spatial distribution of the optical signals following an increase in the stimulus intensity (from 0.4 to 1.5 mA). The color code represents the signal to noise ratio (as in figure 4 E). Note the increase in length and width of the responding area while the parasagittal organization is maintained. (F) The length—F1, the width—F2, and the amplitude—F3 of the optical signals are plotted as a function of stimulus intensity. The first and second eigenvalues of the response were used as measures of length and width of the parasagittal band. Response amplitude was averaged across three diodes in the center of the responding area. Data are pooled from six experiments and all values are normalized to the values corresponding to the lowest stimulus used in each experiment. Dashed lines connect all the points from a single experiment. Inset in F3 shows the average response of the three diodes marked by asterisks in E to stimuli of 0.4 and 1.5 mA. Note that while the responding area increased notably, the amplitude of the response did not change.
To enable unbiased classification of responses to WM stimulation we formulated a set of criteria based on the quantification of spatio-temporal parameters.
Classification of the optical responses
To quantify the spatial distribution of responses we employed principal component analysis of the x, y coordinates of responding diodes to compute two parameters: the elongation index and the orientation of the response (see Section “Methods”). An example of an optical response and its principal components is shown in Figure 3 D. The duration, which was defined as the duration of the mean trace of all diodes, in the responding area, was measured at half amplitude. The distributions of durations, orientations, and elongation indices are shown in Figures 3 A–3 C. None of these distributions can be used to divide the responses into two distinct clusters.
A much more reliable categorization of the responses to WM stimulation was reached by combining the spatial and temporal parameters. The polar plot in Figure 3 E1 depicts the correlation between the elongation index (length of line), and the orientation (angle of line) of the responses. Blue lines represent brief responses whose durations are in the lower 25 percentile (<12 ms, n = 35); red lines represent responses with durations in the upper 25 percentile (>21 ms, n = 34). It clearly shows that long duration responses are parasagittally oriented, and tend to be more elongated, while short duration responses are less elongated and more variable in orientation. This is presented differently in Figure 3 E2 where the elongation index of each response is plotted against its orientation. The duration is represented by colors as in Figure 3 E1. The average orientation of long duration responses was 71 ± 19° relative to the PF axis, and that of short duration responses was 33 ± 29° (mean ± SD, p < 10−7, t-test). Because the short duration responses were more spread in orientation, the standard deviation of their orientation was larger than that of the long duration responses. The average elongation index of the long duration responses was 5.1 ± 3.2 and was significantly larger than that of the short duration responses 3.5 ± 2.4 (mean ± SD, p < 0.03, t-test).
Thus a set of strict criteria for the categorization of WM responses were defined: responses were attributed to CF activation only if their duration was longer than 21 ms and they were oriented parasagittally (angle from PF axis ≥ 70°). Responses were attributed to MF activation if their duration was less than 12 ms and their elongation index was less than 4.
The mossy fiber response
Figure 4 A shows an optical response that is organized in a radial patch and was categorized using the above criteria as a response to MF stimulation. The response in the individual diodes was composed of a fast depolarizing phase followed by a prolonged hyperpolarizing wave. Although the hyperpolarizing wave was more evident in the periphery of the patch, it could occasionally be detected in the middle of the activated area as well (see Figure 1 B1). The short duration of the depolarizing phase is probably caused by the inhibitory component that curtails the response (see Figure 6 ).
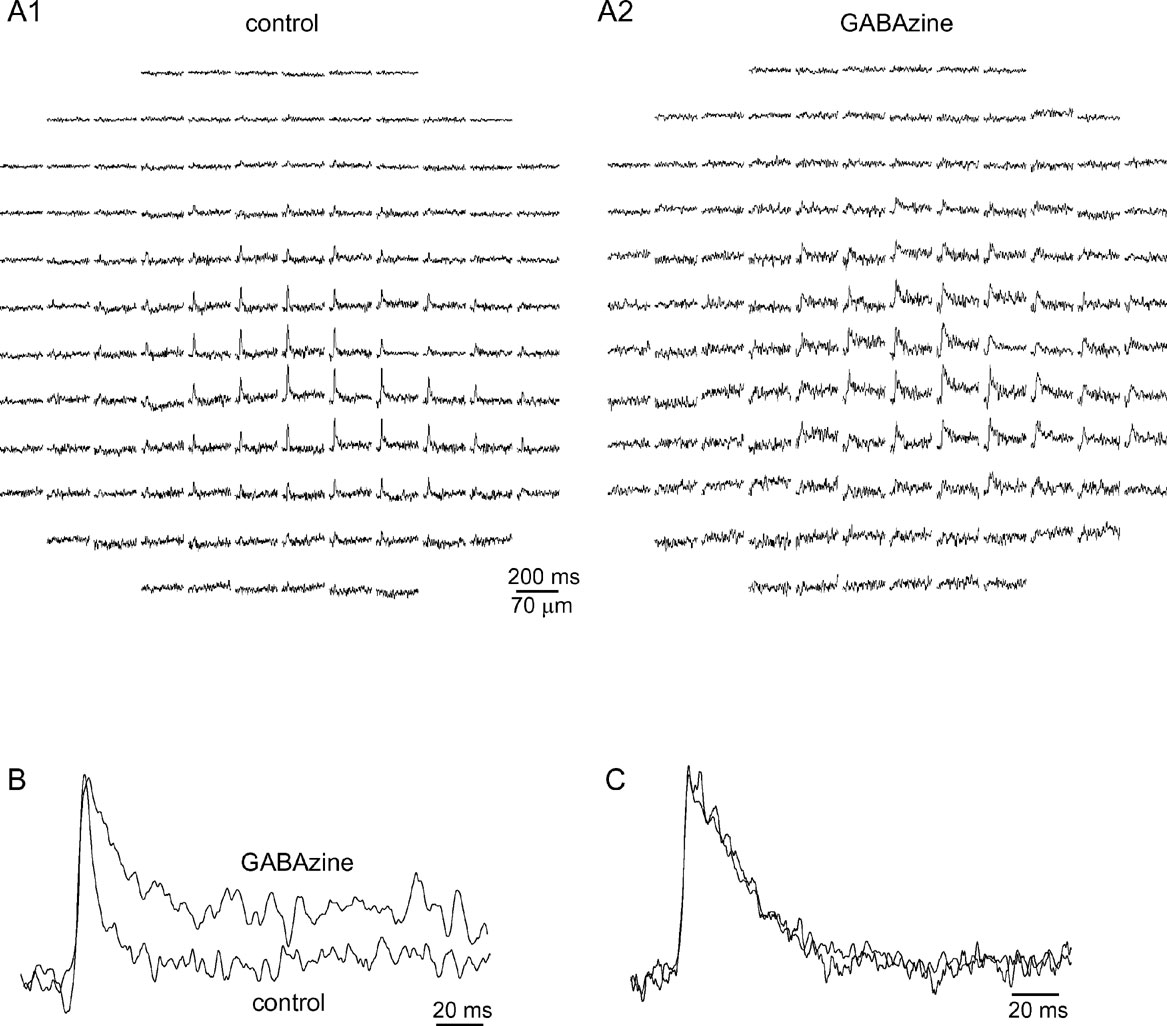
Figure 6. GABAzine prolongs mossy fiber responses without affecting their spatial distribution. (A) The optical response to MF stimulation before A1, and after A2, application of GABAzine (300 nM). (B) The average traces from four diodes in the center of the responses in A are normalized and shown in an enlarged scale. Note the significant prolongation of the response. (C) The average traces from 10 diodes in the center of a response to climbing fiber stimulation before and after application of GABAzine (300 nM).
MF responses had an average latency of 2.25 ± 0.13 ms. A careful examination of the responses in individual diodes revealed latency differences (Figure 4 B). The standard deviation of the latencies ranged from 4% to 43% of the mean latency and averaged to 19 ± 3% (n = 22). The degree of latency differences was independent of the spatial location of the response, suggesting that the PFs are not involved in evoking these responses.
The optical responses were compared to the field potentials and to intracellular recordings from PCs. The typical bi-phasic waveform of the field potential associated with MF responses is shown in Figure 4 C, and an intracellular recording from a PC in 4D2. The bi-phasic nature of the response is evident in all the recording modes. Notwithstanding the qualitative similarity, the responses differ in the relative and absolute durations of the two components: the duration of the depolarizing phase of the optical recordings was somewhat longer than that measured intracellularly (7.6 ± 0.4 and 4.8 ± 0.5 ms, respectively; p < 10−3, t-test; compare Figures 4 D1 and 4 D2) and the duration of the hyperpolarizing component was significantly longer in the optical signal than in intracellular recordings (83 ± 4.7 and 21.2 ± 2.8 ms, respectively p < 10−6, t-test). Since the optical recordings represent a population of neurons of various types, whereas the intracellular recording is, by definition, the response of a single neuron, unsynchronized activation can account for the somewhat longer depolarizing phase, whereas a longer hyperpolarization in molecular layer interneurons can account for the longer negativity of the optical signal.
For analyzing the effect of stimulus intensity, we included only responses that were classified as MF responses in several intensities. In those reponses both the amplitude of the response in each diode and the size of the responding area increased gradually with stimulus intensity (Figures 4 D–4 F). The gradual increase in amplitude is shown in Figures 4 D1 and 4 D2 for the optical and intracellularly recorded responses, respectively. An all-or-none action potential could only be identified in the intracellular recordings (Figure 4 D2 inset). The color coded presentations of the response (Figure 4 E) show that increasing the stimulus intensity increased the responding area while retaining the radial organization. This is quantitatively analyzed in Figure 4 F which shows the relationship between stimulus intensity, and the response amplitude (upper panel) and the size of the responding area (lower panel). Both parameters increased monotonically with stimulus intensity, whereas the activated area usually retained its radial organization.
The climbing fiber response
Figure 5 A shows an optical response that is organized in a parasagittal band and was categorized using the criteria described above as a response to CF activation. The response in the individual diodes was composed of a fast rising depolarizing phase followed by a prolonged exponential decay to the original resting level. The average latency of CF responses was 2.83 ± 0.21 ms (n = 21).
Typically, CF responses were associated with a multi-peak field potential (Figure 5 C), or an all-or-none intracellularly recorded complex spike (Figure 5 D). The half durations of CF evoked optical signals were significantly longer than those of intracellular recordings of complex spikes (29.1 ± 1.2 ms, n = 28 and 21.4 ± 3.7 ms, n = 7, respectively, p < 0.03, t-test). This difference is at least partially due to the criteria used to classify the CF responses (duration > 21 ms). The color coded presentations in Figure 5 E show that increasing the stimulus intensity increased the length and width of the responding area; however, the parasagittal orientation was preserved. Parasagittal band length ranged between 200 µm to the whole field of view (840 µm), and bandwidth ranged between 70 to 300 µm (1–4 diodes). To quantify the relationship between stimulus intensity and spatial organization, the eigenvalues of the first and second components of the PCA (as measures of length and width, respectively) were plotted against stimulus intensity (Figures 5 F1 and 5 F2). Again, we included only responses that were classified as CF responses in several intensities. It shows that both the length and the width of the responding area increased with stimulus intensity. The variable increase in width is due to the very low values at low stimulus intensities (note that when all diodes are in a single column the second eigenvalue is 0). The amplitude of the response (Figure 5 F3) was much less sensitive to stimulus intensity than the length or width of the responding area. Furthermore, in some cases the response amplitude reached saturation, while the responding area still increased with stimulus intensity. This is probably due to the all-or-none nature of CF responses and the limited number PCs in the area covered by each diode. An example is shown in Figure 5 F (lower panel inset), where identical responses to two stimuli that differ by a factor of 3 are superimposed (the locations of the recording diodes is marked by asterisks in Figure 5 E).
Feed forward inhibition governs the time-course, but not the spatial organization of MF responses
The uniqueness of the feed forward inhibition of the cerebellar cortex has been thoroughly discussed (Mann-Metzer and Yarom, 1999 ; Mittmann et al., 2005 ; Santamaria et al., 2002 ). Among its different possible roles it has also been proposed that its fast onset prevents the appearance of a beam of activity in the cerebellar cortex in response to MF input (Bower, 2002 ; Santamaria et al., 2007 ). Hence we studied the role of cortical inhibition by blocking GABAergic transmission. An example of such an experiment is shown in Figure 6 .
In this example GABAzine (300 nM), a specific GABAA blocker, prolonged the duration of the response at half amplitude from 6 ms to 26 ms (Figure 6 B), demonstrating that activation of GABAergic receptors determines the duration of the MF response. Conversely, GABAzine had little effect on the spatial organization of the response (compare Figures 6 A1–6 A2). The elongation index decreased from 2.7 to 1.2 and the orientation shifted from 144° to 79° (it should be noted that when the response has a low elongation index, the orientation is meaningless). Summarizing four such experiments revealed that neither the elongation index nor the orientation were affected by GABAzine, whereas a significant prolongation of the response was evident. Duration increased from 8 ± 0.8 to 21.8 ± 3.35 (mean ± SE, p < 0.01, paired t-test), elongation changed from 2.64 ± 0.2 to 3.33 ± 0.8 (mean ± SE, p > 0.5, paired t-test), and orientation changed from 252 ± 39 to 258 ± 62 (mean ± SE, p > 0.8, paired t-test).
On the other hand, GABAzine had no effect on either the time course or the spatial organization of CF responses. Figure 6 C shows response traces before and after the application of GABAzine. The mean duration of CF responses changed from 26 ± 1.6 ms in control conditions to 30 ± 2.3 ms with GABAzine (mean ± SE, p > 0.1, paired t-test, n = 3).
Discussion
One of the most fundamental issues in neuroscience is that of the relationship of neuronal morphology to the functional organization of neuronal circuits. The cerebellum is, without a doubt, one of the extreme examples of modulation of neuronal form to satisfy geometrical circuit structure. Indeed, the isoplanar nature of PC dendrites, match the truly parallel arrangement of their most numerous input the PF. These afferents arranged to run a strictly linear course in the molecular layer are indeed parallel to each other in all planes. And so, there is a strict geometrical matching of PC dendrites and their orthogonally organized PF input. This peculiar arrangement, present in the cerebellar cortex of all vertebrate forms, results in PCs being contacted by as many PFs as possible (maximum convergence) each PF contacting a PC dendrite only once (maximum divergence) (Cajal, 1952 ; Palay and Chan-Palay, 1974 ). The intuitive view of PCs being activated in a sequential fashion as the activity of PFs spreads along their length, gave rise to the formulation of the hypothesis of cerebellar timing by PF conduction (Braitenberg, 1961 ; Freeman and Nicholson, 1970 ). However, the present paper and several other studies that are discussed below have countered this intuitive view by showing that input arriving through the MF system does not elicit beams of PC activity along the PF axis.
CFs and MFs were activated at the level of the WM and responses were classified according to spatio-temporal parameters. We show that activation of CFs at the level of the WM generates a parasagittally oriented band of excitation with a half duration of about 25 ms. Responses to activation of MFs, on the other hand, are organized radially, and consist of a brief (∼5 ms) depolarizing phase that is followed by prolonged hyperpolarization. We further demonstrate that CF responses are insensitive to GABAergic activity. Conversely, MF responses are prolonged when GABAergic transmission is blocked, but retain the radial spatial organization.
The parasagittal organization of the CF input is supported by several observations. Extracellular recordings of complex spikes have demonstrated higher correlations between PCs that are located in the rostro-caudal axis than those located along the medio-lateral axis (Lang et al., 1999 ; Sasaki et al., 1989 ). Reconstructions of single olivary axons have shown that the entire trajectory of an axon, giving rise to about seven CFs is limited to a narrow parasagittal band of about 300 µm (Sugihara et al., 2001 ). Finally, activation of the inferior olivary nucleus induces parasagittally oriented pH changes in the contra-lateral cerebellar cortex (Dunbar et al., 2004 ; Gao et al., 2003 ).
The patchy organization of the MF input to the cerebellar cortex is also supported by several studies using both electrophysiological and imaging techniques (Cohen and Yarom, 1998 ; Llinas and Sugimori, 1992 ). The somatotopic map in the cerebellar cortex is structured in discontinued patches as opposed to medio-lateral beams as expected from the arrangement of the PF system (Bower and Woolston, 1983 ).
The inhibitory component in the response to MF activation was demonstrated previously using intracellular recordings from Purkinje cells in cerebellar slices (Llinas and Sugimori, 1992 ). The fast activation of this inhibitory pathway has been proposed as a mechanism that impedes the generation of MF evoked propagating beams of activity (Bower, 2002 ). In a recent study, Santamaria and colleagues demonstrated that after blocking inhibition, PCs can be excited along the PF axis with a latency that fits PF propagation time (Santamaria et al., 2007 ). This result is in sharp contrast to our clear demonstration that blocking GABAergic transmission did not affect the spatial organization of the optical responses to MF activation. It is difficult to reconcile these two contradictory observations. We believe that the crucial difference between these two studies is in the technique and the large number of neurons that contribute to the optical signal compared to recordings of single PC activity. Thus it seems that the lack of beams resides in the much higher efficacy and synchrony of synaptic connections in the ascending portion of granule cell axons than in the PFs. (Isope and Barbour, 2002 ; Llinas, 1982 ). We propose, therefore, that the role of PFs is to increase the pool of potential granule cell inputs to each PC and not to time PC activity.
In short, the importance of the present study stems from the use of direct imaging under conditions that enable direct measurements of the spatio-temporal responses in the cerebellar cortex and concludes that radial activation (stars) and longitudinal activation (stripes) do occur, but they are supported by the anatomically least expected structures. Thus longitudinal preterminals generate clusters, clustered terminals generate bands.
Conflict of Interest Statement
The authors declare that the research was conducted in the absence of any commercial or financial relationship that could be construed as a potential conflict of interest.
Acknowledgements
This study was supported by the US- Israel Binational Science Foundation.
References
Barbour, B. (1993). Synaptic currents evoked in Purkinje cells by stimulating individual granule cells. Neuron 11, 759–769.
Bower, J. M. (2002). The organization of cerebellar cortical circuitry revisited: implications for function. Ann. N Y Acad. Sci. 978, 135–155.
Bower, J. M., and Woolston, D. C. (1983). Congruence of spatial organization of tactile projections to granule cell and Purkinje cell layers of cerebellar hemispheres of the albino rat: vertical organization of cerebellar cortex. J. Neurophysiol. 49, 745–766.
Cajal, R. Y. (1952). Structure de l'ecorce cerebelleuse. In Histologie du systeme nerveux II (Madrid, CSIC), pp. 1–54.
Cohen, D., and Yarom, Y. (1998). Patches of synchronized activity in the cerebellar cortex evoked by mossy-fiber stimulation: questioning the role of parallel fibers. Proc. Natl. Acad. Sci. USA 95, 15032–15036.
Cohen, D., and Yarom, Y. (1999). Optical measurements of synchronized activity in isolated mammalian cerebellum. Neuroscience 94, 859–866.
Cohen, D., and Yarom, Y. (2000). Cerebellar on-beam and lateral inhibition: two functionally distinct circuits. J. Neurophysiol. 83, 1932–1940.
D'Angelo, E., De Filippi, G., Rossi, P., and Taglietti, V. (1998). Ionic mechanisms of electroresponsiveness in cerebellar granule cells implicates the action of a persistent sodium current. J. Neurophysiol. 80, 493–503.
Dunbar, R. L., Chen, G., Gao, W., Reinert, K. C., Feddersen, R., and Ebner, T. J. (2004). Imaging parallel fiber and climbing fiber responses and their short-term interactions in the mouse cerebellar cortex in vivo. Neuroscience 126, 213–227.
Eccles, J. C., Ito, M., and Szentagothai, J. (1967). The mossy fiber input into the cerebellar cortex and its inhibitory control by Golgi cells. In The Cerebellum as a Neuronal Machine (Berlin, Heidelberg, New York, Springer Verlag Press), pp. 116–155.
Forti, L., Cesana, E., Mapelli, J., D'Angelo, E. (2006). Ionic mechanisms of autorhythmic firing in rat cerebellar Golgi cells. J. Physiol. 574, 711–729.
Freeman, J. A., and Nicholson, C. N. (1970). Space-time transformation in the frog cerebellum through an intrinsic tapped delay-line. Nature 226, 640–642.
Gao, W., Dunbar, R. L., Chen, G., Reinert, K. C., Oberdick, J., and Ebner, T. J. (2003). Optical imaging of long-term depression in the mouse cerebellar cortex in vivo. J. Neurosci. 23, 1859–1866.
Isope, P., and Barbour, B. (2002). Properties of unitary granule cell → Purkinje cell synapses in adult rat cerebellar slices. J. Neurosci. 15, 9668–9678.
Lang, E. J., Sugihara, I., Welsh, J. P., and Llinas, R. (1999). Patterns of spontaneous Purkinje cell complex spike activity in the awake rat. J. Neurosci. 19, 2728–2739.
Llinas, R. (1982). Radial connectivity in the cerebellar cortex: a novel view regarding the functional organization of the molecular layer. In S. L. Palay and V. Chang Palay, eds. Cerebellum New Vistas Exp. Brain Res. 6, 189–94 [supplement].
Llinas, R., and Sugimori, M. (1980a). Electrophysiological properties of in vitro Purkinje cell somata in mammalian cerebellar slices. J. Physiol. 305, 171–195.
Llinas, R., and Sugimori, M. (1980b). Electrophysiological properties of in vitro Purkinje cell dendrites in mammalian cerebellar slices. J. Physiol. 305, 197–213.
Llinas, R., and Sugimori, M. (1992). The electrophysiology of the cerebellar Purkinje cell revisited. In The Cerebellum Revisited, R. Llinas and C. Sotelo, eds. (New York, Springer Verlag Press), pp. 167–181.
Mann-Metzer, P., and Yarom, Y. (1999). Electrotonic coupling interacts with intrinsic properties to generate synchronized activity in cerebellar networks of inhibitory interneurons. J. Neurosci. 19, 3298–3306.
Midtgaard, J. (1992). Membrane properties and synaptic responses of Golgi cells and stellate cells in the turtle cerebellum in vitro. J. Physiol. 457, 329–354.
Mittmann, W., Koch, U., and Hausser, M. (2005). Feed-forward inhibition shapes the spike output of cerebellar Purkinje cells. J. Physiol. 563, 369–378.
Santamaria, F., Jaeger, D., De Schutter, E., and Bower, J. M. (2002). Modulatory effects of parallel fiber and molecular layer interneuron synaptic activity on purkinje cell responses to ascending segment input: a modeling study. J. Comput. Neurosci. 13, 217–235.
Santamaria, F., Tripp, P. G., and Bower, J. M. (2007). Feedforward inhibition controls the spread of granule cell-induced Purkinje cell activity in the cerebellar cortex. J. Neurophysiol. 97, 248–263.
Sasaki, K., Bower, J. M., and Llinas, R. (1989). Multiple Purkinje cell recording in rodent cerebellar cortex. Eur. J. Neurosci. 1, 572–586.
Sugihara, I., Wu, H. S., and Shinoda, Y. (2001). The entire trajectories of single olivocerebellar axons in the cerebellar cortex and their contribution to cerebellar compartmentalization. J. Neurosci. 21, 7715–7723.
Keywords: cerebellum, imaging, climbing fibers, mossy fibers, Purkinje cells
Citation: Dan Rokni, Rodolfo Llinas and Yosef Yarom (2007). Stars and stripes in the cerebellar cortex: a voltage sensitive dye study. Front. Syst. Neurosci. 1:1. doi: 10.3389/neuro.06/001.2007
Received: 2 August 2007;
Paper pending published: 8 October 2007;
Accepted: 21 December 2007;
Published online: 30 December 2007
Edited by:
Mriganka Sur, Massachusetts Institute of Technology, USAReviewed by:
Eyal Seidemann, The University of Texas, USA; Timothy J. Ebner, University of Minnesota, USACopyright: © 2007 Rokni, Llinas and Yarom. This is an open-access article subject to an exclusive license agreement between the authors and the Frontiers Research Foundation, which permits unrestricted use, distribution, and reproduction in any medium, provided the original authors and source are credited.
*Correspondence: Dan Rokni, Institute of Life Sciences, and Interdisciplinary Center for Neural Computation, Hebrew University, Jerusalem, Israel. e-mail: drokni@gmail.com