1
Max Planck Institute for Biological Cybernetics, Tübingen, Germany
2
Centre for Vision Research, Department of Psychology, York University, Toronto, ON, Canada
3
Department of Psychology, Princeton University, Princeton, NJ, USA
4
Neuroscience Institute and Department of Psychology, Vanderbilt University, Nashville, TN, USA
5
Imaging Science and Biomedical Engineering, University of Manchester, Manchester, UK
Auditory and visual signals often occur together, and the two sensory channels are known to influence each other to facilitate perception. The neural basis of this integration is not well understood, although other forms of multisensory influences have been shown to occur at surprisingly early stages of processing in cortex. Primary visual cortex neurons can show frequency-tuning to auditory stimuli, and auditory cortex responds selectively to certain somatosensory stimuli, supporting the possibility that complex visual signals may modulate early stages of auditory processing. To elucidate which auditory regions, if any, are responsive to complex visual stimuli, we recorded from auditory cortex and the superior temporal sulcus while presenting visual stimuli consisting of various objects, neutral faces, and facial expressions generated during vocalization. Both objects and conspecific faces elicited robust field potential responses in auditory cortex sites, but the responses varied by category: both neutral and vocalizing faces had a highly consistent negative component (N100) followed by a broader positive component (P180) whereas object responses were more variable in time and shape, but could be discriminated consistently from the responses to faces. The face response did not vary within the face category, i.e., for expressive vs. neutral face stimuli. The presence of responses for both objects and neutral faces suggests that auditory cortex receives highly informative visual input that is not restricted to those stimuli associated with auditory components. These results reveal selectivity for complex visual stimuli in a brain region conventionally described as non-visual "unisensory" cortex.
The perception of communication signals is one example of multisensory integration that occurs in the daily life of social primates: both visual and auditory channels provide information through facial expressions and vocalizations, respectively (Ghazanfar and Logothetis, 2003
; Izumi and Kojima, 2004
; Jordan et al., 2005
; Sumby and Pollack, 1954
). Evidence from some fMRI studies suggests presumptive “unisensory” auditory areas, such as auditory cortex, can be active merely in the presence of the corresponding visual speech stimulus (Calvert and Campbell, 2003
; Calvert et al., 1997
; MacSweeney et al., 2000
; Pekkola et al., 2005
, 2006
), although other studies have failed to find such activation (Bernstein et al., 2002
; Olson et al., 2002
; Wright et al., 2003
). At the neural level, growing evidence suggests activity in primary and secondary sensory cortices can be modulated by alternate sensory modalities. Anatomical evidence in monkeys reveals auditory inputs in V1 and V2, including those from primary auditory cortex (Falchier et al., 2002
; Rockland and Ojima, 2003
), and, in humans, visual cortex can respond to auditory stimulation (Martuzzi et al., 2007
; Watkins et al., 2006
). Previous work has demonstrated that the auditory cortex responds to visual and/or somatosensory stimuli (Bizley et al., 2007
; Schroeder and Foxe, 2002
), consistent with anatomical connectivity (Bizley et al., 2007
; Lewis and Van Essen, 2000
) and fMRI results of visual stimulation in monkeys (Kayser et al., 2007
) and humans (Martuzzi et al., 2007
).
Of particular interest are the few studies reporting that neural responses can contain specific information about another sensory modality, and not simply the presence or absence of a stimulus. Fu and colleagues (Fu et al., 2003
) showed that cells in the posterior belt region of auditory cortex (area CM) were selective for various types and locations of somatosensory input. In cat area 17, visually responsive cells also show auditory frequency tuning curves (Spinelli et al., 1968
), and cells in areas 18 and 19 show spatial selectivity to auditory stimuli that corresponds to the spatial selectivity in the visual domain (Morrell, 1972
). Yet to date, the selectivity of neurons in primary and secondary auditory cortex to complex visual stimuli has been unexplored. This absence is all the more striking, given the discrepant fMRI results of multisensory integration of speech signals in auditory cortex, mentioned above, and the recent exploration of multisensory effects for communication signals in monkey auditory cortex; namely, that auditory cortical sites integrate the auditory and visual components of species-typical vocalizations (Ghazanfar et al., 2005
).
Here, we present images of conspecific monkey faces taken in mid-vocalization, neutral faces, and various objects, while recording in auditory core, lateral belt, and the upper bank of the superior temporal sulcus to determine whether and how complex visual stimuli can be differentiated in auditory processing regions of the brain.
Surgical Implantation
Two adult male macaques (Macaca mulatta) were surgically implanted under sterile conditions, each with a scleral search coil, a head restraint post, and a custom-designed chamber. The 19 mm inner diameter of the chamber was centered directly above auditory cortex of the left hemisphere in stereotaxic (Frankfurt) coordinates, as determined by pre-operative MR images (chamber center in monkey 1: AP +8.0, ML +18.0; in monkey 2: AP +7.5, ML +22.5). Experiments were conducted with the approval of local authorities (Regierungspraesidium) and in accordance with the guidelines of the European Community (EU VD 86/609/EEC) for the care and use of laboratory animals.
Task Design
The head-restrained monkey viewed stimuli presented centrally on a monitor positioned 94 cm ahead of him. A fixation dot marked the beginning of a trial and, after 500 ms of fixation in a 1–2° radius window of the fixation dot, a 10 × 7.3° stimulus was presented for another 500 ms. After the offset of the stimulus, the monkey received juice reward for holding fixation. Stimuli consisted of 12 examples of 3 categories of images: faces, objects, and Greebles (Figure 1
), all presented on a rectangular white background. The face stimuli included 2 images from each of 6 different monkeys: one image showed the face at its peak open-mouthed position during either coo or grunt vocalizations; the other image was without any obvious facial contortions or expressions, and was thus termed “neutral”. The objects were taken from a database of clip art images, are presumably unfamiliar to the monkey, excepting the monitor shown in Figure 1
, and are therefore not explicitly associated with any sounds. The Greeble stimuli constituted a homogeneous subset of artificial objects (Gauthier and Tarr, 1997
), and were also never presented with sounds. Stimuli were mean luminance-matched, and stimulus size was equated, within the constraints of the differently-shaped objects. (In a control experiment, stimulus size was changed, but in no case were the responses significantly altered. Data not shown.). Each of the 3 categories was presented randomly without replacement, and the exemplars selected from within a category were also sampled randomly without replacement. Typically, 10 repetitions of each stimulus were presented in each recording session, for a total of 120 trials per category, with a minimum of 96 trials per category.
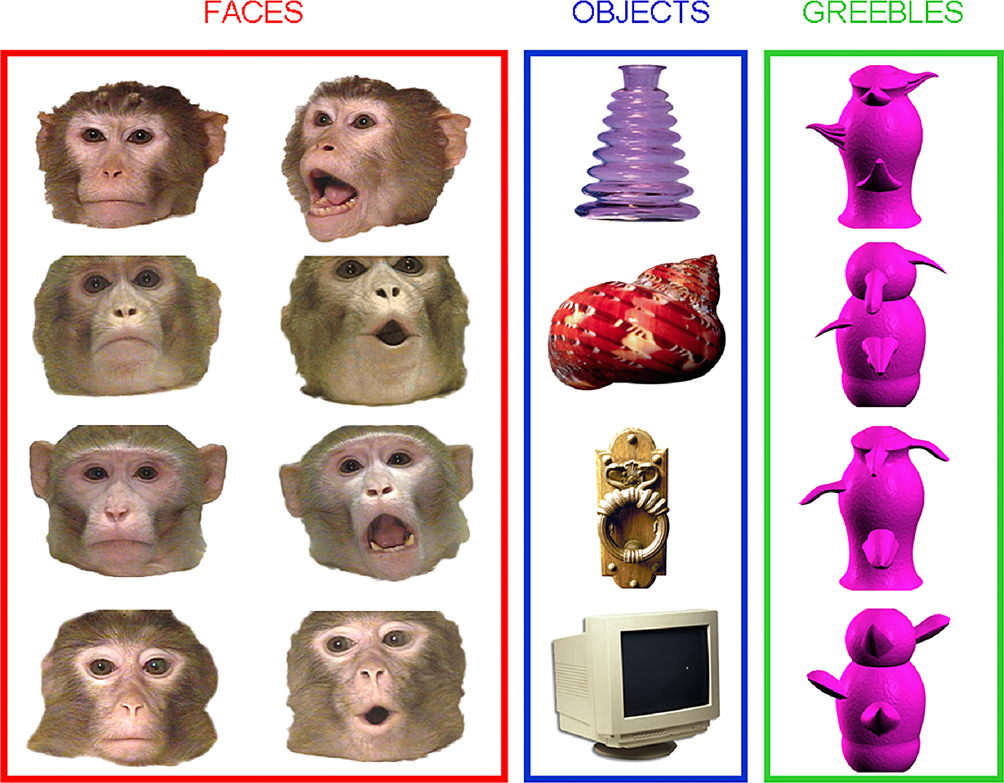
Figure 1. Examples of stimuli, grouped by category assignment. Face examples are outlined in red, with neutral faces in the left column and the respective monkey’s vocalization expression in the right column. The vocalization examples are composed of grunts (shown in the top example) and coos (shown in the bottom example). Clip-art object examples are shown in the blue column, and asymmetric Greeble examples in the green column.
Electrode Recordings
A custom-made electrode drive positioned electrodes in a 4 × 2 staggered array, covering 12 mm along the anterior–posterior axis and 1.5 mm along the medio-lateral axis. Glass-coated tungsten electrodes with impedances between 1 and 3 MΩ were used (Alpha Omega LTD, Nazareth, Israel; impedances measured at 1 kHz). After guide tube penetration of the dura, each electrode was lowered independently into auditory cortex. An electrode was considered to be in auditory cortex only if consistent multiple-unit modulation to auditory stimuli was observed. Search stimuli included pure tones, broadband noise, frequency modulated sweeps and conspecific vocalizations. These stimuli were not observed to modulate activity in the underlying cortex of the superior temporal sulcus. Frequency tuning curves were obtained for auditory cortex electrode sites using the MUA in response to 25 pure tone pips ranging from 100 Hz–21 kHz at 72 dB. When the medio-lateral position of the electrode array was centered in the chamber, a resultant tonotopic map identified the recording regions in “core” primary auditory cortex (A1). When the array was moved 2–3 mm laterally, electrode sites generally showed stronger responses to noise and complex stimuli than to the pure tones, a hallmark of lateral belt activity (Barbour and Wang, 2003
; Rauschecker et al., 1995
). The auditory cortex electrodes were subdivided into core (primary auditory cortex, A1) and the corresponding lateral belt region (Middle Lateral Belt, ML) on this basis, though the most anterior electrodes may have entered the posterior border of the rostral area (area R) and anterior lateral belt (AL) in core and belt, respectively (Figure 2
). In most, but not all, sessions included in the analysis, a subset of electrodes was lowered to the upper bank of the superior temporal sulcus (STS). As predicted by the anatomical MR images, over 2 mm distance of presumptive white matter was traversed before multiple-unit activity resumed (mean distance between auditory cortex and STS = 3.4 mm). In STS, units were no longer strongly driven by auditory tones, and could occasionally be modulated by visual motion.
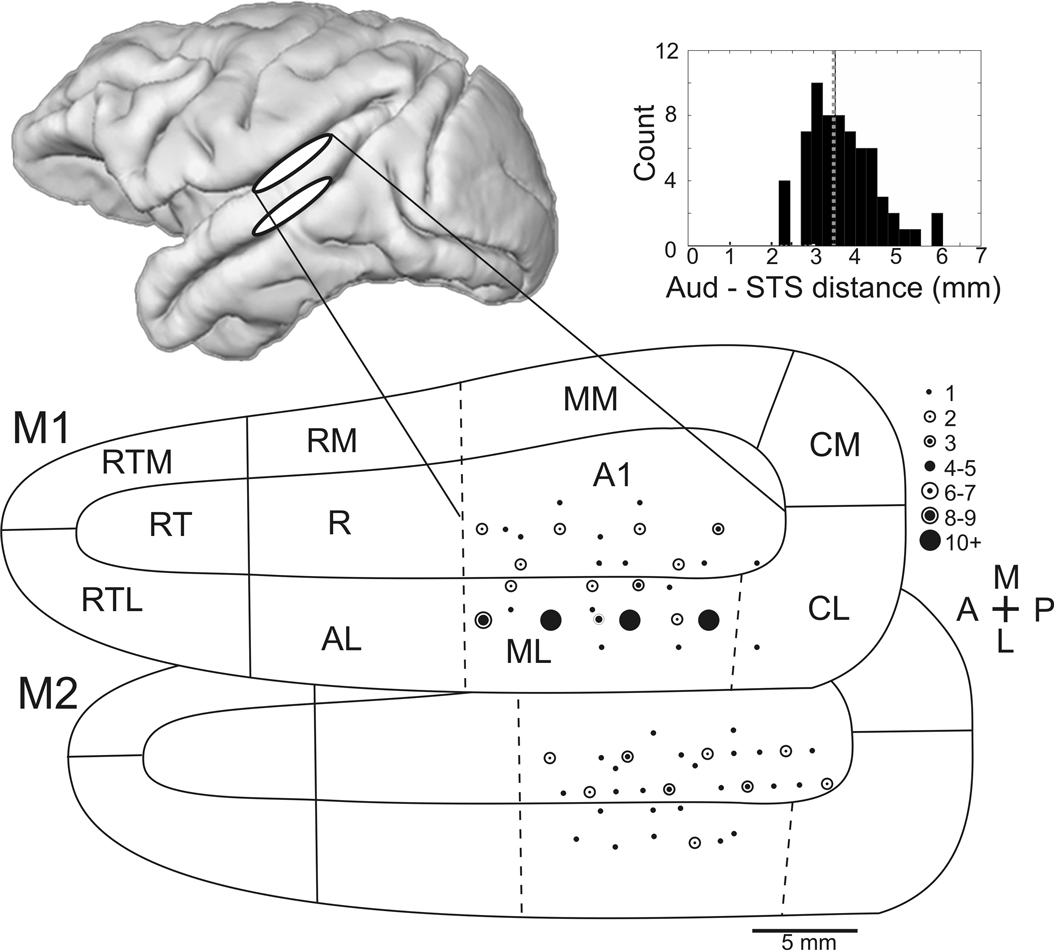
Figure 2. Recording sites in auditory cortex. Approximate recording locations for the auditory cortex (top white ellipse) and the superior temporal sulcus (lower white ellipse) shown on the lateral view of a macaque brain rendered from an MR image. Flattening the surface of the lower bank of the lateral sulcus, the relative positions of auditory cortex regions can be seen (adapted from Kaas and Hackett, 2000
). The top and bottom maps show electrode locations for monkey 1 and monkey 2, respectively. The number of times that a recording location was sampled is indicated by the size of the dot. Dotted lines indicate anatomical boundaries that have no discrete functional boundary (e.g., tonotopic reversals between A1 and R) and therefore could not be determined from the functional mapping. Inset: histogram of distances between auditory cortex and the superior temporal sulcus. The mean distance is indicated by a dotted line. Abbreviations of cortical areas: AI, auditory area I; R, rostral area; RT; rostrotemporal area; CL, caudolateral area; CM, caudomedial area; ML, middle lateral area; RM, rostromedial area; AL, anterolateral area; RTL, lateral rostrotemporal area; RTM, medial rostrotemporal area; CPB, caudal parabelt; RPB, rostral parabelt.
Signal from each electrode was referenced to the cranial implant chamber, amplified, band-pass filtered between 1 and 5000 Hz, and continuously recorded at 20.8 kHz sampling rate (filtering and amplification, Alpha Omega LTD, Nazareth, Israel; A/D data acquisition, National Instruments BNC-2090).
Data Analysis
Each continuously recorded signal was processed separately for local field potentials (LFP) multiple unit activity (MUA) and single unit activity (SUA). Both LFP and MUA signals were obtained with a 2nd order Butterworth filter and were zero-phase adjusted. LFP signal was band-pass filtered from 1–300 Hz; MUA signal was high-pass filtered at 500 Hz and rectified. For SUA, the continuously recorded signals were loaded into an offline spike sorting program and isolated based on spike peak and valley amplitude, energy, and the first 3 principal components of the wave shape (Plexon Inc., Dallas, TX).
Significant activation to visual stimuli was defined as follows. The mean response to each stimulus category was calculated. The time point reflecting the overall maximum deviation from baseline was selected, whether above or below baseline, for faces or objects, whichever was greater. Because the LFPs can change rapidly, and even reverse polarity, within 100 ms, the measure used needed to be confined to a small window around the strongest peak of activation (positive- or negative-going for LFPs). Thus, for each trial within a category, the mean activity within a window ±20 ms around the peak time point was compared to the mean activity during 100 ms of baseline immediately preceding image onset. Category-specific responses were calculated in the same way, except only the greatest peak value across categories was considered (typically this was the face “N100”), and the response distribution to one category was compared, not to baseline, but to the other category’s distribution around that time point (unpaired t-tests). Note that this is a fairly conservative measure of category selectivity, assuming that if any difference in response across categories exists, it will be detected at the point of maximal deviation from baseline. The same procedure was applied to the MUA and to the spike density function of the SUA, obtained by convolving the spiking activity with a Gaussian kernel (σ = 10 ms).
In addition to comparing neural responses across categories (grouped over all exemplars), we were interested in examining whether neural responses to each exemplar clustered according to our pre-defined categories, and whether there might be sub-clusters within a category. Principal components analysis was conducted for each electrode site using the mean local field potential response for each exemplar (i.e., 12 exemplar responses per category). Of the resultant component responses over time, the peak values for the first two components were selected and plotted. The significance of linear separability between categories was assessed by randomly assigning the 24 responses (12 object, 12 face) into 2 categories and recording the number of electrode sites for which responses were linearly separable.
To further characterize the neural response to face stimuli in auditory cortex, and its possible origins, response latencies were compared within two auditory regions and between auditory cortex and STS. Latencies measuring the characteristic negative peak in the face response were measured as the time at which the mean response to faces reached an absolute minimum. Onset latencies, in contrast, indicate the time at which the mean response to faces at a given electrode site exceeds two standard deviations of the baseline response, and remains so until the negative peak is reached. In addition to measuring timing around the negative peak, a cross-correlation analysis was conducted as a more global measure of response offsets between areas. For this analysis, simultaneously recorded signal from adjacent electrode pairs – one auditory cortex and one STS electrode – were used. All electrode pairs whose maximal correlation coefficient exceeded 0.2 were included, based on the observation that this threshold corresponded to the minimum value at which the two responses sufficiently resembled each other. This cutoff ensured that the maximum correlation coefficient reflected a reasonable fit between the two responses, independent of the magnitude or direction of latency differences (our measures of interest).
Activity from a total of 127 electrode sites in auditory cortex was analyzed for responsiveness to visual stimuli (monkey 1: 83; monkey 2: 44). All 127 electrode sites showed a significant local field potential (LFP) deviation from baseline in response to at least one of the two categories (t-test, p < 0.01), and 98% of sites (124/127) were category specific (t-test, p < 0.01). In comparison, only 20% of the same electrode sites showed significant multiple unit activity (MUA) to visual stimuli, and only 3 sites (2%) were category specific (Figure 3
). From those electrode sites that showed significant MUA, 27 single units were isolated. Of these, 13 showed significant modulation to visual stimuli and 5 units were category specific (both: t-test, p < 0.05). The category-specific units were isolated from each of the three category-specific MUA sites; thus, the single-unit activity largely paralleled the multi-unit activity, but responses were rare and weak. Because of the sparsity and relative ineffectiveness of the category-specific SUA and MUA responses relative to the corresponding LFP responses (<5% vs. 98%, respectively), the remaining analyses will focus on the LFP signal.
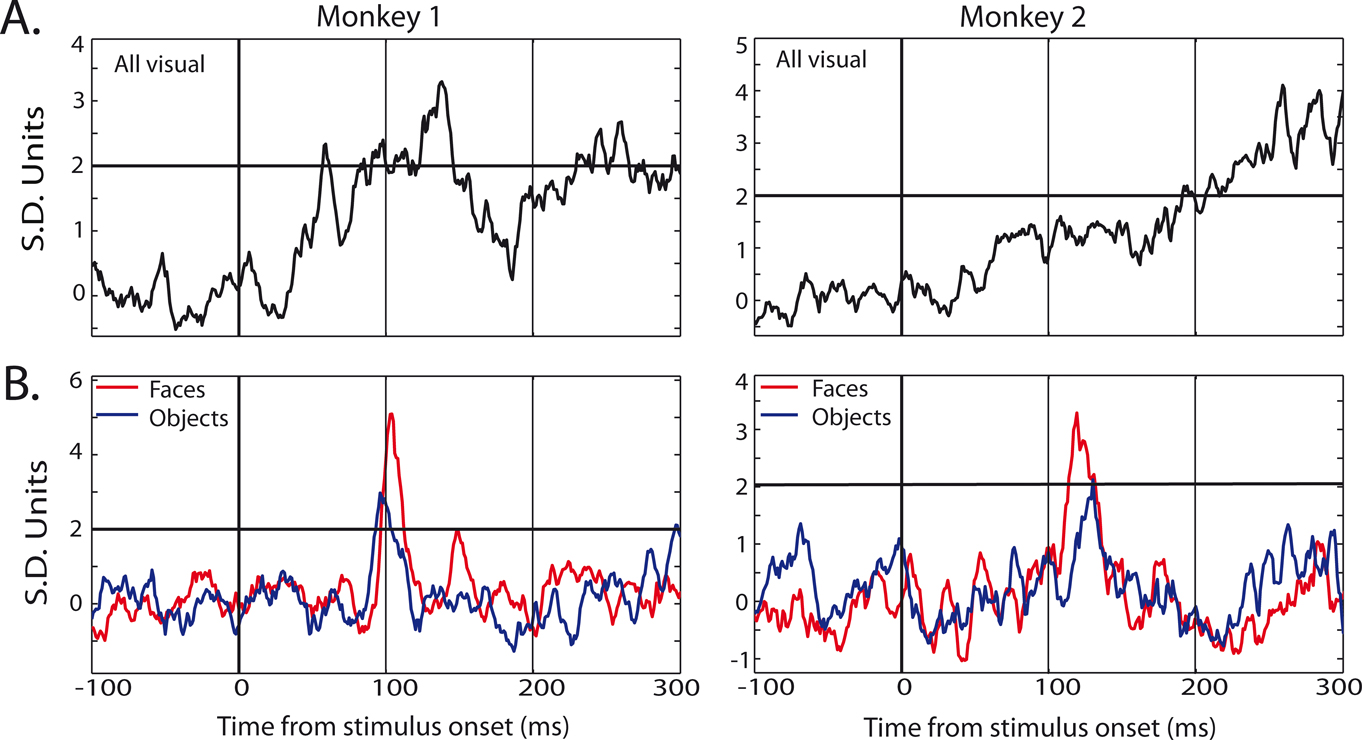
Figure 3. Example MUA responses in auditory cortex from four electrode sites. (A) Mean response to visual stimuli, collapsed across category, for electrode sites in monkey 1 (left) and monkey 2 (right). (B) Mean responses to face (red) and object (blue) stimuli, for electrode sites in monkey 1 (left) and monkey 2 (right). Responses are shown in standard deviation units from baseline activity (the horizontal line indicates 2 SD units), aligned to stimulus onset.
Comparison of Responses to Faces vs. Objects
Both object and face stimuli elicited significant LFP responses in auditory cortex, however, the responses often differed by category. In 97% of visually-responsive sites, the face and object response peaks differed, with object responses tending to occur at longer latencies and/or lower magnitudes than face responses (Table 1
). Although both face and object responses typically involved an initial negative component followed by a broader positive component, the response to objects was more variable across electrode site and session than was the response to faces (Table 1
, Figure 4
C and D).
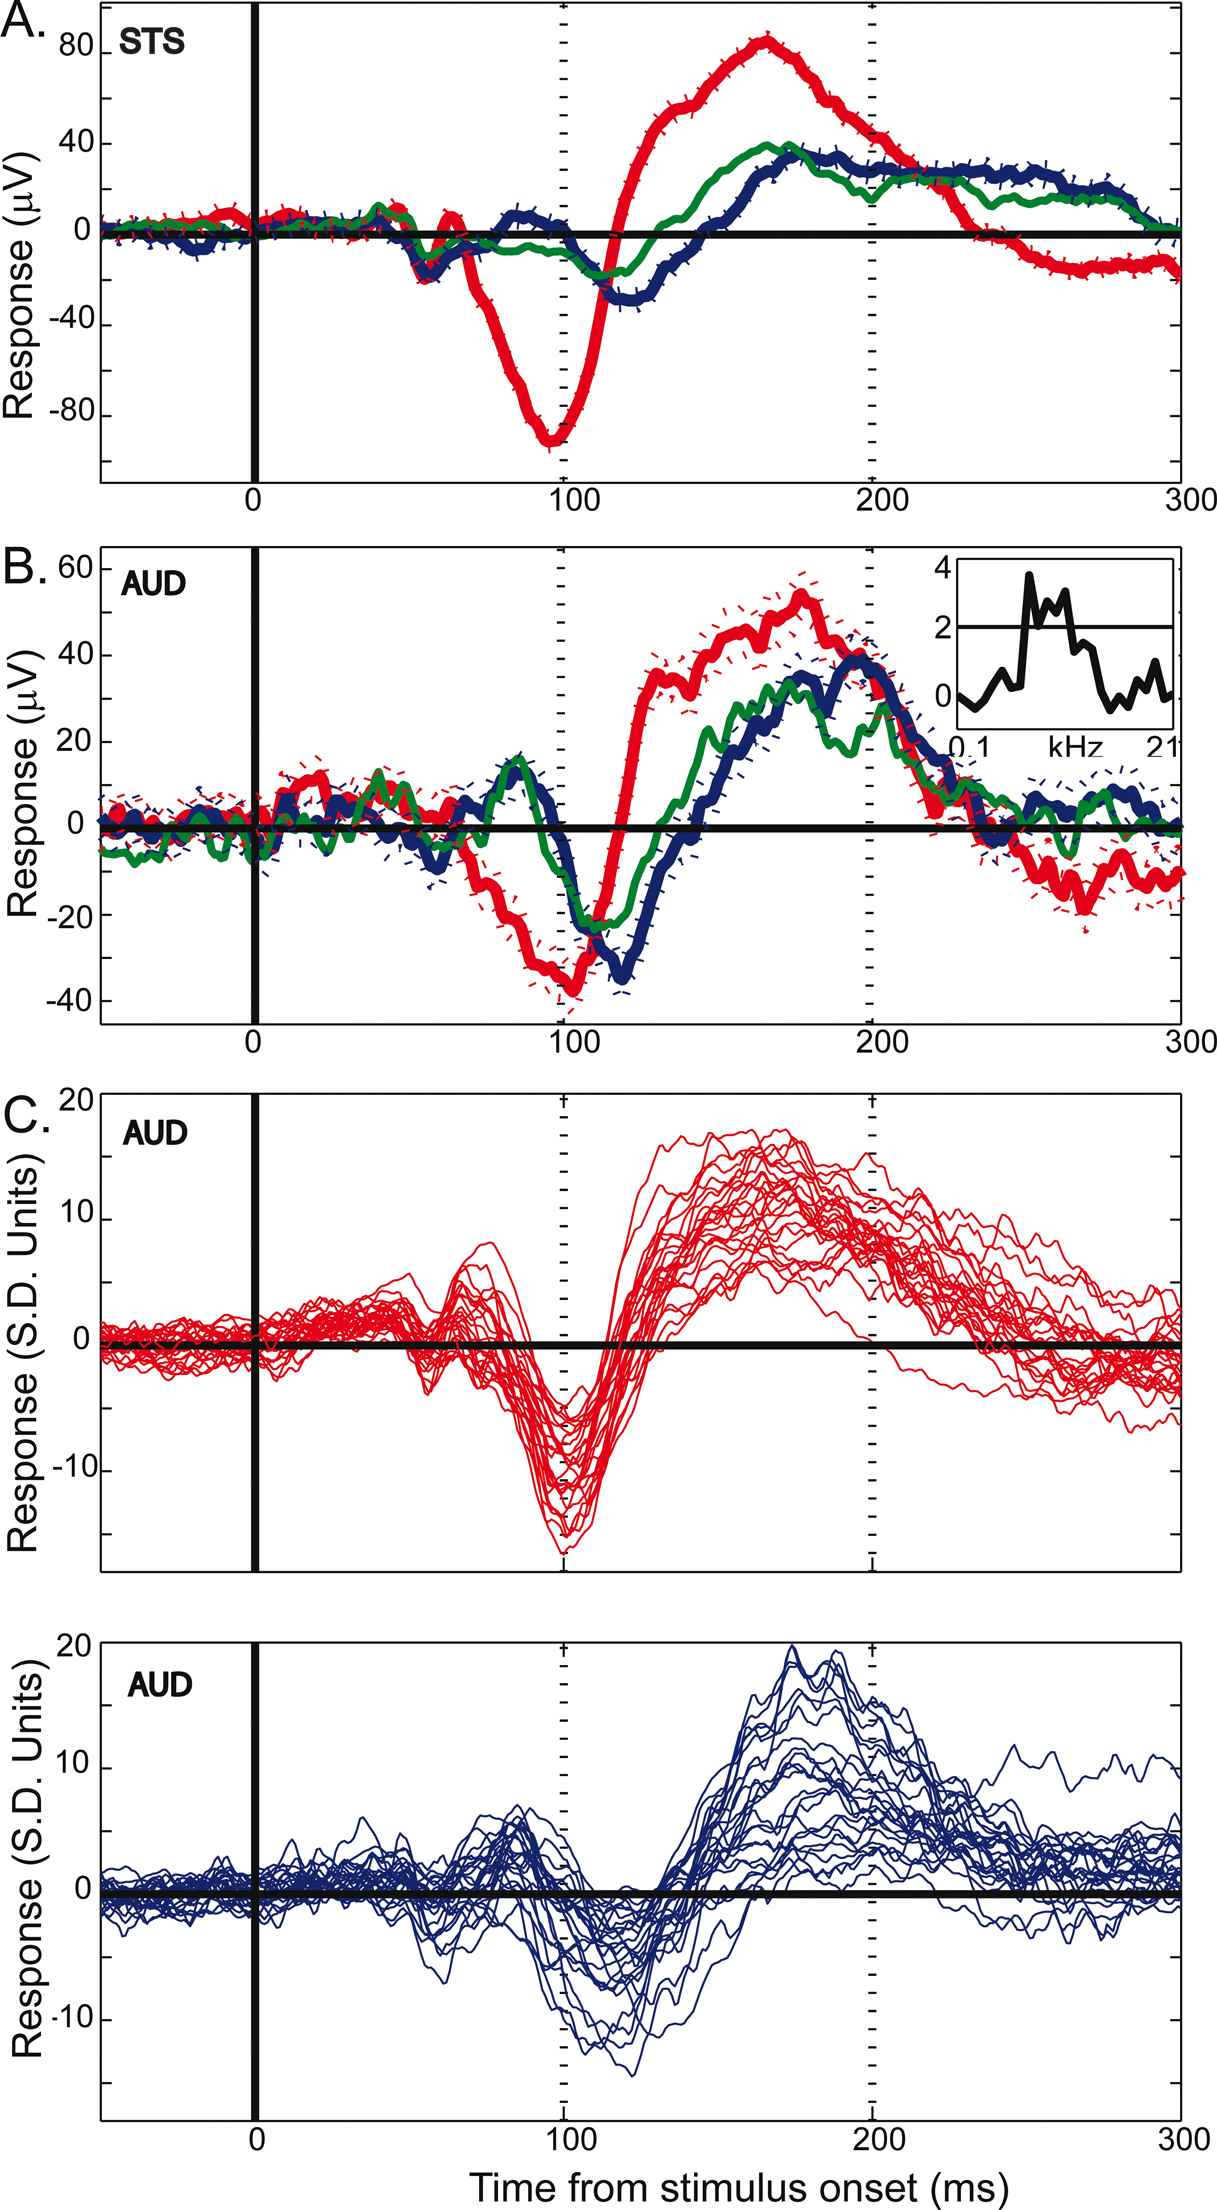
Figure 4. Example LFP responses to face and object categories. (A) Mean (±SEM) responses to face (red), object (blue) and Greeble (green) categories for one electrode site in upper-bank STS from Monkey 1. Responses are shown in μV, aligned to stimulus onset (in ms); each response reflects the mean of 120 trials, with thin lines indicating the SEM. (B) Responses from one electrode site in the lateral belt of auditory cortex, recorded simultaneously with the STS responses shown in A, using the same conventions. The inset displays the frequency tuning for this electrode site for 25 tones played at 72 dB. The black line in the inset marks 2 standard deviations above baseline activity. See Figure 6
for another simultaneously recorded pair of STS and auditory cortex face responses. (C) Mean responses to faces (top, red) and objects (bottom, blue) are shown for 26 auditory cortex electrode sites. The 26 traces are comprised of two randomly selected sites from each of 13 randomly selected recording sessions. The x-axis is identical to that of A and B; the y-axis shows responses in z-score units from the baseline distribution. Typically, both face and object responses are statistically significant during the two major LFP components, and the object responses are more variable and lag behind responses to faces.
One distinction between face and object categories is that the visual similarity or homogeneity among exemplars in the face group may be much greater than among clip-art objects. If the shapes, colors, and textures of the objects are more varied, and the response reflects these more fundamental aspects of an image, then perhaps the object response is more a reflection of this heterogeneity than of a difference in objects from faces, per se. To address this, an additional class of homogeneous objects was shown. Often indistinguishable from the response to clip-art objects (see Figure 4
B), these “Greeble” responses differed from the response to faces in 91% of sites, statistically no different from the proportion of sites discriminating faces and objects (Chi-square test for independence, χ2 0.9814, df = 1, p > 0.9). This suggests that the face response is not merely a reflection of a homogeneous object set, and that Greebles are grouped with objects and not faces, based on LFP responses.
Latencies are listed for each monkey separately, with mean (SD) listed above the range of responses (all in ms). Note the more variable latencies to objects than to faces in both positive and negative LFP components for both monkeys, as well as the longer N100 to objects than to faces, again in both monkeys.
Further evidence that the response to faces and objects is categorical, and not related to homogeneity differences between the two classes, can be seen by plotting the first two principal components of the responses to each exemplar (Figure 5
). Note that the distance between face exemplars is similar to the distance between object exemplars; it is not the case that face exemplars are clustered together while object exemplars are distributed. This is one indication that the neural response to different faces is as variable as the response to different objects. Moreover, the linear separability of face and object responses already evident from plots of the first two principal components suggests that the category-specific responses hold for all members of the category. The four plots shown in Figure 5
are representative of all category selective sites; the exemplar responses from every electrode site showing significant category selectivity were also linearly separable based on the first two principal components. In contrast, random assignment into 2 categories occasionally resulted in separability on some electrode sites, but was never observed for all electrode sites. Taken together, the LFP responses to each exemplar demonstrate neural discrimination of face and object classes.
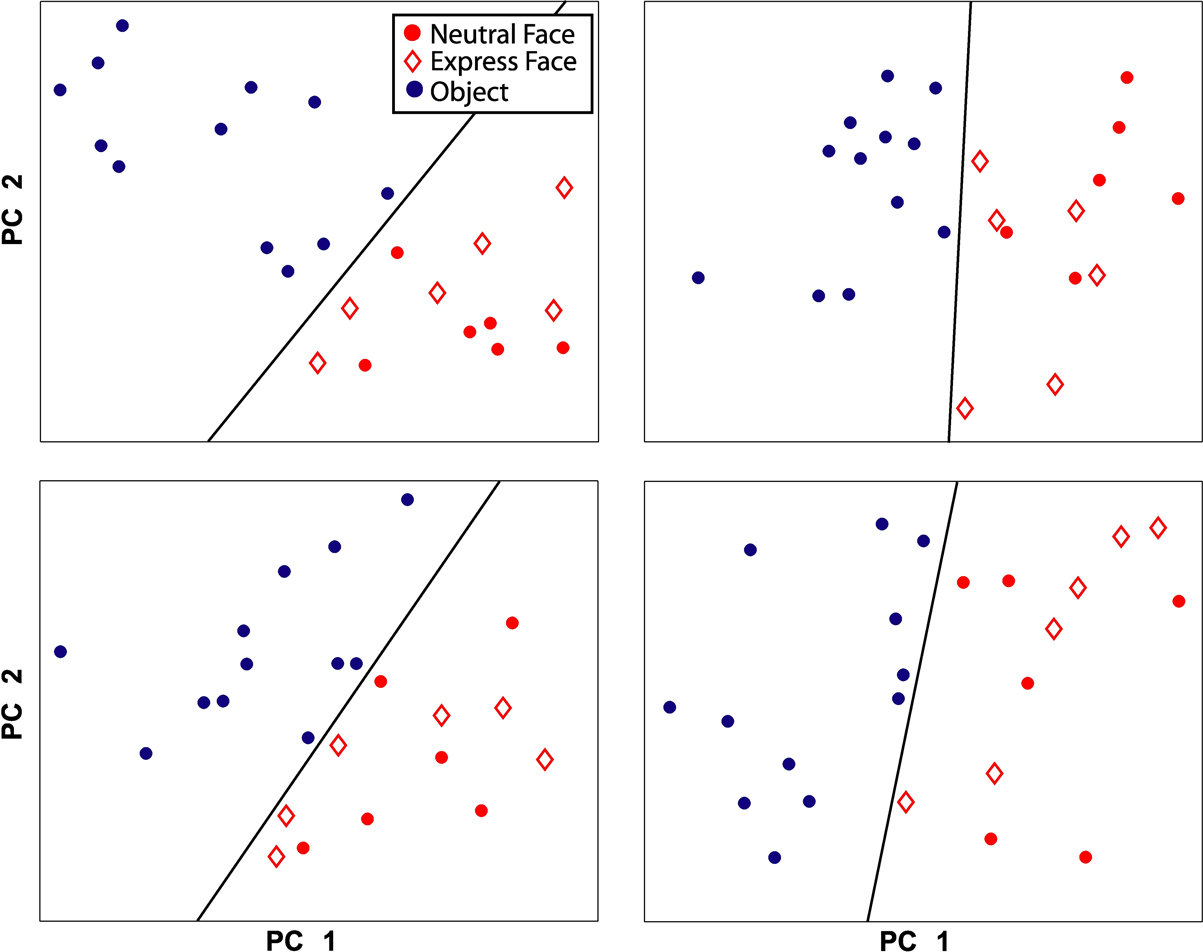
Figure 5. Principal component analysis of the response to each exemplar. Each plot shows the results from one electrode site in auditory cortex. For each site, the first two principal components of the responses are displayed. A black line separates face (red) from object (blue) exemplars. Within the face category, expression exemplars (diamonds) are not separable from neutral exemplars (filled circles).
The Face Response
Face stimuli elicited a consistent response pattern, characterized by a narrow negative peak at approximately 100 ms after image onset (“N100”), and followed by a broader positive component (“P180”) at around 160–220 ms latency. Occasionally, additional features were apparent, such as an early negativity at 50 ms, or a small positivity just prior to the N100, but these features were much less consistent, and occurred in addition to, rather than in place of, the two main response components. Both monkeys showed the main components described above, however, in one monkey the entire response pattern occurred about 30 ms earlier than in the other monkey (Figure 1
). Aside from the latency offset between monkeys, the responses to face stimuli in auditory cortex were remarkably consistent.
Facial Expression and Identity
Based on previous imaging studies of auditory cortex activation during lip reading (Calvert et al., 1997
; MacSweeney et al., 2000
), one might expect that facial expression stimuli, taken during vocalizations, would elicit greater responses in monkey auditory cortex than neutral face stimuli as they are normally associated with a behaviorally-relevant sound. On the contrary, we found no consistent differences between responses to expressive faces vs. neutral faces. Principal component analysis of the response to each exemplar was easily able to separate objects from faces, yet in no case were the results for expressive vs. neutral face responses linearly separable (see Figure 5
for several examples). On this basis, the LFP responses in auditory cortex appear to reflect face stimuli as a class, thus demonstrating both selectivity from objects and generalization among faces.
Auditory Cortex: Core vs. Lateral Belt
Although all face stimuli tended to produce the same LFP response shape in auditory cortex, the time to peak of the N100 response varied by auditory cortex subregion. Core (A1) and lateral belt (ML) responses to faces had similar N100 onsets and slopes, but the core response reversed earlier than the belt response, producing a lower-amplitude, shorter-latency N100 (Figure 6
).
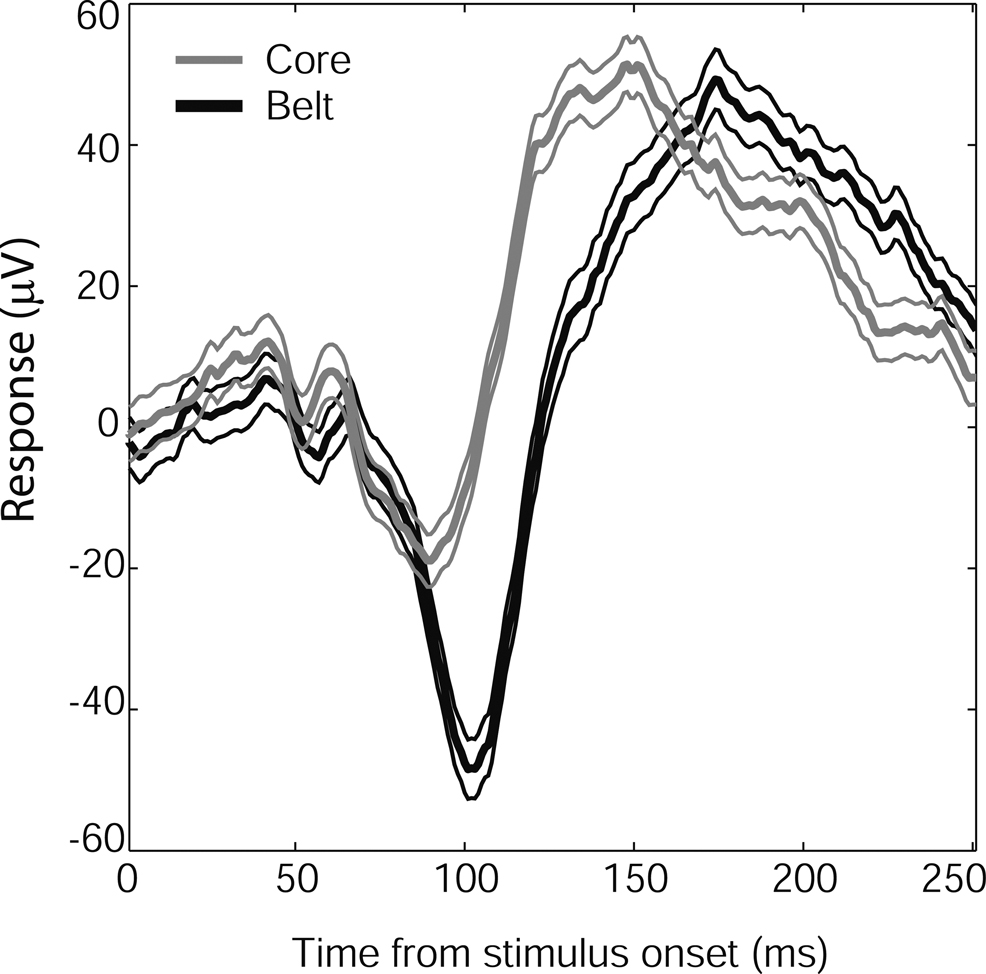
Figure 6. Time course of N100 face responses in auditory core and lateral belt regions. Mean responses (in μV) from core electrode sites (gray, N = 18) and lateral belt (black, N = 61), ±SEM (thin lines). Although the core and lateral belt responses show a similar onset time and response slope, the lateral belt response continues, resulting in a longer latency to peak. A similar shift was seen in Monkey 2, whose mean response (±SEM) from core, 117(3.5) ms (N = 34), preceded the mean response from belt, 128(6.4) ms (N = 10).
For both monkeys, core latencies occurred significantly earlier than belt latencies (t-test, p < 0.001) despite similar onset latencies (t-test, p > 0.5). The observed response pattern further indicates that the core signal is not merely a gain-reduced version of the lateral belt response, as would be expected by volume conduction of a single signal source nearer to or within the lateral belt, given a distant reference. Thus, it would appear that both regions are receiving visual input, but the lateral belt region has an additional late component, providing a more robust, longer-lasting response to faces than that seen in core auditory cortex.
Dipole Localization
Within core and belt auditory cortex, the two main components of the response were remarkably consistent across session and electrode site; however, when the electrodes were placed ∼3 mm farther in the posterior and medial direction, the responses changed dramatically, including a polarity reversal seen across adjacent electrodes (Figure 7
). Extreme medial and posterior sites in both monkeys showed altered responses to visual stimuli (LFP) and altered pure-tone frequency tuning curves (MUA). The electrode array used does not provide appropriate sampling for current source density analysis; nevertheless, the observation of a polarity reversal between simultaneously recorded, adjacent electrode sites indicates a dipole within a 2.3 mm extent of auditory cortex.
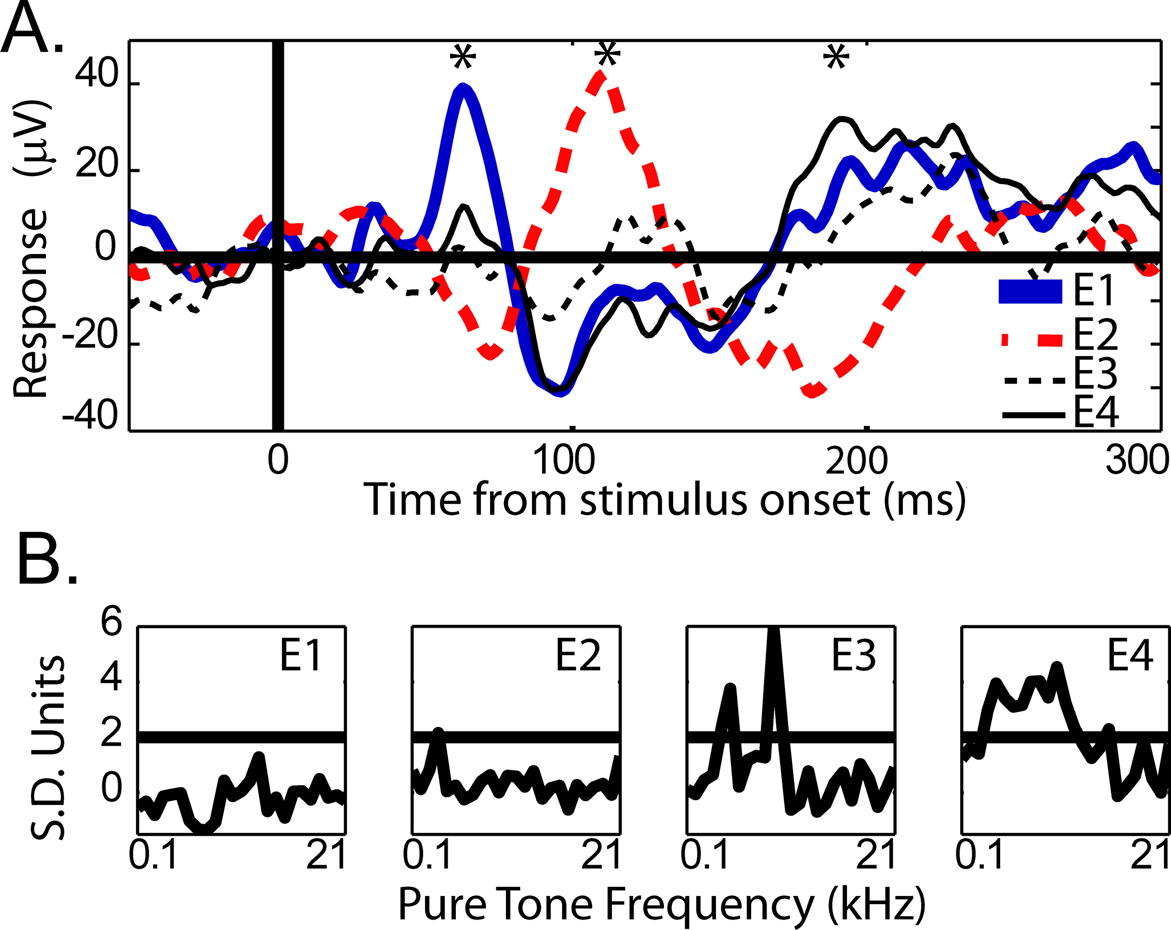
Figure 7. (A) Mean LFP responses from 4 simultaneously recorded electrode sites in auditory cortex. The response from each adjacent electrode site is plotted separately (see E1–E4 legend). Conventions are as in Figure 2
. The asterisks indicate alternating maxima of the polarity reversals between E1 and E2, the most posterior electrodes in the array. (B) Pure-tone frequency tuning curves for each electrode, 1–4, respectively.
Response Latencies in Auditory Cortex and Superior Temporal Sulcus
Previous studies have described responses to faces in the superior temporal sulcus based on single-unit (Bruce et al., 1981
; Desimone et al., 1984
; Gross et al., 1972
; Perrett et al., 1982
), optical imaging (Wang et al., 1998
), and functional-magnetic resonance imaging methods (Logothetis et al., 1999
; Pinsk et al., 2005
; Tsao et al., 2003
). Given the present and previous results suggesting STS may be a key region for processing faces as a distinct object class, and based on anatomical evidence of projections from upper-bank STS to auditory regions (Barnes and Pandya, 1992
), one might suppose that the face response in auditory cortex is possible via afferent projections from STS. Consistent with this possibility, the face, Greeble, and object responses in STS were similar to those observed in auditory cortex. That is, the face response contained the same two components and both object and Greeble categories gave differentiable responses from the face response. Moreover, when one of two adjacent electrodes was placed in auditory cortex and the other in STS, the auditory responses showed a delay relative to the STS response (Figure 8
A). The delay was apparent both in the N100 response (median latency 8 ms, Figure 8
B) and in the overall cross-correlogram peaks (median peak 10 ms; Figure 8
C and D). Though some offsets were small, there was no observation of the auditory cortex response preceding the response in STS.
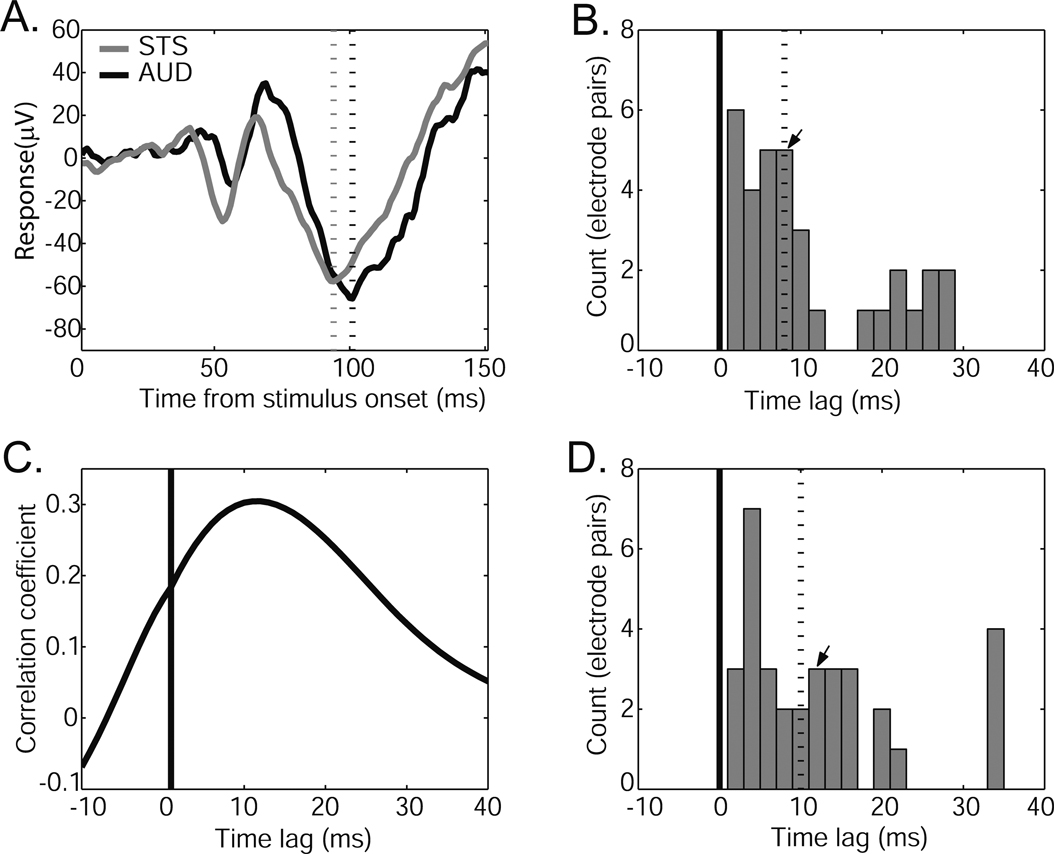
Figure 8. Comparison of response latencies to faces in auditory cortex and upper-bank STS. (A) Example responses from an adjacent pair of electrodes, one in auditory cortex (black) and one in STS (gray). Responses conventions as in Figure 3
. Dashed lines appear at the “N100” peaks. Note the similarity of the response magnitude for the two simultaneously-recorded sites. (B) Distribution of peak latency differences between adjacent pairs of AUD and STS electrodes. The dashed line indicates the median peak latency difference, and the arrow indicates the location in the distribution of the example pair shown in A. (C) Cross-correlation between the example responses shown in A. The peak correlation coefficient indicates the offset at which the STS and AUD responses are most similar (i.e., the time point of maximal correlation). (D) Distribution of peak correlation time points between AUD and STS electrode pairs. The dashed line indicates the median and the arrow indicates the location of the maximal correlation for the example pair. Both “N100” peak latency (B) and maximal-correlation (D) analyses reveal a consistent time lag between STS and AUD responses, with no examples of an auditory cortex response preceding that of its paired STS site.
Responses to Complex Stimuli in Auditory Cortex
The main result from this study is the significant, reliable, yet differentiable response to face and object stimuli in primate auditory cortex. The observed responses to each exemplar within a category was consistent with the division of stimuli into face and object categories. Although it is not clear exactly what aspects of the face stimuli generate a response unique from those elicited by other objects, responses do not seem to simply reflect the homogeneity of the face stimuli. All of the images were familiar in the sense that they had been presented in the task setting over many days and weeks of recording; however, one possibility is that the monkeys are generally more familiar with face stimuli from their daily life than with the clip-art objects. Whereas the exact response shape could vary across site and recording session, the overall response pattern for faces consistently revealed a dip around 100 ms followed about 80 ms later by a broader peak. This response pattern was seen in core and belt of auditory cortex, but with slightly different time courses.
Auditory Cortex Responses to Visual Stimuli are not Contingent on Auditory-Visual Associations
One hypothesis based on auditory cortex activation to speech reading is that the association between visual and auditory stimuli determines whether a visual stimulus alone will activate auditory cortex (Calvert et al., 1997
). A recent report of auditory cortex multiple-unit responses to task-related visual cues was considered evidence that the behavioral relevance of the stimuli is responsible for the observed activity (Brosch et al., 2005
), and fMRI studies in humans (Baier et al., 2006
) and monkeys (Tanabe et al., 2005
) reveal multisensory interactions contingent on statistical regularities and task-dependence. In the present study, no such task association was required for auditory cortex activation, as demonstrated by the responses to objects and the artificially-generated Greebles. Moreover, the response to face stimuli acquired during vocalizations was no different than to the neutral faces. Thus, at least for our static images tested on monkeys, we find evidence that visual stimuli can elicit auditory cortex activation irrespective of any bimodal association.
Regional Differences in the Face Response
The regional latency differences and polarity reversals within auditory cortex are inconsistent with volume conduction (passive spread) of electrical signal from the STS to the auditory cortex recording sites. Since core and belt are roughly equidistant from STS, a field source in STS should not have led to the observed latency differences within auditory cortex. Moreover, regardless of the location of a distant source, the weaker signal should not show a shorter latency than the stronger signal, as is the case with the core and belt responses, respectively. In fact, response amplitudes in core and belt are often, but not always, similar to those seen in STS (see Figure 8
A), despite an average of over 3 mm distance separating auditory cortex and STS sites. Furthermore, the response delay between STS and auditory cortex, typically ∼10 ms, and the variability in that delay seen in simultaneously recorded electrode pairs, are both inconsistent with a volume-conducted electrical signal through a non-capacitive medium such as the cortex. Finally, the change in response shape seen in extreme posterior and medial electrode sites in both monkeys, including polarity reversals, indicate a local source in auditory cortex.
What, then, are the implications of the latency patterns seen in core and belt of auditory cortex, and in the STS? Despite similar onset profiles, the auditory cortex shows robust differences in peak “N100” latency between core and belt, suggesting the face processing inputs are different in primary and secondary auditory cortices. This could be due to the inputs themselves differing between regions, such that both receive temporally similar inputs initially, but only lateral belt receives continued signal. Alternatively, cytoarchitectonic differences in core and belt (Cipolloni and Pandya, 1991
; Kosaki et al., 1997
; Morel et al., 1993
; Pandya, 1995
) leave open the possibility that the intrinsic membrane currents have a different time course in core and belt (e.g., different composition of sources and sinks over time), or that the lateral belt may receive additional “feedback” from local circuits. Among the possible visual input pathways, the upper bank of the superior temporal sulcus is a likely candidate based on extensive projections from STS to auditory cortex (Barnes and Pandya, 1992
). Consistent with the patterns of connectivity, auditory cortex responses lag behind responses in “co-localized” regions of STS. This suggests STS may be one source of face information reflected in the LFP, though other possible input pathways remain.
Local Field Potential vs. Multiple and Single Unit Activity
The single and multiple unit activity of visually-responsive electrode sites showed a tight correspondence: each category-specific MUA site yielded at least one category specific single unit, though cases in which both MUA and SUA were not category specific were far more common. In contrast to MUA and SUA, the LFP responses described here were robust and typically category specific, revealing the importance of using multiple neural signals to assess processing in a region. At first blush, the discrepancy between signals may seem problematic, as both signals should reflect primarily neural activity in the region around the recording site, and thus reveal similar response patterns. On the contrary, for about as long as EEG and spiking activity have been recorded together, discrepancies in their responses have been noted (Buchwald et al., 1966
; Li and Jasper, 1953
; Renshaw et al., 1940
).
Visual inputs occurring independently of auditory inputs may produce subthreshold membrane fluctuations, detectable only in the LFP signal. Such subthreshold activity could be useful in setting up neurons for enhanced or suppressed responses when a “sufficient” auditory stimulus is coincidentally presented. Indeed, it was recently shown that somatosensory stimuli could induce a phase resetting of oscillations in primary auditory cortex, enhancing responses to coincident auditory input, while suppressing responses to delayed inputs (Lakatos et al., 2007
). Consistent with the visual responses reported here, the somatosensory stimuli presented in isolation produced no appreciable spiking output – only field potentials. The effects on auditory cortex output occurred when somatosensory and auditory stimuli were paired. Accordingly, auditory detection thresholds may drop in the presence of concurrent visual stimulation.
As proof of principle, recent recordings in auditory thalamus show exactly this type of “priming”: whereas visual input alone is insufficient to drive spiking activity, matched auditory and visual stimuli elicit the strongest response, exceeding the response to the unisensory auditory stimulus (Komura et al., 2005
). In auditory cortex, two additional reports provide indirect lines of evidence for such a role for visual inputs. First, multiple-unit responses in primate auditory cortex to visual cues were observed during an auditory task (Brosch et al., 2005
). Cue-related modulation was observed in 14% of recording sites, similar to the proportion of visually-responsive MUA reported here (20%), and responses were maximal at 120 ms and abated by 360 ms, corresponding to the timeframe of the LFP responses reported here. A major difference to be noted is that they report responses to only one visual stimulus, a red LED, making it difficult to know the response selectivity or dependence on the auditory task. The second report does not address MUA, but demonstrates how visual responses can, indeed, modulate auditory responses in auditory cortex (Ghazanfar et al., 2005
). In this study, the LFP responses to conspecific vocalizations in auditory cortex were altered by the presence of videos of the corresponding vocalizations. Consistent with our heightened face response in auditory belt compared to core, audiovisual multisensory integration occurred more frequently in belt than in core regions. Moreover, although there was also modulation to simple dynamic disc control movies, the multisensory integration for such stimuli was dramatically reduced relative to the integration observed for the face movies. In fact, the increased responsivity in lateral belt was selective for the face movies. One possible interpretation of these results, in light of the present study, is that a variety of complex visual signals is available to auditory cortex, but that multisensory integration favors the behaviorally relevant and/or concomitant visual stimuli that correspond to an auditory stimulus.
In this study, the generation of visual responses in auditory cortex was not only robust, but also specific for different categories of stimuli. The response to faces was consistent across stimulus exemplars, over numerous sessions, and across recording sites, including auditory core and lateral belt, as well as in the upper bank of the superior temporal sulcus. Despite sharing a characteristic response shape, the precise timing and depth of modulation to faces varied across regions within and outside of auditory cortex. The exact origins and significance of the face response remains to be determined, nevertheless, the observation of differentiable responses to complex objects in primary and secondary auditory cortex detracts from the notion of “unisensory” cortex, and advocates for the use of varied, complex, and behaviorally-relevant stimuli in multisensory research.
The authors declare that the research was conducted in the absence of any commercial or financial relationships that could be construed as a potential conflict of interest.
The authors thank Joost Maier and Katalin Gothard for comments on the manuscript, and Shima Ovaysikia, Kristina Nielsen, Joachim Werner, Joost Maier and the Perceptual Expertise Network for assistance at various stages of this project. This work was supported by the Max Planck Society and the James S. McDonnell Foundation.