1
Neurobiologie, Universität Konstanz, Konstanz, Germany
2
Institut für Neurobiologie, Freie Universität Berlin, Berlin, Germany
The insect mushroom bodies are higher-order brain centers and critical for odor learning. We investigated experience dependent plasticity of their intrinsic neurons, the Kenyon cells (KCs). Using calcium imaging, we recorded KC responses and investigated non-associative plasticity by applying repeated odor stimuli. Associative plasticity was examined by performing appetitive odor learning experiments. Olfactory, gustatory and tactile antennal stimuli evoked phasic calcium transients in sparse ensembles of responding KCs. Repeated stimulation with an odor led to a decrease in KCs’ response strength. The pairing of an odor (conditioned stimulus, CS) with a sucrose reward (unconditioned stimulus) induced a prolongation of KC responses. After conditioning, KC responses to a rewarded odor (CS+) recovered from repetition-induced decrease, while the responses to a non-rewarded odor (CS−) decreased further. The spatio-temporal pattern of activated KCs changed for both odors when compared with the response before conditioning but the change was stronger for the CS−. These results demonstrate that KC responses are subject to non-associative plasticity during odor repetition and undergo associative plasticity after appetitive odor learning.
Learning leads to the modification of neuronal excitability and synaptic strength between neurons. These changes alter neural network activity and ultimately lead to adaptive behavior. Therefore, a mechanistic understanding of the neural processes underlying learning and memory formation requires the analysis of network activity. Olfactory learning paradigms are well suited for studying learning and memory in vertebrates and insects (Davis, 2004
; Wilson and Stevenson, 2003
). The relatively low complexity of the insect nervous system allows studying learning and memory functions in an approach integrating molecular mechanisms, morphology, network activity and behavioral responses (Heisenberg, 2003
; Menzel and Giurfa, 2006
). The formation of odor memories depends on parallel, as well as sequential processing of information at several stages and involves the first two processing centers of the olfactory system, the antennal lobes (AL) and the mushroom bodies (MB) (Hammer and Menzel, 1998
; Keene and Waddell, 2007
; Müller and Hildebrandt, 2002
; Thum et al., 2007
).
We investigated whether odor learning changes network activity within the MB and asked if their intrinsic neurons, the Kenyon cells (KCs), are subject to experience dependent plasticity. In the MB, the input and output regions are spatially segregated (Figure 1
A). The input occurs mainly in the calyces, and the output in the lobes (Mobbs, 1982
). Within the lip region of the calyx, neural pathways that transmit odor information (conditioned stimulus, CS) and reward information (unconditioned stimulus, US) converge onto KCs. Odor information is carried by excitatory projection neurons of the AL (PN). Reward information is provided by the VUMmx1 neuron, a putatively octopaminergic neuron which mediates the reinforcing function of the reward in appetitive odor learning (Hammer, 1993
; Hammer and Menzel, 1998
). The convergence of CS and US pathways makes KCs potential candidates of learning-induced plasticity. Further on, the calyx is innervated by GABAergic neurons (A3-v neurons), which provide local and recurrent inhibitory output onto PNs and KCs (Ganeshina and Menzel, 2001
) and form a feedback loop from the lobes to the calyx (Grünewald, 1999a
). All synapses mentioned above are possible sites of learning-induced neural plasticity. Accordingly, learning-related changes have been found in different intrinsic and extrinsic MB neurons (Faber and Menzel, 2001
; Grünewald, 1999b
; Mauelshagen, 1993
; Okada et al., 2007
; Riemensperger et al., 2005
; Wang et al., 2008
; Yu et al., 2006
).
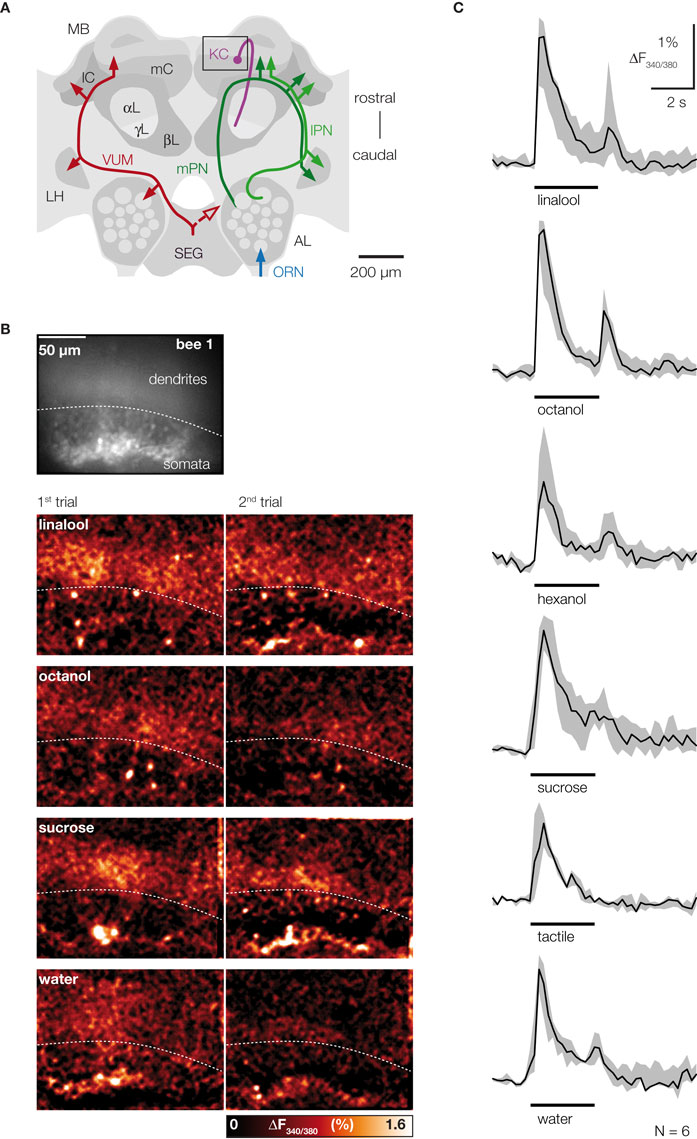
Figure 1. CS and US activate sparse ensembles of KCs with phasic response dynamics. (A) Frontal view of the honeybee central olfactory system. Different neurons are shown in both hemispheres. Right: Olfactory receptor neurons (ORN, blue) terminate in the AL glomeruli. Uniglomerular PNs (green) relay odor information from the AL to the MB and to the lateral horn (LH). PN axons project along the median or lateral antenno-cerebralis tract (mPN, lPN) and form synapses with KCs (magenta), which ramify their dendrites in the lateral and medial calyces (lC, mC) and whose axons run along the lobes (αL, βL, γL). In this study clawed KCs were imaged, which have their somata outside the calyces and terminate in the ventral part of the α-lobe (γ-lobe). The square indicates the imaged area. Left: The bilaterally symmetrical VUMmx1 neuron (red) mediates the reinforcing function of the reward and connects the subesophageal ganglion (SEG) with the AL, LH and MB calyces. (B) Raw-fluorescence picture of the imaged area (Fura-fluorescence at 380 nm excitation light). The clawed KC soma-layer outside the calyx is clearly visible. Below: Color-coded KC activation patterns to two successive presentation of the same stimulus in the same bee. Different stimuli activated different dendritic areas and few somata. Repeated stimulation with a given odor activated the same or largely overlapping KC subset. Different odors activated KC subsets with little or no overlap, while water and sucrose solution activated KC subsets with more overlap. (C) Median traces of dendritic KC responses measured in six bees (grey areas indicate the limits of the 25–75% IQR). Traces were calculated by averaging signals in the entire dendritic region. The responses to olfactory (linalool, octanol, hexanol), gustatory (sucrose solution, water) and tactile (touching the antenna with a glass capillary) stimuli followed a phasic time course. A second response peak often occurred after stimulus offset.
It is not known, however, whether KCs at their input site within the MB calyx are subject to learning-dependent plasticity. To investigate this question, we imaged calcium responses of a subpopulation of honeybees’ KCs, the clawed KCs (also termed class II or type 5 cells; Rybak and Menzel, 1993
; Strausfeld, 2002
). We recorded KC responses to repetitive odor stimulation, in order to investigate non-associative plasticity. Moreover, we performed appetitive odor learning experiments, to examine associative plasticity. We chose a differential conditioning paradigm, in which one odor was rewarded (CS+), while the other odor was not rewarded (CS−) and was given in between the rewarded CS+ presentations. Differential conditioning offers several advantages when performed together with physiological measurements. First, it induces a robust long-term memory in restrained bees (Bitterman et al., 1983
), and also during physiological measurements (Mauelshagen, 1993
; Okada et al., 2007
; Peele et al., 2006
). Second, it allows the characterization of excitatory vs. inhibitory associative learning effects, as animals learn the forward pairing of the CS–US presentation as an excitatory association for the CS+ and the unrewarded CS presentation as an inhibitory association for the CS− (Hellstern et al., 1998
; Rescorla, 1988
). Third, it allows the separation of associative from non-associative learning phenomena (e.g., sensitization and repetition effects) (Hammer et al., 1994
).
We found that KCs alter their responses in an associative and non-associative manner. KCs are subject to a non-associative decrease of their response strengths during repetitive odor stimulation. After associative odor learning, CS+ responses recover from repetition decrease, while CS− responses decrease further. Taken together, the results lead to the conclusion that both associative and non-associative processes underlie neural plasticity in the MB calyx.
Living Bee Preparation and Dye Loading
Foraging honeybees, Apis mellifera carnica, were prepared for the experiments as described earlier (Szyszka et al., 2005
). Briefly, clawed KCs or PNs of the lateral antenno-cerebralis tract were selectively stained with the dextran-conjugated calcium indicator Fura-2 (10,000 MW; Molecular Probes, Eugene, USA) by injection into the axons of clawed KCs in the ventral alpha lobe (Mobbs, 1982
), also called γ-lobe (Strausfeld, 2002
) or into PN axons of the lACT, for KC and PN staining, respectively. Eight to twenty-four hours later, bees were prepared for experiments. To prevent movement artifacts, abdomen and legs were immobilized with dental wax, muscles that innervate the antennae were removed, the mouthparts were truncated, and the esophagus was removed. Immediately after preparation, the head capsule was washed with bee Ringer (in mM: 130 NaCl, 7 CaCl2, 6 KCl, 2 MgCl2, 160 sucrose, 25 glucose, 10 HEPES, pH 6.7, 500 mOsmol). In order to stabilize the brain, a 1.5% solution of low-melting agarose (A2576; Sigma, Deisenhofen, Germany) was injected into the head capsule. Experiments began 30 min after preparation. A total of 51 bees were used for experiments.
Stimulation and Imaging
For olfactory stimulation 1-hexanol, 2-octanol, linalool and limonene (all from Sigma, Deisenhofen, Germany) were used. Odors were diluted in mineral oil. The concentration was 1% (v/v) for the experiments shown in Figures 1 and 2
A. In all other experiments, odor concentration was adjusted for differences in vapor pressure (linalool: 46.2%, limonene: 9%, 1-hexanol: 16.2% and 2-octanol: 60%). Odor solutions were applied onto a 2 cm × 2 cm piece of filter paper and placed in plastic syringes. Either 20 μl odor solution were used with a 5-ml syringe (Figures 1 and 2
A) or 4 μl were used with a 0.6-ml syringe (Figures 2
B,C, 3
, and 4
). Using a computer controlled olfactometer, odor-loaded air was injected into a continuous air stream that was directed at both antennae. Stimulus duration was 3 s. Gentle air suction cleared residual odors at all times. Bees were either stimulated with four odors (1-hexanol, 2-octanol, limonene and linalool) and a blank control (mineral oil) (Figures 1 and 2
B,C), or with two odors (2-octanol and linalool) (Figures 2
A, 3, and 4
). Odors were presented pseudo-randomized (Figures 1 and 2
B,C) or alternated (Figures 2
A, 3 and 4
) with an inter-stimulus-interval of 1 min. For gustatory stimulation, a drop of distilled water or sucrose solution (1 M) was manually applied with a pipette to one antenna, ipsilateral to the imaged MB. For pure tactile stimuli, the antenna was touched with a 1-mm glass capillary.
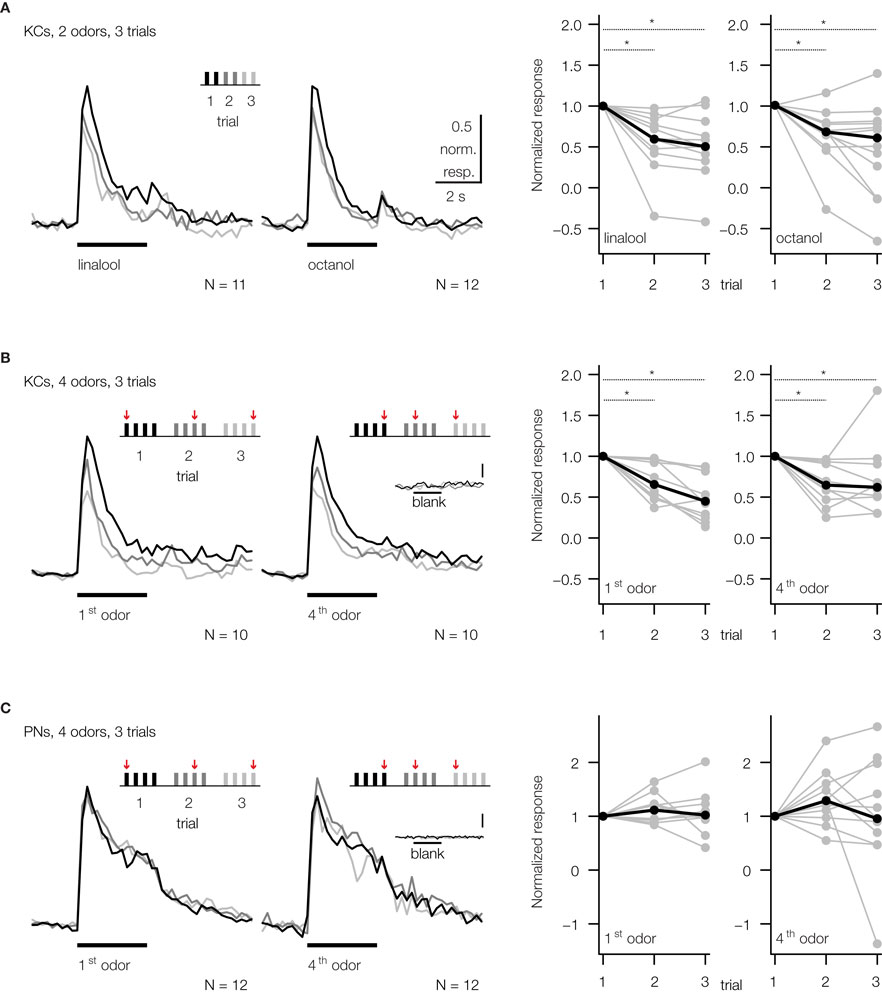
Figure 2. Repeated odor stimulation causes a decrease in KC response strength. Median traces of dendritic KC and PN responses. Responses were normalized to the first trial of the respective odor. The stimulation protocol used in each case is shown above the corresponding traces. Inter-stimulus-interval was 1 min. Dotplots show the normalized response strength of individual bees (grey dots) and the median over all animals (black dots). (A) KC responses decreased during repetitive, alternating stimulation with two odors. Each odor was repeated three times and was presented every 2 min [two-way RM ANOVA with factors ‘odor’ and ‘trial’; linalool: Ftrial (2, 20) = 6.12, p < 0.01, N = 11 bees; octanol: Ftrial (2, 22) = 16.65, p < 0.001, N = 12 bees; Bonferroni post hoc tests, p < 0.01]. (B) Similar repetition decrease was found during repetitive, pseudo-randomized stimulation with four odors and a blank control. This decrease was independent of the position of an odor within the set (odor-position is indicated by arrows). To explore the effect of odor-position, the data was split to compare the repetition decrease for the odor that was presented first (1st odor) and the odor that was presented after three odor stimulations (4th odor). Each odor was repeated every 3–7 min [two-way RM ANOVA with factors ‘position’ and ‘trial’; Ftrial (2, 18) = 13.85, p < 0.001; Ftrial × position (2, 18) = 3.1, ns, N = 10 bees; Bonferroni post hoc tests, p < 0.01]. (C) PNs show no repetition decrease (PN responses were averaged over all glomeruli, excluding glomeruli with negative responses). Same stimulation protocol as in B [two-way RM ANOVA; Ftrial (2, 22) = 0.89, ns; Ftrial × position (2, 22) = 0.71, ns, N = 12 bees]. KCs and PNs did not respond to 3 s blank stimulation (inserted traces, scalebar: 0.5% ΔF340/380).
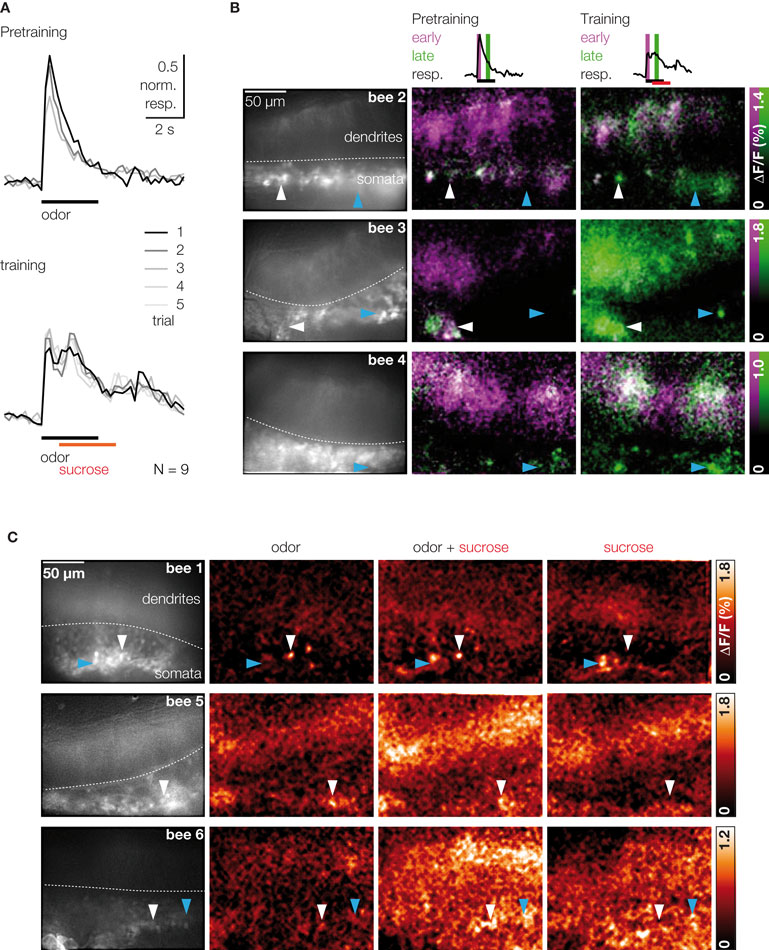
Figure 3. Sucrose stimulation prolongs responses of odor-activated KCs. (A) Median traces of dendritic KC responses during three pretraining trials and five training trials (responses were normalized to the first trial in pretest, N = 9 bees). Odor responses were phasic during pretraining. During training, KC responses became long lasting upon odor–sucrose pairing. (B) Raw fluorescence images of stained KCs and merged activation patterns of early (magenta) and late (green) responses during pretraining and training for three bees (three pretraining and five training trials were averaged). Early KC responses (0–0.8 s after stimulus onset) contain only the odor response. Late KC responses (1.4–2.2 s) contain the odor response and, during training, the sucrose response. Odor–sucrose pairing led to prolonged responses in odor-activated KCs (white arrowheads) and activated additional KCs (cyan arrowheads). (C) KC responses in three different bees to stimulation with odor, pairing of odor and sucrose, and sucrose alone (mean signal during 4 s after stimulus onset; two trials were averaged). Some of the odor-activated KCs showed increased responses during the pairing of odor and sucrose but did not respond to sucrose alone (white arrowheads).
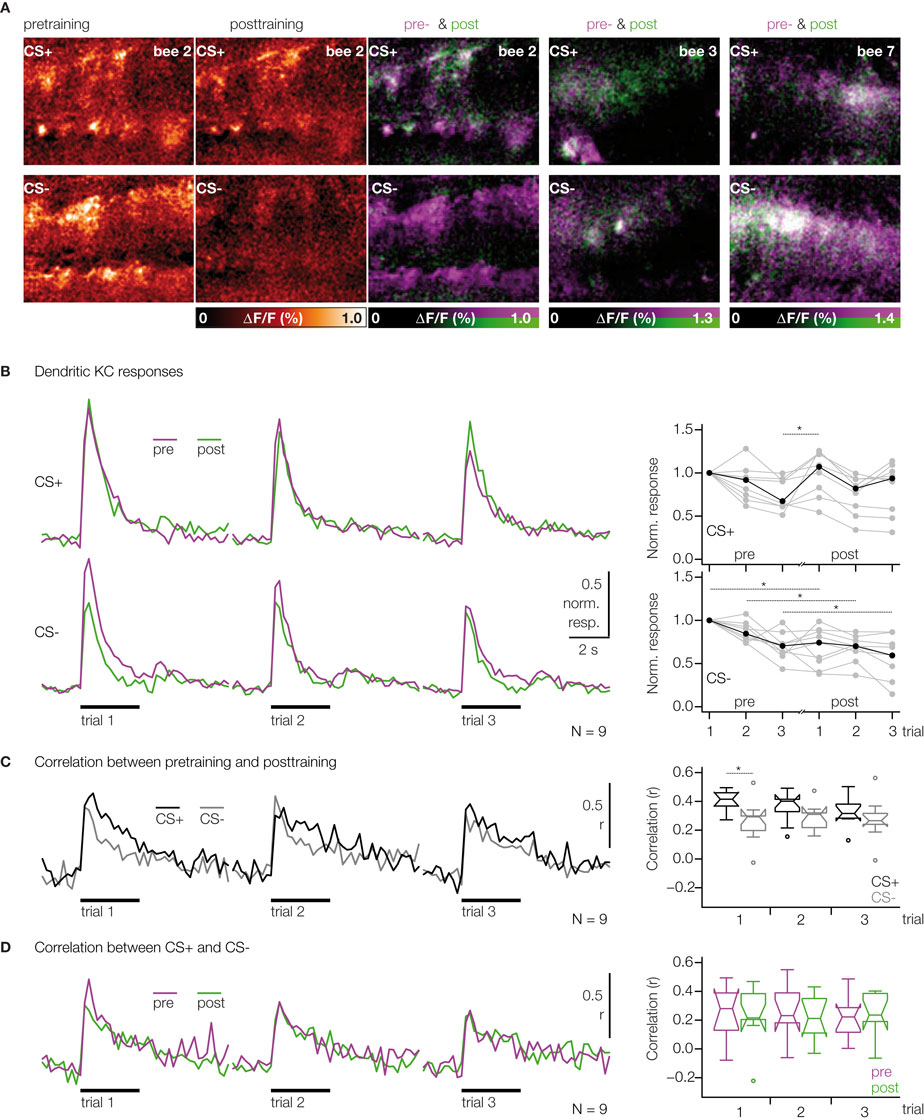
Figure 4. KC responses change after odor conditioning. (A) Color-coded KC activation patterns during stimulation with CS+ and CS− (single bee, three pretraining and three post-training trials were averaged). Merged activation patterns of pre- (magenta) and post-training trials (green) for the same bee and two additional bees. (B) Median traces of dendritic KC responses to three odor trials during pre- (magenta) and post-training (green) (N = 9 bees, same as in Figure 3
). Traces were normalized to the first pretest-trial of the respective odor. Dotplots show the normalized KC response strength for individual bees (grey dots) and the median (black dots). Upper traces/dotplot: CS+; lower traces/dotplot: CS−. During pretraining, the strength of KC responses decreased throughout the three pretraining trials [two-way RM ANOVA with factors ‘odor’ (CS+, CS−) and ‘trial’, Fodor (1, 8) = 2.74, ns; Ftrial (2, 16) = 9.64, p < 0.01]. After training the CS+ responses recovered from repetition decrease, whereas the CS− responses decreased further [three-way RM ANOVA with factors ‘odor’ (CS+, CS−), ‘phase’ (pretraining, post-training) and ‘trial’, Fodor × phase (1, 8) = 7.56, p < 0.05; Bonferroni post hoc tests, p < 0.01]. (C) Analysis of changes in the spatio-temporal dendritic response patterns between pre- and post-training. For both odors, CS+ (black) and CS− (grey), the correlation was calculated between the corresponding pre- and post-training trials. Correlations were quantified as the mean correlation coefficients during the 3 s odor stimulus (boxplots). The correlation between the first pre- and post-training trials was lower for the CS− than for the CS+ [Wilcoxon signed-rank test, p < 0.05, N = 9 bees], but no differences were found for the second and third trials. (D) Analysis of changes in the similarity between CS+ and CS− responses. For pretraining (magenta) and post-training (green), the correlation was calculated between the CS+ and CS− responses in the corresponding trials. The correlation between CS+ and CS− responses did not change between pre- and post-training [Wilcoxon signed-rank test, ns, N = 9 bees]
.
Nine bees were differentially conditioned during imaging experiments (Figures 3 and 4
), using linalool and 2-octanol either as CS+ or CS− and sucrose as US (inter-stimulus-interval was 1 min). In six of them, linalool was the CS+ and 2-octanol the CS−. In three bees, 2-octanol was the CS+ and linalool the CS−. Each experiment lasted 40 min and was divided into three parts: pretraining, training and post-training. During pretraining, two odors were alternately presented three times. Training started 3 min after the last pretraining trial. Five training trials were performed in which one odor (CS+) was paired with sucrose solution given to the antenna ipsilateral to the imaged MB. The other odor (CS−) was presented alone. Sucrose stimulation began 1 s after odor onset and lasted 3 s, resulting in a 2-s overlap between odor and sucrose stimulus. Post-training started 15 min after training and included three CS+ and CS− presentations.
Frames were acquired with a sampling rate of 5 Hz using a CCD-based imaging set up (Till Photonics, Gräfelfing, Germany) mounted on a fluorescence microscope (BX-50WI; Olympus, Tokyo, Japan). Measurements started 2 s before stimulus onset and lasted for 10 or 12 s. For ratiometric imaging, two frames were taken at 340 and 380 nm excitation light (experiments in Figures 1 and 2
A,B); for single wavelength imaging, the excitation wavelength was 390 nm in order to minimize photodamage (Figures 2
C, 3 and 4
). Fluorescence was detected through a 60×, 0.9 W Olympus objective, a 410-nm dichroic mirror and a 440-nm long-pass filter with an Imago CCD camera (640 × 480 pixels, 4× binned on chip to 160 × 120 pixels). KC somata and dendrites were imaged in an area covering 210 μm × 160 μm of the frontal surface of the median MB calyx. Due to the limited spatial resolution of wide-field fluorescence imaging, it was not possible to extract signals from individual KCs reliably, and no quantitative cell-based analysis was performed.
Data Analysis
Data were analyzed using custom-written programs in IDL (RSI, Boulder, USA). Background fluorescence (F) was calculated as the average of 5 frames before stimulation and was subtracted from every frame of a measurement to give ΔF. Signals were calculated as follows: For ratiometric measurements, ΔF340/380 was calculated; for single wavelength measurements, ΔF390/F390 was calculated as fluorescence change relative to background fluorescence, and bleaching was corrected by subtracting a logarithmic curve fitted to the median decay of the entire frame, excluding frames during the stimulus (Galizia and Vetter, 2004
). Fura-2 decreases its fluorescence in response to increasing calcium concentrations when excited with 390 nm excitation light. Throughout the paper, ΔF390/F390 values were inverted for illustrative purposes. Activity patterns are shown as color-coded images, which were filtered with a spatial low-pass filter of 5 × 5 pixels (single measurements) or 3 × 3 pixels (averaged measurements). Unless otherwise specified, response strength was quantified as the mean signal during 3 s after stimulus onset (color-coded activity images and dotplots in Figures 2 and 4
B. Response traces were calculated by averaging the signal in the entire dendritic area. Traces shown in Figures 2
, 3 and 4
are medians of single response traces normalized to the response maximum of the first trial with the corresponding odor stimulus. The correlation analysis in Figures 4
C,D was performed as follows: For each bee, the dendritic region was divided into ∼80 regions, each measuring 10 × 10 pixels (13 μm × 13 μm). For each region, a response trace was calculated by averaging the signal of the underlying pixels. Thus, each time point of a measurement was represented as a vector of ∼80 values. Similarity between two measurements was quantified by calculating Spearman’s rank correlation between the two vectors for each time point of the measurements. For statistical purposes, the mean correlation coefficient over 3 s after stimulus onset was calculated. The boxplots in Figures 4
C,D contain the following information: The line in the middle of the box shows the median. The hinges correspond to the first and third quartiles. The whiskers correspond to the ±1.5 × interquartile range (IQR). The notches represent ±1.58 × IQR/√N, and indicate the 95% confidence interval for the median. Open circles represent outliers. All statistical tests were performed on the original, non-filtered and non-normalized data. Asterisks in dotplots and boxplots indicate significant differences. Statistical analysis was performed with R (www.r-project.org) and Statistica (StatSoft, Tulsa, USA).
Learning the association between an odor (CS) and a reward (US) requires the convergence of the neural pathways that encode both stimuli. In the MB calyx, odor information carried by PNs, and reward information carried by the VUMmx1 neuron, converge onto KCs (Figure 1
A). We were interested in how clawed KCs represent the CS and US and whether stimulus repetition and appetitive odor learning change odor representations in KCs. In order to investigate these questions, we imaged calcium responses in the somata and dendrites of clawed KCs in the MB calyx while stimulating the antenna. Clawed KCs were visible on the raw fluorescence images and could reliably be distinguished from other KCs due to the position of their somata outside the calyx (Figure 1
B). Within the calyx lip region they exhibit columnar arranged dendritic trees which cover an area of ∼15 μm × 40 μm (Rybak and Menzel, 1993
; Strausfeld, 2002
; Szyszka et al., 2005
).
Response Properties of Clawed KCs
We first analyzed KC responses to stimuli that act as CS and US in the context of appetitive associative odor learning. Olfactory and pure tactile stimuli, as well as sucrose and water evoked calcium responses in KC somata and dendrites (Figure 1
B). KC soma responses were sparse and stimulus specific: up to 20 out of ∼300 stained somata responded to a particular stimulus. Repeated stimulation with the same odor activated the same or a largely overlapping ensemble of KC somata. Different odors, however, activated KC soma ensembles with little or no overlap. In the dendritic area, stimuli evoked responses in one to six columnar or elongated activity patches. Those dendritic activity patterns were stimulus specific, too. However, in contrast to the somata, dendritic activity patterns evoked by different stimuli partly overlapped. The degree of overlap varied among preparations, and may reflect the activation of different KCs with overlapping dendritic trees. The time course of KC responses was always phasic, independently of the modality of the stimulus, and often a second response peak occurred after stimulus offset (Figure 1
C).
Non-Associative Plasticity
In order to investigate the effect of odor repetition, two stimulus protocols were used: honeybees were either stimulated with two odors, which were presented alternately (Figure 2
A), or with four odors and a blank control, which were presented in a pseudo-randomized order (Figures 2
B,C). KC responses to the first presentation of any odor were significantly higher than the response to subsequent presentations of the same odor, irrespective of which stimulus protocol was used. However, there was no significant decrease in response strength between the 2nd and 3rd trial. Repetition decrease was odor specific and only depended on the number of stimulations with the same odor, as shown in Figure 2
B. When odors were pooled according to their position within the stimulation sequence, there was no difference in repetition decrease for the odor that was presented 1st and the one that was presented 4th. The median decrement of response during the second trial was not different for the 1st and 4th odor and measured 29% (IQR: 10–50%) for the 1st odor and 33% (IQR: 10–40%) for the 4th odor (Mann–Whitney rank-sum test, ns, N = 10 bees).
In order to test whether the repetition decrease of KC responses originates in the MB or whether it already occurs in the AL, we measured PNs in the AL using the same stimulus protocol (Figure 2
C). Dendritic responses in the AL did not decrease when repeatedly stimulating the antenna with the same odor. We therefore conclude that repetition decrease originates within the MB calyx.
CS–US Pairing Effects
We next asked whether KCs are sensitive for the coincident stimulation with an odor (CS) and a sucrose reward (US) during differential conditioning. Bees were stimulated with 3 s odor pulses, and 1 s after odor onset, their antennae were touched with sucrose solution for another 3 s. For each bee, five odor–sucrose pairings were alternated with five presentations of another odor without sucrose stimulation (to avoid US sensitization effects we did not test KCs’ response to sucrose alone in trained animals). Figure 3
A shows the dendritic KC response traces during three pretraining and five training trials. During the pairing of odor and sucrose, the phasic responses turned into long lasting, temporally fluctuating responses, which often rose above the amplitude of the initial odor response. This prolonged activation can be explained in two ways: First, sucrose may activate additional KCs and the prolonged KC response may reflect the superposition of odor- and sucrose-activated KCs. Second, odor-activated KCs might increase their response upon sucrose stimulation and thus be sensitive for the contiguity of odor (CS) and sucrose (US). To distinguish between the two possibilities, we compared KC response patterns during odor and odor–sucrose stimulation (Figure 3
B) and, in an additional set of experiments, also during pure sucrose stimulation (Figure 3
C). Visual inspection of the early and late KC responses during pretraining and training showed that odor–sucrose pairing evoked activity in some additional KCs, which were not activated by the odor alone (cyan arrowheads in Figure 3
B), and odor-activated KCs increased their responses upon sucrose stimulation. Interestingly, increased responses during odor–sucrose pairing were also found in KCs that did not respond to sucrose alone (Figure 3
C, white arrowheads), suggesting that they are sensitive for the contiguity of odor and sucrose.
Associative Plasticity
In order to test whether differential conditioning changes KC responses to the rewarded odor (CS+) or to the unrewarded odor (CS−), we compared KC responses before (pretraining) and 15 min after training (post-training). Visual inspection of the KC response patterns revealed altered activation patterns for the CS+ and CS− (Figure 4
A). In both cases there were somata/dendritic regions that increased or decreased their responses after training. In particular, KCs that responded to the CS− decreased their activity or even dropped out of the pattern.
To quantify possible learning effects, we first analyzed KCs’ response strength. For each trial, the dendritic response was averaged over the neuropil (traces in Figure 4
B). The strength of CS+ and CS− responses changed in a differential manner: During pretraining, KC responses to both odors were subject to repetition decrease. After training, CS+ responses recovered from repetition decrease, while CS− responses decreased further (dotplots in Figure 4
B). We then asked whether the changes in the spatial activation patterns are different for the CS+ and CS−, and thus may be indicative of associative restructuring of the KC network. For this purpose, we performed pairwise, time resolved correlations of the spatial activation patterns. We first analyzed changes in the similarity of KC responses within CS+ or CS− between pre- and post-training for each trial (Figure 4
C). Correlation coefficients reached a maximum within 400 ms after stimulus onset and then declined. We found that the spatio-temporal pattern of activated KCs changed more for the CS− than for the CS+ between the first pre- and post-training trials (boxplot in Figure 4
C). As a next step, we analyzed whether KC activation patterns change such that the similarity between CS+ and CS− patterns changes. If that would be the case, the correlation between CS+ and CS− should be different for pre- and post-training (Figure 4
D). CS+ vs. CS− correlations also reached maximum within 400 ms after stimulus onset, and they were, as expected, lower than within-odor correlations between pre- and post-training. However, there was no difference for CS+ vs. CS− correlations between pre- and post-training. Thus learning-related changes in KC activation patterns do not affect the similarity between CS+ and CS− representations.
We stimulated honeybees with olfactory, gustatory and tactile stimuli, and conditioned them while imaging from somata and dendrites of clawed KCs in the MB calyx. We found that clawed KCs responded to antennal CS-related stimuli (odors, tactile stimuli) and US-related stimuli (water, sucrose) in a sparse way and with phasic response dynamics. KC responses were subject to experience dependent alterations: (a) repeated stimulations with the same odor led to a decrease of KC responses (non-associative plasticity); (b) after conditioning, KC responses to the CS+ recovered from repetition decrease and responses to the CS− decreased further (associative plasticity). These results suggest that learning-induced changes in stimulus salience is related to alterations of KCs’ response strength.
KCs Encode Conditioned and Unconditioned Stimuli
As previously shown (Perez-Orive et al., 2002
; Szyszka et al., 2005
; Wang et al., 2004
), KCs feature a sparse odor code in a twofold way: First, a given odor activated a small proportion of highly odor specific KCs. Second, in contrast to the presynaptic PNs, KCs responded with brief and phasic responses and often exhibited off-responses after stimulus offset. We found that KCs responded not only to odors, but also to gustatory and tactile stimuli. Stimuli of different modalities induced qualitatively similar responses, as they activated small subsets of KCs with phasic response dynamics and frequent off-responses after stimulus end. Thus, a KC response appears to emphasize the beginning and the end of a stimulus. Sparse codes optimize the formation and storage of associative memories. Hence, the sparseness of KCs’ responses makes them potentially well suited for the substrate of associative learning (Rolls, 2007
).
KC Responses are Subject to Non-Associative Plasticity
Our results demonstrate that KCs decrease their odor responses from the first to the second stimulation. The repetition decrease was odor specific and did not generalize between different odors. This repetition decrease resembles the decrease in response intensity previously described in locust PNs (Stopfer and Laurent, 1999
). In contrast to locust PNs, however, honeybee PNs appear to be devoid of repetition-induced plasticity (see also Peele et al., 2006
). Therefore, KCs’ repetition decrease most probably originates within the MB calyx.
What could be the function of KCs’ repetition decrease? The repetition decrease of KC responses is reminiscent of a repetition-related decrease in stimulus salience. Honeybees react to any stimulus, e.g., an odor, with increased and more regular antennal movement (Suzuki, 1974
), and hungry honeybees often extend their proboscis in response to novel stimuli (odors, water vapor, mechanical stimuli; unpublished observations). These reactions can be interpreted as increased attention, and both reactions undergo habituation, as the salience of an odor or antennal sucrose stimulus decreases with stimulus repetition (Braun and Bicker, 1992
). Thus, alterations in KCs’ response strength reflect changes in bees’ response probability and may therefore encode the salience of stimuli.
KCs Prolong Their Responses Upon the Pairing of CS and US
Normally, KCs exhibit short and uniform odor responses even though they receive ongoing input from PNs. Upon odor–sucrose pairing, however, some of the odor-activated KCs exhibited a prolonged odor response. Thus, KCs might be sensitive for the contiguity of odor (CS) and sucrose reward (US). The increase in KC sensitivity to ongoing PN input during sucrose stimulation might be controlled by the VUMmx1 neuron (Hammer, 1993
). This putatively octopaminergic neuron mediates the reinforcing function during appetitive odor learning and increases its response to the trained odor. Since it projects into the lip region of the MB calyx it is likely to provide input to KCs either directly or via PN terminals. It is possible that VUMmx1 exerts its reinforcing function in a modulatory way, such that it increases KC excitability during odor–sucrose pairing.
KC Responses are Subject to Associative Plasticity
The differential learning paradigm used in our experiments has been extensively studied in behavioral experiments using the proboscis extension response as a monitor for learning (Bitterman et al., 1983
; Menzel, 1990
). In our preparation, we could not monitor behavioral responses. However, bees in a comparable preparation, show normal learning (Faber et al., 1999
; Peele et al., 2006
). After training, the probability of extending the proboscis increases for the CS+ and decreases for the CS−. The differential conditioning paradigm controls for non-associative effects. If the US would cause general sensitization, it would lead to similar effects for CS+ and CS−. However, we found different training effects for the CS+ and CS−. After training, CS+ responses recovered from repetition decrease, while the CS− responses decreased further. The recovery from repetition decrease for the CS+ appears to require a consolidation period of several minutes, since it was visible only 15 min after the last training trial and did not occur during training. Most interestingly, a consolidation period of >20 min for associative plasticity was also found in behavioral experiments in which the sucrose stimulus was replaced by a local microinjection of octopamine into the mushroom body (Hammer and Menzel, 1998
). It is therefore possible that associative plasticity requires consolidation periods in the range of several minutes to be expressed in the mushroom body. Moreover, the spatial pattern of activated KCs changed more for the CS− than for the CS+ and appeared to include a dropout of KCs, initially responding to CS−. Again, the alterations in KCs’ response behavior reflect changes in bees’ behavior, and therefore, we attribute the observed training effects to neural correlates of learning processes.
These training effects can be interpreted as superposition of associative and non-associative processes. The lack of response reduction for the CS+ could reflect an associative process that prevents repetition decrease to occur for sucrose paired stimuli. The differential effect for the CS− makes it probable that the lack of response reduction for the CS+ reflects an associative phenomenon. For the CS−, the repetition decrease as seen in the pretraining may continue, and stimulus repetition may simply induce an ongoing non-associative depression effect. Alternatively, the response reduction for the CS− response may reflect an associative effect, leading to enhanced response reduction.
Associative changes in neural activity in the honeybee have also been demonstrated in previous calcium imaging studies (Faber and Menzel, 2001
; Faber et al., 1999
; Sandoz et al., 2003
). Similar to our study, Faber and colleagues performed differential odor conditioning and imaged brain activity before and 10–30 min after training. They found increased CS+ responses in both, the AL (Faber et al., 1999
) and the MB (Faber and Menzel, 2001
), while the CS− responses remained unchanged. However, since an imaging technique was used that is not selective for a particular neuron type, it remains unclear, in which neurons those changes occurred.
Possible Mechanism for Experience Dependent Plasticity in KCs
How are KCs’ changes in calcium responses related to changes in their spiking activity? KCs receive synaptic input from cholinergic PNs (Goldberg et al., 1999
; Oleskevich, 1999
) and therefore, KCs’ calcium signal might reflect calcium influx through cholinergic receptors. However, it is known from calcium imaging studies in the AL that the intracellular calcium concentration is closely correlated with spiking behavior (Galizia and Kimmerle, 2004
). We therefore assume that KCs’ calcium signals are dominated by calcium influx through voltage-gated calcium channels and that the learning effects reflect changes in spike activity rather than changes in calcium release or regulation (Szyszka et al., 2005
).
Besides odor driven excitatory input from PNs, KCs receive both local and global feedback inhibitory input via GABAergic A3-v neurons (Ganeshina and Menzel, 2001
; Grünewald, 1999a
; Rybak and Menzel, 1993
). Thus, experience dependent plasticity of KC responses may reflect changes in PN output activity, modifications of synaptic transmission between PNs and KCs and/or alteration of inhibitory input onto PN terminals and/or KCs. If one assumes that the calcium signals measured by Faber and Menzel (2001)
in the MB calyx would reflect PN output, then the learning induced increase in PN activity could counteract repetition decrease in KCs’ CS+ responses. Recurrent inhibitory A3-v neurons were found to reduce their responses to a forward paired odor (CS+) and increase it after an unpaired US presentation (Grünewald, 1999b
). If this result would apply to all recurrent A3-v neurons, a reduced inhibition for the CS+ could explain the stability of the CS+ responses in KCs. In such a scenario, associative plasticity would reside in inhibitory A3-v neurons. Alternatively, since information about the reward is conveyed by the VUMmx1 neuron, one might speculate that changes in KC response strength are controlled through octopamine release from VUMmx1. Indeed, VUMmx1 increases its response strength to CS+ after conditioning (Hammer, 1993
) and KCs increase their response strength to PN input after octopamine application (Oleskevich, 1999
). In such a case, the associative plasticity, as seen in KCs, would reside in the VUMmx1 neuron. The recovery from repetition decrease for the CS+ could then reflect an increased synaptic transmission from PNs to KCs, induced by stronger octopamine release that would antagonize the depression effect of stimulus repetition. Another possibility is that KCs themselves undergo associative plasticity. In such a case, the forward pairing of presynaptic activity from PNs and release of octopamine via the VUMmx1 neuron would enhance KC responses by a postsynaptic effect, e.g., associative LTP counterbalancing repetition-dependent depression (Locatelli et al., 2005
; Schwärzel and Müller, 2006
).
Taken together, our results show that the responses of clawed KCs are altered through associative and non-associative neural plasticity within the MB. These changes correspond to associative and non-associative changes in response probability typically observed in honeybee’s behavior, and thus may encode changes in stimulus salience.
The authors declare that the research was conducted in the absence of any commercial or financial relationships that could be construed as a potential conflict of interest.
Thanks to Ana Florencia Silbering for providing data analysis tools, to A. F. Silbering, C. Giovanni Galizia, Martin Strauch and Anneke Meyer for fruitful discussions and comments on the manuscript and to anonymous reviewers for valuable suggestion on a former version of the manuscript. This work was funded by the Deutsche Forschungsgemeinschaft through SFB 515.