1
Redwood Center for Theoretical Neuroscience, University of California Berkeley, CA, USA
2
Neuroscience Graduate Program, University of Southern California, Los Angeles, CA, USA
3
Center for Neuroscience, University of California, Davis, CA, USA
Thalamic relay cells fire action potentials that transmit information from retina to cortex. The amount of information that spike trains encode is usually estimated from the precision of spike timing with respect to the stimulus. Sensory input, however, is only one factor that influences neural activity. For example, intrinsic dynamics, such as oscillations of networks of neurons, also modulate firing pattern. Here, we asked if retinal oscillations might help to convey information to neurons downstream. Specifically, we made whole-cell recordings from relay cells to reveal retinal inputs (EPSPs) and thalamic outputs (spikes) and then analyzed these events with information theory. Our results show that thalamic spike trains operate as two multiplexed channels. One channel, which occupies a low frequency band (<30 Hz), is encoded by average firing rate with respect to the stimulus and carries information about local changes in the visual field over time. The other operates in the gamma frequency band (40–80 Hz) and is encoded by spike timing relative to retinal oscillations. At times, the second channel conveyed even more information than the first. Because retinal oscillations involve extensive networks of ganglion cells, it is likely that the second channel transmits information about global features of the visual scene.
Thalamic relay cells transmit information encoded by retinal spike trains downstream to cortex. It is often held that the amount of information that action potentials carry is limited by the precision with which firing rate tracks changes in the stimulus, a framework of stimulus-locked coding (Hubel and Wiesel, 1961
; Nirenberg et al., 2001
; Reinagel and Reid, 2000
). Yet information can also be encoded by means other than average rate. For example, the relative timing of action potentials fired by a single cell (Klein, 1992
; McClurkin et al., 1991
; Reich et al., 1997
) or the relative spike latencies within populations of neurons can provide information about spatial structure within a stimulus (Gollisch and Meister, 2008
). The temporal dynamics of local networks (Brivanlou et al., 1998
; Meister et al., 1995
) can also play a role in sensory processing. For instance, work in several modalities suggests that information can be encoded by spike timing with respect to ongoing oscillatory activity (Ahissar and Vaadia, 1990
; Friedrich et al., 2004
; Montemurro et al., 2008
; O’Keefe and Recce, 1993
; Szwed et al., 2003
).
Oscillations in the firing rate of retinal ganglion cells are common and have been found in species as diverse as the frog and cat (Arai et al., 2004
; Castelo-Branco et al., 1998
; Heiss and Bornschein, 1965
, 1966
; Laufer and Verzeano, 1967
). A natural question is whether these intrinsic retinal rhythms might provide information to higher stages in the visual pathway. To address this subject, we made whole-cell recordings in vivo from the cat’s lateral geniculate nucleus of the thalamus (LGN) during the presentation of natural movies. With this technique, it was possible to detect both individual retinal inputs and the spikes they evoke from single relay cells. In addition, we analyzed extracellular recordings of retinal activity obtained in a separate laboratory as a control. Thus far, our results show that oscillations in retinal inputs, EPSPs, can be transmitted to cortex by thalamic outputs, spikes.
We next used information theory to explore how both external visual stimuli and internal rhythms modulate patterns of thalamic activity (for details, see Koepsell and Sommer, 2008
). Our analyses showed that both the extrinsic and intrinsic components of retinal input to single relay cells are multiplexed into two parallel channels. One channel is encoded by average firing rate with respect to the stimulus, stimulus-locked coding. It operates in the low frequency band (<30 Hz) and carries information about sequential changes in the visual stimulus. The second channel is encoded by the timing of individual spikes relative to the retinal oscillations, oscillation-based coding. This channel operates in the gamma-frequency band (40–80 Hz). Remarkably, the amount of information in the second channel could match or even exceed that conveyed by the first. Further we were able to reproduce this result with a simple model of a relay cell. Thus, these two channels are not, in principle, difficult to generate.
Dividing the information carried by thalamic spike trains into two channels offers substantial advantages for transmission of sensory signals to the cortex. For example, dual channels could enhance robustness of the system to noise since they offer independent mechanisms for decoding activity. Moreover, the second channel might provide a conduit for information that is not communicated by stimulus-locked changes in firing rate alone. Last, because oscillations involve distributed networks, they are likely to convey information about large-scale features or spatiotemporal context.
Preparation, Stimulation and Recording for Whole-Cell Experiments
Adult cats (1.5–3.5 kg) were prepared as described earlier (Hirsch et al., 1998
) except anesthesia was maintained with propofol and sufentanil. Whole-cell recordings of the membrane voltage or current were made with dye filled pipettes from 17 cells in 9 animals using standard techniques (Hirsch et al., 1998
; Axopatch 200A amplifier, Axon Instruments, Inc., Union City, CA, USA) and digitized at 10 kHz (power1401 data acquisition system; Cambridge Electronic Design Ltd., Cambridge, UK). The stimuli were various natural movies (30 s duration) that were repeated 5–50 times. The movies were displayed at 19–50 frames/s on a video monitor (refresh rate 133–160 Hz) by means of a stimulus generator (VSG2/5 or ViSaGe; Cambridge Research Systems Ltd., Rochester, UK). Housing, surgical and recording procedures were in accordance with the National Institutes of Health guidelines and the University of Southern California Institutional Animal Care and Use Committee.
Preparation, Stimulation and Recording for Extracellular Experiments
Adult cats were prepared and anesthetized as described earlier (Usrey et al., 1998
). The stimuli were white noise (m-sequences, see Usrey et al., 1998
) created with a VSG2/5 visual stimulus generator (Cambridge Research Systems Ltd., Rochester, UK) and updated at the 140 Hz refresh rate of the video display. Spike trains were digitized at 20 kHz (power1401 data acquisition system; Cambridge Electronic Design Ltd., Cambridge, UK) and stored for further analysis. All procedures conformed to NIH guidelines and were approved by the institutional Animal Care and Use Committee at the University of California, Davis.
Event Detection and Sorting
Potential events (spikes, EPSPs and false positives) were detected as zero-crossings (from positive to negative) in the second derivative of the intracellular signal. Spikes were distinguished from EPSPs by a threshold criterion. A clustering algorithm (Harris et al., 2000
) was used to separate EPSPs from false positives (Figure 1
); each event was characterized using a short segment (1.5 ms) of the second derivative. The first three principal components (in the space of the event-centered second derivative) were used as features in the clustering procedure; clusters that corresponded clearly to retinal EPSPs as determined by visual inspection were selected for further analysis (Wang et al., 2007
). The extracted spike trains of the relay cell (red) and the event trains of the synaptic inputs (EPSPs) corresponding to retinal spikes (blue) are displayed in Figures 2
A,B.
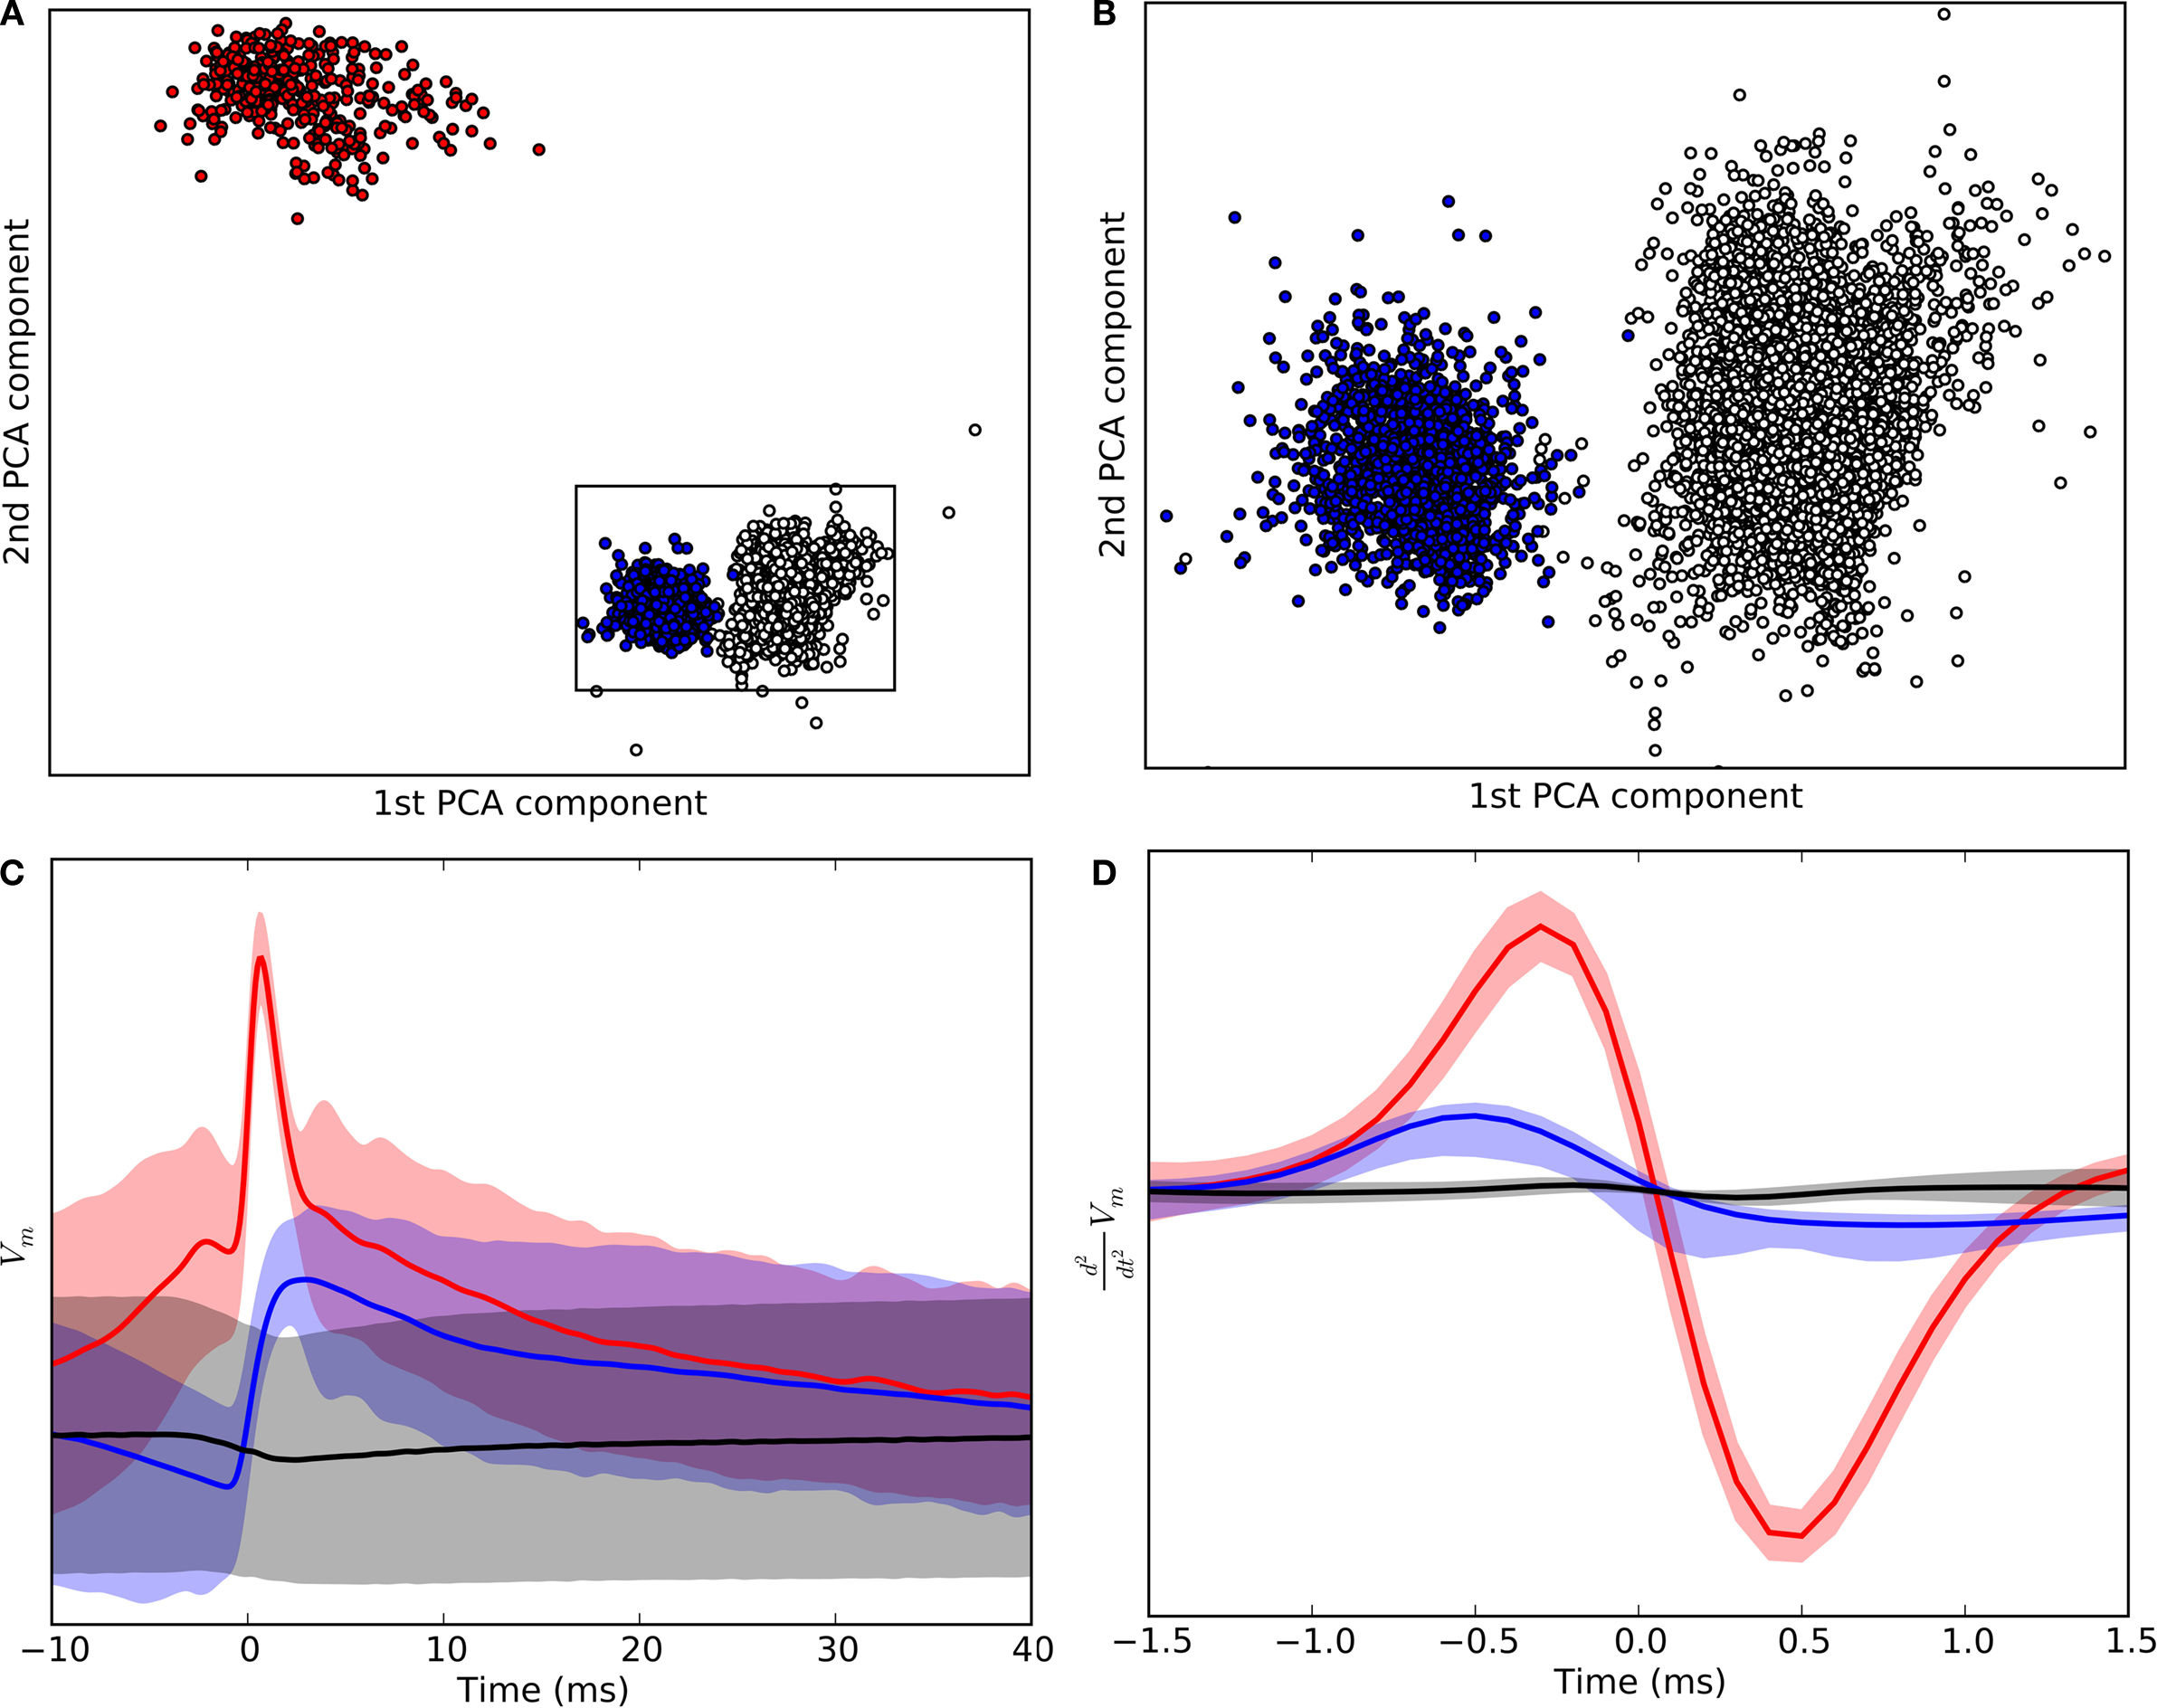
Figure 1. Clustering of intracellular events. (A) Clusters of events detected in the intracellular signal. The axes of the scatter plot are the first two principal components of the curvature (second derivative) of the events detected from recordings of the membrane potential. Events classified as spikes are red, as EPSPs, blue, and as noise, uncolored. The rectangle marks the data range that is shown in (B) at higher magnification. (B) Clusters shown in (A) at an expanded scale illustrate the separation of EPSPs from noise. (C) Averaged segments (50 ms) of membrane voltage (cluster means) centered around events classified as spikes, red, EPSPs, blue, and noise, black; shaded regions indicate one standard deviation. The beginning of each event, t = 0 is defined as a zero crossing in the curvature of the recording. (D) Averaged curvature of the membrane potentials centered around the start of each event.
Estimating Receptive Fields
We estimated the spatiotemporal receptive fields of the relay cells by using a model that predicted neural responses to the natural movies (Figure 2
C). Specifically we used regularized gradient descent (Machens et al., 2004
) to optimize a linear convolution kernel with respect to the quadratic error between predicted and empirical response. The firing rates used to calculate the receptive fields were estimated with a temporal Gaussian filter, 25 ms half-width and spontaneous rates were taken as the average rate across the entire recording (Wang et al., 2007
).
Estimating Power Spectra
The most common method for estimating spectral power uses the squared amplitude of the windowed Fourier transform of the signal. In order to reduce variance in the estimates, spectra are first computed in brief, overlapping time windows and then the spectra for overlapped sampling windows are averaged. Unfortunately, this procedure introduces a bias. Specifically, because the spectral estimator is the convolution of the true spectrum with the spectrum of the sampling window, it cannot be reduced below a minimum set by the time-frequency uncertainty (the trade-off between time and frequency localization). To lessen the effect of this bias, the multi-taper method averages spectra computed with orthogonal sampling functions (tapers) that are maximally concentrated in the frequency domain (Jarvis and Mitra, 2001
; Thomson, 1982
). We used a multi-taper method with five tapers, on non-overlapping windows (of 2.048 s) and then averaged these estimates over several trials to generate power spectra for the membrane potential and spike trains for relay cells (Figures 3
D and 4
C,D) and the spike trains for ganglion cells (Figure 5
B). Later, we used these same spectra to estimate information rates in thalamic spike trains (Figures 7
A,B and 8
E) and in artificial spike trains generated by the Quasiperiodic Gamma (QPG) model (Figures 11
A,B), which is described in Section “Simulation Experiments”.
Estimating Information Rate
Upper and lower bounds on the information rate in Figures 7
, 8
E and 11
were estimated by the dynamic Gaussian channel based on the power spectrum and double checked with the direct method. These methods were based on different assumptions about the statistics of the stimulus and the response as well as the neural model (for overview, see Borst and Theunissen, 1999
).
Estimating information rate: the Gaussian channel
When the signal has Gaussian statistics and the noise is additive and Gaussian, information rates can be calculated as (Bialek et al., 1991
; Rieke et al., 1999
):

where SNR(ω) = S(ω)/N(ω) is the signal-to-noise ratio, computed in the frequency domain from the spectrum of the signal S(ω) and the spectrum of the noise N(ω). When different definitions of signal and noise were used, this formula yielded estimates for the upper and lower bounds for the information rate, as below:
Upper bound. The signal was defined as the component of the neural response that contained information about the stimulus (determined by cross-trial average of spike trains). The noise was defined as the deviation of individual trials from the average. Power spectra were estimated using the multi-taper method. Errors due to finite sample size (N) were corrected by assuming that the power of Gaussian noise decreases as 1/N in the average across trials (Sahani and Linden, 2003
). With these definitions, the formula for the Gaussian channel gave estimates of an upper bound for the information that could be transmitted by stimulus-locked coding (see also Figures 7
A, 8
E and 11
A,B).
Lower bound (Reconstruction method). The signal was defined as the stimulus (the movie) and the noise as the deviation between the actual stimulus and one that was reconstructed as follows. To reconstruct the stimulus, the neural spike train was convolved with a receptive field estimated from responses to a different movie (see above). With these definitions, the formula for the Gaussian channel gave a lower bound for the information that stimulus-locked coding could transmit (see Figure 7
B). Note that the estimate of the lower bound is tight only if the linear model used to reconstruct the stimulus captures the response of the neuron well.
Using the direct method to estimate information rates
So far, we have made that assumption that both the signal and noise are Gaussian. If, however, the noise is not additive or not Gaussian, then IG does not guarantee an upper bound. Similarly, if the signal is not Gaussian, then IG does not guarantee a lower bound. Therefore, to assess how well the Gaussian channel was able to capture the rates of information that relay cells actually transmitted, we used a technique called the “direct method”. This method does not rely on Gaussian statistics or any given neural model to estimate the total entropy in a neuron’s response. If it is assumed that all information is conveyed by single spikes rather than firing patterns, then the information that each spike transmits is given by the formula (Brenner et al., 2000
)
where r(t) is the spike rate and  is the mean rate averaged over the whole recording time T.
is the mean rate averaged over the whole recording time T.The direct method has a weakness, however; the accuracy of the estimate it provides depends on the bin width, Δt, used to compute the integral in the equation directly above. Specifically, the estimate converges to the true entropy only asymptotically (limit of zero bin width and infinite number of trials). Thus, narrow bins and finite data result in a pronounced overestimation of the amount of information that a cell transmits, see Figure 7
C, red dots.
The estimate can be improved by a linear extrapolation (Δt → 0) of the values for larger bin sizes, Figure 7
C, dashed line. A similar extrapolation must be made for estimating information with an infinite number of trials, see Figure 7
D. The resulting value of 0.58 bit/spike was similar to the estimates obtained using the Gaussian channel (upper bound: 0.44 bit/spike, lower bound 0.30 bit/spike). Two factors probably account for the overestimation produced by the direct method. First, the number of trials (20) was limited; increasing the number of trials (N) by linear extrapolation (Δt, 1/N → 0) yielded 0.55 bit/spike (Figure 7
D, dashed line). Second, the direct estimate did not remove redundancies due to correlations between single spikes.
Quantification of the Phase Locking of Spikes
To characterize periodicity in trains of unitary events (EPSPs, spikes) it was necessary to estimate frequency and phase at each point in time. Hence, we computed the complex analytic signal A(t) = A0(t)exp(iϕ(t)) by convolving the EPSP event train with a complex Morlet wavelet
centered at a frequency f with temporal width σt and normalization factor C (Figure 8
A, inset). The amplitude A0(t) of the analytic signal corresponded to the local power in the frequency band centered at f with bandwidth σf = 1/(2πσt). The bandwidth we chose, σf = 2 Hz, corresponded to the width of the peak in the power spectrum and a temporal width of σt = 80 ms. The instantaneous phase ϕ(t) was estimated as the complex angle of the analytic signal and was used to measure the distribution of phases for membrane events (Figures 4
B, 8
B and 10
C). The phase distribution of spikes was fitted with a von Mises (or cyclic Gaussian) distribution (Figure 8
B, inset)
The mean phase μ was computed from the first trigonometric moment of the spike distribution
The concentration parameter κ characterizing the width of the von Mises distribution was obtained by numerical solution of the equation I1(κ)/I0(κ) = r, where I0 and I1 were the modified Bessel functions of zeroth and first order. The concentration parameter κ is a measure of phase locking; the phase distribution becomes uniform for κ → 0 and approaches a Gaussian distribution with variance σ2 = 1/κ for large κ.
Information in Oscillatory Spike Trains
The estimated phase ϕ(t) of retinal oscillation at the time of stimulus onset, t, was used to align the timing of thalamic spikes across all trials by shifting each trial in time, −ϕ(t)/(2πf) (the absolute value was <10 ms). Thus, the phase of the retinal oscillations, which had been randomly distributed across trials, was made the same for each one, Figure 8
D. This alignment was made once for each cycle of the retinal oscillation in order to “de-jitter” the entire thalamic spike train (used in Figure 8
E). Note that our method of de-jittering differs from those that use the stimulus (Aldworth et al., 2005
) or the spike train itself (Richmond et al., 1990
) as references in time. After aligning phases, we used Equation (1) to provide an estimate of information rate that included the contribution of oscillations that were not locked to the stimulus. This method has been verified previously (Koepsell and Sommer, 2008
) by expanding the direct method of estimating information rates for single spikes to take the phase of oscillations into account.
Simulation Experiments
Recently, (Koepsell and Sommer, 2008
) we designed the quasi-periodic gamma (QPG) model to understand how the two different information channels might be multiplexed in the response of relay cells, (Figure 10
A). The QPG model describes spike generation by an inhomogeneous Gamma process (Barlow et al., 1957
) with a factorial instantaneous rate. The conditional probability of generating a new spike at time ti, given the last spike at time ti − 1 is written as (Barbieri et al., 2001
)
where k is the shape parameter of the gamma distribution, Γ(k) is the gamma function, and the instantaneous rate λ(t) is given by the product

The first factor  is the averaged firing rate calculated by convolving the stimulus with the receptive field, estimated as above). The second factor is a von Mises distribution M(ϕ; κ, μ) that describes the periodic activity in single trials. The instantaneous phase of the periodic activity ϕ(t) is given by the phase a random band-pass signal with frequency f ± σf. All told, in addition to the parameters describing the receptive field, the model has four free parameters: k, κ, f, σf (an additional degree of freedom, the mean phase, was arbitrarily set to μ = 0).
is the averaged firing rate calculated by convolving the stimulus with the receptive field, estimated as above). The second factor is a von Mises distribution M(ϕ; κ, μ) that describes the periodic activity in single trials. The instantaneous phase of the periodic activity ϕ(t) is given by the phase a random band-pass signal with frequency f ± σf. All told, in addition to the parameters describing the receptive field, the model has four free parameters: k, κ, f, σf (an additional degree of freedom, the mean phase, was arbitrarily set to μ = 0).Fitting the Model Parameters
To assess how well the results in Figures 2
–9
were captured by the QPG model, we fitted the free parameters of the model to match the properties of the cell whose responses are indicated by the circled points in Figures 9
A,B. The concentration parameter κ was determined by fitting the von Mises distribution (Figure 8
B) to the phase distribution of the cell’s spikes and the parameters f and σf were fitted to the spectrogram of the spikes. The shape parameter k of the Gamma process was determined as follows. The averaged rate λ0(t) was estimated from the average of the neural responses across trials recordings by adaptive kernel estimation (Richmond et al., 1990
). After rescaling time with

in order to obtain a constant rate (λ = 1), the rescaled distribution of inter-spike intervals τ from the experimental data could be fitted by a homogeneous Gamma distribution (Kuffler et al., 1957
)
with fixed rate λ = 1, shape parameter k and the gamma function Γ(k). The shape parameter was determined from the moments (mean  and variance
  ) of the empirical rescaled distribution of the inter-spike intervals (Barbieri et al., 2001
; Barlow et al., 1957
)
) of the empirical rescaled distribution of the inter-spike intervals (Barbieri et al., 2001
; Barlow et al., 1957
)
and variance ) of the empirical rescaled distribution of the inter-spike intervals (Barbieri et al., 2001
; Barlow et al., 1957
)
The results were obtained from adult cats in two different laboratories that used different recording techniques, visual stimuli and anesthetics. The main dataset includes whole-cell recordings from thalamic relay cells that were made from 15 subjects. A second dataset, that served as a control, included extracellular recordings from retinal axons in the optic tracts of three subjects.
The Temporal Structure of Inputs and Outputs of Single Relay Cells
We focused our analyses on responses to natural movies, stimuli that reprise features present in the environment. In order to examine the relationship between the retinal inputs and thalamic outputs that these movies evoked, we used cluster analysis. This method allowed us to label excitatory synaptic potentials (EPSPs) of the intracellular signal and to separate these from spikes (Figure 1
). Results for a single neuron are illustrated as raster plots where time points for spikes (Figure 2
A, top) are red and for EPSPs (Figure 2
A, bottom) are blue. Each row shows the response to a 5 s clip of the full stimulus. Raster plots show how inputs (EPSPs) and outputs (spikes) tracked changes in the stimulus; their rates systematically sped and slowed during repeated presentations of the same movie clip. An expanded view of the spike trains (Figure 2
B) shows that there was a fair amount of jitter between one trial of the stimulus and the next (this variability was greater than that recorded for full-field flicker (data not shown, and see Eckhorn and Popel, 1975
; Liu et al., 2001
; Reinagel and Reid, 2000
). From the averaged rate over time we were able to extract the receptive fields from the response (Wang et al., 2007
) for both the retinal inputs (Figure 2
C, top) and the spikes (Figure 2
C, bottom).
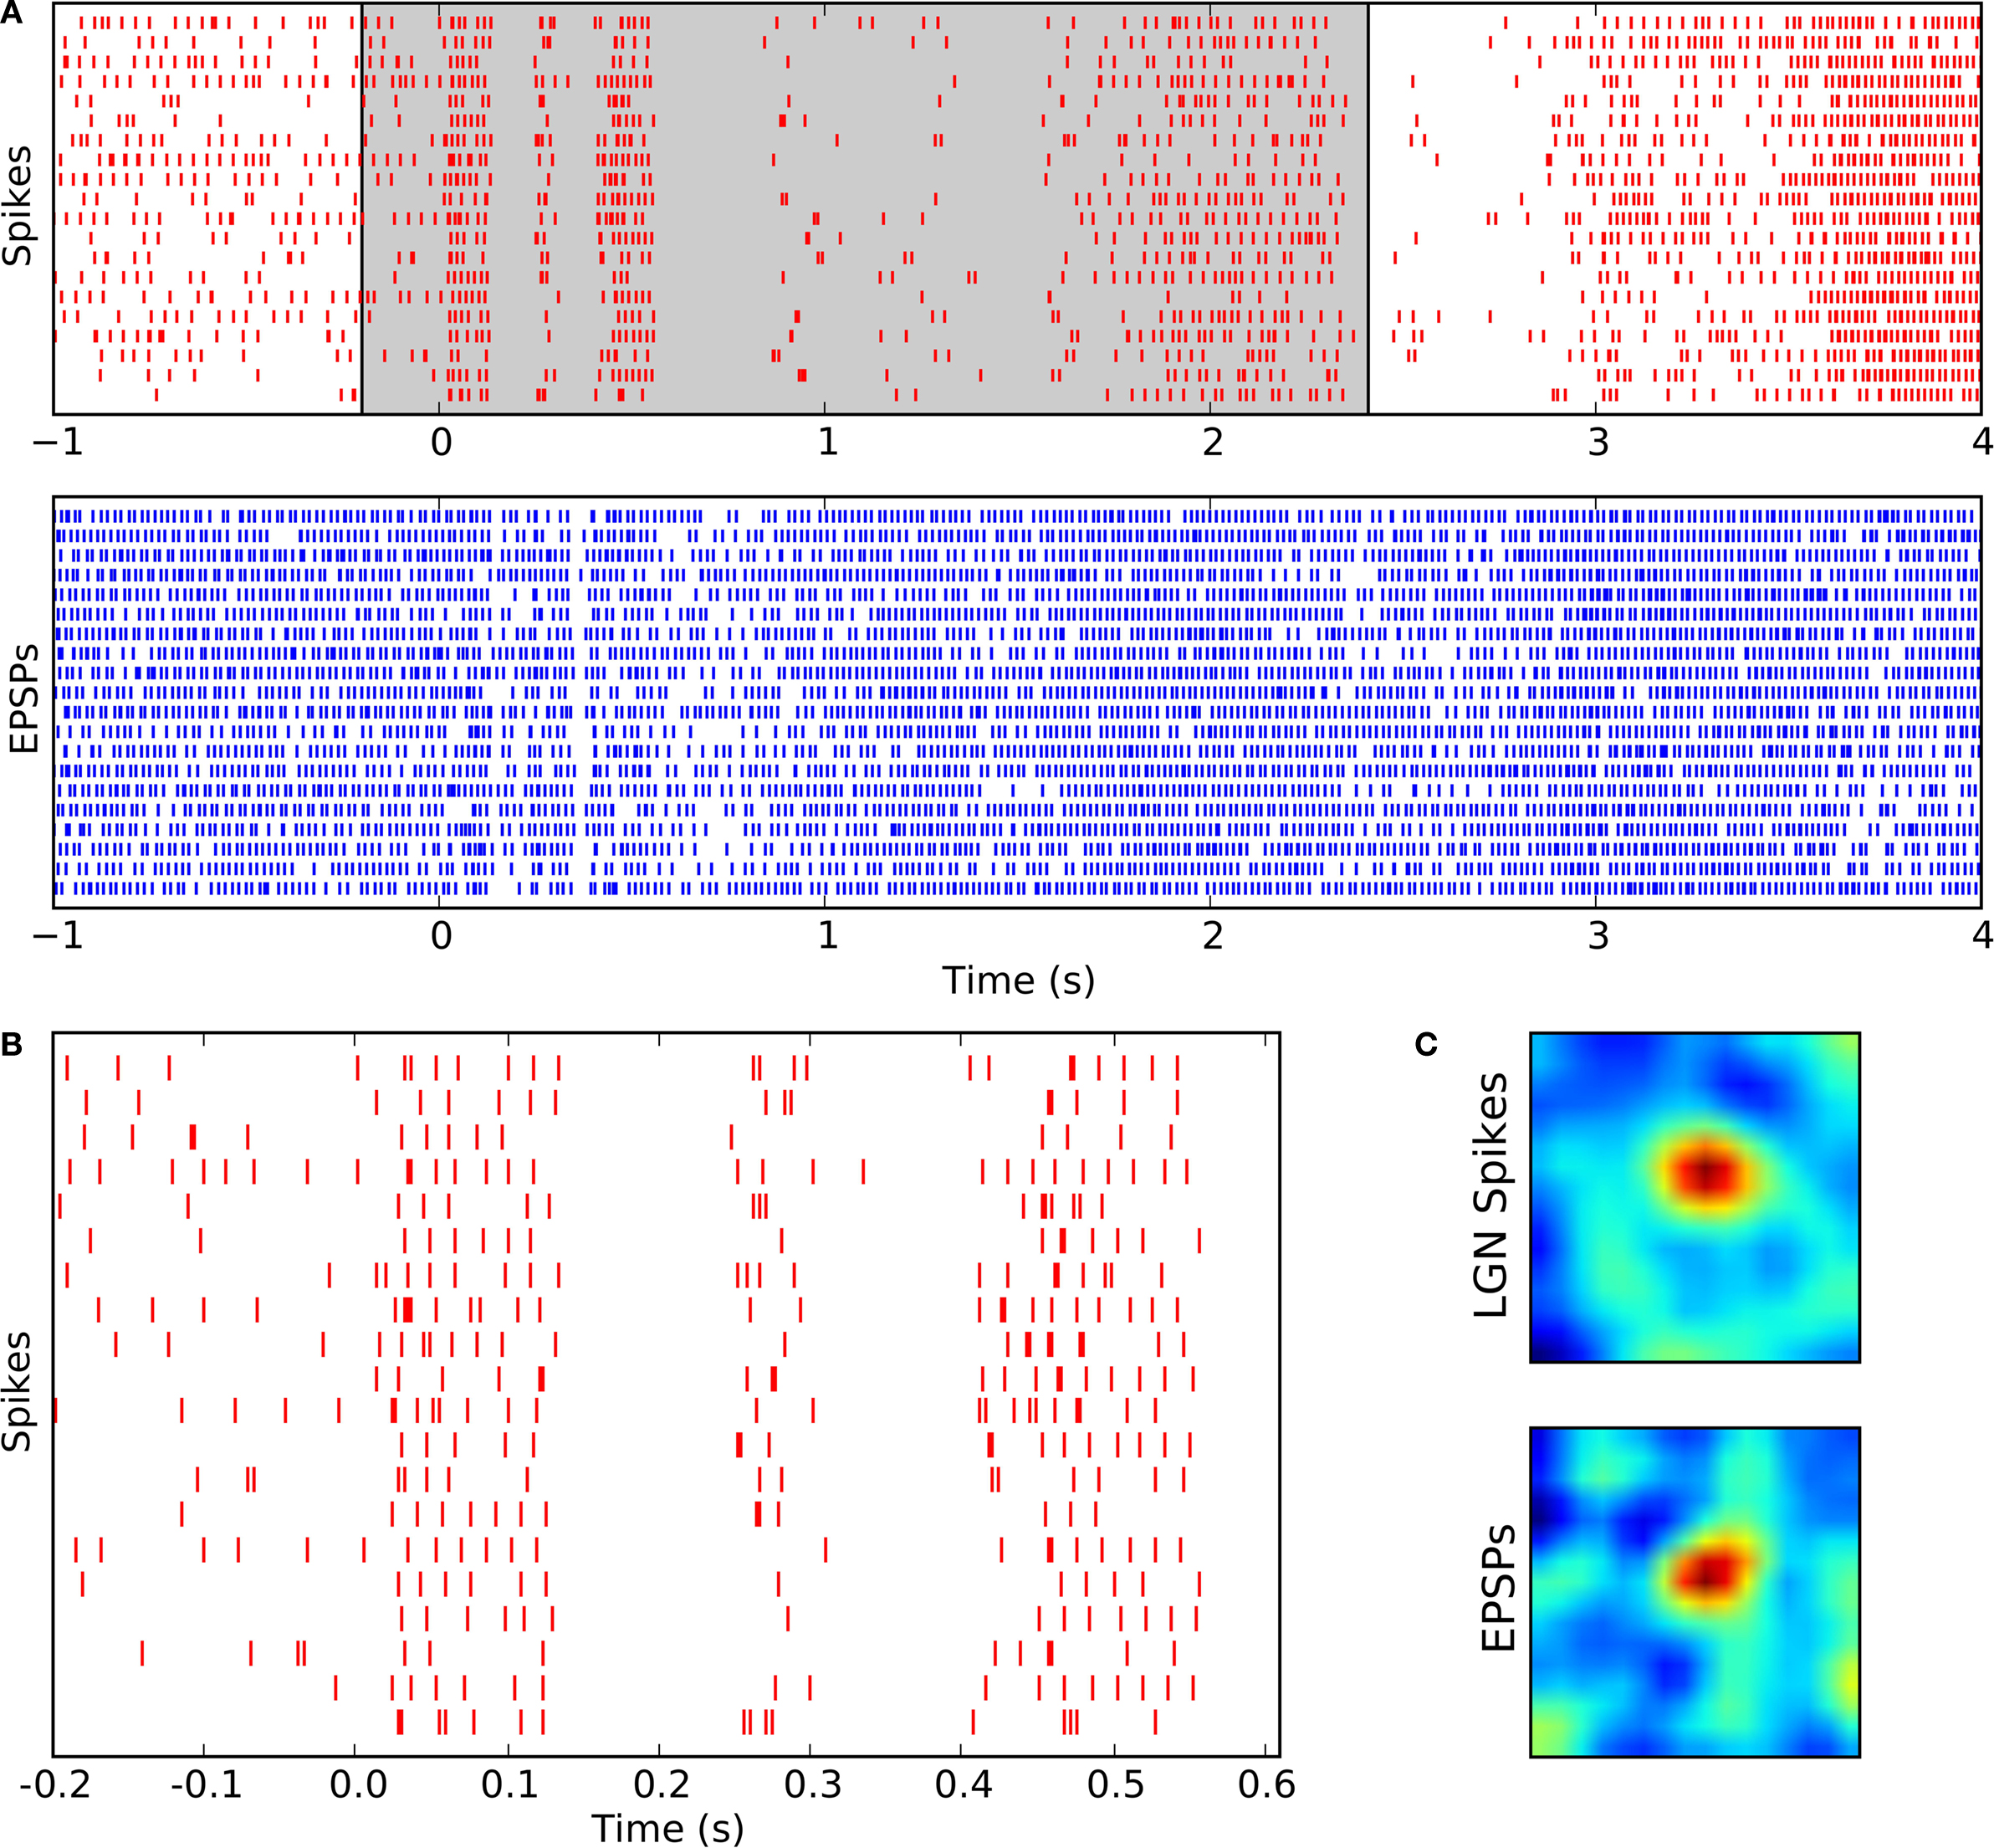
Figure 2. Timing of retinogeniculate EPSPs and thalamic spikes recorded intracellularly from a single relay cell during the presentation of natural movies. (A) Rasters of spikes (red, top) and EPSPs (blue, bottom) recorded during multiple trials of a movie clip that began at time t = 0. The shaded area marks the data range that is shown in (B) at higher magnification. (B) Spike times centered on the beginning of each clip shown at an expanded scale. (C) Receptive fields for spikes (top) and EPSPs (bottom) mapped from responses to a movie; red indicates excitation to bright and blue excitation to dark.
The round shapes of the receptive fields of the EPSPs and spikes resemble each other, consistent with the view that relay cells inherit the shape of their receptive fields from the retina. This statement assumes that the EPSPs we analyze (Usrey et al., 1998
) are fed forward from the retina rather than fed back from the cortex. We believe this is case for several reasons. First, the receptive fields of the EPSPs look just like those of ganglion cells. Second, the EPSPs we include for analysis have the prominent size of retinal inputs. Recall that these EPSPs are so large that they can be detected extracellularly, as “S-potentials”, which have been used to study retinogeniculate transmission for decades (Carandini et al., 2007
; Kaplan and Shapley, 1984
). Conversely, unitary cortical inputs are rarely big enough to visualize (Granseth and Lindstrom, 2003
) in intracellular recordings unless the membrane resistance is made large by blockade of potassium channels. Third, note that the EPSPs we detected were not only large, but also had stereotyped profiles, Figure 1
. This similarity in shape indicates that the EPSPs originated from a single source. If our event detection captured any cortical inputs, they are probably contained in the noise cluster in Figures 1
A,B. Fourth, the EPSPs we detected have the fast maintained rates, Figure 3
A, characteristic of ganglion cells (Frishman and Levine, 1983
); by contrast, cortical cells in layer 6, the source of feedback to the thalamus, have very low firing rates (Gilbert, 1977
).
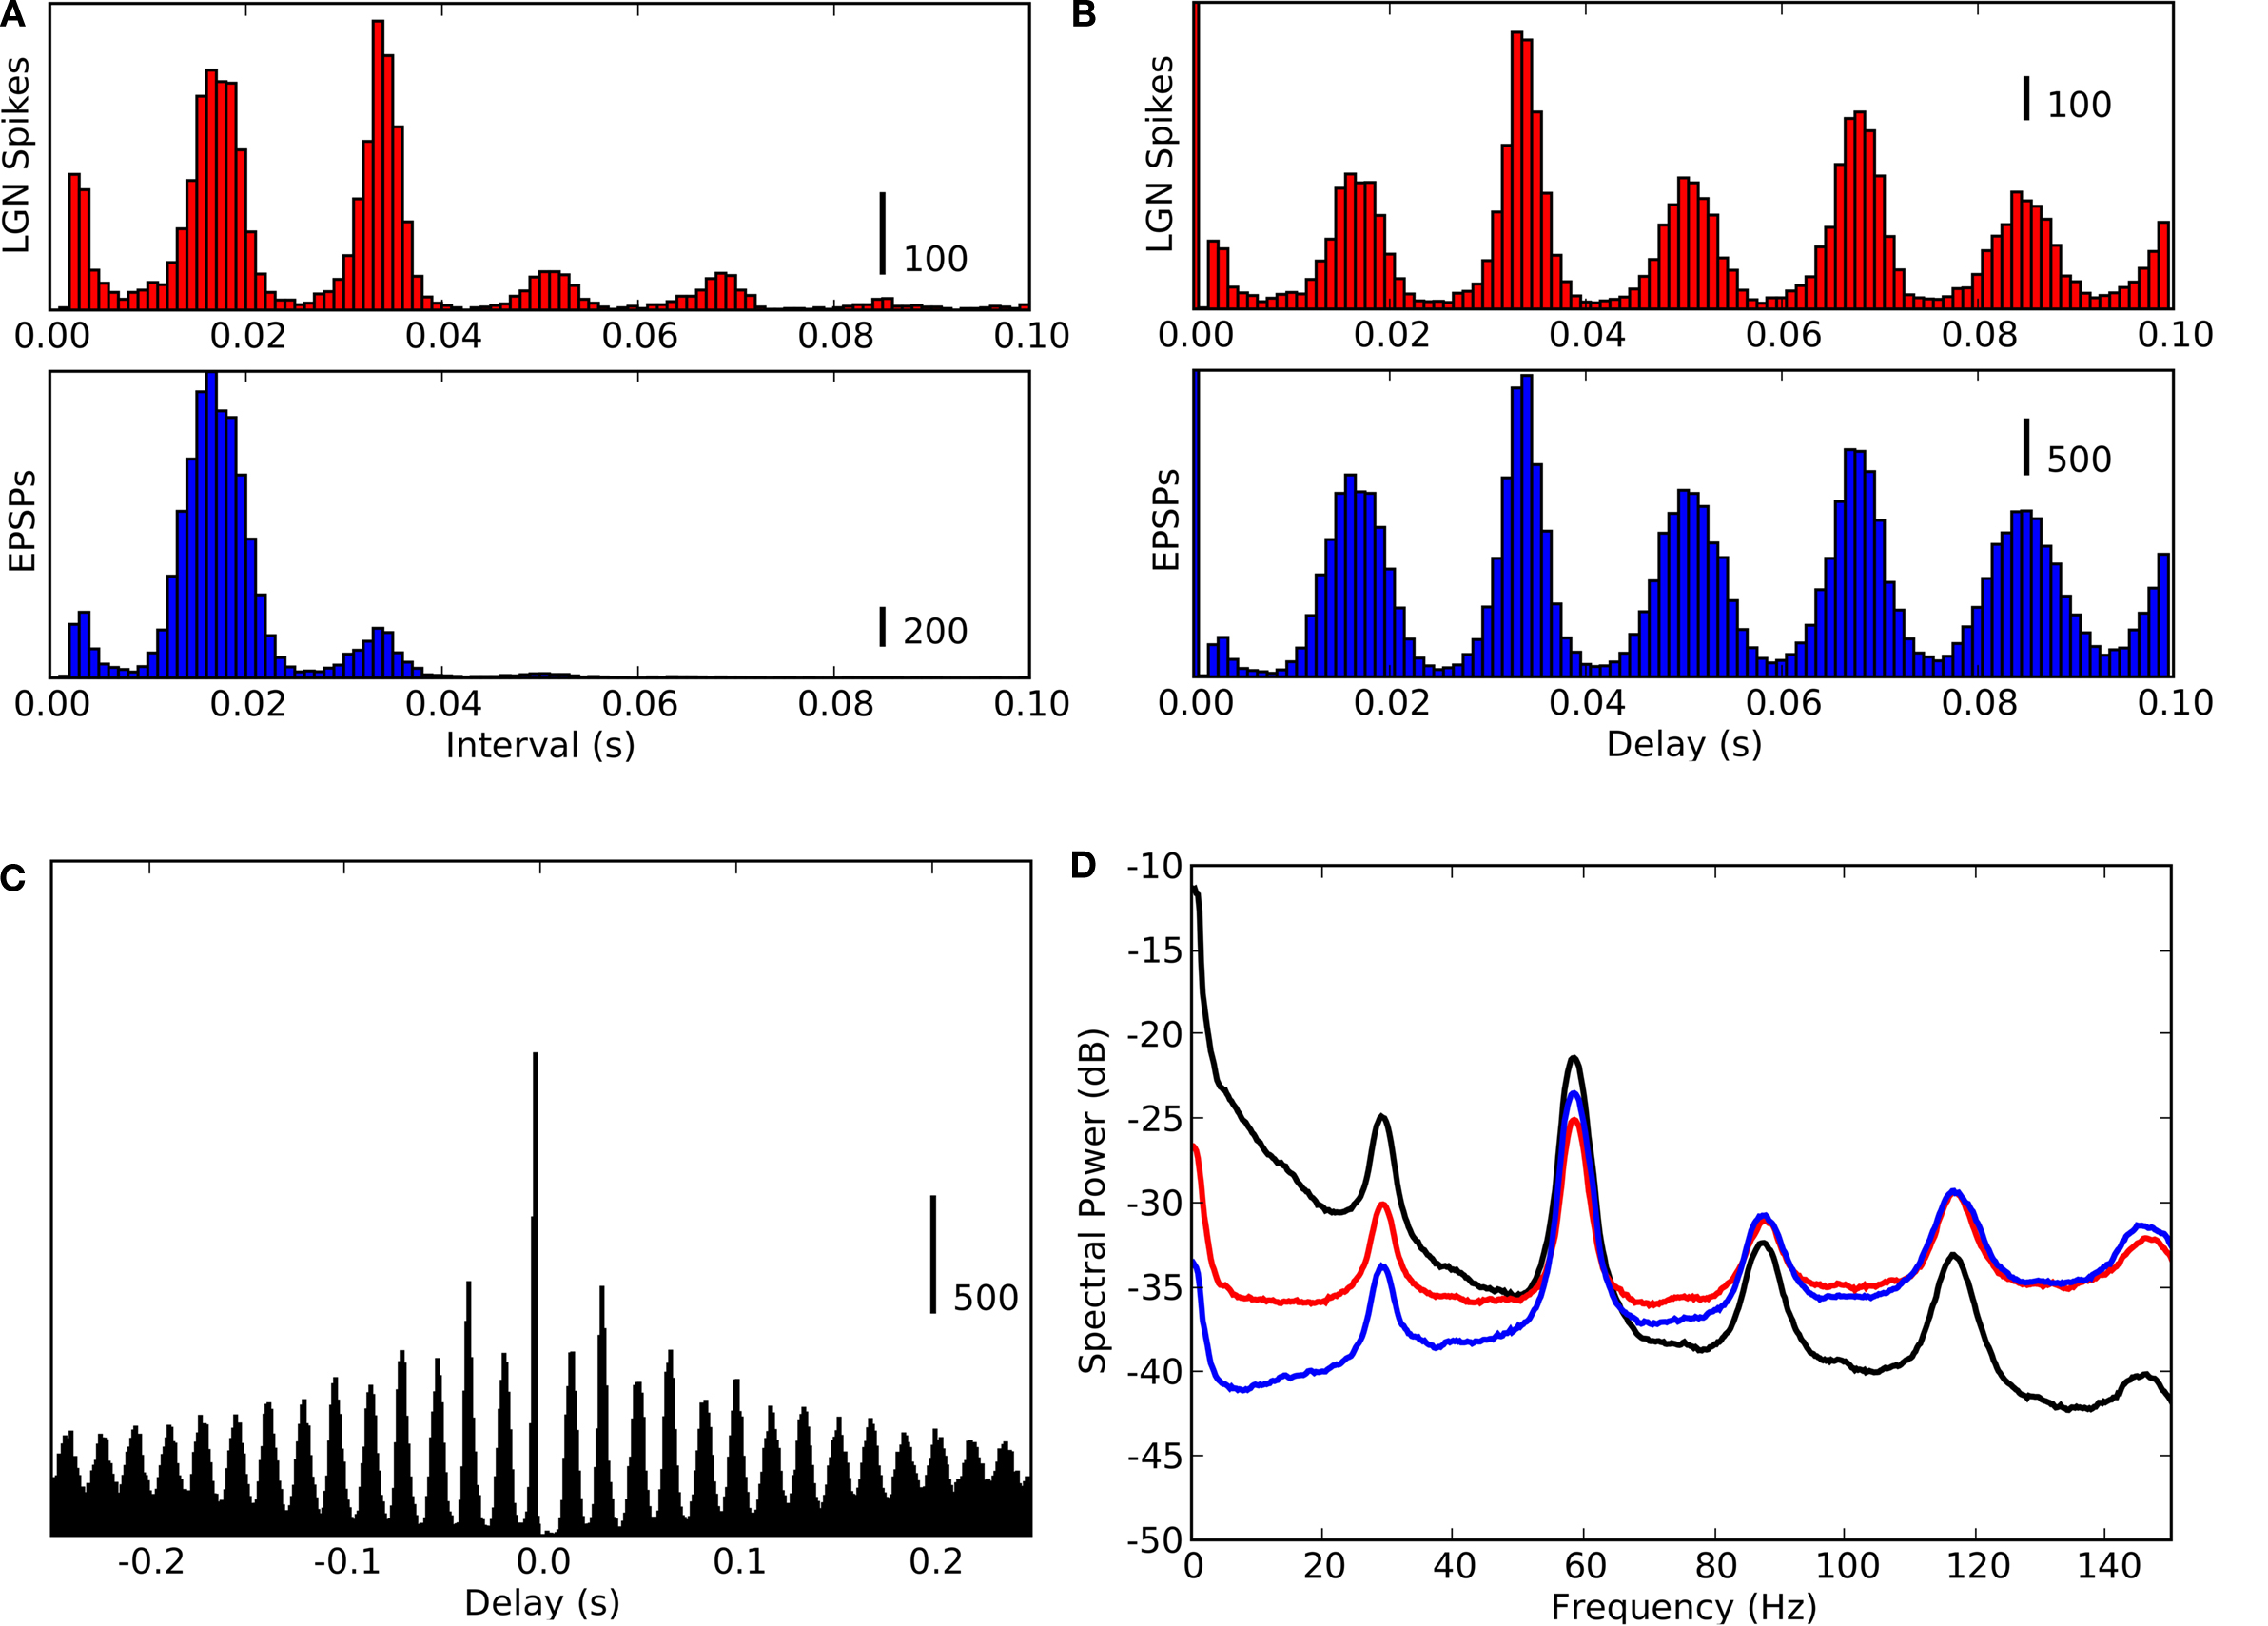
Figure 3. Periodicity in timings of retinogeniculate EPSPs and thalamic spikes. (A) Time-interval histogram for spikes (red, top) and EPSPs (blue, bottom).
(B) Autocorrelation histogram for spikes (red, top) and EPSPs (blue, bottom). (C) Cross-correlation histogram between EPSPs and spikes (spike at t = 0). (D) Power spectra of membrane potential (black), spikes (red) and EPSPs (blue), computed with the multi-taper method. All data obtained during stimulation with a natural movie clip (same recording as in Figure 2
).
Intrinsic Rhythmic Activity
Neural activity is dictated by a combination of external stimuli and internal dynamics. The event times shown in Figure 2
were plotted with respect to the onset of the stimulus. We next plotted the data with respect to the interval between the spikes or EPSPs as inter-spike intervals (Figure 3
A) or autocorrelograms (Figure 3
B). The multi-modal shapes of these time interval histograms revealed additional temporal structure in the neural responses; the tall peak at 17 ms and lesser peaks at multiples of that value showed that both the EPSPs and spikes oscillated near 59 Hz, Figure 3
A. Further, cross-correlation of the two sets of events revealed a sharp peak near zero (Figure 3
C), showing that thalamic spikes followed individual retinal EPSPs with millisecond delays. The oscillations are also visible in the power spectra for EPSPs (red), spikes (blue), and the membrane potential (black), Figure 3
D. These oscillations are not visible in the rasters shown in Figure 2
, because the intrinsic retinal rhythms are not synchronized with the stimulus.
Since neural oscillations like that illustrated above often have frequencies in the gamma range, which includes power line frequencies (50 or 60 Hz) there is understandable concern that contamination of the biological signal might introduce false rhythms. Such concerns stem from experience with extracellular records in which spike heights often are on the order of tens of microvolts in amplitude, orders of magnitude smaller than the intracellular signals studied here.
Instances in which our recordings were contaminated with line noise provide useful controls for separating neural signal from electrical interference. An intracellular recording that included interference from the power line is overlaid with blue and red vertical lines that indicate the timings of EPSPs and spikes respectively, see Figure 4
A. The inset shows an overlay of an EPSP before and after notch filtering at 60 Hz. Except for the absence of the artifacts, the difference between the shapes of the EPSPs is negligible.
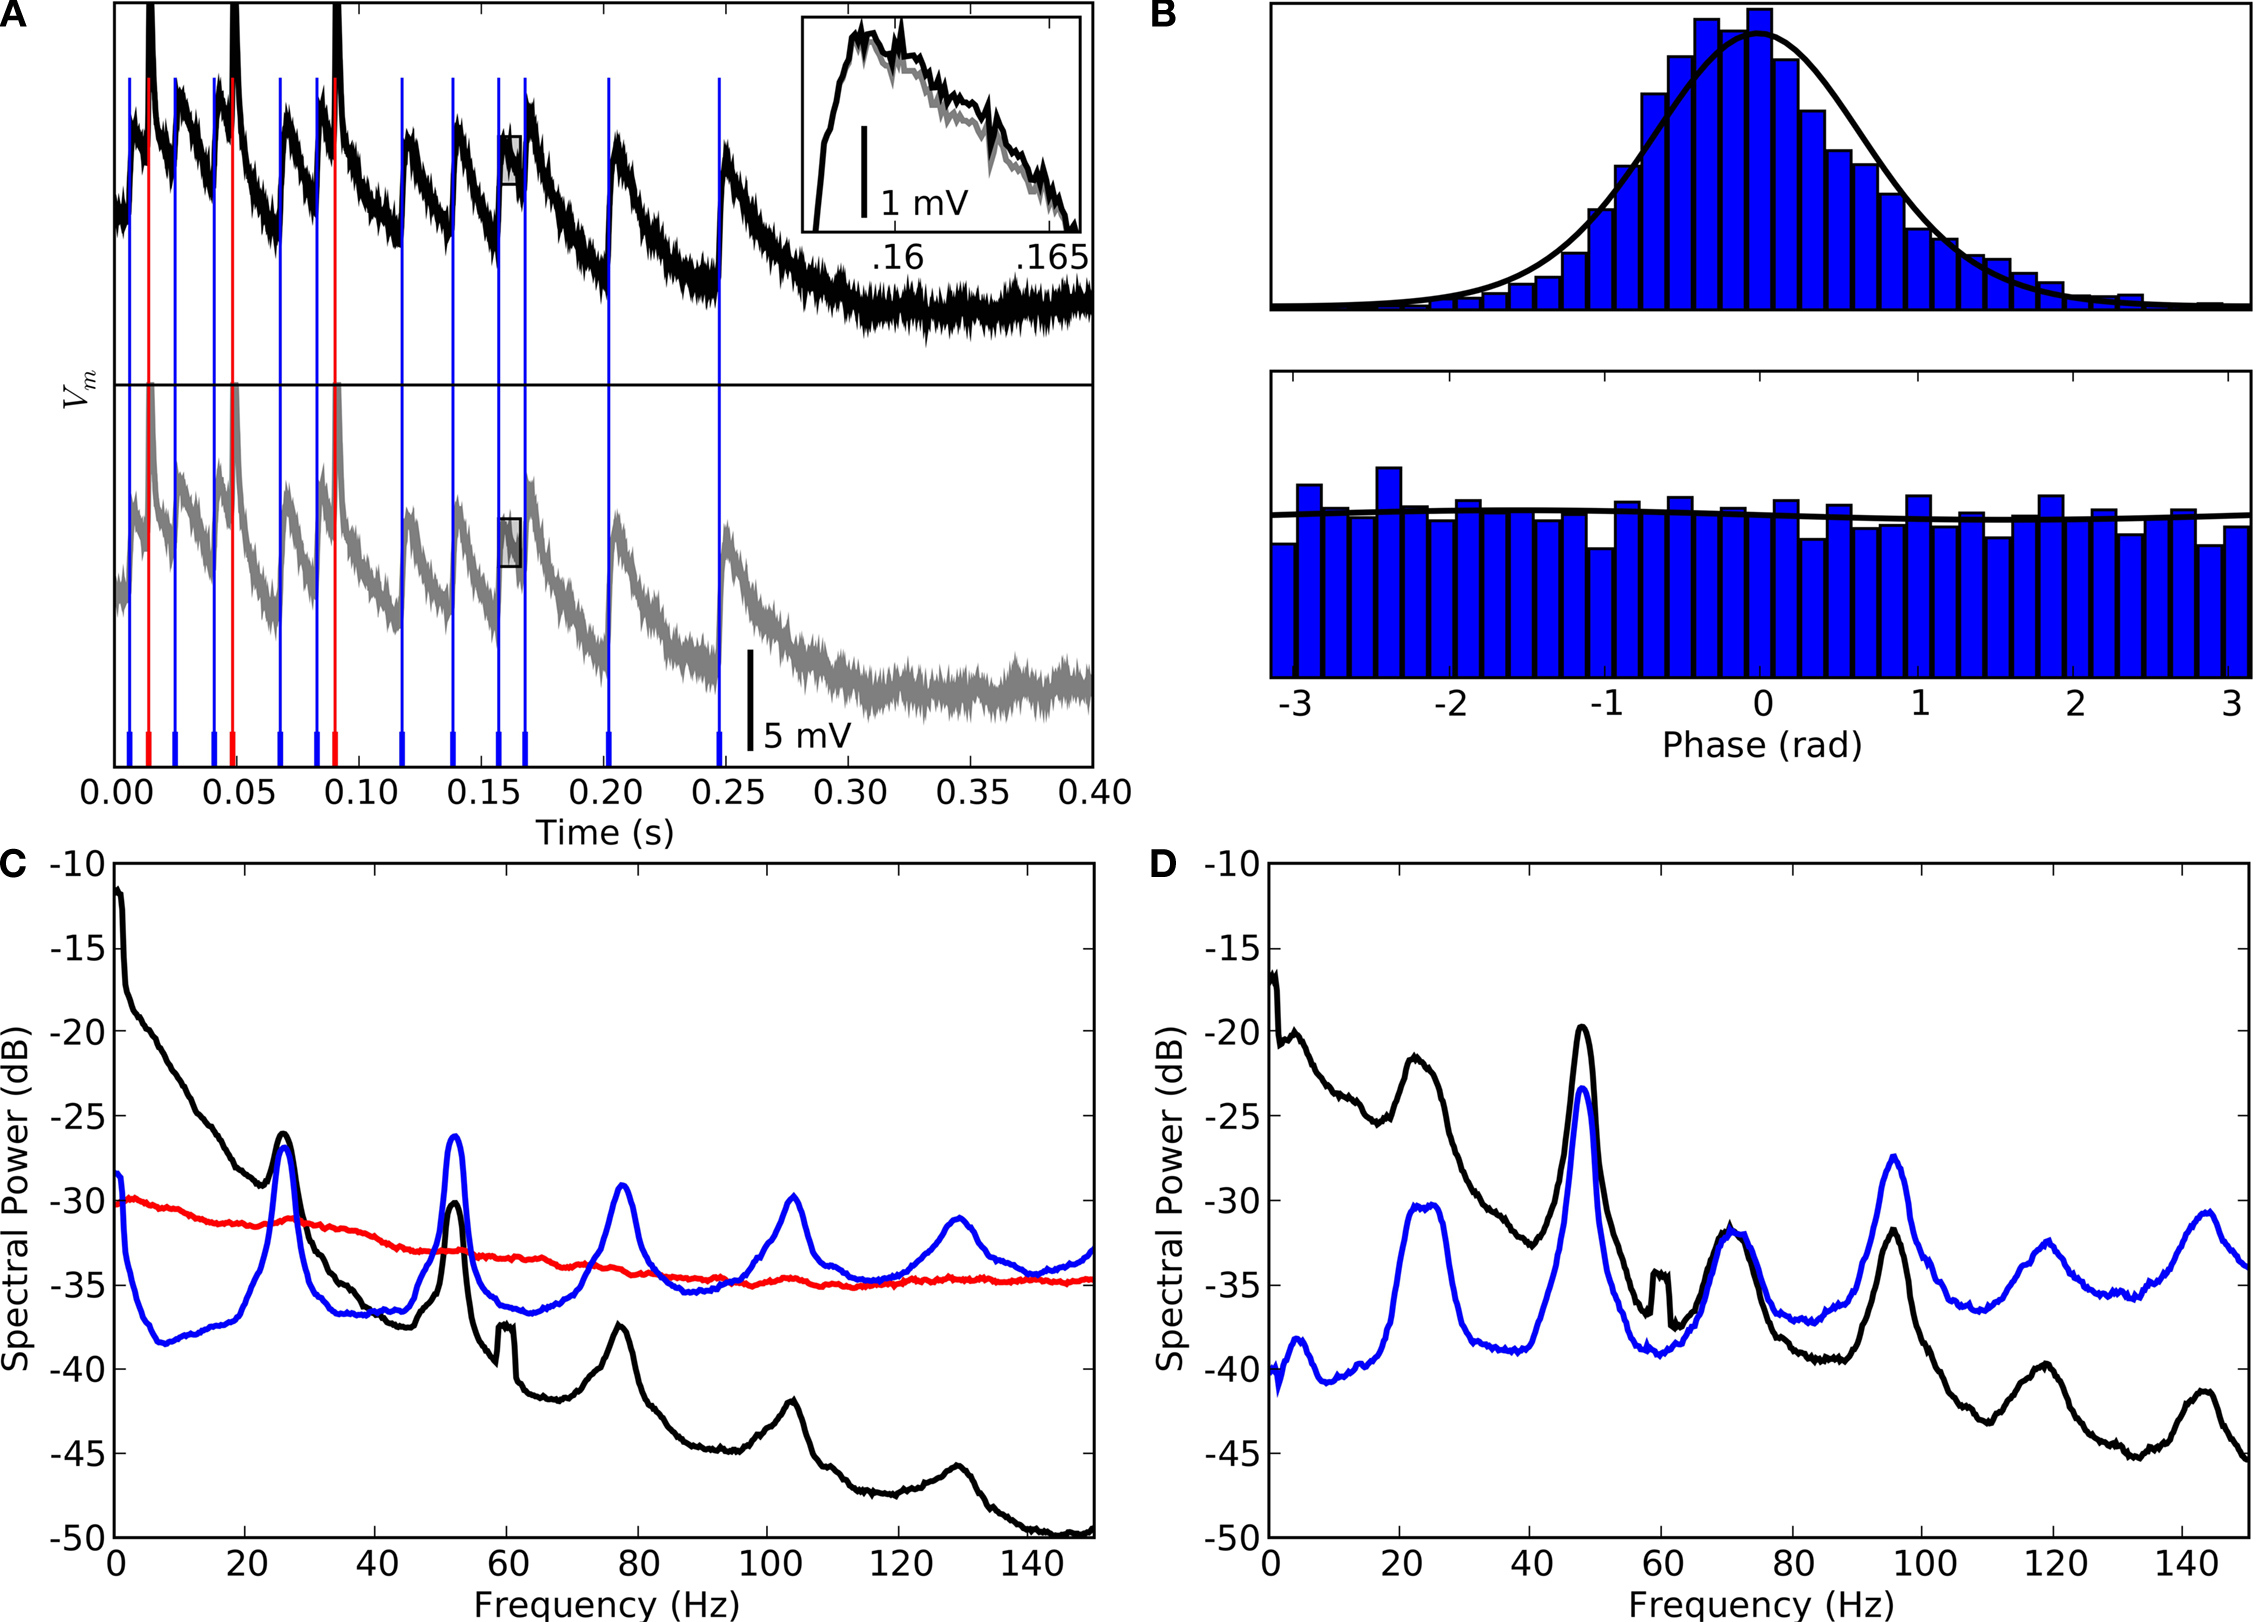
Figure 4. Controls for potential artifacts introduced by power line or the stimulus. (A) Example of a recording contaminated with artifacts from the power line before (bottom panel, gray trace) and after (top panel, black trace) removal of line noise (60 ± 0.1 Hz). The shapes of the EPSPs in both traces are very similar; vertical lines mark timings of spikes (red) and EPSPs (blue). The inset shows a single EPSP at higher magnification (marked by the rectangle in the main plot). (B) Phase distribution of EPSPs relative to band passed (51.5 ± 2 Hz) membrane potential (top) and to line noise (60 ± 0.1 Hz) (bottom). (C) Spectra of membrane potential (black), spikes (red) and EPSPs (blue) recorded during the presentation of a natural movie; the spectral peak is at 52 ± 2 Hz. (D) Spectra obtained from recordings of the same cell as in (A–C), but with the eyes occluded; the peak frequency is slightly lower, 48 ± 2 Hz than when the eyes were open.
A separate control compared the relative timing of neural events to the oscillations we measured vs. their timing relative to the power line. If the neural events, EPSPs and spikes, locked selectively to the biological rhythms, then the distribution of event times plotted against phase of the intrinsic oscillations should have a strong peak. By contrast, a similar plot of event times with respect to the line frequency should be flat. These are exactly the distributions we observed, see Figure 4
B.
Another way to examine the consequences of contamination by the line power is to compare the power spectra of the raw signal to those of the event trains. The contribution of line noise is visible as a narrow peak at 60 Hz but is absent from the spectra of the EPSP and spike trains, see Figure 4
C.
There is also a concern that the oscillations reflect phase locking to the refresh rate of video display or specific aspects of the stimulus. We reduced the risk of entrainment to the monitor by using rapid video refresh rates, above 140 Hz (Butts et al., 2007
; Williams et al., 2004
; Wollman and Palmer, 1995
). This tactic was successful, as shown by a comparison of recordings obtained during visual stimulation and those made when the eyes were occluded and the monitor switched off, see Figures 4
C,D. The spectra for the membrane potential (black) and EPSPs (blue) were similar; the cell fired too infrequently when the eye was closed to compute a spectrum for spikes. Further, the presence of oscillations was independent of the statistics of the stimuli we used. The oscillations persisted during recordings of response to noise patterns that had greater spectral power in high spatial and temporal frequency ranges than natural movies have (e.g., Ruderman and Bialek, 1994
).
Finally, to rule out the possibility that the oscillations were unique to our intracellular methods, we analyzed 20 extracellular recordings from retinothalamic axons in the optic tract obtained in a second laboratory. Gamma oscillations were present in recordings from this preparation, as depicted for one cell, see Figure 5
.
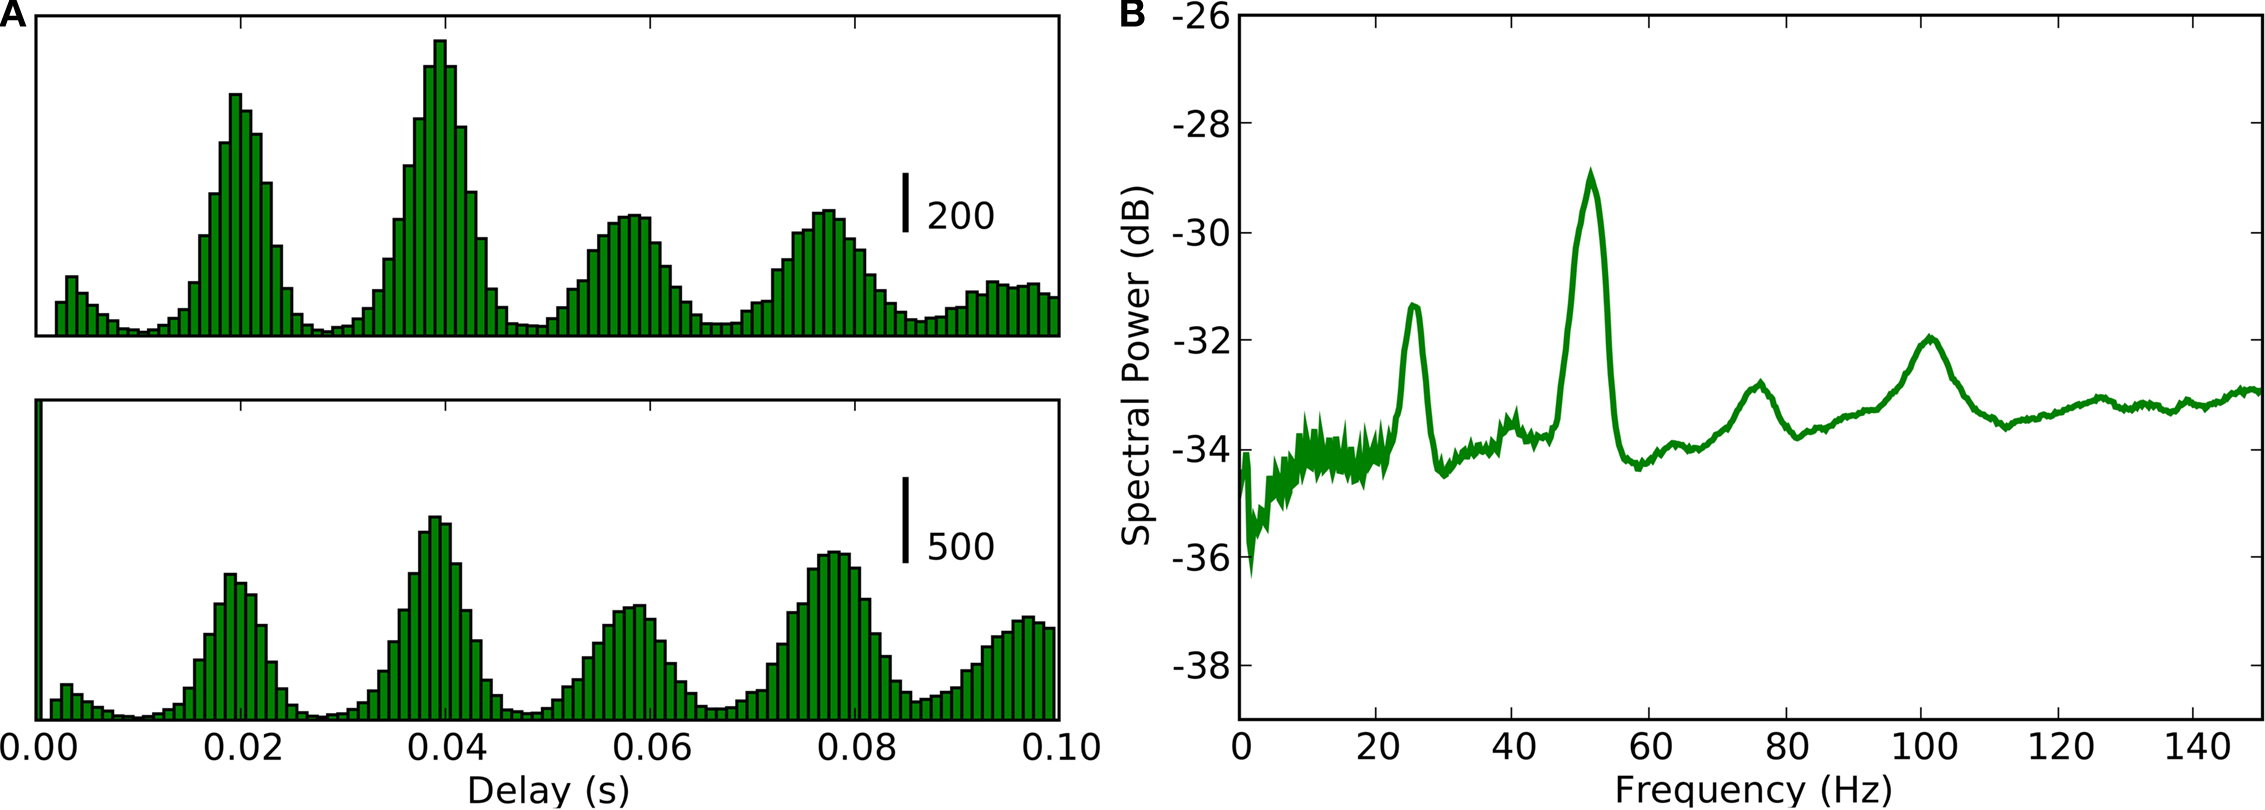
Figure 5. Periodicity in retinal spike timing. (A) Time-interval histogram (top) and autocorrelogram (bottom) for retinal spikes recorded extracellularly in the optic tract. (B) Power spectrum of spike timings obtained from the same cell as in (A), computed with the multi-taper method.
Range of Oscillation Strengths
Methods that quantify the extent to which oscillations influence a single neuron’s firing pattern should be able to measure weak as well as strong contributions. So far we have used simple measures that explore either the time domain (plots of inter-spike intervals and autocorrelations) or the frequency domain (power spectra). These measures provide a direct and intuitive means of displaying prominent oscillations. But the number and height of the peaks in plots of the inter-spike interval histograms or autocorrelograms lack the sensitivity to reveal weak oscillations. Further, power spectra often contain spurious peaks due to the refractoriness of the spiking process. Thus, Muresan et al. (2008)
used both the time and frequency domain to devise a new metric for the strength and frequency of oscillations. Their method computes an “oscillation score (OS)” by applying a Fourier transform on an autocorrelation that has been smoothed and whose central peak, including adjacent troughs caused by the refractory period, has been subtracted; this procedure removes confounds introduced by the refractory period.
We used the OS to examine the strength and frequency of oscillations in the gamma range for three datasets, the whole-cell recordings in current clamp we have discussed so far and two additional control groups. One control group comprised recordings made in voltage–rather than current-clamp mode (synaptic events are easier to detect in voltage clamp). The remaining control group was made of the extracellular recordings from the optic tract.
A scatter plot of OS against frequency showed a range of oscillation strengths from weak to strong, see Figure 6
A. We included all cells in the analysis that oscillated with a consistent frequency, σf < 4 Hz across trials (the OS was OS = 4.7 ± 1.9 for cells with inconsistent oscillations and the frequency could not be assessed and for cells that did not oscillate, see Section “Materials and Methods”). Surrounding pairs of histograms of inter-spike interval (top) and autocorrelation functions (bottom) correspond to lettered points in the scatter plot and allow comparison with raw data from which the scores were derived, Figures 6
B–F and Table 1
. Some cells oscillated so strongly (OSs > 15) that their inter-spike interval histograms were multi-modal, Figures 6
B–D and the last column of Table 1
.
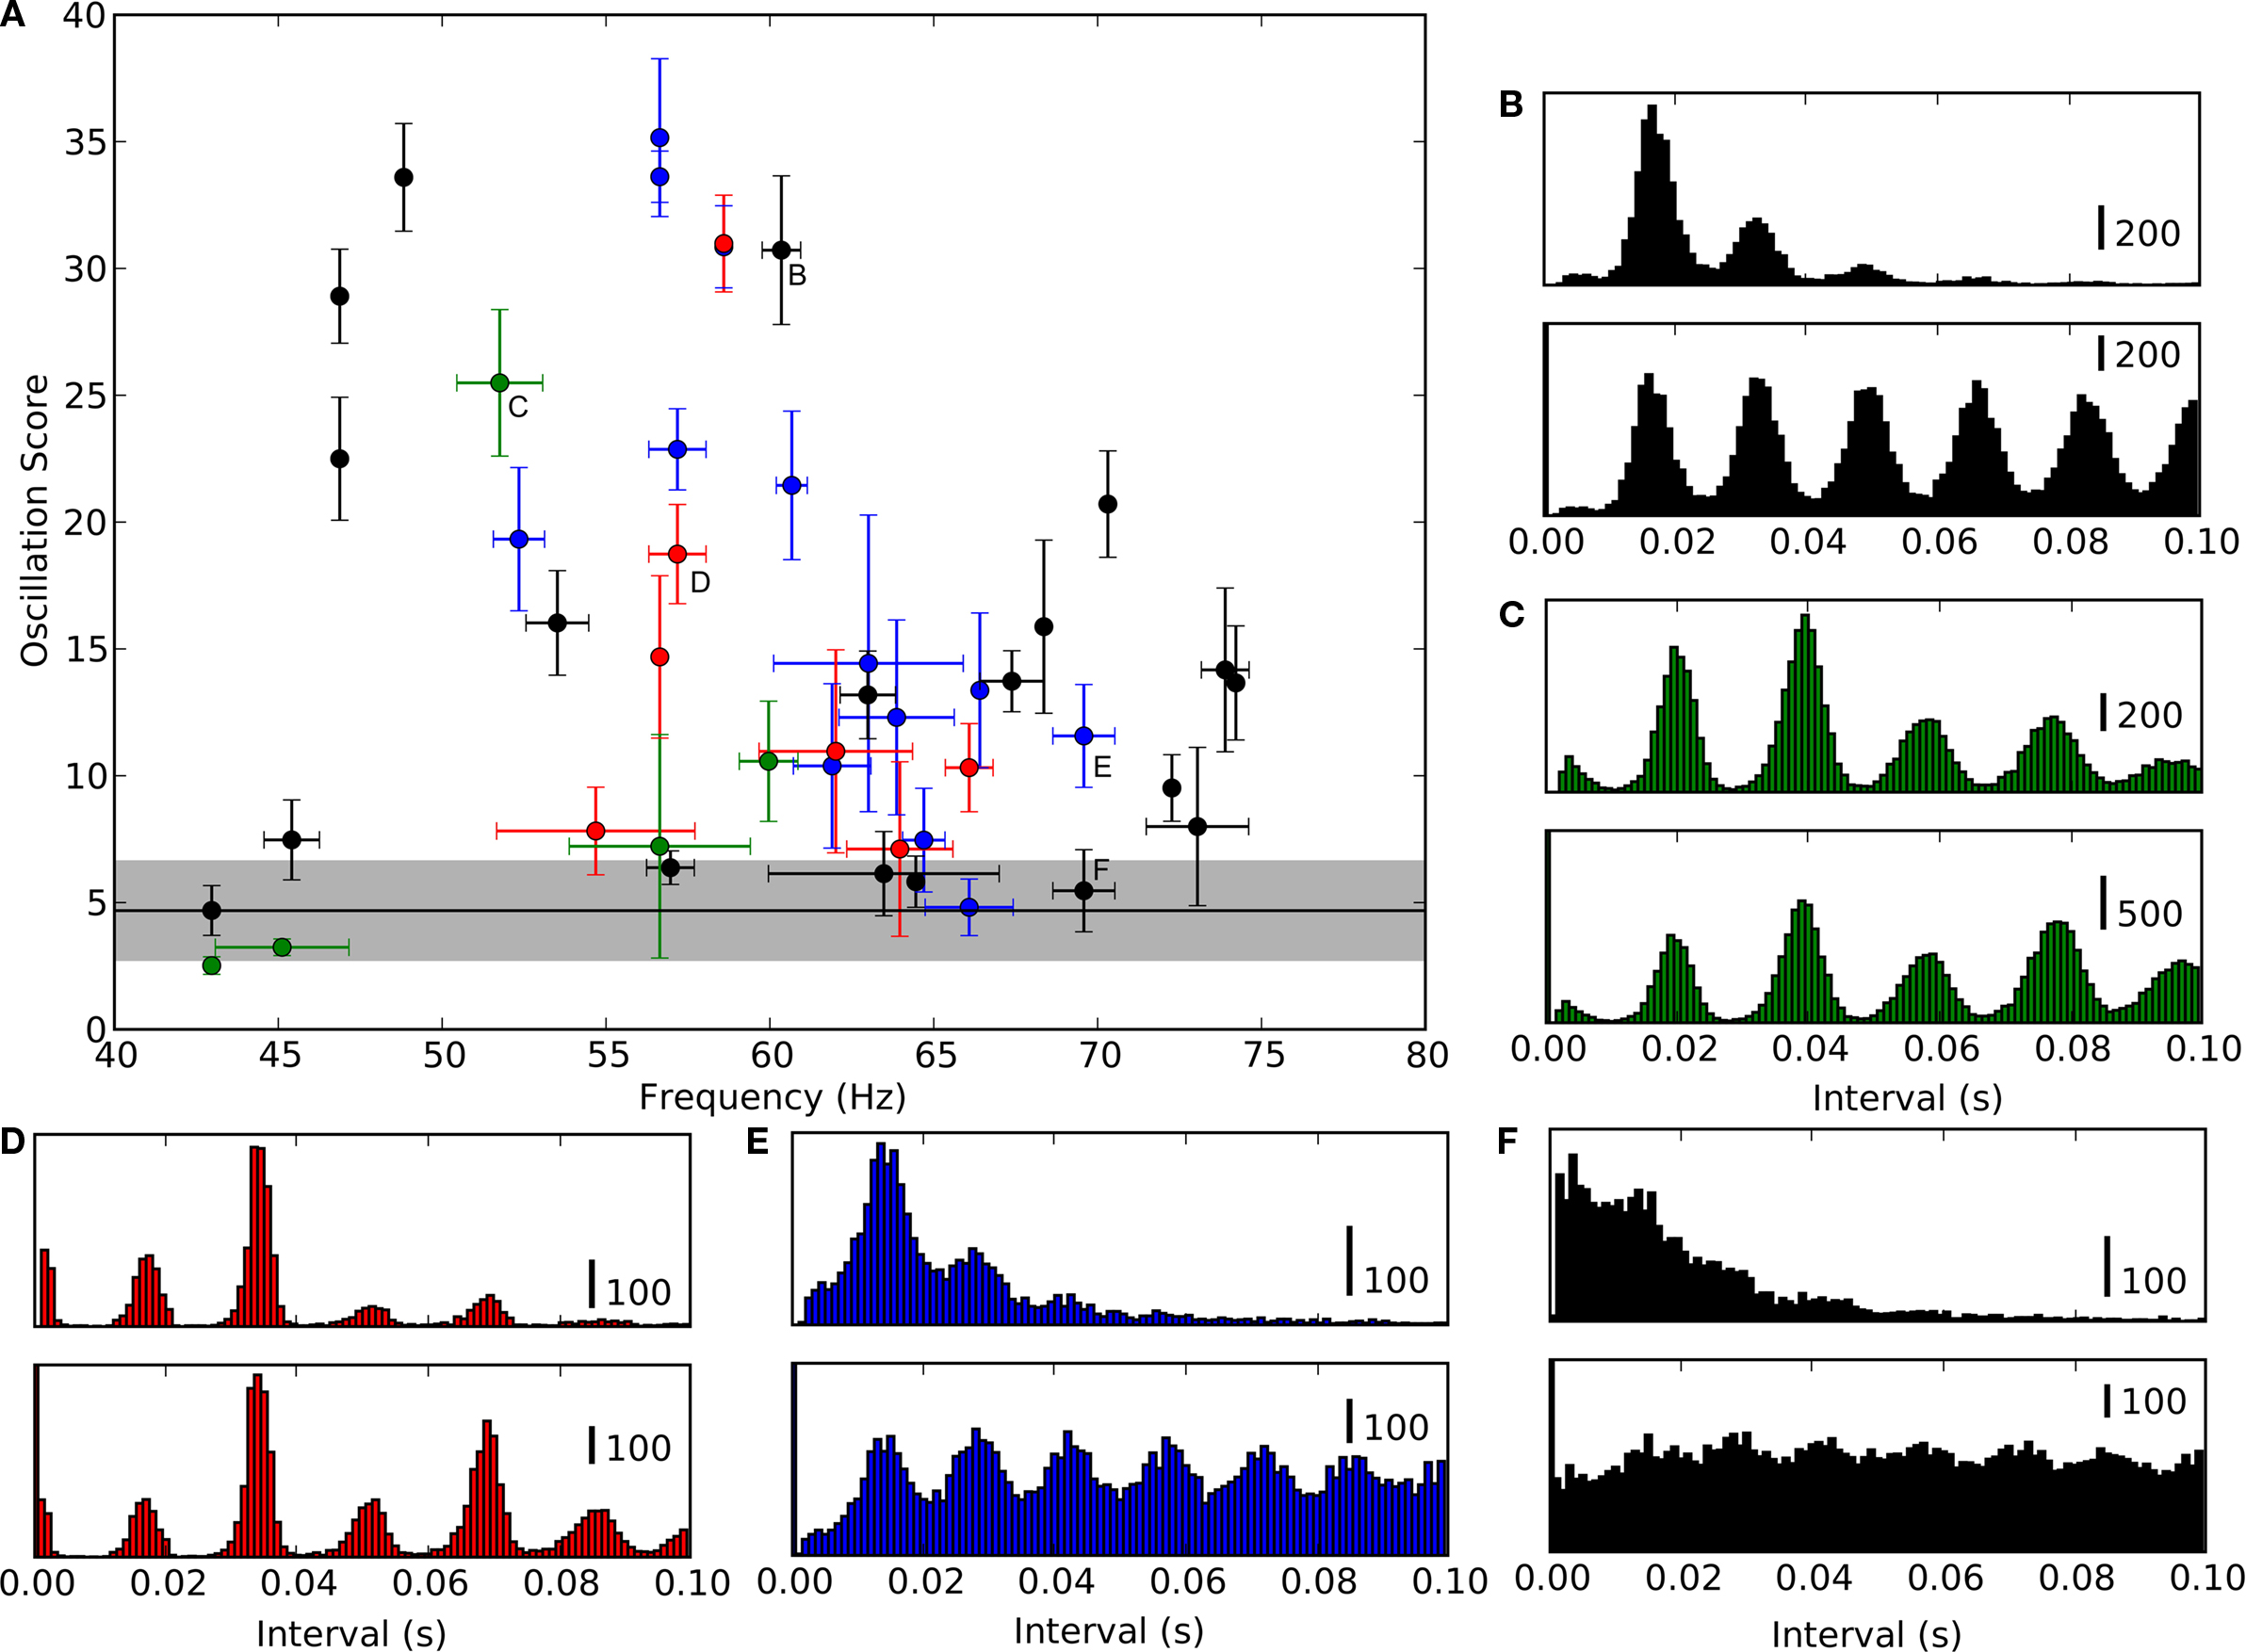
Figure 6. Range of oscillation strengths within the population. (A) The strength of oscillations for individual cells quantified by plotting oscillation score against oscillation frequency. Values for intracellularly recorded thalamic spikes are red, EPSPs, blue, EPSCs (recorded in voltage clamp), black, and extracellularly recorded retinal spikes, green. The shaded region shows the range of scores for cells that did not oscillate consistently (σf > 4, see Table 1 and main text). Lettered points refer to corresponding panels, (B–F), which show spike interval histograms (top) and autocorrelograms (bottom) for cells with different oscillation scores.
We usually recorded in voltage-clamp mode, but singled out cells with obvious oscillations for further analysis in current clamp. There is a modest discrepancy between the proportion of oscillating cells in the extracellular retinal and intracellular thalamic records. This difference might reflect differences in sampling bias, visual stimuli (natural movies for the intracellular experiments and m-sequences for the extracellular experiments), or anesthetic (thiopental, a barbiturate, for the extracellular experiments and, propofol, a new class of anesthetic), for the intracellular experiments; note, however, that oscillations have been observed in awake cats (Doty et al., 1964
; Heiss and Bornschein, 1965
, 1966
). It is also possible that this difference reflects a circuit property of the thalamus; relay cells often receive input from several ganglion cells (Hamos et al., 1985
; Usrey et al., 1999
). If only one of several inputs to a relay cell oscillated, we would have scored that relay cell as oscillatory even if its other retinal inputs fired aperiodically. There also was a larger percentage of oscillating EPSP than spike trains; this difference reflects the difficulty of computing an OS for cells with very low spike rates.
Analysis of Information Content
So far, we have shown that the temporal patterns of neural activity recorded during visual stimulation often include two constituents, one that is time-locked to the stimulus and another that reflects intrinsic oscillations. Although it is often held that only the stimulus-locked contribution encodes information, we wondered if intrinsic oscillations might also convey visual information to the cortex. We began our analyses by estimating the amount of information in the stimulus-locked aspect of the response. In other words, we estimated lower and upper bounds for the amount of information that could be transmitted by changes in event rate that recurred across repeated presentations of the same stimulus. In order to obtain each bound, it was necessary to use separate methods (Bialek et al., 1991
). To establish the upper bound, we decomposed the power spectrum of the spike trains into two components. One component represented the part of the response that was consistent across stimulus trials, typically equated with the signal (Figure 7
A, top, solid curve) and the other corresponded to the variation in response across trials, usually taken as noise (Figure 7
A, dotted curve). The information rate, calculated from the area under the solid curve in Figure 7
A, bottom, was 0.4 bit/spike. We established the lower bound by determining how well the visual stimulus could be reconstructed from the convolution of the cellular response with the receptive field (Figure 7
B, and see Section “Materials and Methods”). For this case, the signal is the reconstruction of the receptive field and the noise is the deviation of the reconstruction and the stimulus. The information rate calculated from this second method was 0.3 bit/spike, Figure 7
B, bottom. The values for upper and lower bounds are similar to those reported previously (Eckhorn and Popel, 1975
; Liu et al., 2001
; Reinagel and Reid, 2000
).
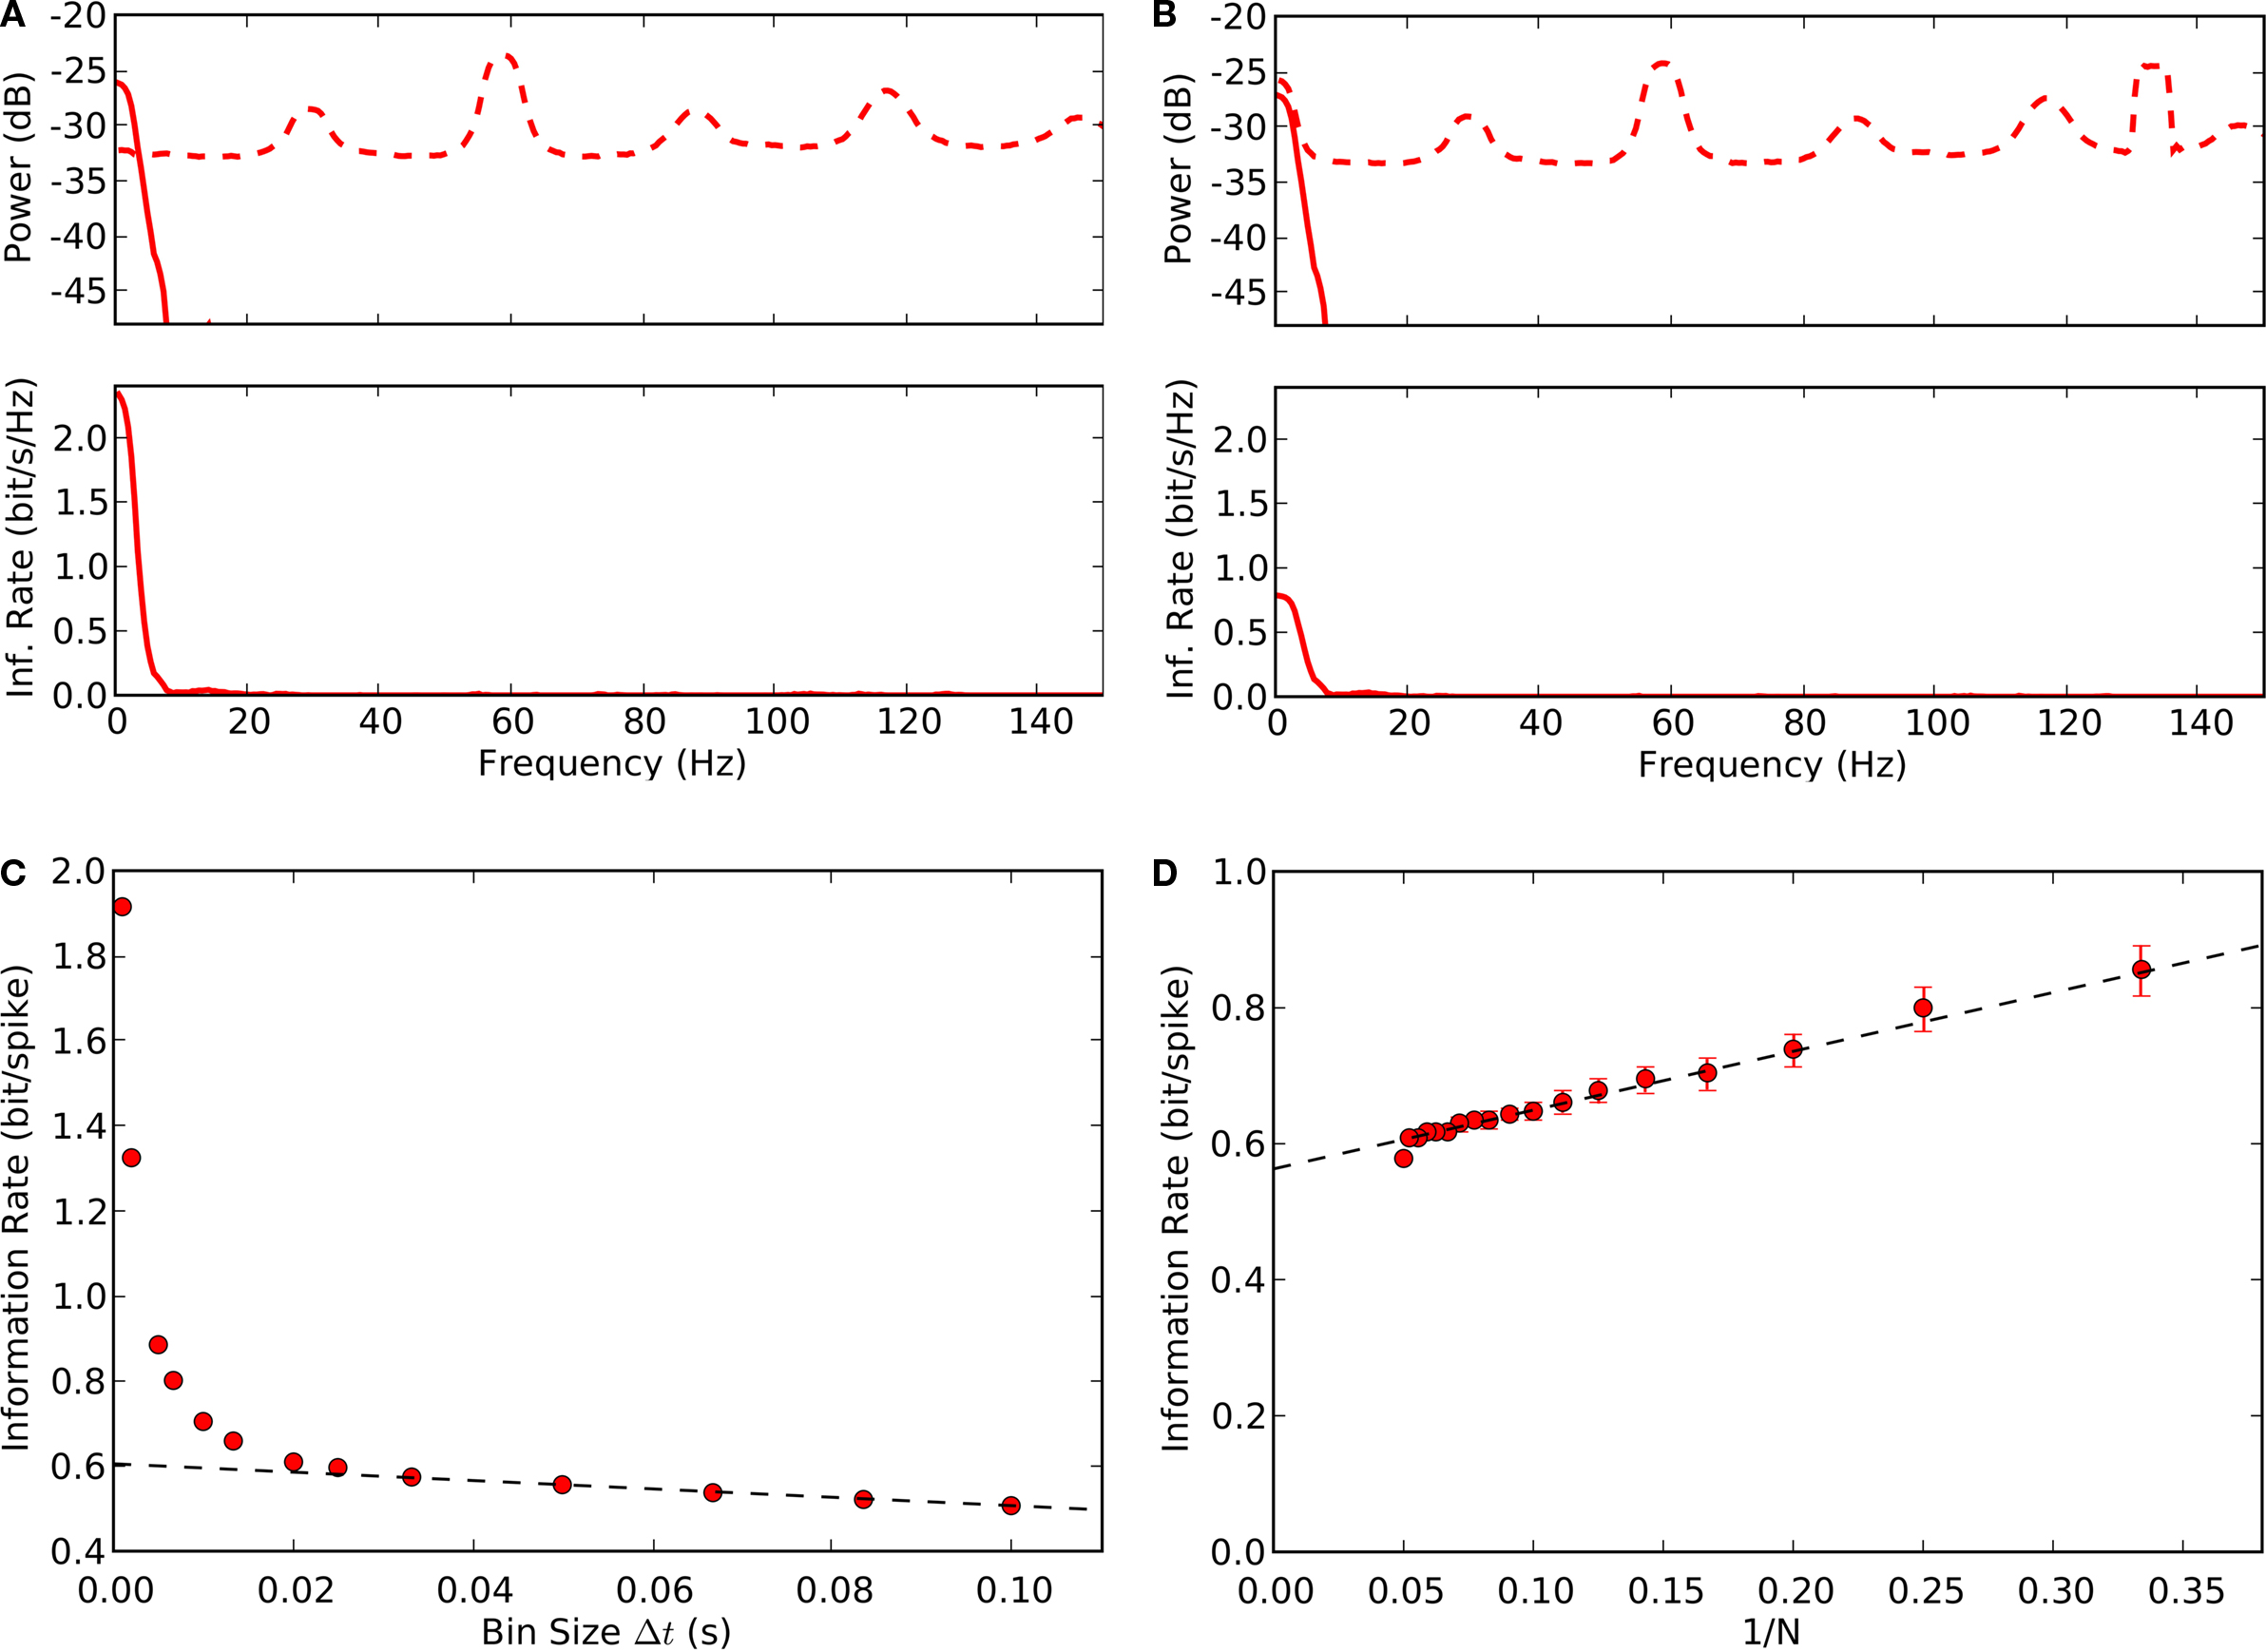
Figure 7. Estimates of information rates for thalamic spikes. (A) Top, power spectrum of thalamic spike train is decomposed into signal (solid line) and noise (dashed line). Bottom, upper bound for spectral information rate, taken from the area under the curve, is 8.3 bit/s; the mean spike rate 19 spikes/s, yields a value of 0.4 bit/spike. (B) Top, power spectrum of thalamic spike train is decomposed into signal (solid line) and noise (dashed line). Bottom, the lower bound for spectral information rate, calculated using the stimulus reconstruction method is 5.7 bit/s, or 0.3 bit/spike. (C) Information per spike as a function of bin width Δt; linear extrapolation (Δt → 0) yields an information rate of 0.58 bit/spike. (D) Direct information estimate as a function of number of trials N; linear extrapolation (Δt, 1/N → 0) yields 0.56 bit/spike.
The information rates estimated above were made with the widely used entropy methods for a Gaussian information channel, which assumes that signal and noise are Gaussian (Borst and Theunissen, 1999
). We also estimated information rates using the direct method for single spike information (Brenner et al., 2000
), which is valid for arbitrary distributions but assumes that single spikes encode information independently (Figures 7
C,D). The direct method requires so much data, however, to generate estimates at fine times scales that it is common to obtain such estimates by extrapolating from values obtained at coarser time scales (wider bins, Figure 7
C). The estimates obtained using the entropy method, 0.4 bit/s and the direct method, 0.58 bit/s were very close. The similarity of these two values, each obtained with a different but complementary method, suggests that they reflect the true information rate.
The results plotted in Figure 7
illustrate an important aspect of how relay cells use stimulus-locked rate coding to encode visual signals. The information about temporal changes in the stimulus peaked at low frequency and dropped sharply at a cut-off frequency below 30 Hz (Figures 7
A,B). The shape of this distribution reflects not only the intrinsic properties of thalamic circuits but also the statistics of natural images, which are skewed to low spatial and temporal frequencies (Ruderman and Bialek, 1994
). This finding is consistent with previous studies that used natural scenes (Dan et al., 1996
) rather than flickering, full-field stimuli (Liu et al., 2001
; Reinagel and Reid, 2000
).
The prominence of the oscillations in the noise motivated us to ask if it might actually encode information hidden from conventional analyses. Answering this question required that we measure the degree to which the oscillations contributed to the variance of the stimulus-locked response. Thus, it was necessary to generate a reference signal for retinal oscillations. To achieve the best possible separation of the retinal input from other components of the intracellular signal such as intrinsic conductances and synaptic inhibition, we selected the onsets of the EPSPs we had previously clustered (see Figure 1
). Subsequently, we estimated the instantaneous phase of the retinal oscillations as the complex angle of the analytical signal calculated by convolving a Morlet wavelet (Figure 8
A, top, inset) with the EPSP train (blue ticks in Figure 8
A), see Section “Materials and Methods”. We then used the resulting waveform (blue ripple, Figure 8
A, bottom) to determine the phases at which the relay cell spiked (red ticks, Figure 8
A, bottom).
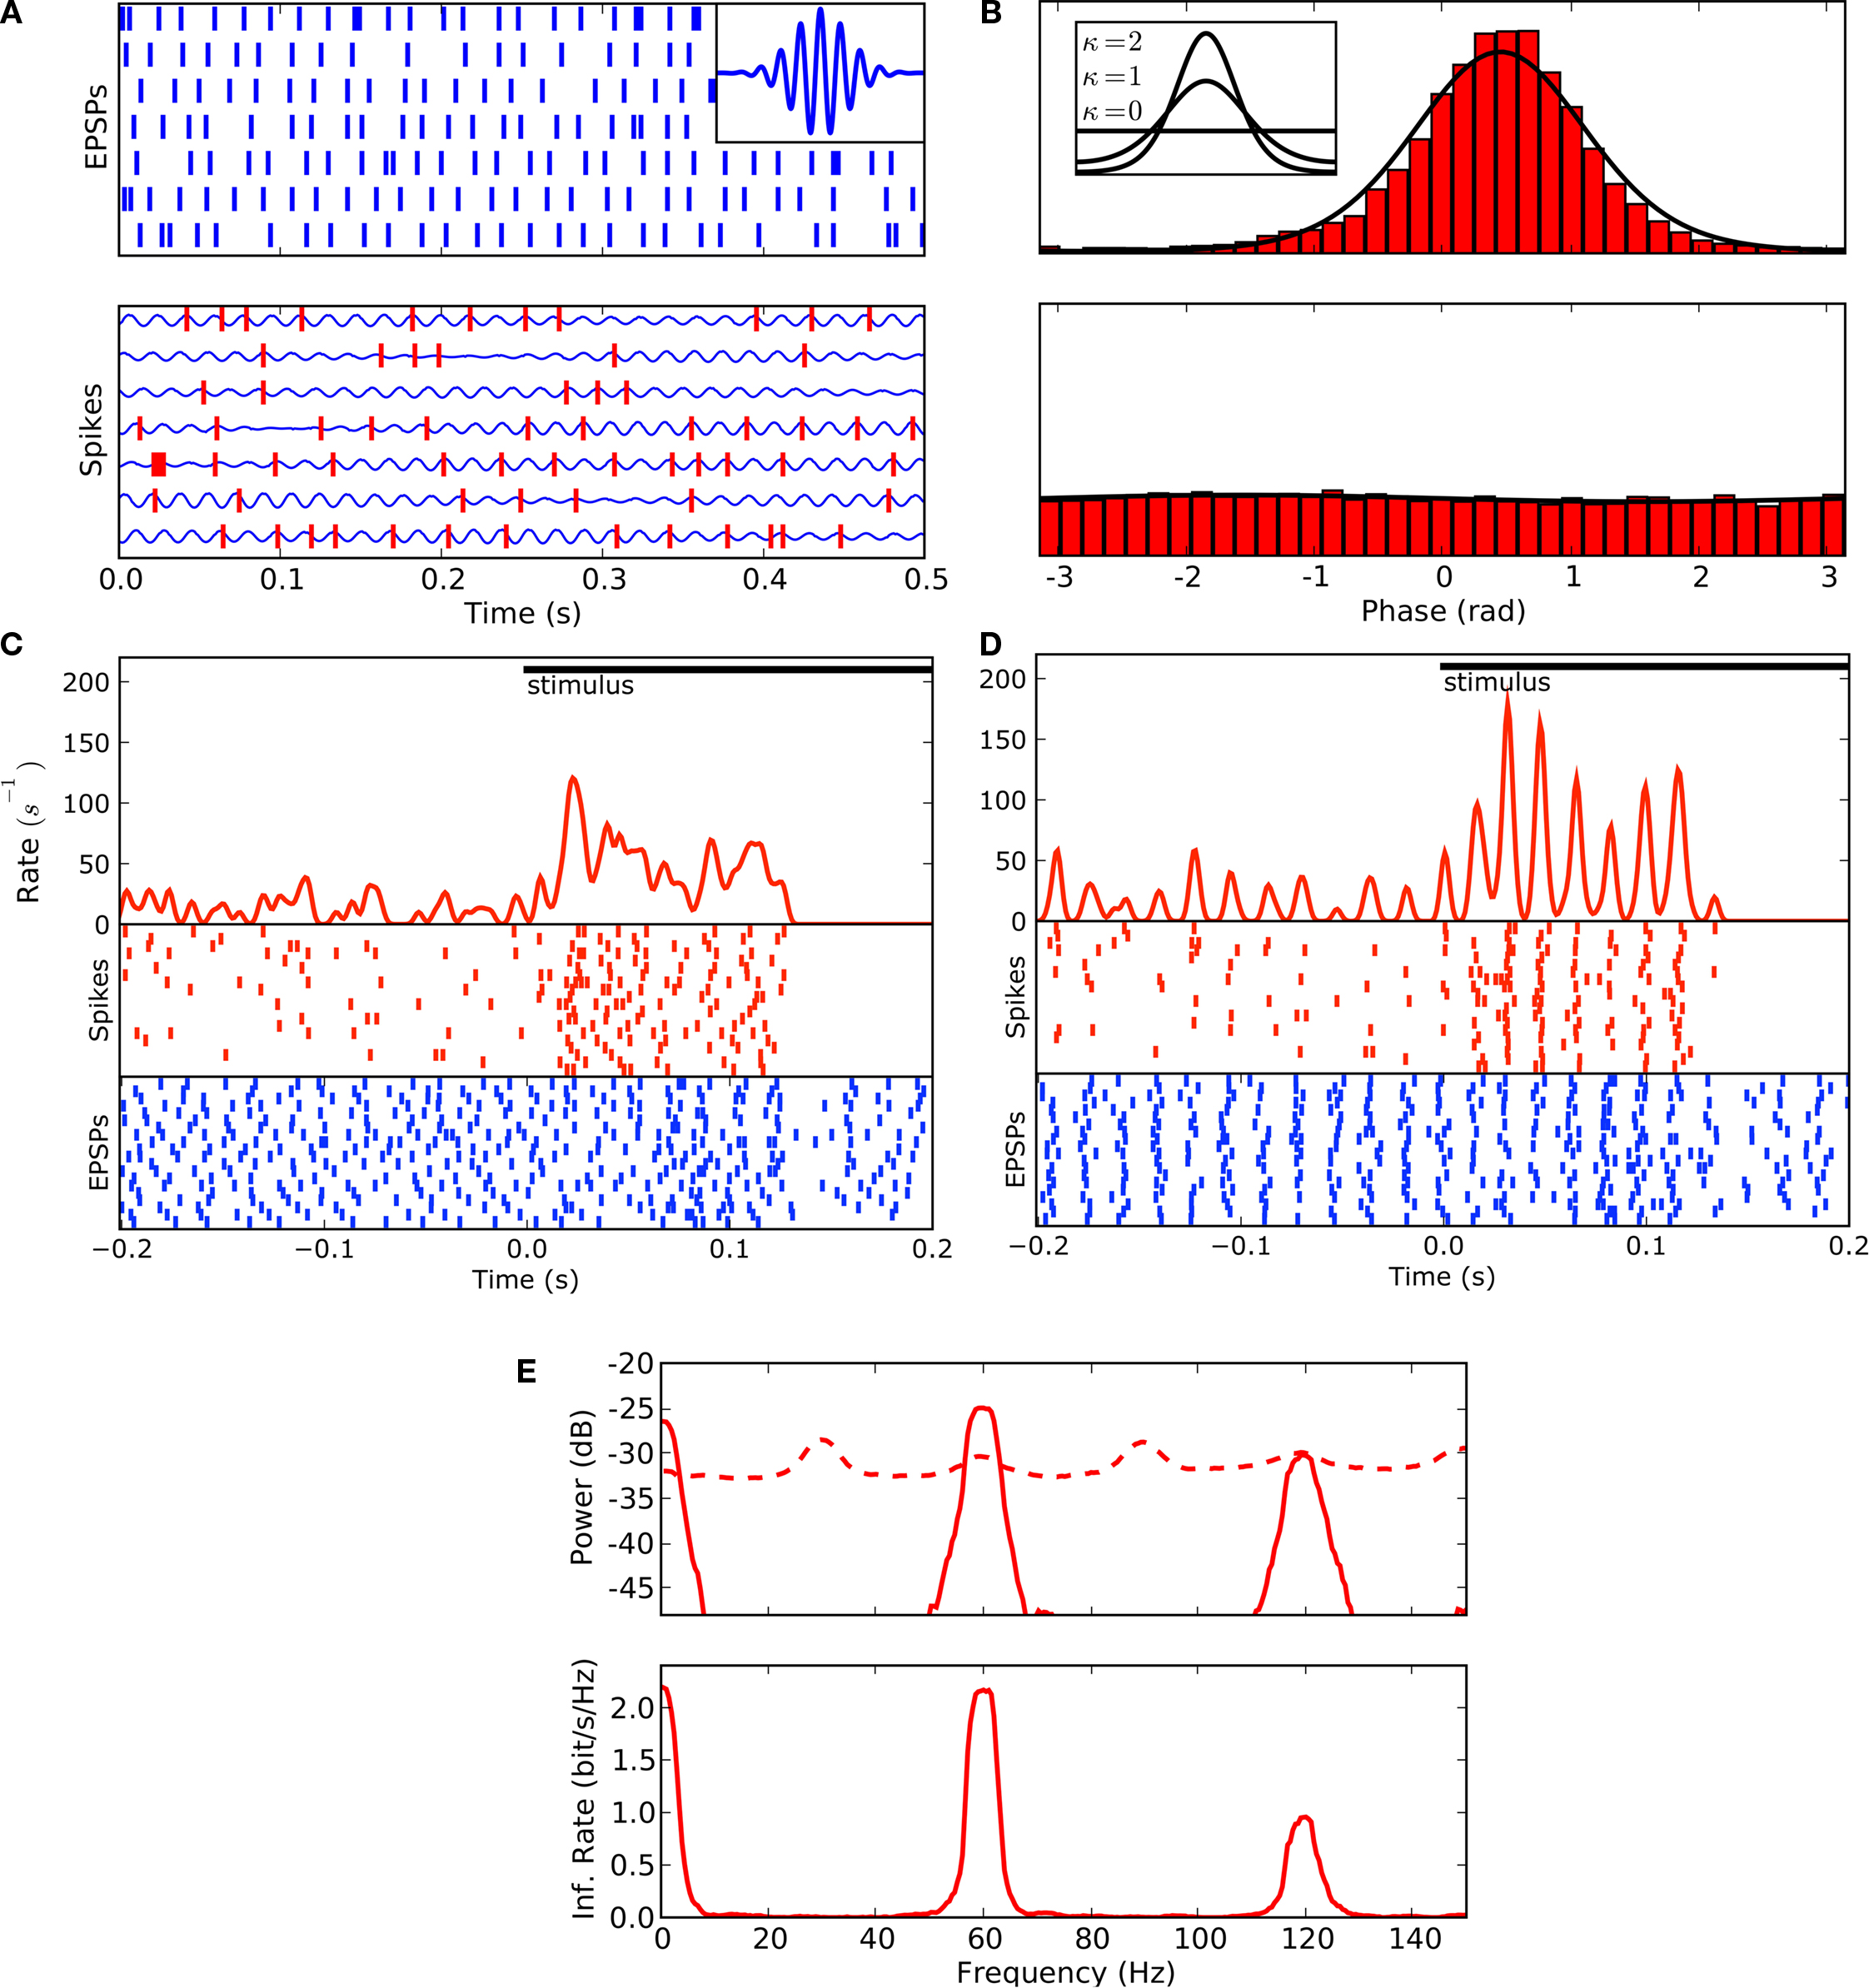
Figure 8. Adjusting response latency according to the phase of ongoing oscillations reduces temporal jitter in spike timings across trials. (A) EPSP trains (top, blue) and spikes (bottom, red) for seven trials, analytical signal (bottom, blue curve) computed by filtering EPSP trains obtained from single trials with a Morlet wavelet (inset). (B) Histogram of spike phases (top) and shift predictor (bottom) for an oscillation frequency of 59 Hz. (C) Event times aligned to stimulus onset displayed as averaged spike rate (red curve) and rasters for spikes (red) and EPSPs (blue) for 20 trials of a movie clip; spike rasters were smoothed with Gaussian window (σ = 2 ms) before averaging. (D) Responses after aligning the phase of ongoing oscillations that preceded the stimulus onset (global shift of individual trials up to ±10 ms). (E) Power spectrum (top) of de-jittered spike train of the cell decomposed into signal (solid line) and noise (dashed line); spectral information rate (bottom). De-jittering increased the total information from 0.3 to 0.4 bit/spike (Figures 7
A,B) to 1.6 bit/spike.
This analysis showed that the phase locking between retina and thalamus was strong, as illustrated by the tall peak in the phase histogram plotted in Figure 8
B, top. There was no evidence, however, that each new trial of the stimulus set the absolute phase of the neural response; when we used the estimated phase for inputs in one trial to determine the phase of spikes in the next, the resulting distribution (the shift predictor) was flat (Figure 8
B, bottom).
We further quantified the degree to which the thalamic spikes locked to the retinal inputs by means of a concentration parameter κ of a von Mises distribution that we fitted to each phase histogram (see Figure 8
B, Section “Materials and Methods”). The concentration parameter is zero for a flat phase distribution and increases with increasing degree of phase locking between retinal input and thalamic output. Thus fits with the tallest peaks indicate the highest degree of phase locking and the most reliable transmission of retinal oscillations (Figure 8
B, inset). The value for this cell was 2.3 and the range for all cells was 0–3.1.
Next we used our method of estimating the phases of the retinal oscillations to align the phases of EPSPs over different trials. This allowed us to explore how the random phases of oscillations across trials might have introduced jitter and hence decreased precision in the stimulus-locked response. To align the phase of the responses across trials, we measured the local phase of ongoing activity recorded just before each repeat of the stimulus and adjusted that phase to match the mean phase (see Section “Materials and Methods”). The alignment to the instantaneous phase reduced the jitter in the cross-trial latencies to a striking extent. Remarkably, what had seemed to be randomly distributed events in the actual recordings (Figure 8
C) assumed temporally precise patterns in the de-jittered traces (Figure 8
D). Much of the variation across trials that had seemed like random jitter had come from periodic activity. To address directly the question of whether the oscillatory activity in the gamma band could be used to transmit visual information, we aligned the phases of the EPSPs within the complete dataset. Rather than realigning phases at the start of each trial, as above, we made an alignment each time the local phase of the response deviated markedly from the reference (see Section “Materials and Methods”). The power spectrum of the de-jittered records, decomposed into signal and noise, is plotted in Figure 8
E, top. Afterwards, we analyzed the de-jittered dataset by using information theory just as we had done for the raw recordings. The de-jittering exposed additional bands near 60 and 120 Hz that had high signal-to-noise ratios, Figure 8
E, bottom, but left the low frequency, 30 Hz, band used for stimulus-locked coding intact. When the additional bands were taken into account, the upper bound on the rate of information available from the spike train quadrupled; it grew from 0.4 to 1.6 bit/spike. This gain in information is possible because the band carrying stimulus-locked information is separate from the bands that carry the oscillation-based information. If the spectra of the extrinsic and intrinsic patterns of activity had overlapped, then the oscillations would have interfered with the information transmitted by the thalamic spike train.
Across the population, the amount of information available in the second channel depended on the strength of the retinal oscillations. There was pronounced phase locking of retinal inputs to a wide range of gamma oscillations, as shown in a plot of concentration parameter against frequency (Figure 9
A). The gain in information after de-jittering was large for cells with strong oscillations and commensurately smaller for cells with weaker oscillations, red points in Figure 9
B. Here, as for Figures 7
A and 8
E, we estimated the information using the entropy method for the Gaussian information channel. We chose this method because temporal realignments of the spikes were so small, <20 ms, that the amount of data required for the more general direct method (see Section “Materials and Methods”) was unfeasibly large (see Figure 7
C). The red curve is a prediction of information gain as a function of the concentration parameter; it was generated with a computational model we describe below and calculated with the direct method. Figure 9
C explores the relationship between OSs for EPSPs vs. the spikes they evoke. Most points fall on or below the line of unity slope; as mentioned earlier, the relatively reduced scores for the spikes reflect limitations in the OS measure for low spikes rates in our recordings. Last, we obtained voltage-clamp recordings from many cells; the OSs calculated for the EPSCs in these data are similar to those obtained from recordings made in current clamp (Figure 9
D).
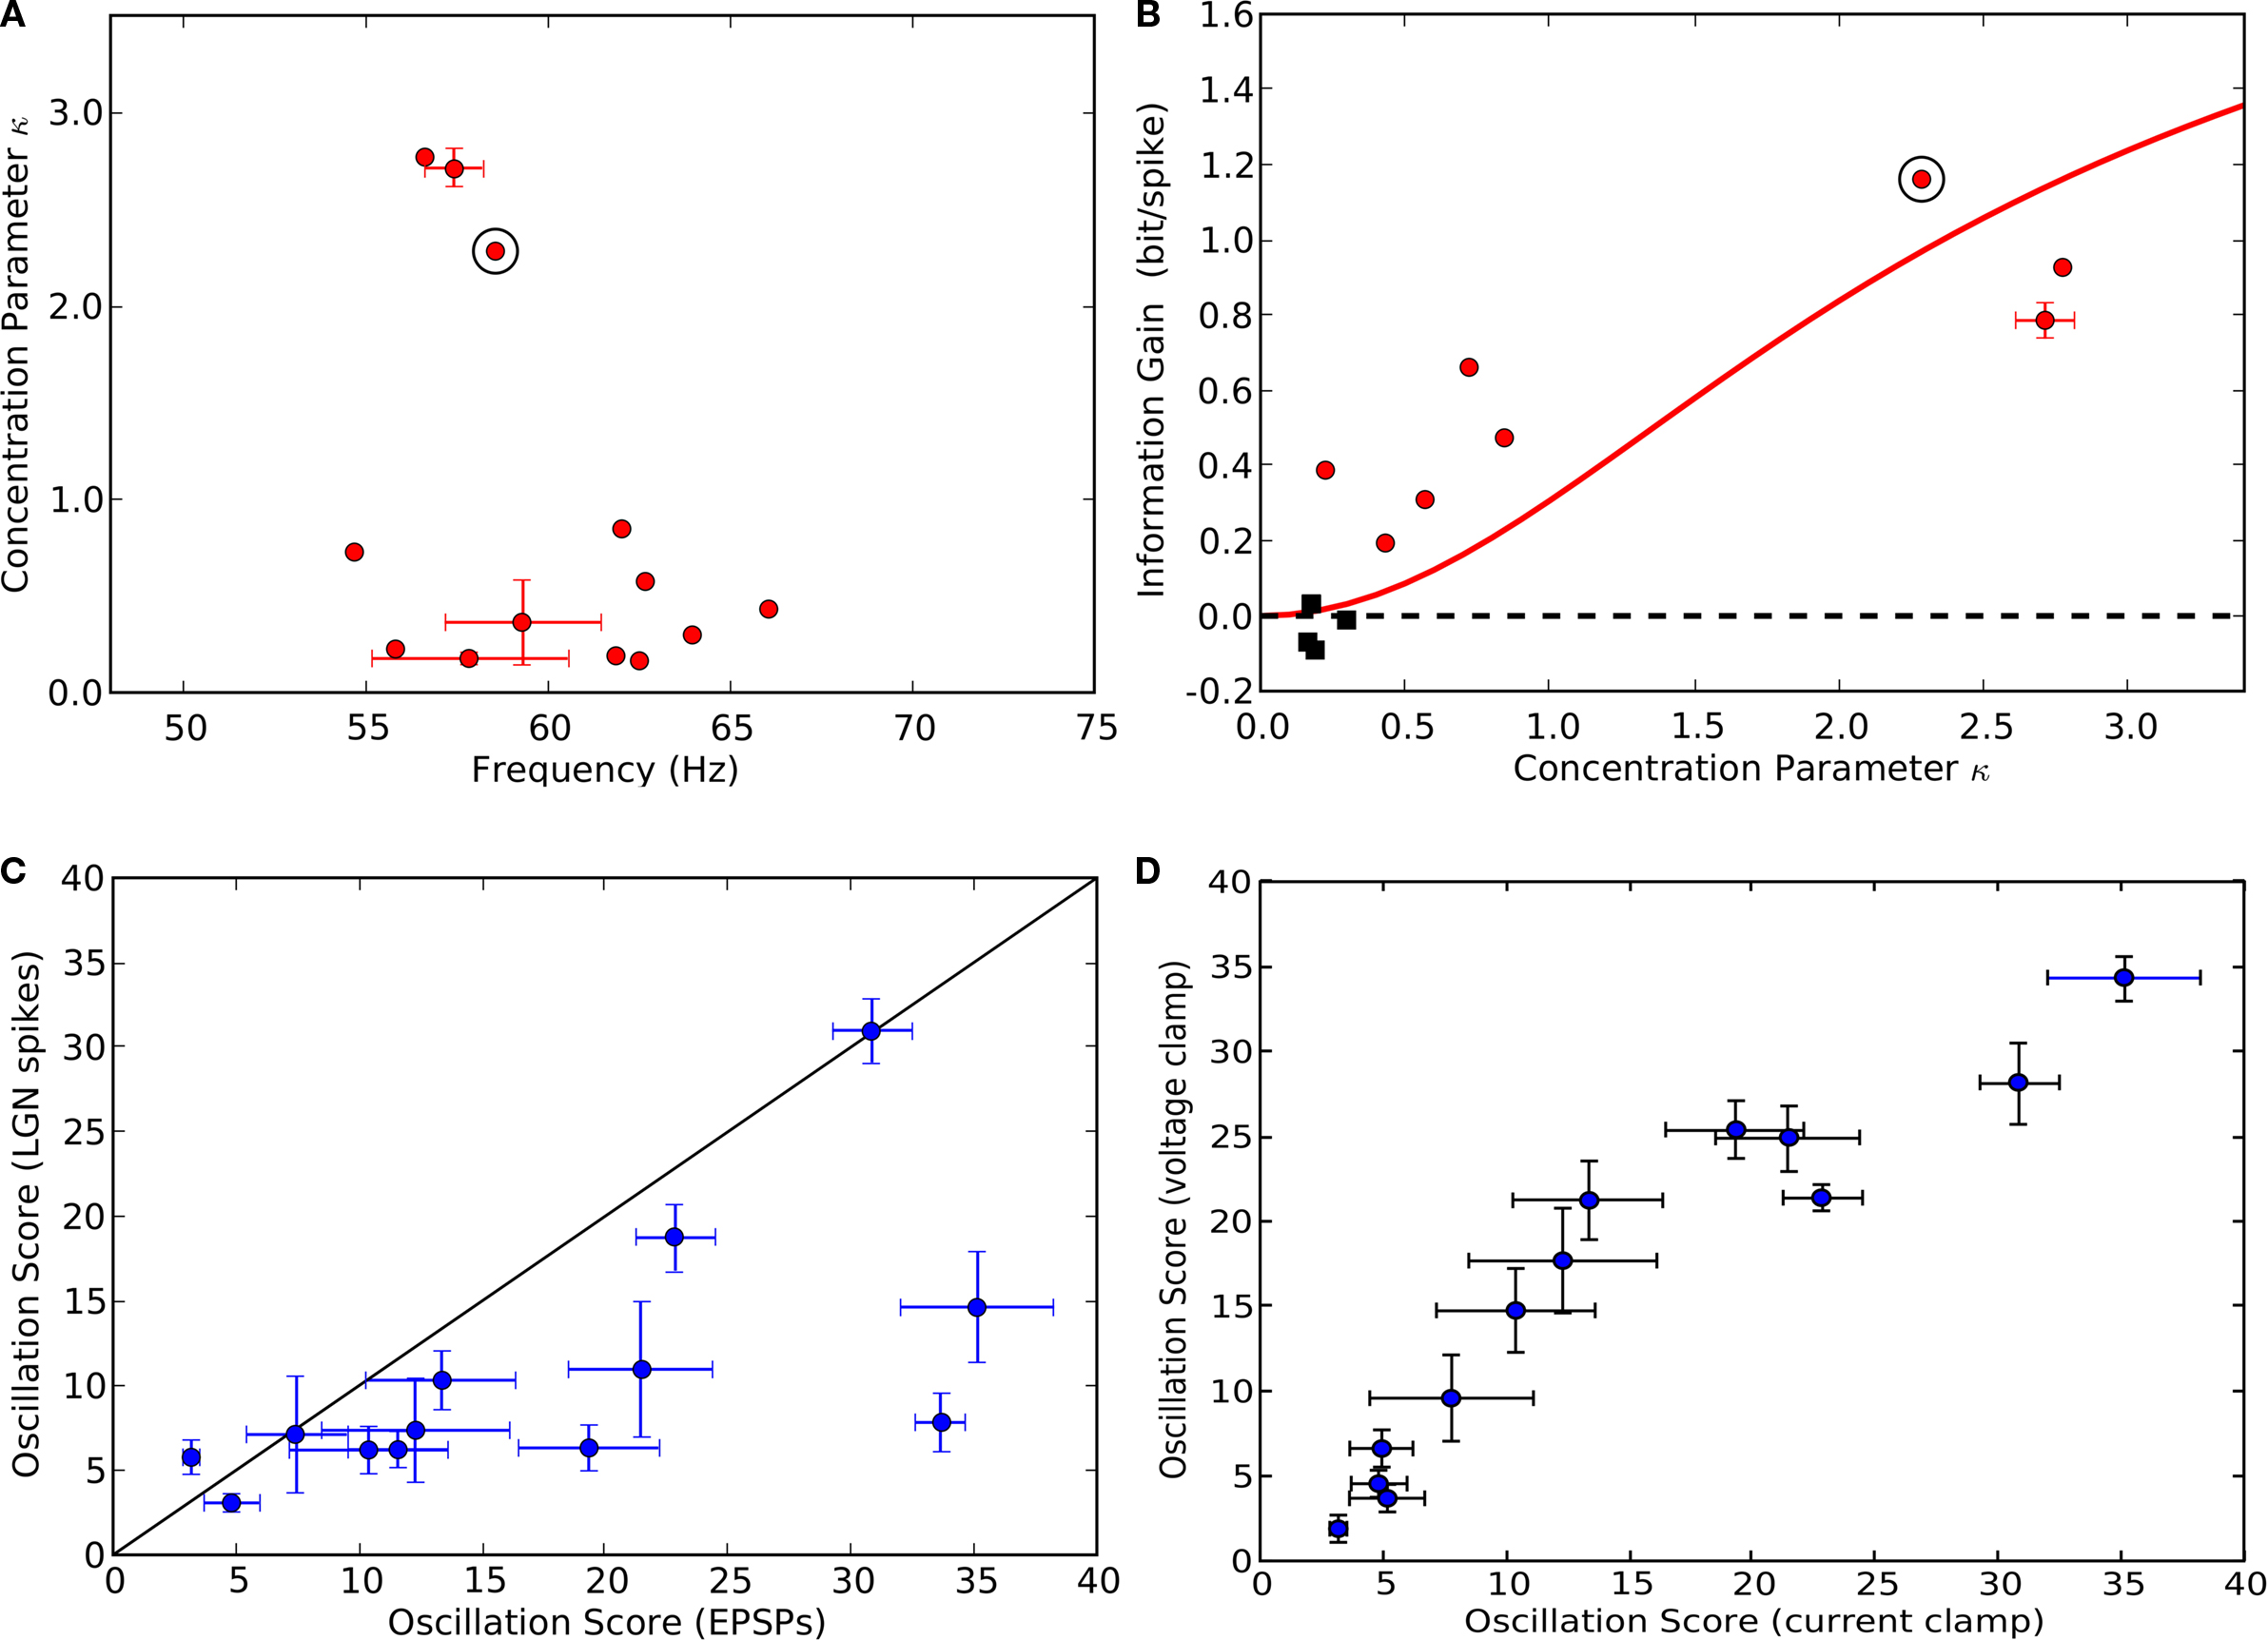
Figure 9. Population results for phase locking, information gain and oscillation score. (A) Phase locking of thalamic spikes for all (13/20) cells that had oscillating EPSP trains (see Table 1
). Error bars indicate standard deviation for cases in which multiple movies were presented; circled point indicates the cell analyzed in Figures 2
, 3
, 7 and 8
. (B) Gain in information rate after de-jittering plotted against concentration parameter κ; conventions as in (A). For 8 of 20 cells (red points), the information increased significantly (p < 0.05, computed using permutation test) after de-jittering of the spike train (see A). Red curve depicts gain in transmitted information predicted by our model (Figure 10
) for variable κ. (C) Oscillation scores of thalamic spikes plotted against oscillation scores of retinal inputs (EPSPs). (D) Oscillation scores for retinal inputs recorded in voltage clamp (EPSCs) plotted against the scores for retinal inputs (EPSPs) recorded in the current clamp.
Modeling the Multiplexed Channels
Thus far, our analyses suggest that many thalamic relay cells convey information about natural stimuli via spike trains that are multiplexed between two channels that operate on different time scales. One channel encodes information by modulations in spike rate determined by changes in the stimulus and uses the frequency band below 30 Hz. A second channel utilizes spike timing to convey information about ongoing retinal activity. This channel uses higher, gamma band, frequencies. In order to understand how this dual mode of transmission might be formed, we built a simple model, the QPG model (Figure 10
A, see Section “Materials and Methods” and Koepsell and Sommer, 2008
). Thalamic spikes were generated by an inhomogeneous gamma process whose rate was determined by a combination of two signals, one that corresponded to visual input filtered by the receptive field and another that represented retinal oscillations. The signals were combined by multiplication to reproduce the amplitude modulation seen in event rates of the de-jittered recording (i.e., Figure 8
D). Although our model had only four free parameters, the order of the gamma process, the concentration parameter, the oscillation frequency and the bandwidth, it was able to reproduce the key aspects of the results. These features include inter-spike intervals (compare Figure 10
B with Figures 3
A,B) and phase locking (compare Figure 10
C with Figure 8
B) and the power spectra and information content of the raw (compare Figure 7 and Figures 11
A,C) de-jittered and spike trains (compare Figure 8
E with Figure 11
B). The simplicity of our model suggests that complicated mechanisms are not required to generate the multiplexed channels.
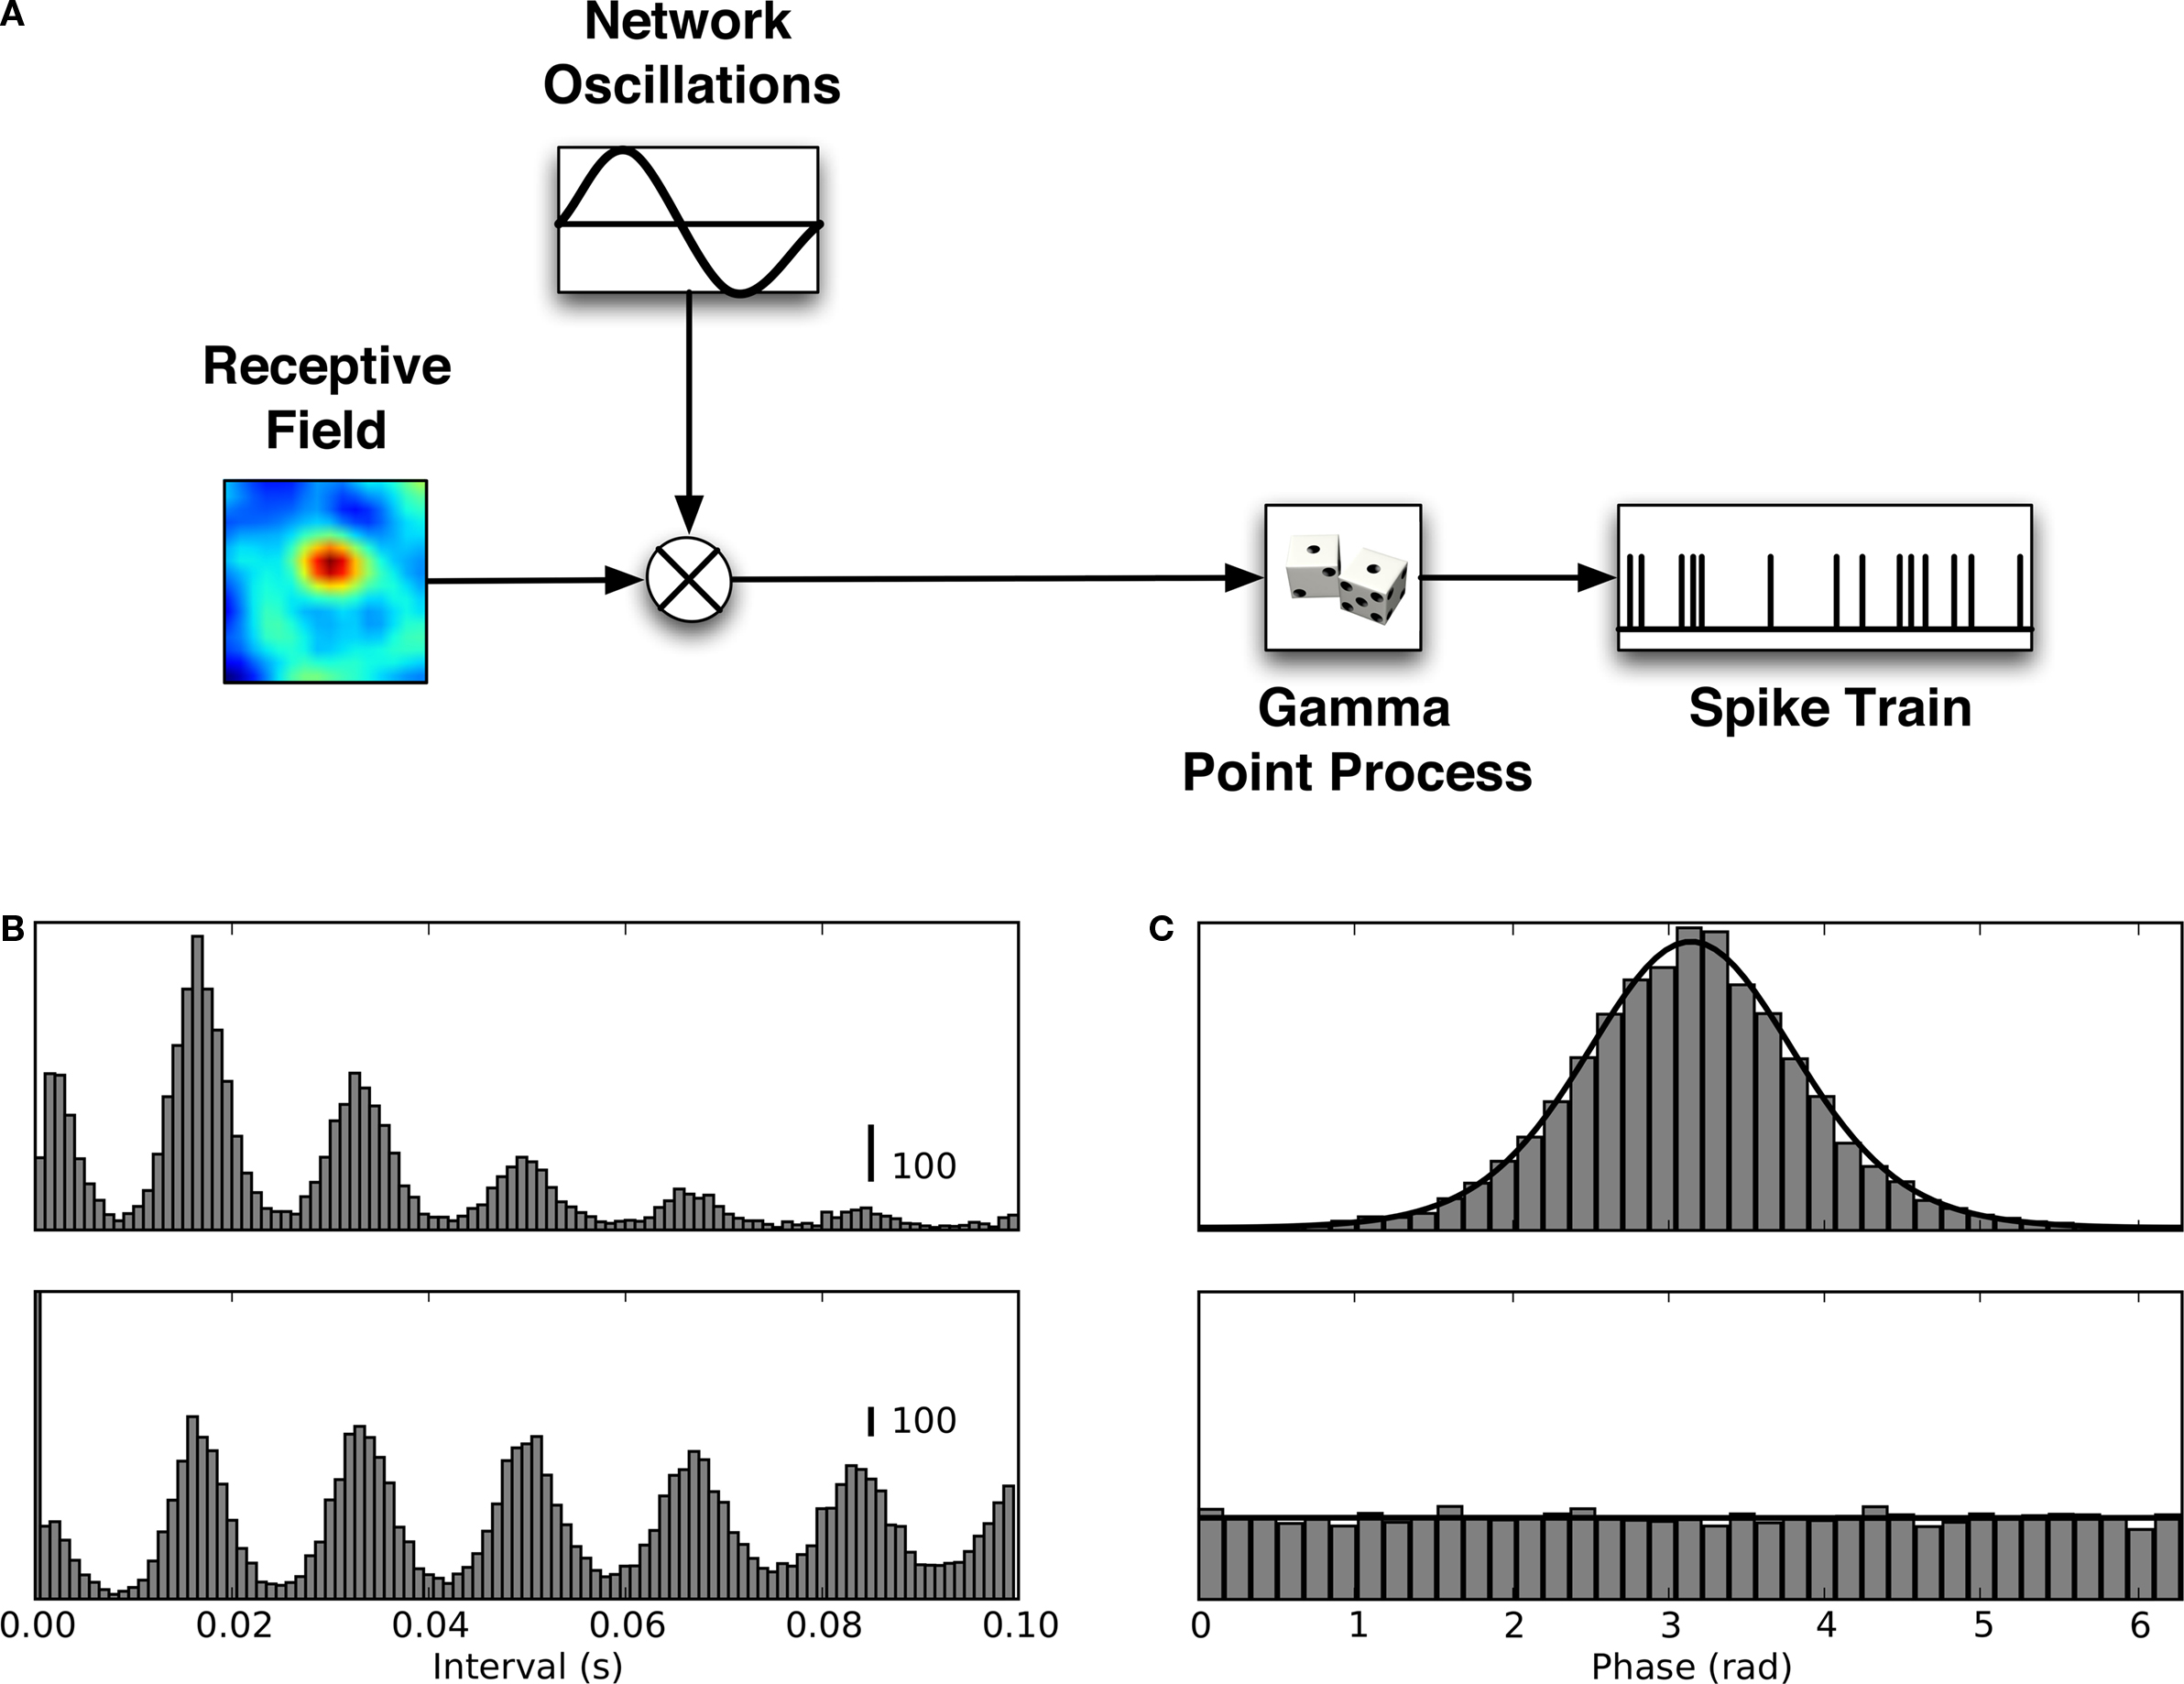
Figure 10. Quasi-periodic gamma (QPG) model reproduces spike timing statistics and phase distributions. (A) QPG model of thalamic neurons that predicts spike statistics and information rate. Spike times are described by an inhomogeneous gamma process; spike rate is the product of two signals, the visual response evoked through the receptive field and a periodic signal that simulates ongoing retinal activity. (B) Simulated distribution of spike intervals (top) and autocorrelograms (bottom). (C) Simulated distribution of spike phase (top) and shift predictor (bottom).
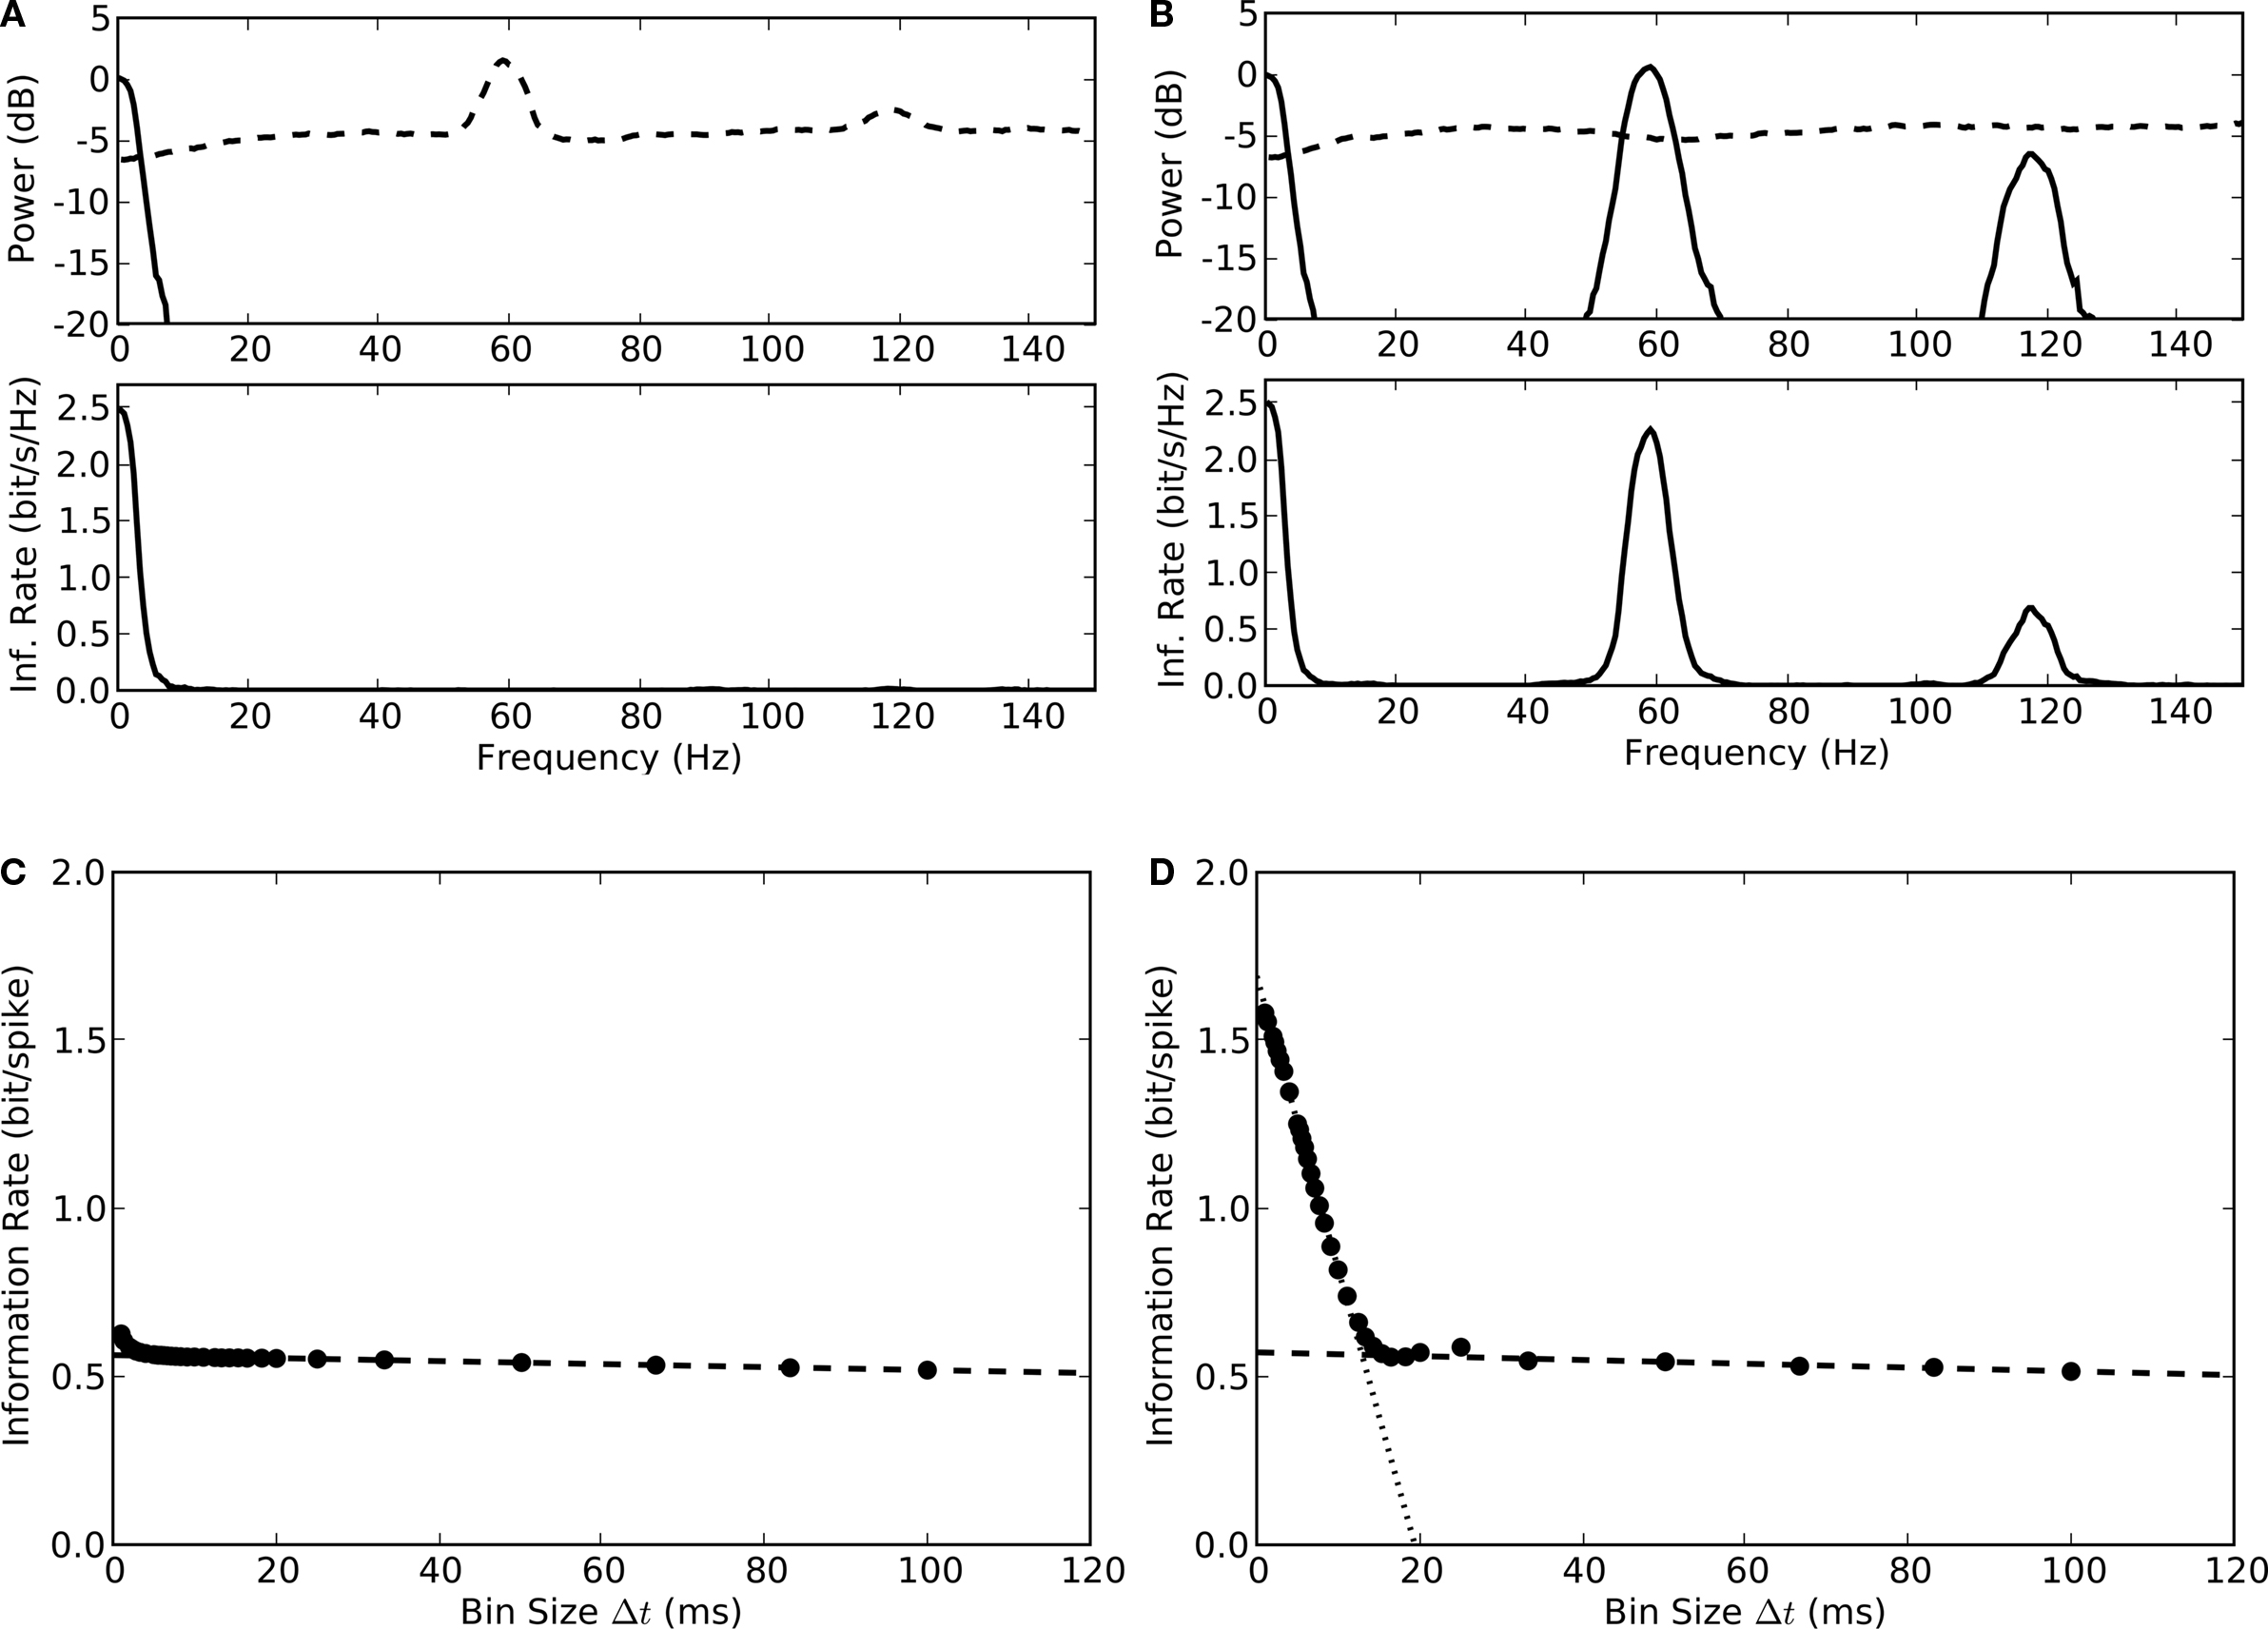
Figure 11. Information rate for QPG model. (A) Simulation with random oscillation phase across different trials: Signal spectrum (top, solid line), noise spectrum (top, dashed line) and information estimate (bottom). (B) Simulation with oscillation phase aligned across different trials: Signal spectrum (top, solid line), noise spectrum (top, dashed line) and information estimate (bottom). (C) Information estimate with oscillation phase randomized across trials (0.6 bit/spike). (D) Information estimate with oscillation phase aligned across trials increases from 0.6 bit/spike to 1.8 bit/spike if small bin width (<20 ms) are taken into account.
Simulation Results
The fitted parameters for the cell encircled in Figure 9
A, B were k = 2, κ = 2.3, f = 59 Hz, σf = 2 Hz and μ = 0. The QPG model reproduced the multi-peaked distribution of inter-spike intervals and the location of the tallest peak (near 17 ms) that were observed empirically, compare Figure 10
B and Figure 3
A.
We then used the QPG model to estimate the rate at which information was transmitted. To reproduce the differences in phases among trials, we randomized the phase offset for each one. Again, the simulations resembled the empirical results: compare Figure 11
A with Figure 7
A and Figure 11
C with Figure 7
C. Next, to simulate information rates and spectra after de-jittering, we fixed the phase offset in the model for all trials. Once more, the QPG model reproduced the experimental results. This similarity is seen in the shape of the spectra and in the information rate (compare Figure 11
B with Figure 8
E); the total upper bounds in bit/spike before (0.51, model and 0.44, experiment) and after de-jittering (1.66, model and 1.62, experiment).
Finally, we used the QPG model to generate surrogate datasets that comprised many more trials than could be acquired with whole-cell recording in vivo. We applied the direct method to the simulated datasets to compare information rates before and after de-jittering, Figures 11
C,D. This analysis supported our conclusion that neural oscillations carry information downstream. That is, the information rate was 0.6 bit/spike (linear extrapolation to zero bin, Figure 11
C, dashed line) when the phase of the oscillations was random across trials but grew to 1.8 bit/spike, when the phase of the oscillations phase was aligned across trials, Figure 11
D, dotted line.
Our study provides evidence that individual retinal ganglion cells multiplex two streams of information that the thalamus transmits to cortex. One stream is well known and encodes visual information by changes in firing rate that are time-locked to external visual stimuli. The second channel (which we found by aligning thalamic spikes with respect to the local phase of oscillations in retinal input) encodes information using spike timing relative to intrinsic retinal oscillations (Koepsell and Sommer, 2008
). The amount of extra information in the second channel increases as a function of oscillation strength and can as much as triple the number of bits that each spike carries. Also, because the oscillation-based channel operates in a frequency band separate from that containing the stimulus-locked channel, the contents of both channels could, in principle, be added together in the cortex. Last, these results are easily reproduced by a simple computational model.
How might the oscillation-based channel communicate information to the cortex? To address this question it is useful to consider the physiology and structure of thalamocortical circuits. Coincident thalamic inputs evoke cortical firing more effectively than those spaced several milliseconds apart (Bruno and Sakmann, 2006
; Usrey et al., 1998
). Hence, if relay cells that oscillated in phase were to innervate a common cortical target, their synchronized input could propel oscillations downstream. There is, in fact, evidence for such functional connectivity. Cross-correlation analyses show that a single ganglion cell projects to multiple relay cells which ultimately converge on the same cortical neuron (Hamos et al., 1985
; Usrey et al., 1999
). Therefore, the output of one ganglion cell could drive several relay cells to spike at the same time and provide coincident input to their common target. Further, recordings of local field potentials from the LGN have shown neighboring relay cells oscillate in phase Laufer and Verzeano (1967)
. Thus, spikes generated by oscillating relay cells (whether linked to a common ganglion cell or not) are likely to reach cortex simultaneously and sum to generate powerful excitatory drive.
The synchrony that oscillations generate is potentially useful for processing visual images. For instance, computational studies show that retinal oscillations generate synchrony that reduces the occurrence of errors made in encoding of local features (Kenyon et al., 2004
). Oscillations might also contribute to object recognition, as proposed by the “binding by synchrony” hypothesis (Eckhorn et al., 1988
; Gray and Singer, 1989
; Samonds et al., 2006
) by von der Malsburg (1981)
. In this scheme, local features in the stimulus are grouped as members of a particular object by phase relationships of visually evoked spikes to intrinsic oscillations. Although this hypothesis was first described for cortex, binding of local receptive fields through synchrony has also been observed in the retina and thalamus (Neuenschwander and Singer, 1996
; Stephens et al., 2006
).
What information might the second channel encode? It is likely that the oscillation-based channel transmits contextual information about the stimulus. Oscillatory activity in retina is generated by the coordinated activity of distributed networks that span large regions of retinal, and hence visual, space. The idea that oscillations convey contextual information is also supported by recent experiments in frog. Blockade of retinal oscillations abolishes escape behavior elicited by large stimuli that mimic shadows cast by predators but does not impair detection of small objects that resemble prey (Ishikane et al., 2005
). More generally, the oscillation-based channel might serve to convey global information such as the gist of a scene (Navon, 1977
; Torralba, 2003
).
Having two channels might be better than having one, even if both carried duplicates of the same information. The first copy would be encoded by a familiar mechanism, stimulus-locked changes in spike rate. This low-passed signal would be read out by conventional mechanisms of synaptic integration. To explain how the second copy would be conveyed, we use the analogy of AM radio transmission: here the visual signal modulates the amplitude of the high frequency carrier, in this case the gamma oscillation. Intrinsic cortical oscillations, also in the gamma band, form the band-pass receiver (Fellous et al., 2001
; Hutcheon and Yarom, 2000
; Nowak et al., 1997
); thalamic volleys that arrive near the peaks of the cortical oscillations, when local neurons are most depolarized, would have the best chance of driving activity. The information in the second channel might be read out by the degree of synchrony, or relative phases, of oscillations in the spike trains of converging relay cells. Thus, the visual stimulus is encoded twice, in two separate frequency bands of thalamic spike trains. This redundancy would increase robustness to noise by providing separate alternatives for cortex to decode the spike train, low passing or band passing. Band passing also could provide a mechanism for the selective routing of the oscillation-based channel. Since, the propagation of periodic activity depends on the strength and coherence of pre- and postsynaptic cycles, the amplitude and phase of cortical oscillations would determine when and where the information in the second channels is transmitted. Finally, because the frequency and strength of gamma oscillations in cortex is modulated by attention (Fries et al., 2007
), the contributions of the novel channel might be enhanced during times of heightened vigilance to visual signals.
KK conceived the idea for the project and developed as well as conducted the main analyses of the data. XW, YW and VV developed methods to detect events in the intracellular signal and, with JAH, performed the experiments. QW and XW contributed software for stimulus presentation, data collection and analysis. DLR and WMU performed the extracellular experiments. FTS supervised the project at both sites and contributed to both the theoretical analyses and the development of new methods to analyze the data. The manuscript was written by KK, FTS and JAH.
The authors declare that the research was conducted in the absence of any commercial or financial relationships that could be construed as a potential conflict of interest.
We thank the former members of the Redwood Neuroscience Institute for discussions and are grateful to Matthias Bethge, Tim Blanche, Yang Dan, Bartlett Mel, Bruno Olshausen, Jascha Sohl-Dickstein, and David Warland for comments on previous versions of the manuscript. This work was supported by the National Institutes of Health (JAH, grant NIH EY09593) the National Science Foundation (KK and FTS, grant IIS-0713657), and the Redwood Neuroscience Institute (KK and FTS). The clustering of intracellular events was performed using the Klustakwik (Harris et al., 2000
) program. The receptive field estimation was done with MATLAB (TM) programming language. The remaining analysis was performed using IPython (Pérez and Granger, 2007
) and NumPy/SciPy (Oliphant, 2007
), an open-source software environment written in Python. All figures were produced using Matplotlib (Barrett et al., 2005
).