A defined network of fast-spiking interneurons in orbitofrontal cortex: responses to behavioral contingencies and ketamine administration
1
Cold Spring Harbor Laboratory, Cold Spring Harbor, NY, USA
2
Watson School of Biological Sciences, Cold Spring Harbor, NY, USA
Orbitofrontal cortex (OFC) is a region of prefrontal cortex implicated in the motivational control of behavior and in related abnormalities seen in psychosis and depression. It has been hypothesized that a critical mechanism in these disorders is the dysfunction of GABAergic interneurons that normally regulate prefrontal information processing. Here, we studied a subclass of interneurons isolated in rat OFC using extracellular waveform and spike train analysis. During performance of a goal-directed behavioral task, the firing of this class of putative fast-spiking (FS) interneurons showed robust temporal correlations indicative of a functionally coherent network. FS cell activity also co-varied with behavioral response latency, a key indicator of motivational state. Systemic administration of ketamine, a drug that can mimic psychosis, preferentially inhibited this cell class. Together, these results support the idea that OFC–FS interneurons form a critical link in the regulation of motivation by prefrontal circuits during normal and abnormal brain and behavioral states.
Ketamine is an NMDA antagonist with potent psychoactive properties (Berman et al., 2000
; Zarate et al., 2006
). Ketamine’s effects may be mediated in part through the orbitofrontal cortex (OFC), a region of prefrontal cortex (PFC) crucial to motivational aspects of goal-directed behavior and affective decision-making (Hollerman et al., 2000
; Schoenbaum and Roesch, 2005
). Electrophysiological studies have demonstrated that the activity of single OFC neurons is correlated with the predicted outcomes of behavioral decisions (Schoenbaum et al., 1998
; Tremblay and Schultz, 1999
, 2000
; Padoa-Schioppa and Assad, 2006
). OFC lesions also disrupt the expression of differences in latency of response for differences in the value of expected outcomes (Lauwereyns et al., 2002
; Schoenbaum et al., 2003
). However, although individual OFC neurons show firing rate correlations with response latency, no overall correlation of OFC and response latency has been seen (Feierstein et al., 2006
). Indeed, in addition to prominent correlation with expected outcomes, OFC neurons, like other cortical neurons, show a highly diverse set of behavioral correlates (Feierstein et al., 2006
).
Cortical microcircuits are composed of distinct cell types with diverse intrinsic and synaptic properties (Somogyi et al., 1998
; Markram et al., 2004
; Ascoli et al., 2008
). Seminal studies by Goldman-Rakic and colleagues dissected the functional organization of primate dorsal lateral PFC in terms of cell types (Constantinidis et al., 2002
; Wang et al., 2004
). This work supports the notion that the firing properties of prefrontal neurons may be attributed to their underlying role in the function of the local microcircuit, with the apparent diversity of responses reflecting the heterogeneity of circuit elements and a failure to differentiate cell types. The significance of understanding the functional diversity of OFC neurons is highlighted by the fact that different cell types within PFC are differentially impacted by neurological diseases and psychiatric disorders (Freund, 2004
; Lewis et al., 2005
).
Fast-spiking (FS) GABAergic-interneurons are of particular importance to cortical function. FS cells comprise approximately 50% of interneurons in the neocortex, generate narrow action potentials, include both basket and chandelier cells, and are often parvalbumin containing (Kawaguchi and Kubota, 1993
). Given their cellular and anatomical properties, FS cells are well positioned to coordinate the spiking activity of cortical pyramidal cells, and several psychiatric disorders including both schizophrenia and bipolar disorder are associated with FS cell dysfunction (Haldane and Frangou, 2004
; Lewis et al., 2005
). Furthermore, it has been hypothesized that FS interneurons are particularly sensitive to the inhibiting effects of NMDA antagonists such as ketamine and MK-801 (Coyle, 2004
). This hypothesis could explain why these inhibitors of excitatory synaptic transmission produce overall disinhibition of cortical activity, including increases in cellular excitability and enhanced glutamate release (Lewis and Moghaddam, 2006
).
Recent studies have provided support for the disinhibition hypothesis of NMDA antagonism by showing that systematic MK-801 administration decreases the firing rate of putative interneurons in the PFC of awake rats (Homayoun and Moghaddam, 2007a
,b
). Furthermore, studies by Goldman-Rakic and colleagues have described the activity of putative interneurons during behavior in both normal and during pharmacological manipulations (Constantinidis et al., 2002
; Williams et al., 2002
). In these studies, narrow-spiking (NS) interneurons were identified based on a combination of waveform and firing rate criteria. Here, we use a similar approach based on extracellular waveform analysis to identify two physiologically distinct NS OFC cell populations, termed NS1 and NS2. These two populations differ in their local and global network properties and have distinct behavioral correlates in a sensory decision task. Importantly, NS1 cells are selectively suppressed by subanesthetic doses of ketamine. Together, these data provide insight into GABAergic processing within OFC and into how manipulations of GABAergic processing may contribute to the “psychotomimetic” and antidepressant properties of acute ketamine administration.
All procedures involving animals were carried out in accordance with NIH standards and approved by the Cold Spring Harbor Institutional Animal Care and Use Committee. Fifteen male Long-Evans rats (300–500 g) were implanted with a microdrive array consisting of six independently adjustable tetrodes (Wilson and McNaughton, 1993
; Feierstein et al., 2006
) (Bregma coordinates: 3.5 mm AP; 2.5 mm L). Following 5–7 days of post-operative recovery, tetrodes were advanced into OFC and physiological recordings were obtained from implanted animals as they performed a two-alternative olfactory discrimination task for water reward (Uchida and Mainen, 2003
; Feierstein et al., 2006
) or explored a holding box adjacent to the testing environment. During holding box exploration, the animal was allowed to freely wander a clean Plexiglas cage; over the course of exploration, animals would most often walk around the cage, sniffing and probing the borders of the cage with its whiskers, with occasional bouts of motionlessness and quiescence near the sides of the cage. During the two-alternative choice olfactory discrimination task, animals were trained to make a nose poke into one of two spatially separated (“left” and “right”) response ports based upon the identity of an odor presented from a centrally located odor delivery port. Over the course of behavioral training, animals would learn to associate a monomolecular odorant (e.g., hexanol) with a movement to the left or right response port; a correct response resulted in the receipt of a small water reward (approximately 0.03 ml). Animals were trained on this task until they were able to perform at or above criterion (85% correct) in a single session (approximately 200–300 individual trials), after which animals were implanted with a tetrode drive for electrophysiological recording during behavioral performance. While the OFC is not known to be necessary for the performance of this task, the OFC has been implicated in the process by which stimuli become associated with reward, and neurons in OFC have been shown to encode a number of variables involved in the performance of the two-alternative olfactory task (e.g., movements to choice ports, reward, odor identity) (Feierstein et al., 2006
). Extracellular signals were amplified (5,000–50,000×), band-pass filtered (0.6–6 kHz) and sampled at 32.5 kHz/channel using a Cheetah acquisition system (Neuralynx, Tucson, AZ, USA). Individual threshold values were set for each tetrode channel such that any time a recorded voltage crossed threshold on at least one channel of a tetrode, 32 points were recorded for each of the four tetrode leads. Sampled waveforms, along with event flags generated by a behavioral control system, were subsequently saved to disk for further off-line analysis.
Cell Identification
Multiple single units were isolated by clustering spike features derived from the sampled waveforms (Mclust 3.4; A.D. Redish). Initial cluster identification and discrimination was based on the relative ratio of each spike’s peak amplitudes recorded across the four tetrode leads. Further refinement of spike clusters was primarily obtained through the use of additional features derived from the tetrode channel(s) yielding the strongest amplitude signal. Typical features included: spike width, spike valley, the fast Fourier transform (FFT) of the spike waveform, energy of the waveform (L1-norm) and the first principal component of the extracted waveforms (PCA1). Only cells that produced a minimum of 100 spikes with less than 1% refractory period violations (refractory period <1 ms) were used for subsequent analysis. In addition, to insure that we used well-isolated cells, cells with an isolation distance (ID, Mahalanobis distance for clusters using the following features: peak, energy, FFT, PCA1; Schmitzer-Tobert et al., 2005
) of less than 20 were excluded (Harris et al., 2001
).
Spike Shape Analysis
To analyze the average spike shape of each isolated cell, only the tetrode channel yielding the largest voltage signal was considered. Each spike waveform within a cluster was normalized by the peak amplitude of the largest spike within a cluster and the peaks of all spikes were temporally aligned prior to averaging. Following averaging, the derived waveform was smoothed using a spline interpolation function (MATLAB: SPLINE) in which 10 points were estimated for every data point in the original waveform and the following features were extracted: (1) Pre-valley (V1): defined as the minimum value of the waveform prior to the peak; (2) Post-valley (V2): defined as the minimum value of the waveform following the peak; (3) Spike width: defined as the time between the occurrence of the peak and V2; (4) the ratio of V1 to V2 (V1:V2); and (5) the ratio of V2 to the spike’s peak (V2:P).
Activity Measurements
Cortical interneurons exhibit different excitability levels and regularity in firing in response to constant current injection. As surrogates for these in vitro measurements, we used mean firing rate over the whole recording session and a measurement of interspike interval (ISI) variability (local coefficient of variability, CV2) (Holt et al., 1996
). For a spike sequence,  where Δti and Δti+1 are adjacent ISIs. CV2 was used as a measure of spike train variability rather than conventional measurements such as the coefficient of variation of ISIs and Fano Factor, because CV2 is less susceptible to non-stationarities in firing rate typically associated with phasically driven spike trains (Holt et al., 1996
).
where Δti and Δti+1 are adjacent ISIs. CV2 was used as a measure of spike train variability rather than conventional measurements such as the coefficient of variation of ISIs and Fano Factor, because CV2 is less susceptible to non-stationarities in firing rate typically associated with phasically driven spike trains (Holt et al., 1996
).Spike Broadening
Activity dependent spike broadening (SB) was calculated as the average fractional change in spike width for pairs of adjacent spikes. Because the magnitude of SB depends on the time between spikes (Fee et al., 1996
; Harris et al., 2001
), only spike pairs in which the time between the two spikes was 1–10 ms were considered.
Hierarchical Clustering
To distinguish NS from wide-spiking (WS) cells, we performed unsupervised clustering on spike width and firing rate. Because the distribution of firing rates across the population was approximately log-normal, log firing rates rather than raw rate values were used so that outliers in the rate distribution did not distort variance estimates for the population. Following normalization to z-scores, and rescaling (for log-normal distributions), unsupervised clustering was performed using Ward’s method (MATLAB Statistics Toolbox; Mathworks, Natick, MA, USA). We first calculated the Euclidean distance between all cell pairs based on the two-dimensional space defined by each cell’s average spike width and firing rate. Based on this matrix of distances, an iterative agglomerative procedure was used to combine cells into groups such that at each stage the total number of groups was reduced by merging those groups whose combination gave the smallest possible increase in the within group sum of squared deviation (Cauli et al., 2000
). A similar clustering procedure was used to cluster populations of NS interneurons. For interneuron sub-classification, rather than spike width and firing rate, four cluster features we used CV2, fractional SB, V2:P and log(V1:V2).
Correlation Analysis
Cross-correlation histograms (CCHs) for all pairs of simultaneously recorded cells were computed using techniques proposed by Brillinger and employed by Frank et al. (2001
). Briefly, individual CCHs were constructed for each cell pair (A, B) with spikes from one cell (B) serving as the reference point for the CCH. The CCH was then subjected to a variance normalizing transformation:  where xi is the original value for time bin i,
  is the new value, dt is the size of the time bin (2 ms), and NB is the number of spikes fired by the reference cell. After this transformation, the expected correlation value for the two independent spike trains over an entire recording session is
  where T is the duration of the recording session and the 95% confidence intervals for the correlation are
 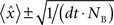 . To determine the coupling probabilities for pairs of cortical neurons independent of slow drifts or co-variations in firing rate, a local mean value for each CCH was calculated based on the average of all bins within ±1,000 ms. For averaging purposes, each bin within a CCH was then transformed into a z-score relative to this local mean. Because of sampling issues, we were unable to distinguish the occurrence of two simultaneous spikes on the same tetrode; as a result, within-tetrode cross-correlations contained an artificial trough at time 0. To account for this trough, we replaced zero bin values with the mean value of the two adjacent bins prior to z-score normalization and averaging. In some analyses, high-pass filtering was used to remove slow time scale components of each CCH. For high-pass filtering, we constructed an ideal high-pass filter using the REMEZ function in MATLAB with the following parameters: Stop band frequency = 0.01; Pass band frequency = 0.1; Stop band attenuation = 0.0001; Pass band ripple = 0.058, and Density factor = 16. A cutoff period of 10 bins, corresponding to 20 ms, was used. Filtered CCHs were renormalized prior to averaging.
where xi is the original value for time bin i, is the new value, dt is the size of the time bin (2 ms), and NB is the number of spikes fired by the reference cell. After this transformation, the expected correlation value for the two independent spike trains over an entire recording session is where T is the duration of the recording session and the 95% confidence intervals for the correlation are . To determine the coupling probabilities for pairs of cortical neurons independent of slow drifts or co-variations in firing rate, a local mean value for each CCH was calculated based on the average of all bins within ±1,000 ms. For averaging purposes, each bin within a CCH was then transformed into a z-score relative to this local mean. Because of sampling issues, we were unable to distinguish the occurrence of two simultaneous spikes on the same tetrode; as a result, within-tetrode cross-correlations contained an artificial trough at time 0. To account for this trough, we replaced zero bin values with the mean value of the two adjacent bins prior to z-score normalization and averaging. In some analyses, high-pass filtering was used to remove slow time scale components of each CCH. For high-pass filtering, we constructed an ideal high-pass filter using the REMEZ function in MATLAB with the following parameters: Stop band frequency = 0.01; Pass band frequency = 0.1; Stop band attenuation = 0.0001; Pass band ripple = 0.058, and Density factor = 16. A cutoff period of 10 bins, corresponding to 20 ms, was used. Filtered CCHs were renormalized prior to averaging.To quantify CCH interactions at the population level, significant increases in firing probability were detected for each CCH using a threshold of three standard deviations above the mean. To test for excitatory interactions, the CCH peak was required to be asymmetric and to occur 2–5 ms before the reference (postsynaptic) spike train. For correlations between and within NS groups, four different categories of correlations were identified: positive, negative, mixed, and no-correlation. Positively (negatively) correlated cell pairs exhibited one or more bin within ±5 ms of the reference event that was greater (less) than three standard deviations above (below) the mean. Whereas positive/negative cell pairs had both a significant peak and trough within the ±5 ms window, non-correlated cell pairs had no significant deviation from 0.
Ketamine Experiments
Each day, two baseline recording sessions and one post-injection recording session were performed. Baseline recording sessions consisted of a 15-min “resting” baseline, during which the rat was awake but resting in a clean plastic cage, and a 15-min “behaving” baseline, during which the rat was performing the two-alternative behavioral task. The order in which the baseline recording sessions were performed was pseudo-randomly varied from day to day.
Under normal conditions, NS neurons make up approximately 5–10% of units in extracellular recordings. In order to investigate whether or not acute ketamine injections specifically alter the firing rates of NS1 cells, it was important to obtain data from as many NS cells as possible. Therefore, in this set of recordings, prior to the first baseline session each tetrode was manually lowered through OFC in 40 μm steps every 10–15 min until a cell eliciting narrow (<250 μm) action potentials was identified by visual inspection of signal traces. If no such neuron was observed within 200 μm of the starting location, the tetrode was left in place until the following recording. As a result of this screening procedure, within the ketamine data set, 40 out of 152 neurons met the criteria necessary for inclusion NS cells, a three- to four-fold increase in the fraction of NS cells relative to random sampling.
The baseline recordings were immediately followed by brief nasal exposure to paper towel dabbed with isoflurane, and the subcutaneous injection of either drug (30 mg/kg ketamine) or control (1% saline) solution. The administration of drug and control solution was alternated each day. After receiving an injection, the rat was immediately placed back into the behavior box and neural activity was continuously recorded for 90 min. Individual rats were used for an average of five recording sessions, receiving approximately two to three total injections of ketamine and two to three total injections of saline before being sacrificed. No significant effect of drug treatment across days was observed.
Histology
At the end of the experiment, animals were deeply anesthetized with sodium pentobarbital. Recording sites were marked in 12 rats by electrolytic lesions made for each electrode. Rats were then perfused transcardially with 4% paraformaldehyde. Brains were removed and stored in 4% paraformaldehyde until sections were made. Thirty micron sections were made, Nissl-stained, and photographed at 1.25× to determine the location of recording sites. Recordings were obtained from ventrolateral and lateral OFC. We found no difference in basic properties across OFC including more lateral regions.
Statistical Methods
Unless otherwise mentioned, statistical analysis of data was performed using nonparametric (Wilcoxon) test for differences in mean values between populations with non-normal distributions, two-tailed t-tests for normally distributed populations, or a χ2 test for proportional differences across populations. All values are reported as mean ± SEM.
Electrophysiological recordings were obtained from 1,044 neurons in the OFC of awake rats using chronically implanted tetrodes (Wilson and McNaughton, 1993
; Feierstein et al., 2006
). An unsupervised clustering algorithm applied to the spike widths and firing rates of this cell population yielded two classes consisting of 925 WS and 119 NS neurons (Figure 1
) (Mountcastle et al., 1969
; Baeg et al., 2001
; Constantinidis and Goldman-Rakic, 2002
). Data from previous studies indicate that NS cells are likely to correspond to interneurons (including both FS cells and non-FS cells), and that the WS population is predominately composed of pyramidal cells (McCormick et al., 1985
; Kawaguchi and Kubota, 1997
; Cauli et al., 2000
). In this report, we focus on subgroups within the NS cell population.
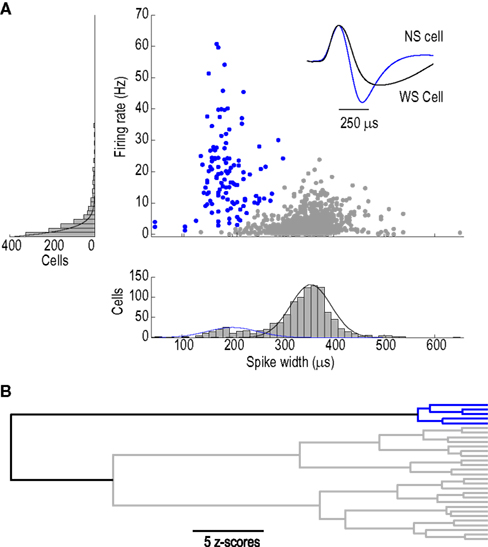
Figure 1. Identification of putative interneurons. (A) Average firing rate of a neuron plotted as a function of the cell’s average spike width yielding two distinct populations of cortical cells corresponding to putative narrow-spiking (NS) interneurons (blue) and wide-spiking pyramidal cells (P, gray). Example of average waveforms (upward deflections indicate inward current) for a single putative interneuron (blue) and pyramidal cell (gray) are shown as an inset with scale bar. Distributions of firing rates and spike widths are shown to the left and bottom of the scatter plot respectively. (B) Dendrogram depicting the clustering of cortical neurons into two groups corresponding to narrow-spiking (NS, blue) and wide-spiking (WS, gray) cells. Scale bar indicates average Euclidian distance between sub-groups.
Distinct Subpopulations of Narrow-Spiking Cells
NS neurons were subjected to a second round of hierarchical clustering. For this analysis, we used three features of the extracellular spike train suggested by in vitro studies (Cauli et al., 2000
; Hasenstaub et al., 2005
): (1) rate of spike repolarization, (2) regularity of ISIs, and (3) degree of activity-dependent spike broadening (SB). In addition, we included a measure of spike shape – the ratio of pre-peak valley depth (V1) to post-peak valley depth (V2) (Figure 2
A) – that has been used previously to distinguish NS cells in the rodent hippocampus (Csicsvari et al., 1999
). Unsupervised clustering based on these four features (see Experimental procedures) yielded two major divisions of NS neurons (Figure 2
B). While further subdivisions are apparent within these two main divisions, because these two divisions roughly divided the NS population into two equal groups (see below) with numbers sufficient for subsequent statistical analysis, these two cell groups served as the main focus of this paper.
Figure 2. Physiological classification of narrow-spiking interneurons. (A) Spike shape features extracted from an average spike waveform: Peak (P), Width (W), pre-peak valley (V1), post-peak valley (V2). (B) Dendrogram depicting the clustering of narrow-spiking cells based on physiological similarities and differences. Two main clusters are evident: a relatively homogeneous cell population of narrow-spike type 1 cells (NS1; red) and a more heterogeneous cluster of narrow-spike type 2 cells (NS2; black). Scale bar indicates Euclidean distance between sub-groups.
The first group of cells (NS1, n = 66) was a relatively homogeneous cell class (average distance between cells: 1.80 z-scores) consisting of neurons whose average waveform was biphasic and exhibited a prominent post-peak valley, measured by the ratio of V2 to peak amplitude (P) (V2:P = 1.00 ± 0.025) (Figure 3
A). In contrast, the second cell population (NS2) was a more heterogeneous group of 53 cells (average distance between cells: 2.48 z-scores) characterized by a relatively shallow post-peak valley (V2:P = 0.56 ± 0.032) and a prominent hyperpolarizing dip prior to the initial depolarizing phase of the cell’s action potential (Figure 3
A). In addition to these prominent waveform differences, NS1 cells fired at higher rates than NS2 cells (24.1 ± 1.8 vs. 14.9 ± 1.3 Hz; P < 0.001, Wilcoxon test; Figure 3
B), with more regular spike trains (0.78 ± 0.015 vs. 0.86 ± 0.024; P < 0.005, Wilcoxon test; Figure 3
C) and significantly less activity dependent spike broadening (1.08 ± 0.009 vs. 1.14 ± 0.018; P < 0.005, Wilcoxon test; Figure 3
D Given that there was no difference in the isolation quality of the two cell populations (ID, see Section “Materials and Methods”), 61.6 ± 5.5 vs. 63.0 ± 6.6; NS, t-test], the NS1 and NS2 classes are unlikely to reflect differences in recording quality. Furthermore, correlation analysis showed that spike shape features were highly correlated across spatially separated tetrode leads [V2:P: r = 0.84, P < 0.01; log(V1:V2) : r = 0.78; P < 0.01, t-test], arguing that NS1 and NS2 features are not determined by distance from the recording electrode. Based on these cellular features, the NS1 class appears to be isomorphic with the FS class of GABAergic interneurons identified in vitro, whereas NS2 neurons appear to comprise a more heterogenous population of cells (see Section “Discussion”).
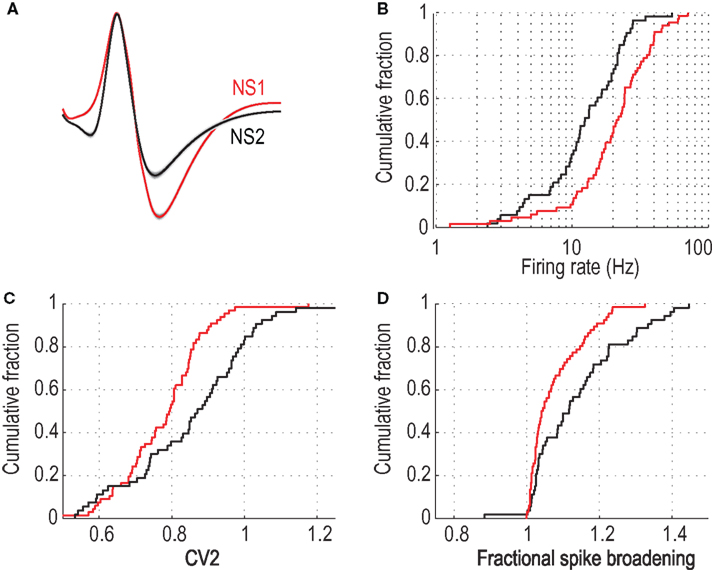
Figure 3. Physiological distinct properties for two populations of narrow-spiking neurons. (A) Average peak-normalized waveforms for NS1 (red) and NS2 (black) cell classes (upward deflections indicate depolarization). Cumulative distributions of activity dependent properties for NS1 (red) and NS2 (black) neurons. (B) Log firing rate, (C) CV2, (D) fractional spike broadening (SB).
Robustness and Reliability of NS Separation Criteria
As documented above, the spike feature showing the greatest separation between NS1 and NS2 cells was V2:P. To explore the utility of using V2:P as a univariate metric for separating NS1 and NS2 cells, we performed a number of analyses. First, the work of Fee et al. (1996)
clearly establishes the lack of stationarity and the large anisotropy associated with extracellular recordings. With reference to the current findings, it is therefore possible that non-stationarities in spike waveform shape could confound our cell classification system. Thus, it is important to note that V2:P is a ratio measure. While absolute features such as amplitude, width, and valley can show a high degree of variability, these absolute features tend to covary such that the variability of the ratios are dramatically reduced. In our data set, V2:P values showed low variability (CV = 0.2) relative to spike width variability (CV = 1.0) across a recording session. Furthermore, across temporally separated epochs (pre- and post-saline injections) V2:P measurements were highly correlated (R = 0.86) and the average ratio of V2:P (pre-injection) vs. V2:P (post-injection) was not different from 1 (0.98 ± 0.035; NS, t-test) indicating no change in this measure across the two epochs.
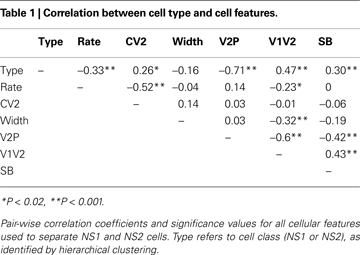
We next evaluated the relationship between V2:P and other spike features within the unseparated NS population. Table 1
shows the pair-wise correlation coefficients and significance values for all spike features used in this study. V2:P was most strongly correlated with V1:V2 and SB. Across all feature pairs the strongest pair-wise correlation was −0.6 and no single feature fully predicted any of the other extracted features with the NS population.
The observation that NS features were not completely predicted by any other singly observed feature supported the use of multi-dimensional hierarchical clustering in order to identify potential groupings within the NS population. Nevertheless, to establish the utility of single feature-based classification for subsequent in vivo studies, we evaluated the agreement of the classification based on clustering with a classification based on V2:P, the single waveform feature that showed the greatest separation between NS1 and NS2 cell populations (Mahalanobis distance 4.95 vs. 0.5799 for spike-broadening) and strong correlation with classification assignment (r = −0.71).
When the NS cell population was divided at a V2:P value of 0.80 the resulting two populations showed >90% overlap with the assignment obtained from our hierarchical classification procedure. Thus, V2:P values could be useful in identifying NS1 and NS2 cells under experimental conditions in which large samples of NS cells are unavailable. Furthermore, the relative ease of measuring V2:P and its relative invariance to changes in absolute spike amplitude suggests that this could be used to on-line screen cells during a recording session allowing for the targeted enrichment of specific cell populations for subsequent analysis.
NS1 Neurons Interact Strongly with Neighboring Pyramidal Cells
To provide independent validation of the distinction between the NS1 and NS2 populations, we examined the network properties of these two classes by constructing CCHs for pairs of simultaneously recorded neurons. Figure 4
A (left), shows the CCH for a cell pair consisting of a NS1 cell and a WS neuron (NS1–WS pair). Two features of this CCH are notable. First, there is a substantial increase in the probability of the WS cell firing around the occurrence of a NS1 spike. Second, this increase in firing occurs over slow (10–100 ms) and fast (0–10 ms) time scales. Slow time scales of interaction are likely to reflect common input, while fast time scales can arise from direct synaptic interactions (Brody, 1999
). To examine the fast time scale in more detail, we used high pass filtering to remove the low frequency component of the CCH (Figure 4
A, right). The high frequency component of the NS1–WS CCH was dominated by an increase in the probability of WS cell firing just prior to the occurrence of an NS1 spike and a decrease in WS cell firing following the NS1 spike. This asymmetry, together with the short latency (2–4 ms) and narrowness (2–4 ms) of the correlation peak and trough, suggest a direct excitatory connection from the WS cell to the NS1 neuron and an inhibitory connection back onto the WS cell (Brody, 1999
; Frank et al., 2001
; Marshall et al., 2002
; Bartho et al., 2004
). Across the population of 116 local (same tetrode) NS1–WS cell pairs, 20% (24/116) showed similar evidence of an excitatory connection from WS neuron to NS1 cell. In contrast to NS1–WS cell pairs, NS2–WS pairs showed little evidence for direct excitatory coupling. Figure 4
B shows a typical CCH for a single NS2–WS cell pair. Unlike the NS1–WS cell pair in Figure 4
A, this NS2–WS cell pair had no obvious short-time scale interaction. Only 2 of 105 NS2–WS CCHs exhibited significant excitatory peaks, a proportion significantly smaller than that for NS1–WS cell pairs (P < 0.01, χ2 test).
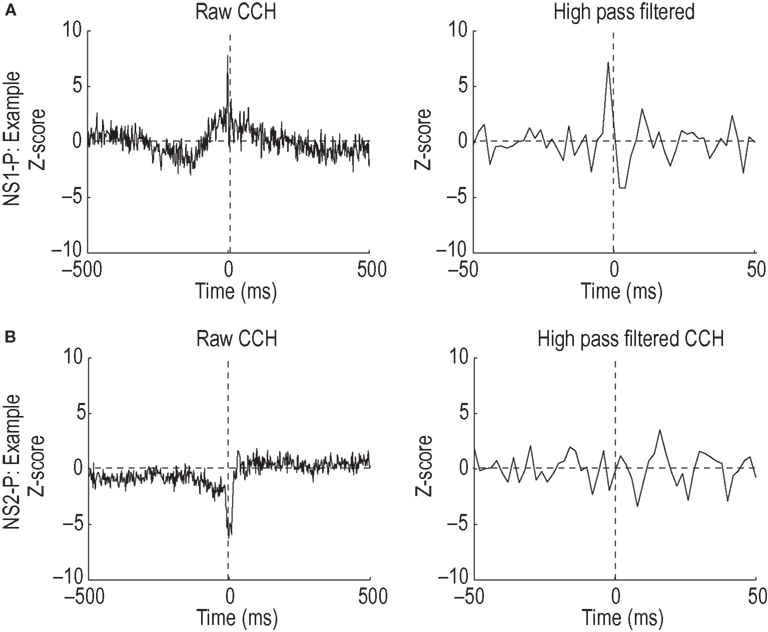
Figure 4. Cell-type specific local network interactions. (A) Representative cross-correlation histogram (left) for a single NS1–WS cell pair. Firing probability of wide-spiking cell, measured as number of standard deviations from baseline, is plotted relative to the occurrence of spikes from the NS1 neuron. High pass filtering of the raw CCH (right) reveals a significant increase in the firing probability of the putative pyramidal cell just prior to a NS1 spike. Note the change in time axis. (B) Representative cross-correlation histogram (left) for a single NS2–WS cell pair. Firing probability of wide-spiking cell is plotted relative to the occurrence of spikes from the NS2 neuron (time = 0). High pass filtering of the CCH (right) reveals a lack of short latency spike train interactions.
Network Differences within and Between NS Cells
In addition to differences in their interactions with WS cells, there were significant differences in interactions between and within the NS1 and NS2 cell groups. The average CCH for NS1–NS1 cell pairs (n = 25) showed a prominent zero-lag peak indicative of strong spike synchronization (Figure 5
A), even though 24 of 25 pairs were recorded on different tetrodes that were separated by more than around 300 μm. In contrast, the average CCHs for both NS2–NS2 cell pairs (n = 22) and NS1–NS2 cell pairs (n = 34) were much flatter (Figures 5
B,C). To ensure that the lack of a synchronous peak for NS2–NS2 and NS1–NS2 cell pairs was not a consequence of averaging a mixed population of positively and negatively correlated cells, we classified the CCH for each cell pair into one of four groups: no correlation, positive correlation, negative correlation, and positive/negative (mixed) correlation (Figure 5
D; see Experimental procedures). Sixty percent (15/25) of NS1–NS1 cell pairs exhibited significant CCH peaks, while none of the NS1–NS1 pairs had significant troughs within the temporal window. NS2-NS2 and NS1–NS2 cell pairs exhibited fewer positive correlations and more negative and mixed CCHs. Across the population of NS neurons, the proportion of cell pairs within each of the four correlation categories was significantly different for the three groups (NS1–NS1 vs. NS2–NS2 vs. NS1-NS2, P < 0.05, χ2 test; df(6) = 13.28). Thus, the distribution of network interactions within the NS population shows a strong dependence on the assigned identity of the individual units. This finding provides independent support for the hypothesis that the NS1/NS2 classification reflects a true biological distinction. Moreover, the network features of the NS1 class are consistent with the synaptic properties of FS neurons studied in vitro (Gao and Goldman-Rakic, 2003
).
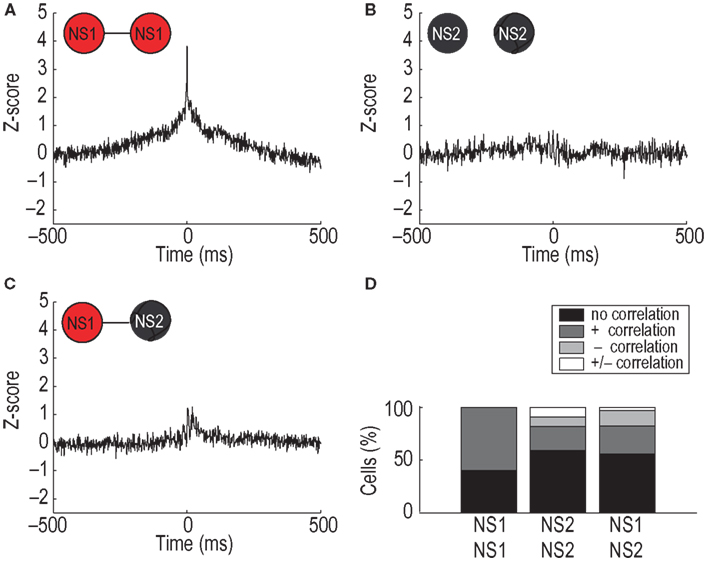
Figure 5. Cell-type specific interneuronal network interactions. (A) Average CCH for pairs of simultaneously recorded NS1 neurons showing a significant increase in correlated firing [x-axis: time lag of correlation (ms); y-axis: correlation value relative to baseline]. (B,C) Flat CCHs for populations NS2–NS2 and NS1–NS2, respectively, indicate a lack of synchronous firing. (D) Percentage of cell pairs exhibiting positive (+), negative (−), mixed (+/−), or flat cross-correlation histograms. Criteria for significance was at least one bin within ±5 ms of the zero bin exceeding three standard deviations in either the positive or negative direction.
Correlates of NS1 Activity and Behavioral Task Performance
The intrinsic and local network properties of NS1 cells together provide substantial support for the hypothesis that this group corresponds predominantly to the FS class of GABAergic interneuron (basket and chandelier cells). To examine whether the relative physiological homogeneity of NS1 cells translates into similar activity patterns within functioning circuits during behavior, we examined the activity profiles of a subset of the NS1 neurons recorded from during an olfactory discrimination task (Uchida and Mainen, 2003
) known to activate a large number of neurons in OFC (Feierstein et al., 2006
). In this task, odor cues were associated with nose poke responses to one of two alternative choice or “goal” ports. This task allowed us to examine the relationship of the firing of NS1 cells to sensory, motor and reward-related events during a simple goal-directed behavior.
If NS1 neurons form a coherent functional network relative to other cell populations within OFC, we would expect to find that they share common behavioral correlates. As a test of this prediction, we quantified the similarity between the activity profiles of individual NS1 neurons and the average activity profile of the NS1 population by computing the correlation coefficient between each cell’s activation profile (single cell post-stimulus time histogram PSTH time-locked to withdrawal from the odor port) and the average NS1 PSTH. Across the population, the average correlation coefficient was 0.46 ± 0.059 indicating a strong degree of similarity between individual NS1 cells and the population average. By comparison, the same analysis showed much weaker homogeneity when applied to NS2 cells (r = 0.25 ± 0.042). The average correlation coefficient between NS2 cells and the average NS1 PSTH was also significantly smaller than that of NS1 neurons (r = 0.19 ± 0.066; P < 0.05, Wilcoxon test). Thus, NS1 neurons show relatively homogenous behavioral correlates compared to NS2 cells, a result consistent with their strong within-class interactions.
We next examined the nature of the behavioral correlates of NS1 neurons. Figures 6
A,B show the raster and PSTH of a typical NS1 neuron time-locked to withdrawal from the odor port. The firing rate of this neuron increased during the odor stimulus period and during the period preceding reward delivery. In contrast, the neuron exhibited a transient depression (relative to baseline) in firing rate that was time-locked to initiation of the movement from odor port to choice port. This pattern of activity was also seen at the population level in the average peak-normalized PSTH obtained from all NS1 neurons recorded during the task (n = 41; Figure 6
C, red trace). Further examination of NS1 cell correlates indicated that these neurons were sensitive to trial outcome. First, during the period immediately following an animal’s nose poke into the response port, the firing of NS1 cells was consistently higher on error trials relative to correct trials (28 ± 4.2 vs. 26 ± 4.1 Hz; P < 0.05, Wilcoxon test). Second, during the time period just prior to odor delivery, the firing rate of NS1 neurons was significantly lower on trials following errors relative to trials following a correct response (28.6 ± 3.8 vs. 31.9 ± 4.3; P < 0.05, Wilcoxon test). In contrast to the relative behavioral response homogeneity of NS1 cells, the average PSTH of NS2 neurons (n = 41) showed much weaker behavioral modulation across all epochs considered, and no significant dip time-locked to movement initiation (Figure 6
C; black trace). Furthermore, unlike the NS1 population, the NS2 population showed no significant relationship to trial outcomes.
The dip in NS1 firing time-locked to the initiation of the behavioral response suggested a relationship between NS1 firing and the latency to respond, a commonly used behavioral metric of outcome expectancy (Schoenbaum et al., 2003
). Shorter latencies are associated with better outcome expectancies and a more positive “motivational state” (Lauwereyns et al., 2002
; Schoenbaum et al., 2003
). To test whether OFC–NS1 cells show a specific link to such measures of motivational state, we examined the correlation between NS1 firing and the speed of movement. Figure 6
D shows for a single NS1 cell (same cell as in Figure 6
A,B) the relationship between trial-by-trial fluctuations in the cell’s firing rate and the time taken for the animal to respond (i.e., move from the odor port to the goal port). For this cell, there was a strong positive correlation (r = 0.79; P < 0.01) between firing rate and response latency (or equivalently, a negative correlation between firing rate and speed of response). Thus, the strongest firing of the cell was associated with the longest latency to reach the goal port. Interestingly, similar correlations were found throughout the NS1 population. The average correlation value for all NS1 neurons was 0.19 ± 0.04, with 18/20 significantly correlated cells showing trial-by-trial fluctuations in firing rate positively correlated with movement time (Figure 6
E). This property of OFC–NS1 neurons contrasts with OFC–WS cells, measured in the same task, which showed no net correlation (i.e., a symmetric distribution of correlations; Feierstein et al., 2006
). Thus, OFC–NS1 firing, unlike the firing of the overall population of OFC neurons, showed an overall negative correlation with an indicator of motivational state.
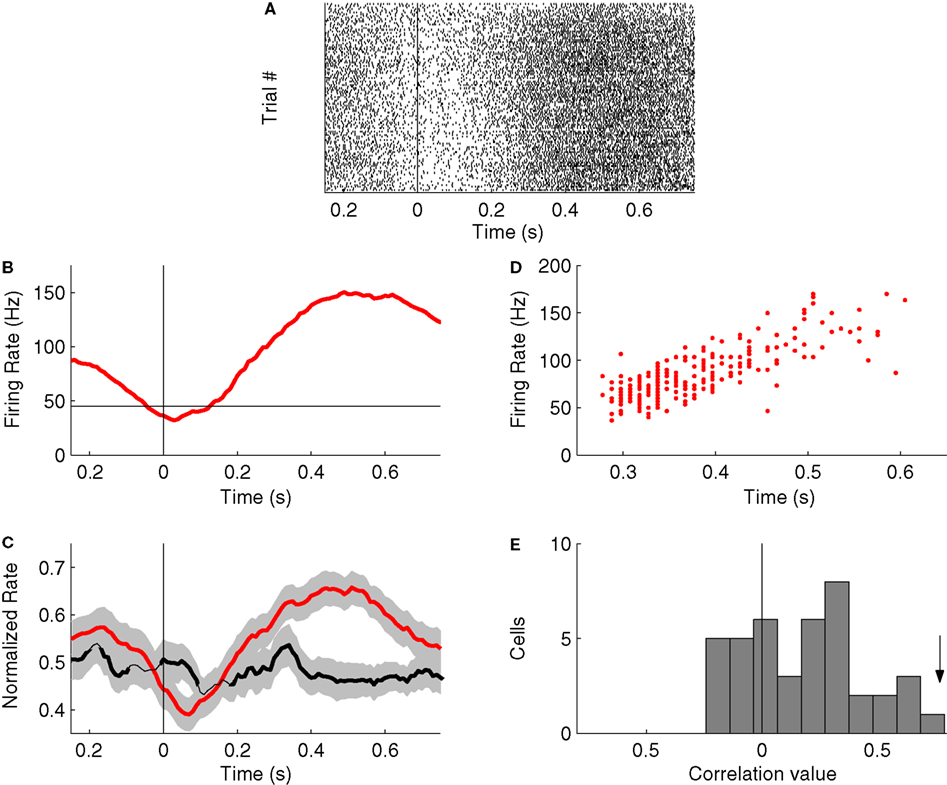
Figure 6. Activity profiles of NS1 cells during behavior. (A) Raster plot for a single NS1 neuron time-locked to an animal’s exit from the odor port. Each line of dots corresponds to a single trial. (B) Post-stimulus time histogram (PSTH) for NS1 neuron in (A), time-locked to an animal’s withdrawal from odor port. Red trace reflects average firing rate across all trials for this cell; horizontal line indicates baseline-firing rate of cell. (C) Average peak-normalized PSTHs for populations of NS1 (red) and NS2 (black) neurons time-locked to animals’ withdrawal from odor port. Shading represents ±1 SEM. X-axis: time lag relative to withdrawal from odor port; y-axis: average peak-normalized firing rate. (D) Trial-by-trial variations firing rate (y-axis) for cell in (A) plotted as a function of movement time. (E) Distributions of movement time-firing rate correlations for all NS1 neurons. Movement time was calculated from the time in which the animal left odor port until time in which it entered reward port. Firing rate was calculated over the last 300 ms of the movement time. Arrow indicates the correlation value for the cell shown in (A,B,D).
NS1 Neurons are Selectively Inhibited by Sub-Anesthetic Doses of Ketamine
FS neurons have been implicated in the pathophysiology of psychosis, and are suggested to underlie the response of PFC to ketamine and PCP (Coyle, 2004
; Lewis and Moghaddam, 2006
; Homayoun and Moghaddam, 2007b
). In particular, reduced FS function is theorized to result in dysfunction of PFC (Lewis and Moghaddam, 2006
; Homayoun and Moghaddam, 2007b
). These hypotheses suggest that if NS1 neurons are indeed equivalent to FS cells, then ketamine or PCP administration should suppress their firing. To test this idea, in a subset of experiments, we recorded activity of OFC neurons during a drug-free baseline condition and following a subcutaneous injection of either 1% saline or ketamine (30 mg/kg). The 30 mg/kg dose was chosen based on earlier studies showing that 30 mg/kg elevated both glutamate and dopamine within PFC and produced behavioral impairments in a spatial working memory task (Moghaddam et al., 1997
). Whereas gross behavioral performance following saline injection was indistinguishable from baseline conditions, ketamine sessions were characterized by complete disengagement from the task. Rather than performing the task, ketamine treated animals exhibited a number of stereotyped behaviors including both circling movements and repetitive limb motions. These behavioral changes are consistent with the known properties of dissociative anesthetics (Moghaddam et al., 1997
), and indicate that 30 mg/kg is a sufficient dose for producing acute behavior effects without inducing an anesthetic state.
Systemic ketamine injection led to a dramatic decrease in the firing rate of OFC–NS1 cells. Figure 7
A shows the average response profile of NS1 cells following either saline or ketamine injections. Across the population of NS1 neurons, there was an immediate and long lasting (>25 min) reduction in firing rate following ketamine injection. Although there was some reduction in average firing rate during saline injections as well, the firing rate of NS1 cells was significantly suppressed relative to saline injections (average fraction of baseline firing rate: 0.33 ± 0.09 vs. 0.84 ± 0.05, P < 0.001; Figure 7
B). In contrast, the overall firing rates of both the WS and NS2 populations following ketamine administration was not significantly different from that following saline (WS: 1.08 ± 0.17 vs. 0.86 ± 0.08, N.S.; NS2: 1.05 ± 0.37 vs. 0.97 ± 0.09, N.S.; Figure 7
B). Interestingly, for these populations there was an increase in the variance of firing rate. That is, OFC–WS and OFC–NS2 cells showed large increases and decreases in firing rate relative to both the pre-injection baseline period and the saline control condition (see Figure S1 in Supplementary Material). For the population of WS cells, this variance difference was significant [F(1,112) = 3.9; P < 0.05] suggesting the existence of two populations of WS neurons within OFC – one that is significantly suppressed by ketamine and another that is enhanced. Neither spike amplitude nor spike width changed significantly following ketamine or saline administration, indicating that the treatments did not compromise recording quality. These experiments directly implicate the NS1 cell class in the behavioral response to ketamine, but also suggest that ketamine either acts on other neuronal types as well, or that, as might be expected, WS changes result from changes in NS1 inhibition.
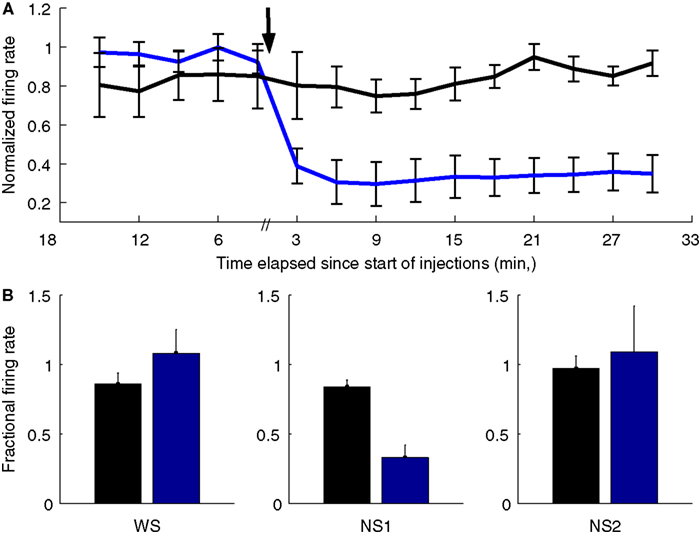
Figure 7. Ketamine selectively suppresses the spiking activity of NS1 neurons. (A) Mean ± SEM response of NS1 neurons following subcutaneous of either saline (black) or 30 mg/kg ketamine as function of time relative to injection (indicated by arrow). Firing rates calculated in 3-min bins. (B) Fractional change in firing rate relative to baseline for three cell populations (WS, NS1, and NS2) following either saline (black) or ketamine (blue) administration. Bar graphs reflect mean ± SEM fractional firing rate change calculated by dividing, for each cell, mean firing rate 2–17 min post-injection by the cell’s mean firing rate during the last 15 min of the baseline session.
Neurons in PFC exhibit a high degree of cellular and functional heterogeneity. Here we used a classification procedure based on features of extracellularly recorded spike trains to show that NS cells in rodent OFC form physiologically distinct subpopulations, which we term NS1 and NS2. The NS1 population appears to coincide with the most common type of cortical interneuron, the so-called FS cells, comprising basket and chandelier cells (Somogyi et al., 1998
; Markram et al., 2004
). The fidelity of our classification is supported by three independent observations. First, interactions between simultaneously recorded units are dependent on the inferred cell type. Second, the NS1 population exhibits relatively homogenous behavioral correlates. Third, the NS1 neurons are preferentially inhibited by the glutamate (NMDA) receptor antagonist and “psychotomimetic” ketamine. This final observation supports the idea that NS1 (FS cell) dysfunction contributes to the behavioral impairments associated with acute psychosis (Lewis et al., 2005
), and provides a direct physiological link between the glutamatergic and GABAergic theories of psychosis (Jackson et al., 2004
; Lewis and Moghaddam, 2006
).
Neocortical cells can be broadly divided into two categories based on spike width and firing rate (Mountcastle et al., 1969
; Constantinidis and Goldman-Rakic, 2002
; Bartho et al., 2004
). Although narrow spikes are generally thought to arise from GABAergic interneurons (McCormick et al., 1985
; Kawaguchi and Kubota, 1997
; Cauli et al., 2000
), narrow spikes are neither a required nor exclusive property of inhibitory cells (Nowak et al., 2003
; Markram et al., 2004
). Nevertheless, several observations suggest that NS1 neurons are most likely isomorphic with that of FS interneurons. First, in addition to narrow spikes and high firing rates, NS1 cells, like FS neurons, exhibit fast and prominent repolarizations (Cauli et al., 2000
; Nowak et al., 2003
; Hasenstaub et al., 2005
). Second, like FS neurons, NS1 cells exhibit relatively little activity-dependent SB (Cauli et al., 2000
). Finally, the high degree of synchronized firing for pairs of NS1 neurons is consistent with the observation that FS neurons are strongly coupled to each other via both electrical and chemical connections (Galarreta and Hestrin, 1999
; Gibson et al., 1999
) and with the fact that FS cells receive similar synaptic inputs (Yoshimura and Callaway, 2005
). Although it is impossible with our current recordings to definitively determine the mechanisms responsible for NS1 synchronization in vivo, it should be noted that spike synchronization was observed under both basal and task conditions. Further studies selectively targeting mechanisms known to promote synchronization in vitro (i.e., gap junction blockers) may help to clarify this issue.
In contrast to relative homogeneity of the NS1 population, the remaining population of NS neurons, termed NS2, is likely to contain a mixture of cell types including both excitatory “chattering” cells and dendritically targeting interneurons. Chattering cells are a subclass of pyramidal cells exhibiting narrow spikes, high firing rates, and a tendency to produce bursts of high frequency action potentials at gamma frequencies (Gray and McCormick, 1996
). While chattering cells have not been previously reported in rodent cortex, a few of our NS2 neurons matched these criteria (<15%). More generally, the physiological properties of NS2 neurons are consistent with that of certain subclasses of dendritically targeting interneurons previously reported to exist in both the hippocampus (OLM cells) (Csicsvari et al., 1999
) and in the PFC of anesthetized rats (bitufted interneurons) (Tierney et al., 2004
). Similar to our NS2 population, extracellularly recorded OLM cells and bitufted interneurons produced action potentials with relatively shallow post-peak valleys, low firing rates and irregular firing patterns. Furthermore, like NS2 cells, a subset of OLM cells and bitufted interneurons produce tri-phasic spikes (Csicsvari et al., 1999
; Tierney et al., 2004
). Given the high degree of heterogeneity with the NS2 population, it will be important to determine the extent to which other physiological criteria (i.e., bursting) can reveal meaningful subdivisions within NS2 neurons similar to the distinction between NS1 and NS2 neurons (see Figure S2 in Supplementary Material).
Functionally, NS1 neurons exhibit a number of features that distinguish them from other cell populations within OFC. Most prominently, we found that NS1–WS pairs account for 90% of the short-latency interactions between putative pyramidal cells and NS neurons despite the fact that they made up only about 50% of the NS–WS cell pairs. The overrepresentation of these strong interactions is even more striking given that the 116 within-tetrode NS1–WS cell pairs represents less than 2% of the total cell pairs within our data set, yet account for more than 70% of the putative monosynaptic interactions. The powerful connection between WS cells and NS1 neurons is consistent with the properties of pyramidal cell inputs onto FS neurons known from in vitro work (Gao and Goldman-Rakic, 2003
) and suggests that NS1 cells provide the majority of rapid feedback and lateral inhibition to local OFC circuits.
In addition to receiving strong local drive, activity was strongly synchronized between NS1 neurons at the 10–100 ms time scale, as evidenced by their cross-correlations and similarity of activation profiles during behavior. Consistent with the proposed role for cortical interneurons in regulating the temporal flow of information within cortex (Constantinidis et al., 2002
), we found that NS1 neurons show enhanced firing while rats held their noses in the sensory and reward ports, and reduced firing during movement initiation. Importantly, NS1 firing was strongly correlated with response latency, a measure of motivational state based on outcome expectancy (Lauwereyns et al., 2002
; Schoenbaum et al., 2003
). The further observation that NS1 neurons differentiate between positive (reward) and negative (no-reward) outcomes, both immediately and across trials can be interpreted in light of recent data suggesting that primate FS cells play a role in attentional gain modulation (Mitchell et al., 2007
). Specifically, if we assume that one function of NS1 FS cells is to regulate local network excitability, one could posit that the elevation of NS1 cells firing immediately following an error trial would shut down inappropriate response networks, and that the subsequent reduction of NS1 activity during subsequent trials would be sufficient to unmask normally suppressed response networks – a function consistent with the role of OFC in error driven learning and behavioral flexibility (Schoenbaum et al., 2003
). Further behavioral studies of NS1 activity are needed to clarify these issues.
Together with the finding that OFC lesions impair normal differences in response latencies associated with outcome expectancy (Schoenbaum et al., 2003
), our results support a central role for NS1 neurons in mediating the expression of motivational state. Because they collect inputs broadly from pyramidal neurons and can in turn impose a broad influence, a network of NS1 neurons is well positioned to integrate signals within the OFC and use them to gate OFC output. Specifically, we hypothesize that NS1 cells play a key role in selecting between “inhibitory” and “excitatory” influences of OFC on behavior (Figure 8
). Increased activation of NS1 neurons, i.e., increased FS mediated inhibition within OFC, would tend to favor “inhibitory” effects on behavior (slowed response latency with lowered outcome expectancy) while decreased NS1 activation should favor “excitatory” output (speeded response with heightened outcome expectancy). A specific prediction of this hypothesis is that there should be two or more populations of pyramidal neurons that receive opposite influences from NS1 neurons according to their output target and function. Similarly, NS1 neurons could also regulate tradeoffs in a variety of functions in which OFC output is implicated: exploration vs. exploitation in foraging (Daw et al., 2006
), high vs. low risk (Tobler et al., 2007
), and long vs. short time scale of reward discounting (Roesch et al., 2006
). In future experiments, the role of NS1 activity in mediating the expression of motivational state can be tested using optogenetic methods to selectively target and stimulate this specific population of neurons during behavioral performance.
The functional properties of NS1 neurons take on heightened relevance in light of the finding that ketamine strongly inhibited this class of cells. Several prominent theories (e.g., Lewis and Moghaddam, 2006
) hypothesize that psychosis is associated with a loss of “inhibitory control” within frontal cortex, resulting in disorganized brain states. In addition, we observed a more variable effect of ketamine on the activity of WS cells, which may be due to the fact that there are a number of different kinds of WS cells in the region of OFC from which we were recording, that NMDA receptor subunit composition may differ between NS1 cells and WS cells, or that the local circuit organization in OFC leads to the differential effect of ketamine we observed (e.g., WS cells upstream of NS1 cells are the population of WS cells that are inhibited by ketamine). The dramatic reduction in NS1 activity and variable WS cell response we observed following ketamine administration supports this class of theories. According to the above proposal (Figure 8
), a reduction of NS1 activity associated with acute psychosis or mania would yield a reduced sensitivity to aversive outcomes and a hyperexcitable motivational state (“positive symptoms”). On the other hand, enhancement of NS1 activity would be associated with a loss of motivational drive, a behavioral phenotype associated with “negative symptoms” and depressed brain states. The ability of ketamine to reduce the activity of a hyper-excitable network of FS (NS1) cells could account for the recently observed therapeutic benefit of acute ketamine treatment on intractable depression (Berman et al., 2000
; Zarate et al., 2006
; Maeng et al., 2008
). While the complex relationship of brain function to psychiatric disease are undoubtedly a great deal more complex than this simple account, this hypothesis may provide a useful framework for further attempts to understand the link between prefrontal neural circuits and psychiatric phenotypes.
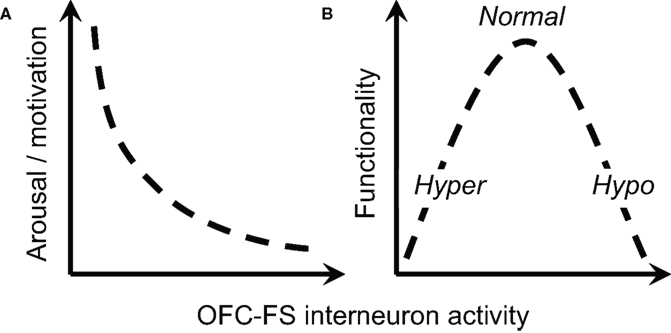
Figure 8. Proposed role of OFC interneurons in regulation of behavior. (A) The activity of OFC–FS type interneurons is negatively correlated with level of arousal or motivation, as indicated by correlations between NS1 firing and response latency. (B) An intermediate level of activity of OFC–FS interneurons is expected to be associated with optimal behavioral functionality, with too low levels of interneuron leading to symptoms associated with hyperarousal (e.g., mania, positive symptoms) and too high levels leading to symptoms of hypoarousal (e.g. depression, negative symptoms).
Michael C. Quirk is currently employed at AstraZeneca Pharmaceuticals working on drug discovery programs in psychiatry. All work in present manuscript was conducted prior to joining AstraZeneca.
Funding support from NARSAD (ZFM).
The Supplementary Material for this article can be found online at http://www.frontiersin.org/systemsneuroscience/paper/10.3389/neuro.06/013.2009/
Ascoli, G. A., Alonso-Nanclares, L., Anderson, S. A., Barrionuevo, G., Benavides-Piccione, R., Burkhalter, A., Buzsáki, G., Cauli, B., Defelipe, J., Fairén, A., Feldmeyer, D., Fishell, G., Fregnac, Y., Freund, T. F., Gardner, D., Gardner, E. P., Goldberg, J. H., Helmstaedter, M., Hestrin, S., Karube, F., Kisvárday, Z. F., Lambolez, B., Lewis, D. A., Marin, O., Markram, H., Muñoz, A., Packer, A., Petersen, C. C., Rockland, K. S., Rossier, J., Rudy, B., Somogyi, P., Staiger, J. F., Tamas, G., Thomson, A. M., Toledo-Rodriguez, M., Wang, Y., West, D. C., and Yuste, R. (2008). Petilla terminology: nomenclature of features of GABAergic neurons of the cerebral cortex. Nat. Rev. Neurosci. 9, 557–568.