Working memory performance correlates with prefrontal-hippocampal theta interactions but not with prefrontal neuron firing rates
1
Seamans Laboratory, Department of Psychiatry, Brain Research Center, University of British Columbia, Vancouver, BC, Canada
2
Hasselmo Laboratory, Department of Psychology, Center for Memory and Brain, Boston University, Boston, MA, USA
Performance of memory tasks is impaired by lesions to either the medial prefrontal cortex (mPFC) or the hippocampus (HPC); although how these two areas contribute to successful performance is not well understood. mPFC unit activity is temporally affected by hippocampal-theta oscillations, with almost half the mPFC population entrained to theta in behaving animals, pointing to theta interactions as the mechanism enabling collaborations between these two areas. mPFC neurons respond to sensory stimuli and responses in working memory tasks, though the function of these correlated firing rate changes remains unclear because similar responses are reported during mPFC dependent and independent tasks. Using a DNMS task we compared error trials vs. correct trials and found almost all mPFC cells fired at similar rates during both error and correct trials (92%), however theta-entrainment of mPFC neurons declined during error performance as only 17% of cells were theta-entrained (during correct trials 46% of the population was theta-entrained). Across the population, error and correct trials did not differ in firing rate, but theta-entrainment was impaired. Periods of theta-entrainment and firing rate changes appeared to be independent variables, and only theta-entrainment was correlated with successful performance, indicating mPFC-HPC theta-range interactions are the key to successful DNMS performance.
Working memory tasks require an organism to keep acute, trial specific information online, while simultaneously maintaining longer-term, consistent information about the nature of the task (including the rules, timing and environment of the task). To be successful the agent, or organism, must combine these two types of information by first encoding and later utilizing the trial specific information at precisely the right time in the task (Zilli and Hasselmo, 2008
). It remains unclear how exactly the brain encodes, integrates and implements these two streams of information, but evidence has shown integral involvement of both the hippocampus (HPC) and prefrontal cortex for proper working memory task performance (Jacobsen, 1936
; Brown and Bowman, 2002
; Chudasama and Robbins, 2004
; Eichenbaum, 2004
; Lee et al., 2004
). The medial prefrontal cortex (mPFC) and HPC share dense reciprocal connections through the mediodorsal thalamus (Vertes, 2006
), and also have an excitatory monosynaptic connection originating in ventral CA1/subiculum (Laroche et al., 1990
; Thierry et al., 2000
). Lesions to the HPC and/or the mPFC impaired performance on the two lever delayed non-match to sample (DNMS) tasks in rodents (Porter et al., 2000
). Furthermore, when plasticity of the direct connections from HPC to mPFC was disrupted a similar decrease in working memory performance was observed (Laroche et al., 2000
). In human subjects, fMRI data show simultaneous prefrontal and HPC activation during working memory tasks (Stern et al., 2001
; Schon et al., 2005
). Non-human primate and rodent unit recordings have revealed that neurons respond to trial specific and task universal stimuli and behaviors in both the prefrontal cortex (Fuster, 1973
; Jung et al., 1998
; Takeda and Funahashi, 2002
; Baeg et al., 2003
) and the HPC (Wible et al., 1986
; Eichenbaum et al., 1987
; Hampson et al., 1993
, 2004
). Given that both areas contain representations of the two types of information necessary to complete such tasks, the question is how do these two areas work together and enable successful performance?
Gray (1994)
suggested that coherent local field potentials (LFP) could facilitate interactions between different neural areas, and in vivo recordings and neural network models have since supported this idea (Seidenbecher et al., 2003
; Hasselmo, 2005
; Hyman et al., 2005
; Jones and Wilson, 2005a
,b
). Within this framework, reductions of LFP signals in HPC or mPFC, or ipsilateral cross combinations of the two, significantly impaired working memory performance (Wang and Cai, 2006
). Data from human studies and animal models have suggested that important working memory related mPFC-HPC interactions occur via coherent theta range oscillations (3–10 Hz; Jones and Wilson, 2005a
,b
; Onton et al., 2005
). The discovery of hippocampal-theta entrained mPFC cells demonstrated a functional theta band connection between mPFC and HPC (Siapas et al., 2005
). mPFC unit hippocampal-theta-phase locking is sensitive to sensory, behavioral and environmental changes, as units alternated between theta-entrained and non-phasic firing depending on the behavioral context (Hyman et al., 2005
). During a working memory task, these interactions were greatest just before a decision was made and decreased at the decision point when errors were made (Jones and Wilson, 2005a
).
The rodent mPFC is necessary for successful performance of working memory, conflict and set-shifting tasks (Seamans et al., 1995
; Mair et al., 1998
; Birrell and Brown, 2000
; Haddon and Killcross, 2006
). However, mPFC units are very responsive to sensory stimuli and behavioral responses in both working memory and simpler, mPFC-independent, tasks like the T-maze (Jung et al., 1998
; Baeg et al., 2003
), simple operant conditioning (Mulder et al., 2003
) and during linear track running for reward (Hyman et al., 2005
). Because mPFC units have behaviorally correlated activity in non-mPFC dependent tasks, the relationship between mPFC firing rate changes and behavior is ambiguous. To examine the respective roles of hippocampal-theta entrainment of mPFC cells and correlated mPFC firing rate changes in working memory performance, we recorded individual units in mPFC and LFP in the HPC during a DNMS task.
Subjects
Three adult male Long Evans rats, obtained from Charles River (Wilmington, MA, USA) participated in this experiment. The animals were individually housed and kept in a 12-h light/dark cycle with water available ad libitum. During training and after recovery from surgery animals were maintained at 90% free-feeding weight.
Surgery
Animals were deeply anesthetized under isofluorane gas and pretreated with atropine (0.1 mg/kg) to prevent excessive salivation. Rats were placed in a David Kopf stereotaxic frame, and holes were drilled into the skull using a David Kopf stereotaxic drill. Four tetrode bundles (25-μm Formvar coated tungsten wire) in a moveable drive mechanism were implanted into medial prefrontal cortex (targeting the prelimbic region; 3.4-mm AP; 0.5-mm ML), another four moveable tetrodes (25-μm Formvar coated tungsten wire) were implanted into the HPC (−3.6-mm AP; 2.5-mm ML). The hyperdrive was mounted to skull screws using dental acrylic and then shielded in plastic sheeting. The recording wires were connected to a 56 pin EIB (electrode interface board, Neuralynx, Inc., Phoenix, AZ, USA), which was affixed to the plastic shielding. Following surgery, animals were given non-steroidal oral antibiotics and analgesics as needed. Animals were given at least one week of recovery before recordings.
Electrophysiology
The tungsten recording wires passed the signal through preamplifier FETs (NB Labs, Denison, TX, USA) and an amplifier (Neuralynx Inc., Tucson, AZ, USA) before being passed to a Data Translation (Marlboro, MA, USA) A/D board for storage by Sciworks software (from DataWave Technologies, Boulder, CO, USA) running on a PC workstation. Unit recordings were bandpass filtered between 600–6000 Hz and field channels were bandpass filtered between 1–475 Hz. After recovery from surgery, hippocampal wires were slowly lowered until hippocampal ripples were present. After it was confirmed that the wires were in the HPC, local field potential recordings were made. Medial prefrontal tetrodes were moved down near the border between anterior cingulate cortex and the prelimbic cortex, and then small movements were made to maximize the number of units recorded by each tetrode. Tetrodes were moved in between sessions, so all data reported here comes from recording locations separated by at least 150 μm. Multi-unit files were sorted using cluster cutting techniques in Offline Sorter (Plexon Inc., Dallas, TX, USA). If clusters were impossible to disambiguate into individual cells, those data were not included in any further analysis. LEDs were mounted to the headstage cable and position data was recorded for offline analysis using Sciworks software (from DataWave Technologies, Boulder, CO, USA).
Histology
After each animal had completed the experiment they were deeply anesthetized under halothane gas, and electrolytic lesions were created at each electrode location. Animals were then perfused with a solution containing 25 parts 10% buffered formalin, 1 part glacial acetic acid, and 10 g of potassium ferrocyanide. This solution causes a Prussian blue reaction, which marks with blue the location of the iron particles deposited by the electrode lesion. The brains were then removed and stored in a 10% buffered formalin solution for about 1–2 weeks. After this time, the brains were then sliced, mounted, and stained with neutral red to determine precise electrode locations. In all cases hippocampal implant tracks went into CA1 and terminated near the hippocampal fissure. Since multiple sessions were recorded from individual animals, the precise recording locations could not be derived from electrode lesions from the prefrontal cortex tetrodes, but all electrode tracks were in the medial prefrontal cortex. Using records of driver lowerings we were able to confirm that most recordings reported here were made in the prelimbic area of the mPFC.
Behavior
Structure of delayed non-match to position task
Animals were run on an apparatus that contains a panel with two retractable operant levers (see Figure 1
A). Situated between the levers was a spout out of which reinforcement pellets (Research Diets Inc., New Brunswick, NJ, USA) were delivered. The two levers were 5′′ from the base of the 21′′ × 12′′ open platform, and were situated 6′′ apart. At the opposite side of the platform from the lever panel was a 3′′ wide runway. This runway had a nose-poke panel at the end, which had an opening with a photocell monitoring “pokes”, and 4′′ above the nose-poke opening was a stimulus light. The nose-poke panel was moveable on the runway (to between 16′′and 48′′ from the levers) to control the amount of delay period within each trial (see below).
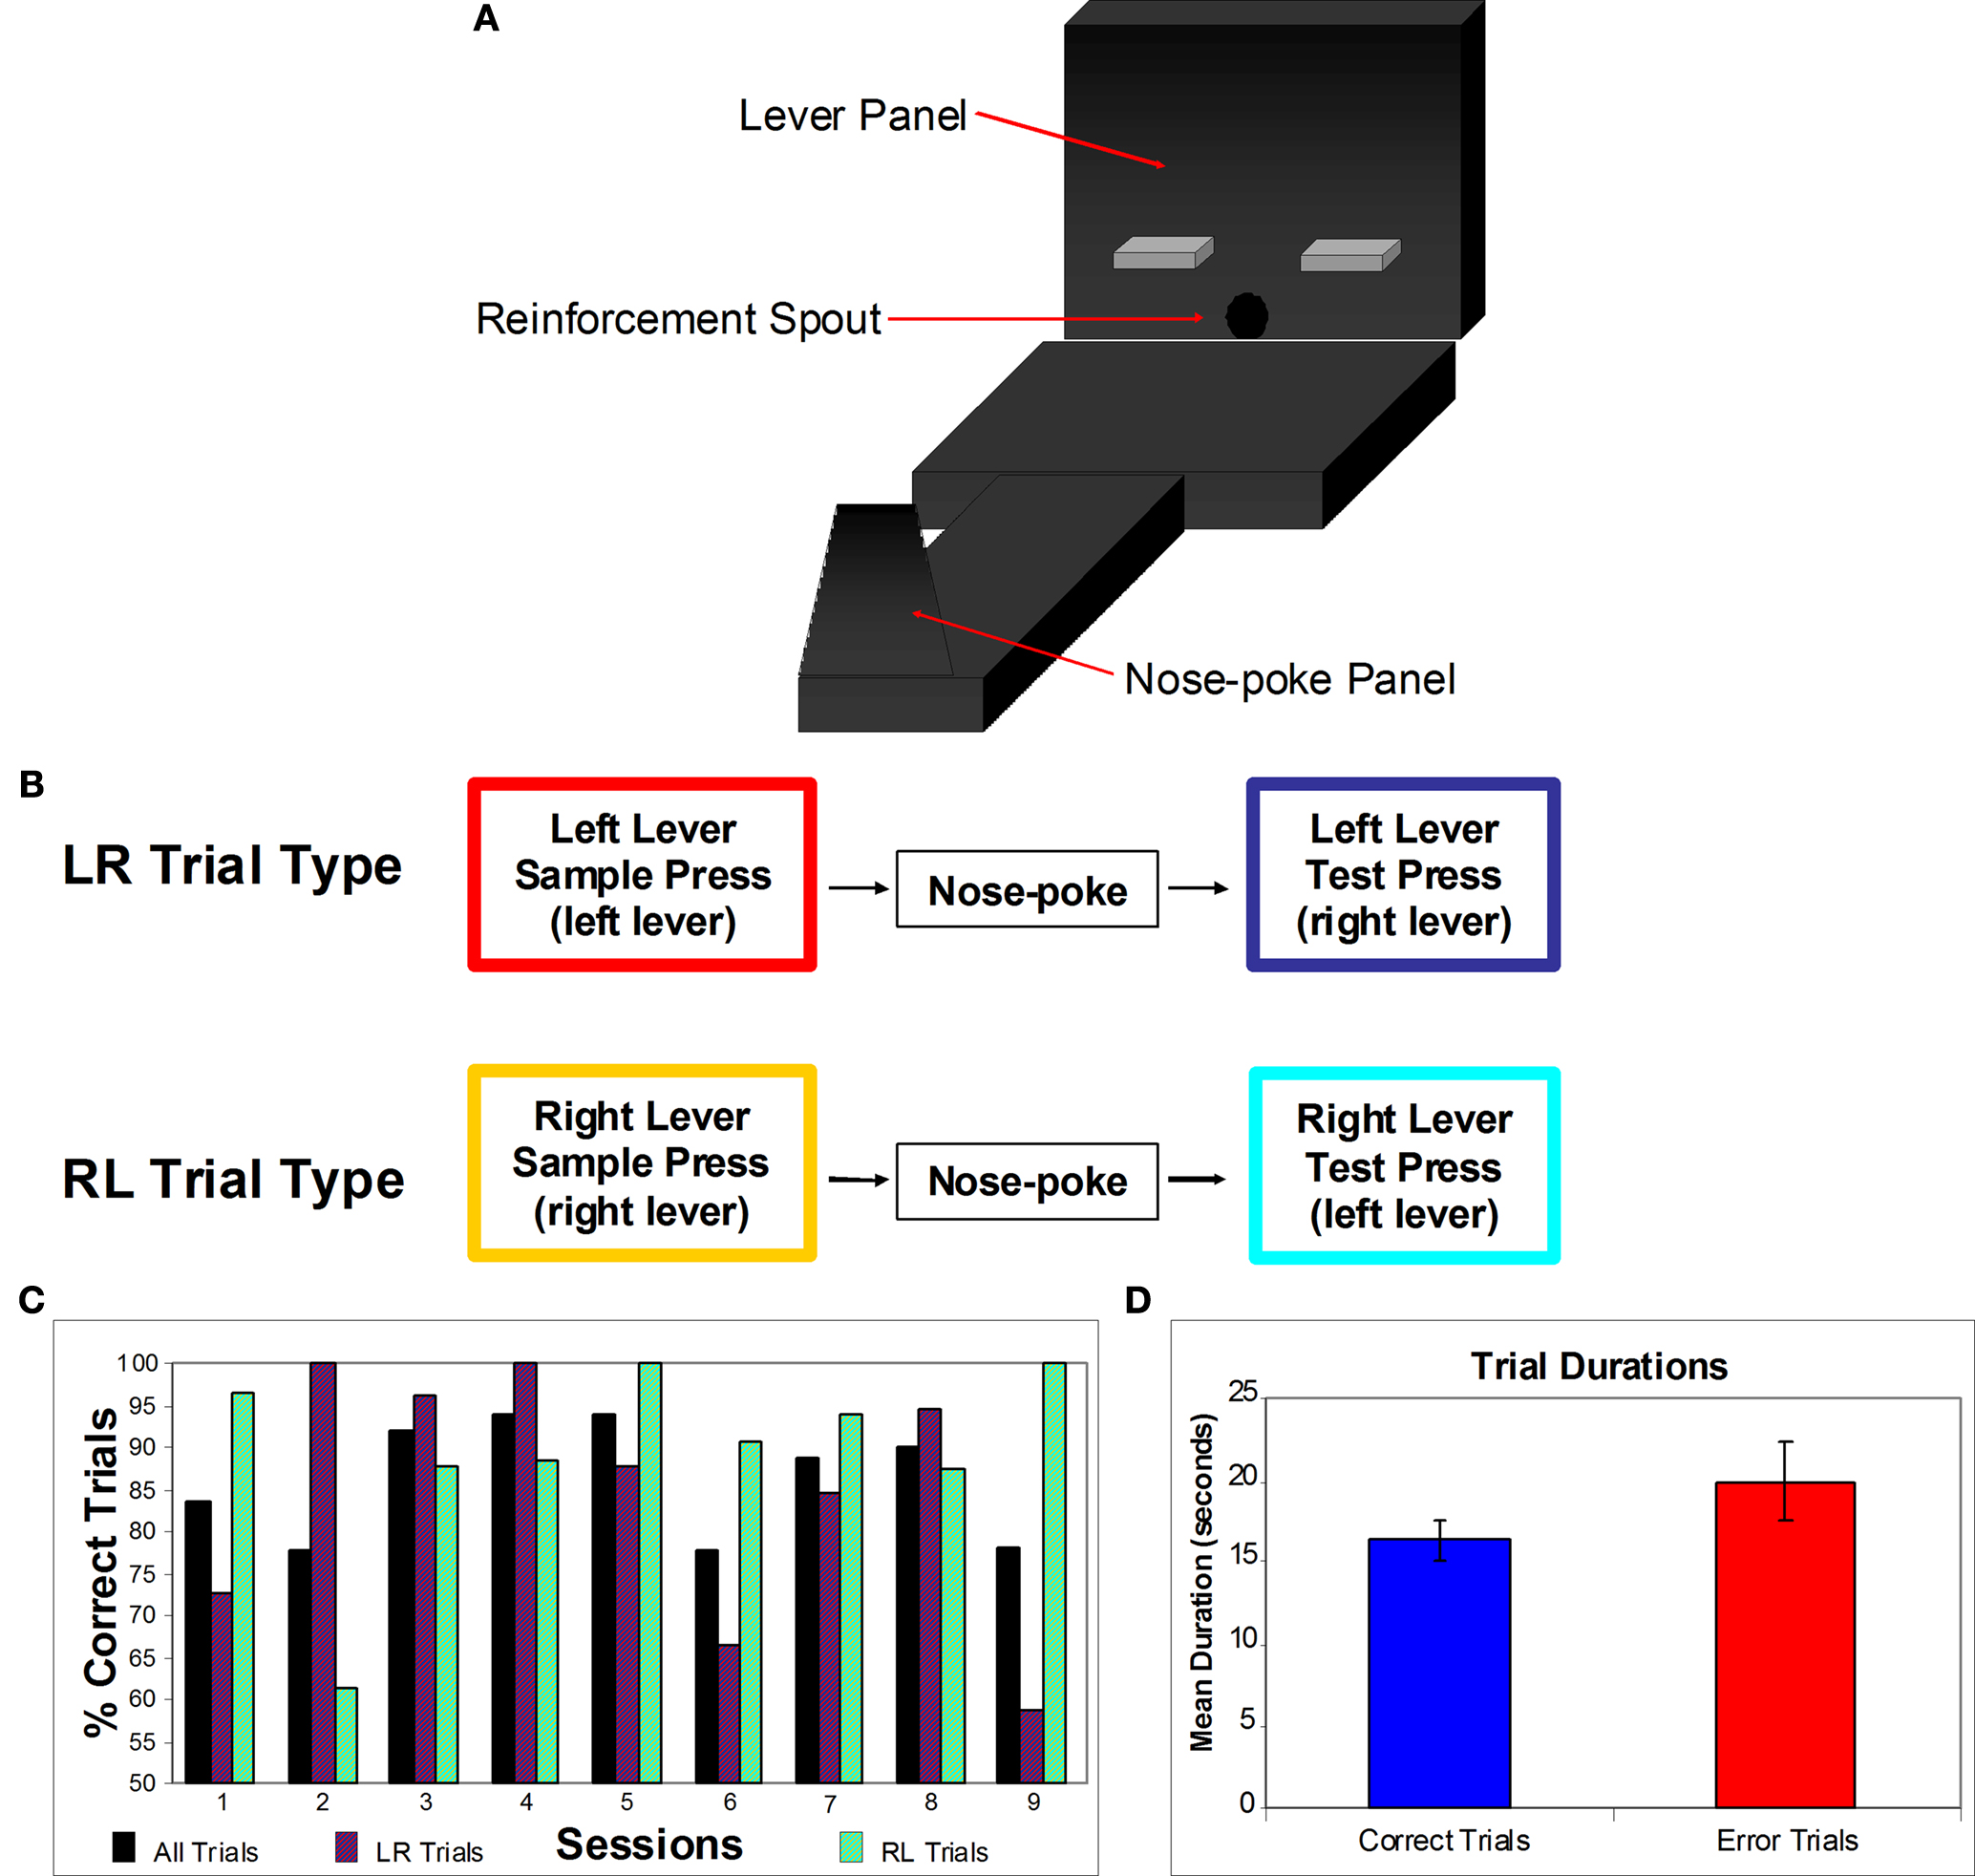
Figure 1. (A) DNMS Task apparatus. Each trial began with a single lever being exposed. When the animal pressed the lever it retracted and a light turned on on the nose-poke panel. The animal then needed to turn and run down the runway to nose-poke, this turned off the light and both levers were extended. The rat then ran back to the lever panel and needed to press the lever not presented during the sample stage. (B) Diagram of the two trial types. For a LR trial, the sample lever press was made on the left lever and the correct test lever press was made on the right lever. For a RL trial, the sample lever press was made on the right lever and the correct test lever press was made on the left lever. (C) Behavioral performance. Percentages of correct trials for all trials and both individual trial types. (D) Mean trial durations. Correct and error trial mean durations and standard errors. No significant difference was found in trial duration between correct and errors.
Trials went as follows: (1) A single lever was exposed (for this example the right lever; an RL trial) during the sample stage. The animal approached and depressed this lever. (2) Once the sample lever was pressed it retracted, and the light above the nose-poke chamber turned on. The animal turned from the lever panel and went down the runway and then made a nose-poke into the port. (3) Once the nose-poke had been made, the nose-poke light turned off, and both levers were extended from the lever panel. The animal approached the levers and depressed the opposite lever from the sample stage (in this example the correct choice would be the left lever). (4) After making the correct lever press, the animal received a reinforcement pellet through the reinforcement spout. A lever press to either the correct or incorrect lever caused both levers to retract. (5) At this point the current trial was over, and if the response was correct, after a 10-s inter-trial interval a new sample lever was presented. After each trial, correct or error, the sample lever on the next trial was selected randomly.
To teach the animals the DNMS task, they were first trained to nose-poke for reinforcement pellets. Next, animals were trained to lever press with both levers extended, and pressing either lever triggered reinforcement pellet delivery followed by retraction of both levers. The animals then needed to turn around and nose-poke to re-extend the levers. This nose-poke was rewarded only until the animals performed it quickly. In the third phase, only a single lever was extended and then retracted after the lever press when a reinforcement pellet was delivered. The animals then needed to nose-poke to extend the opposite lever, and this continued with the two levers presented in an alternating fashion. For the next phase of training, the animals were presented with a single sample lever, then, following a nose-poke, both levers extended, but only depressing the non-matching lever lead to reinforcement delivery. For the next training phase, the sample lever was no longer rewarded. Then the nose-poke panel was incrementally moved further down the runway, increasing the delay period. Animals continued training during sessions with the nose-poke panel at its furthest distance from the lever panel until the animal met the behavioral criterion. The criterion required the completion of at least 40 total trials and at least 85% accuracy during a single DNMS session. After the first criterion session, animals underwent the implant surgery and were allowed 7–10 days of recovery. Animals were then given refresher DNMS sessions (1–3 sessions) until criterion performance returned, after which recording sessions began.
Error trial classification
While all data used in this study came from well-trained animals, in a number of sessions animals had sufficient errors to allow for further analysis of error trials. Trials were classified as correct or errors depending on whether the opposite (correct trials) or same lever (error trials) as the sample lever was depressed during the test stage. Sessions selected for comparisons of neuronal activity for correct vs. error trials needed to have at least 5% incorrect trials for one specific lever trial type, while maintaining overall performance better than 75% (Figure 1
C). For firing rate and theta-entrainment analyses, trials were subdivided into sample and test periods. Analysis cases compared, for example, activity during correct vs. incorrect LR sample stages, instead of comparing correct vs. incorrect LR trials as a whole.
Data Analysis
Theta analysis and phase estimations
Individual unit spike times and raw local field potential data were read into Matlab (Mathworks, Natick, MA, USA) for further analysis. Theta periods were identified by first bandpass filtering the hippocampal LFP record between 3 and 10 Hz using a bi-directional Butterworth filter. Local minima and maxima were identified in the LFP. A theta period was selected as a period of three consecutive trough/peak pairs occurring with amplitude greater than negative/positive thresholds (adapted from Berke et al., 2004
). We first calculated the power spectrum maximum value from the running period following the first sample lever press (ts) and the consumption period after the first reinforcement delivery (tr). Thresholds were then determined by calculating ∇ = (ts–tr)/2 (generally ∼1/3 of the power spectrum maximum for the entire session), and were then confirmed by eye. Phases relative to the theta oscillation were estimated linearly between positive-going zero crossings in the LFP (e.g., the time point halfway between two positive-going zero crossings was considered 180°; Jones and Wilson, 2005a
,b
; Siapas et al., 2005
). Phase distributions were then tested for non-uniformity using Rayleigh’s statistic (Z = 2nR2), where n equals the number of spikes and R is the mean resultant length (the magnitude of the vector that results when each spike is represented as a vector on the unit circle whose angle relative to some fixed point is given by the spike’s theta phase and the vectors are all summed together). Mardia and Jupp (2000)
showed that when n > 25, Z is distributed approximately as the chi-squared distribution with 2 degrees of freedom. For the current analysis at least 25 spikes needed to occur during theta periods within the trial periods.
Time periods analyzed for theta-entrainment
Because theta detection was limited to only the brief periods around lever presses that featured high levels of behavioral activity, generally the entire periods analyzed were constituted of theta oscillations that met the criterion (∼95% of the time analyzed). The sample period consisted of 3 s prior to sample lever press and up until the nose-poke, while the test period went from the nose-poke until 3 s after test lever press. For each session the correct trial duration (time between sample and test responses) mean and standard deviation were computed. Error trials with durations 2 standard deviations longer than the correct trial mean duration were excluded from all analysis (31% of all error trials). To account for any behavioral differences that may have occurred during error trials with qualifying durations, phasic firing was only examined for 3 s before and up to 10 s after the sample lever press. If the animal nose-poked before 10 s timed out, then the period examined went for 3 s before the lever press up until then. Behaviorally-correlated periods time-locked to lever presses were used when analyzing firing rate (detailed below).
Firing rate and theta-entrainment differences between correct vs. error trials
To compare firing rate changes for individual neurons, Kruskal-Wallis (KW) non-parametric ANOVAs (with the Bonferroni correction) were computed, comparing firing rates during the sample lever press in correct trials to firing rates during sample lever presses in error trials, for the same trial type (test lever presses were analyzed similarly). To examine the differences in firing rate across the whole population, cumulative density functions of mean firing rates were constructed and Kolmogorov-Smirnov (KS) tests of goodness of fit were conducted on these functions, comparing correct vs. error trials.
Rayleigh’s test of uniformity is the common test used to determine significant theta-entrainment of unit activity, but this test is more likely to give false negatives when the sample size is smaller. Since animals made significantly fewer error trials than correct trials, we wanted to ensure the effects we report were not due to this difference in n alone. To combat this we used a two step process to determine significant theta-entrainment during error trials. The first step was the standard Rayleigh’s test of uniformity (detailed above). For the second step we attempted to analyze how different the mean resultant length (MRL) calculated from error trial spiking activity was from the MRLs computed during correct trials of the same trial type. We constructed a Monte Carlo-like distribution of the correct MRLs from the equivalent number of trials as error trials. If a session featured 30 correct trials and 6 error trials on one trial type, we would randomly take 6 of the correct trials and compute the MRL. The process was repeated up to 1000 times and a distribution of correct trial MRLs was constructed, and we then examined whether the error trial MRL fell into one of the two tails of the distribution. For some sessions it was not possible to examine 1000 unique correct trial MRLs over the same number of correct as error trials. In these cases, we used a minimum of 660 unique repetitions. Cells were considered to be not theta-entrained during error trials if the Rayleigh’s test was not significant and the error trial MRL fell into the bottom tail of the correct trial MRL distribution matched for trial number (at the probability level of p < 0.05). If a cell was significantly entrained according to Rayleigh’s test on both correct and error trials but the error trial MRL was significantly different from the correct trial MRL distribution, the cell was classified as error trial theta-entrained if the error MRL was in the top tail of the distribution (indicating the cell was significantly entrained during both correct and error trials, but fired with even higher phase specificity on error trials). If the cell fired theta-entrained during error trials and not during correct trials, the error trial MRL needed to fall in the top tail of the correct trial MRL distribution (p > 0.95). To analyze theta-entrainment across the full population of mPFC cells during error and correct trials, we constructed cumulative density functions of MRLs and performed the KS test.
For cells that were theta-entrained during correct trials or during error trials, the MRLs and firing rates were compared with Spearman rank correlations, across error and correct trials respectively. This analysis examined the relative variance of firing rates (rate code) and theta-entrainment (phase code) between correct and error trials.
To increase the sample size of correct vs. error cases, sample and test stage cases were combined for group statistics due to the overwhelming uniformity of the results (further detailed below).
Comparison of sample and test stage theta-entrained cases for correct vs. error trials
During the sample stage of all trials only a single lever was presented so it was not possible for any incorrect responses to occur, and a trial could not be correct or not until the subsequent test stage lever press. Thus behavior was practically identical during sample stages for both correct and error trials, while test stage responses were made to different levers for correct and error trials. Because of this it was impossible to rule out spatial, path direction or other behavioral variability affecting spiking activity on test stage response between correct and error trials. To control for this we performed a detailed analysis comparing theta-entrainment and firing rate differences of sample and test stage for all cells during correct and error trials, and for only the cases of significant theta-entrainment on the low performance trial type. Spearman’s rank correlation coefficients examined relative changes in MRLs and firing rates. To assess population differences we compared means with ANOVAs and KWs. To further ensure test stage differences or similarities were not due solely to behaviorally variability, test stage error MRLs and firing rates were compared to correct trial test stage activity for the opposite trial type. For example, on LR error trials incorrect responses were compared with RL correct responses (in both instances the left lever was depressed during the test stage).
Classification of behavioral correlates of unit activity
Every behavioral response was recorded by Sciworks and stored for later analysis (including sample stage lever press, nose-pokes, and test stage lever press). Sciworks also recorded every experimental event (including turning on/off of nose-poke stimulus light, time levers were extended/retracted, and the time of reinforcement delivery). All this information was acquired at a sampling rate of 100 Hz. Timestamps for the four different types of lever presses (LR sample, LR test, etc.; see Figure 1
B) were used to create perievent histograms using Neuroexplorer software (Plexon Inc., TX, USA). Spike data was read into Matlab (Mathworks, MA, USA) and then binned (250 ms). Mean firing rates were computed for the period of time around the lever press (2.5 s before and after).
For each of the four different lever press types (LR sample, RL sample, LR test, RL test) there were a total of 20 mean firing rates that were then used for comparative analysis between trial types. 4 × 5 two-factor ANOVAs were computed with trial type and time around lever press as main factors (for time around lever press the 5-s block was separated into 1-s periods; each 1-second period consisted of 4 mean firing rate bins). If a significant main effect for category type (p < 0.01) was found the firing rates were further analyzed using KW non-parametric one-way ANOVAs (with the Bonferroni correction) to determine the behavioral correlates. The KW test is more appropriate for analysis of non-normally distributed data, like neuronal firing rates, but does not allow for examination of temporal discharge patterns around each lever press as it is only a one-way ANOVA. In total four KWs were calculated comparing mean firing rates for the time period around the lever presses.
A wide array of temporal differences were observed in peak firing during a behavioral event and most mPFC cells displayed unique response patterns for the four different trial stage types. For example, some neurons fired at peak rates 500 ms before the lever press and then were inhibited just following the lever press, while other neuronal firing rates peak 500 ms after the lever press, and others peaked a couple of seconds before or after the lever press (see Figure 5
). However, mPFC cells in the DNMS task appeared to encode much more than just a single phase and/or trial behavioral event type; most cells fired differentially to all trial types and responded during different periods for different trials types. For these reasons and the temporal distinctions discussed above, cells were grouped into three general categories: (1) trial stimulus specific; (2) task stage; and (3) task stage with stimulus sub-specificity. Cells were classified based upon results from the four KW ANOVAs that contrasted the following: LR sample versus RL sample; LR test versus RL test; LR sample versus LR test; and RL sample versus RL test.
Analysis of hippocampal-theta rhythm during error and correct trials
We analyzed theta power in the local field potential of the HPC to determine if changes in hippocampal-theta rhythm power could account for differences seen in mPFC unit theta-entrainment for error vs. correct trials. Local field potential data was read into Matlab and multi-taper spectral analyses were computed. Then, paired t-tests were conducted on theta band activity (4–10 Hz) comparing the trial stage matched correct vs. error periods (p < 0.05).
Behavior
Animals progressed through the training phases at different rates, but all animals reached criterion within 30 total training sessions (mean = 26 sessions). A total of 15 DNMS sessions were recorded, but generally animals were quite proficient at the task and only 9 sessions met the qualification for error vs. correct analysis (< 95% correct for a trial type while maintaining > 75% overall accuracy). This criterion ensured that there were sufficient error trials for accurate analysis of firing rates and theta-entrainment, while also demonstrating ample competence on the task. Figure 1
C shows the level of overall performance and individual trial type performance for each of the 9 sessions. While during most sessions many more errors were made on a single trial type, 2 sessions contained enough errors on both trials for further analysis (from 2 different subjects). In total there were 22 trial type – and phase-matched error vs. correct comparison cases. An ANOVA comparing correct and error trial durations did not find any significant difference in trial duration (Figure 1
D; error trials with durations greater than 2 standard deviations above mean correct durations were excluded from all analyses).
Theta Power during Error and Correct Trials
Paired t-tests were conducted on power in the theta band (4–10 Hz) for correct and error periods during equivalent task periods. Four out of 22 t-tests detected significant differences in theta power; however the directions of these changes in theta power were not universal. For two out of the four significant t-tests the error trial theta power was greater. Given the uniformity of the effects that error trials had on mPFC theta-entrainment, it is unlikely that these changes in theta power accounted for the observed differences.
Theta-Entrainment of mPFC Cells
Overall, 180 mPFC cells were recorded during 15 sessions in which animals completed enough trials and the recordings met the criteria for unique populations (tetrodes advanced at least 150 μm from previous sessions). Nine sessions featured enough error trials for further analysis and only data from those sessions are discussed here. A total of 117 mPFC cells were recorded during these 9 sessions, however out of these only 74 had enough action potentials during lever presses and hippocampal-theta activity within trials to allow for accurate theta-entrainment and firing rate analysis (see Methods). Since lever press periods analyzed for firing rates generally occurred during high amplitude theta states, the numbers of theta period spikes and lever press spikes were inherently linked. There were 34 cells that fired with significant hippocampal theta-entrainment during correct trials in at least one of the 4 trial stages (LR sample; LR test; RL sample; RL test; see Figure 1
). Thus 47% of analyzable mPFC units displayed theta-entrainment during correct trials. Three of these cells were theta-entrained during all four trial stages. Nine cells were theta-entrained for 3 of 4 trial stages. Seven cells were theta-entrained for 2 of 4 trial stages and 15 cells were theta-entrained for only a single trial stage. There were also 4 cells that were theta-entrained only during error trials, thus a total of 38 out of 74 (51%) mPFC units displayed periods of theta-entrainment. Ninty three percentage of these cells alternated between theta-entrained and non-phasic firing depending on the differing sensory, cognitive or behavioral factors experienced in the four different trial stage types.
Comparison of Sample and Test Stage Theta-Entrained Cases for Correct vs. Error Trials
Analysis of relative changes in theta-entrainment and firing rate of correct vs. error trials for sample cases revealed that theta-entrainment was already significantly altered on error trials before the test stage response when the error was actually made. For the 26 sample stage cases, theta-entrainment was different 92% of the time, while firing rates were mostly similar on error trials (4% significantly different). Comparable effects occurred during test stage cases (18/21 cases in theta-entrainment and 3/21 cases in firing rates had significant changes).
Because the effects on theta-entrainment and firing rate of cells due to trial outcome were consistent and clear, sample and test stage theta-entrained cases were combined to increase the number of cases for population analyses. In almost every case, error trial theta-entrainment was altered while firing rates remained similar. ANOVAs and KW tests found significant differences between sample stage error and correct trial MRLs for the entire recorded population and for theta-entrained cases, but no differences were detected in firing rates for either comparison. Furthermore, sample and test stage activity was significantly correlated for MRL and firing rate for both correct and error trials across all cells and for only theta-entrained cases. We also compared error test stages with correct test stages for the opposite trial type and found significant differences in MRL but not firing rates.
Difference in Theta-Entrainment on Correct vs. Error Trials for Individual Units
During all correct trials 46% (34/74) of all cells were entrained, while on error trials only 17% (13/74) of these cells were entrained. Of the 74 cells with high enough theta firing rates during error-qualifying sessions, 33 cells were significantly theta-entrained during either correct or error trials on the low performance trial type (Rayleigh’s test of uniformity; p < 0.05; see Table 1
). Cells were entrained for one or both of the sample or test stages. To more accurately analyze the changes in theta-entrainment we separated trials into their two stages and considered activity during each stage as a separate case. During two sessions animals made enough errors on both trial types while still maintaining 75% correct overall performance, creating more error vs. correct cases for analysis. In total there were 47 correct vs. error cases of theta-entrained activity examined in which trial type and stage were matched (from 33 cells).
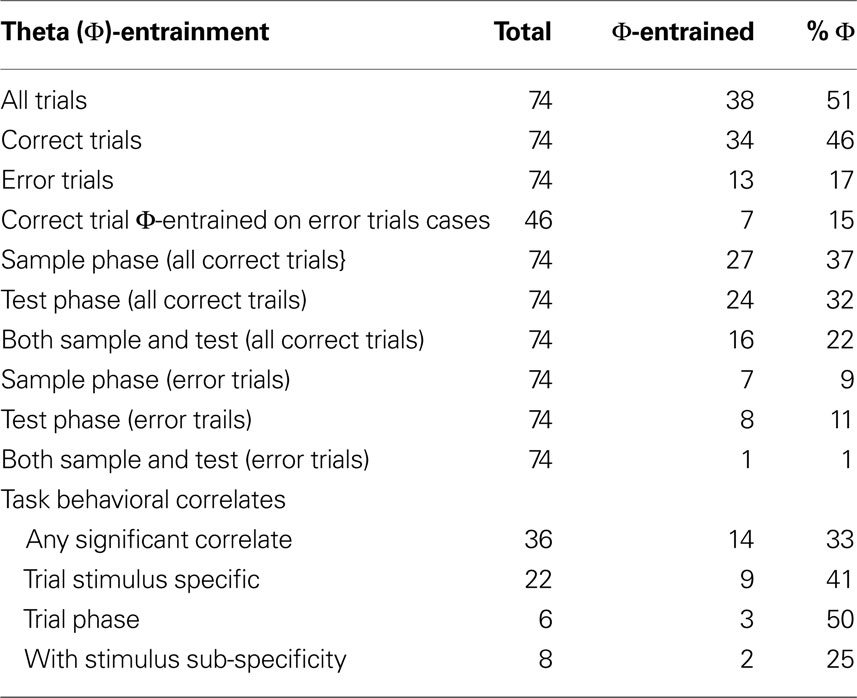
Table 1. Φ-entrainment and task correlates of mPFC neurons during DNMS.
For 43 of 47 cases, cells fired theta-entrained on correct trials, but in only 7 of the 47 cases were cells entrained on error trials. Forty of the Forty three correct trial entrained cases (94%) did not have significant theta-entrainment during error trials (according to both Rayleigh’s test of uniformity and the modified Monte Carlo analysis of MRLs; p < 0.05; see Figure 2
for examples). In 2 of these 3 cases (that cells were entrained during error trials) the error MRL was significantly greater than the correct MRL distribution, indicating significantly altered but increased levels of theta-entrainment (corroborated by increased Rayleigh’s p-value). For three other cases with correct trial entrainment, phase distributions were not uniform during error trials but the modified Monte Carlo analysis indicated that error trial MRLs were not significantly different from correct trial MRLs. There were also four cases (included in the 47 total cases) when cells were not significantly theta-entrained during correct trials but were entrained during the error trials according to both Rayleigh’s test and the modified Monte Carlo analyses. In total, 94% of theta-entrained cells had significantly different MRLs between error and correct trials, and 93% of cells lost significant hippocampal theta-entrainment when errors were committed (according to both Rayleigh’s test and the modified Monte Carlo analysis).
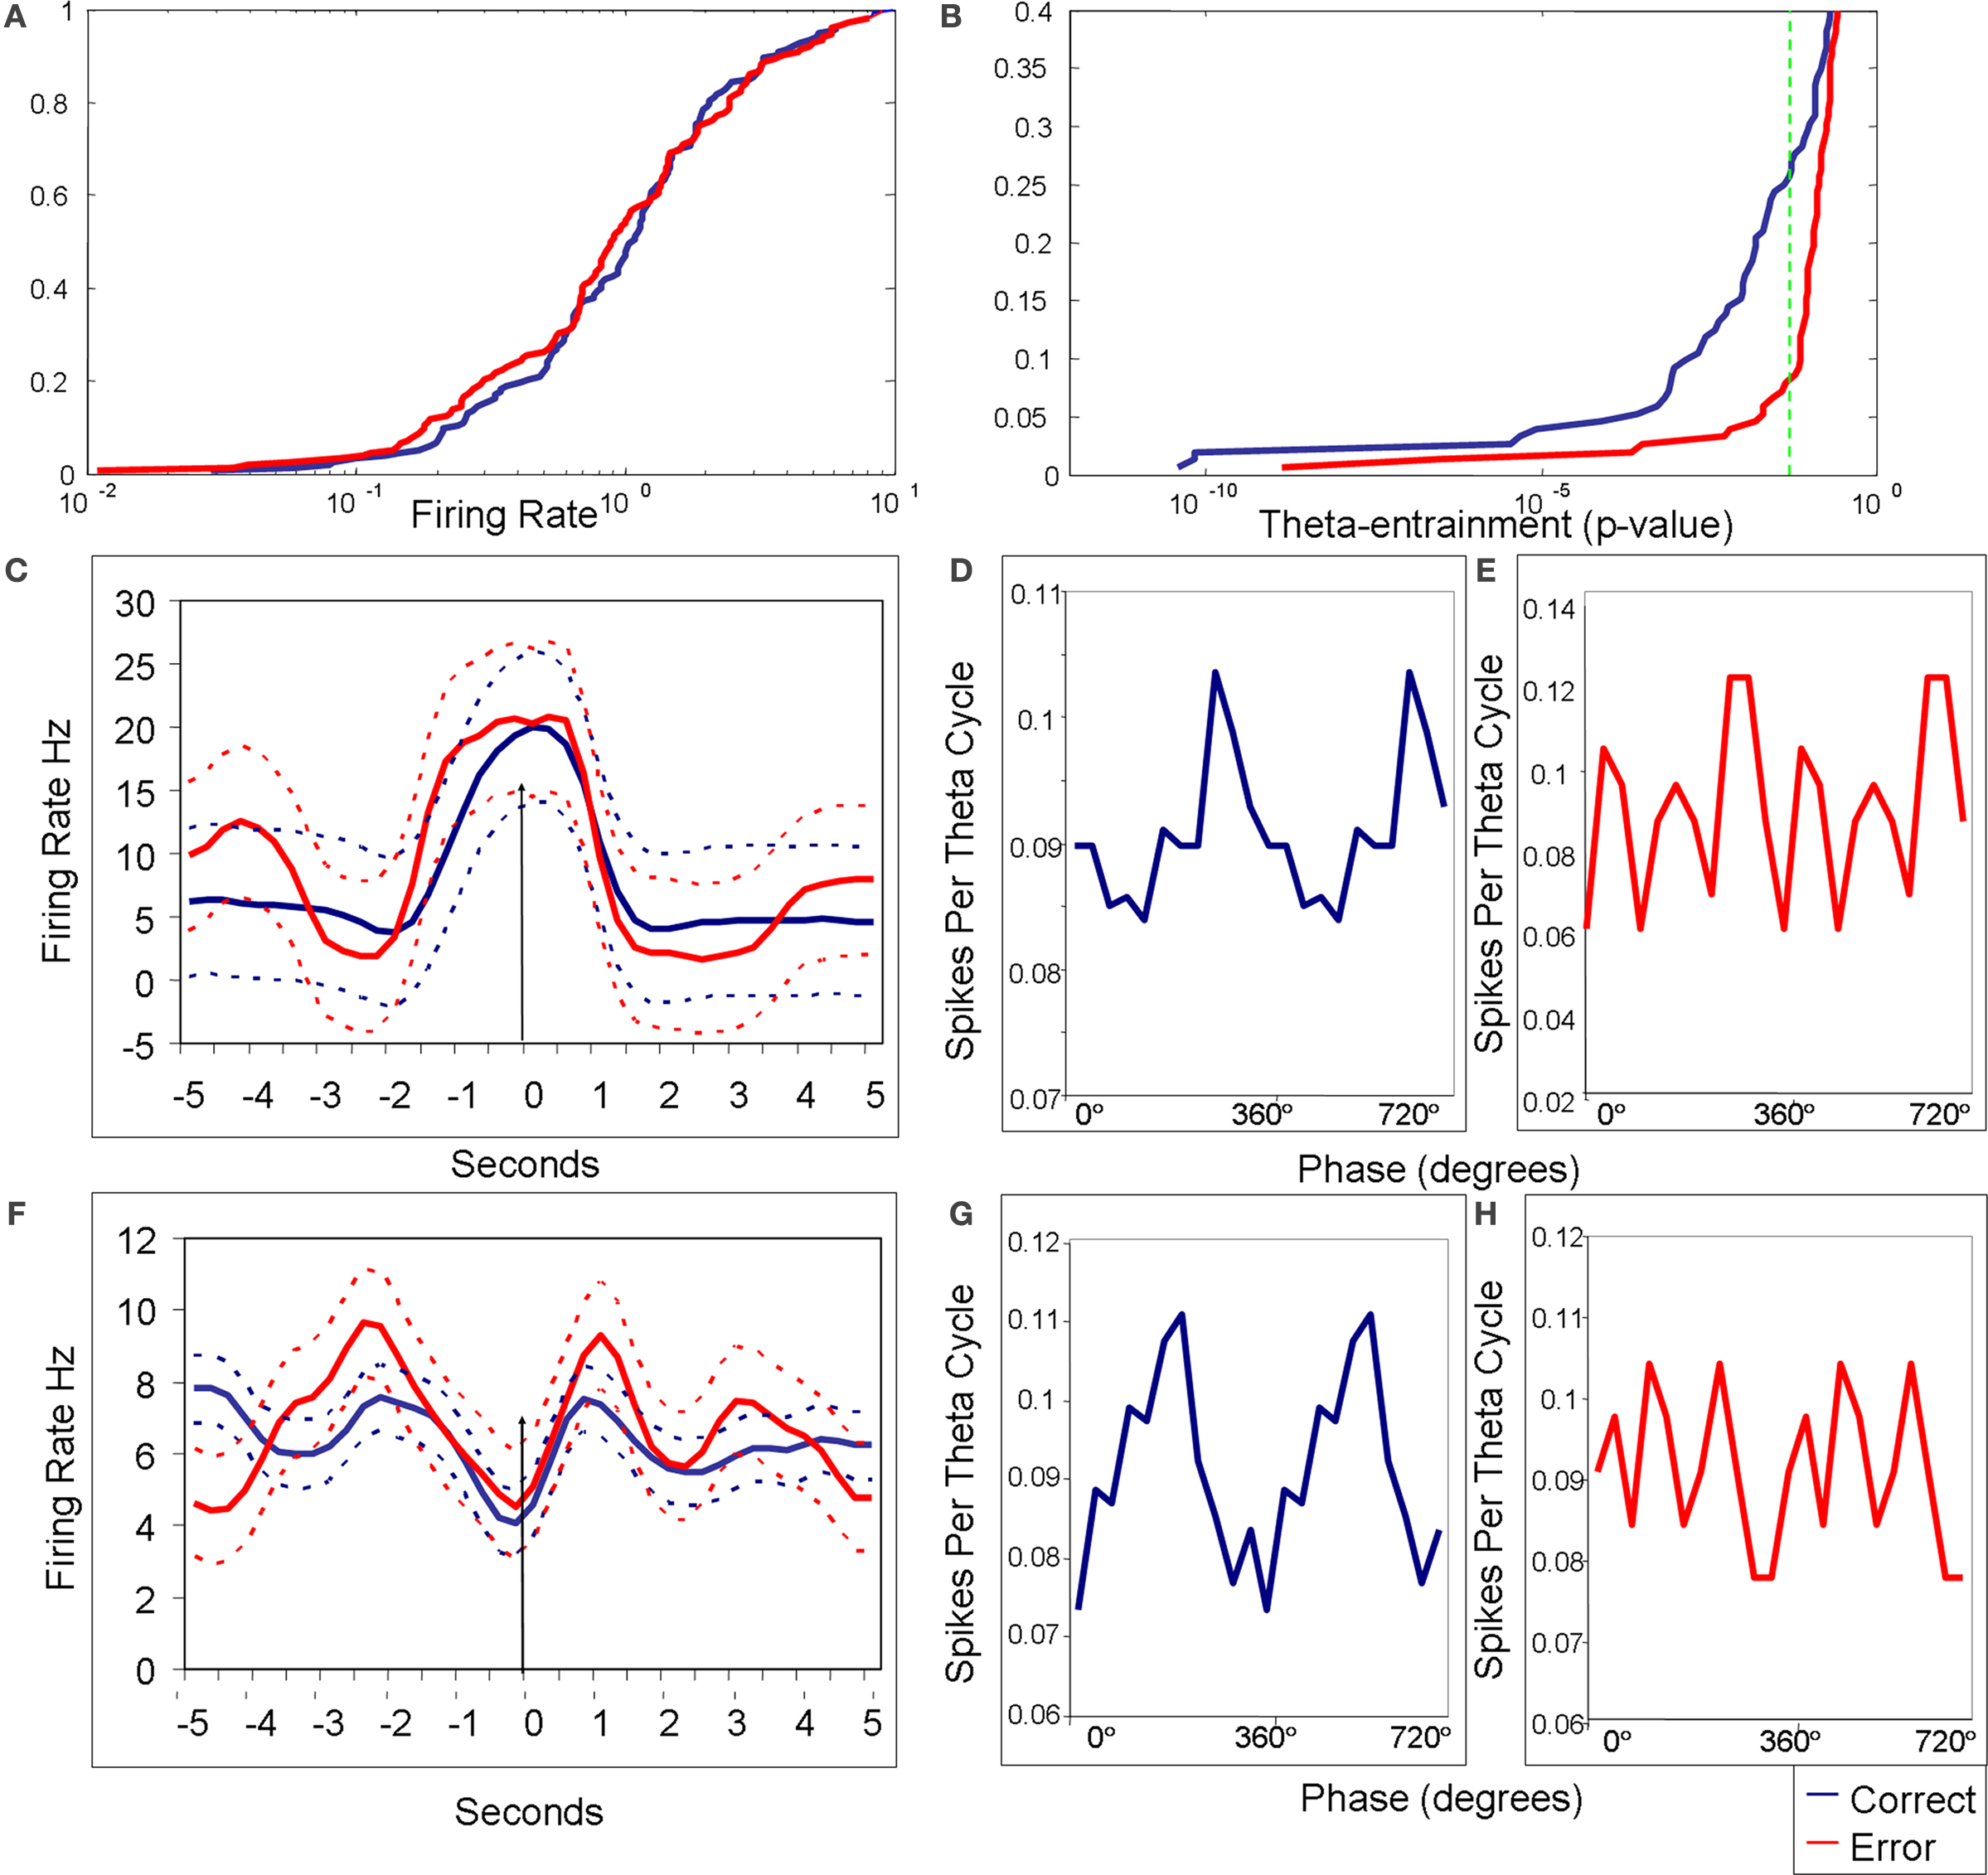
Figure 2. Firing rate and theta-entrainment on correct vs. error trials. In all plots blue lines are from correct trials and red lines are from error trials. (A) Cumulative distributions of firing rates for correct and error trials. The two distributions are not significantly different (KS = 0.09; p = 0.48). Percentile is on the Y axis and the log of mean firing rates is on the X axis. (B) Cumulative distributions for Rayleigh’s statistic p-value from correct and error trials taken from the same data as the firing rate plot. The green dotted line shows the level for statistically significant theta-entrainment, with all points to the left of the line being significant. These two distributions are significantly different with the correct distribution containing a larger percentage of theta-entrained firing activity (KS = 0.19; p = 0.004). (C–E) firing rate and theta phase distribution plots for a single cell for the sample lever press. (C) Representative example of an mPFC neuron’s peri-stimulus firing rate histograms during correct and error trials (both are shown in the same plot; dotted lines are respective standard deviations). A Kruskal Wallis ANOVA revealed no change between correct and error firing (KW = 0.02; p = 0.88). This cell showed peak firing rate at the time of the sample lever press both during correct and error trials (arrow indicates time of lever press). (D,E) Theta phase distribution plots with spikes for theta cycle on the Y axis and theta phase, in degrees, plotted redundantly (0°–720°) on the X axis. Rayleigh’s test of uniformity for correct trials showed significant entrainment (Z = 7.12; p = 0.0008), and the Rayleigh’s test was not significant for error trials (Z = 0.87; p = 0.46). (F–H) Firing rate histograms and phase histograms for a different mPFC neuron during test lever presses. (F) Mean firing rate peri-stimulus histograms for error and correct trials (both shown on same plot). There was no significant difference between correct and error trial discharge rates (KW = 0.007; p = 0.93). This cell had periods of elevation before and after test lever press, with a distinct period of inhibition at the time of the lever press (arrow indicates time of lever press). (G) The phase plot for correct trials shows significant theta-entrainment (Z = 6.99; p = 0.0009), while plot (H) shows no significant entrainment during error trials (Z = 0.425; p = 0.654). These cells were indicative of the great majority of theta-entrained neurons, in that the mean firing rate did not change significantly depending on trial outcome (KS test, Bonferroni corrected), however theta-entrainment that was significant during correct performance was lost during errors [Rayleigh’s test of uniformity (p < 0.05) and the modified Monte Carlo analysis (p < 0.05)].
To investigate the cause of errors, i.e. were errors the result of miscoding or due to uncertainty, we compared test stage error responses with correct test response for the opposite trial type. In 14% of test stage cases, units were entrained on error trials and on opposite trial type correct trials. However, these results are not surprising since the degree of theta-entrainment was much lower across the whole population on error trials (Figure 4
A). When sample stage activity was analyzed similarly, 23% of cases were entrained for both error sample and opposite trial type correct responses. This indicates that some errors were likely due to miscoding but most errors were likely due to uncertainty or inattentiveness.
Figures 2
D,E,G,H show the theta phasic firing of two mPFC units during correct and error trials. Plots d and e are circular distribution plots of theta-entrainment for a representative unit during sample correct (Figure 2
D) and sample error (Figure 2
E) lever presses. This cell was significantly theta-entrained during correct trials with a preferred phase between 270° and 360°, while during error trials the theta phasic distribution of spikes was uniform across all 360° of the theta phase. This cell showed significant firing rate increases around the lever press that were consistent on both correct and error trials (Figure 2
C). Plots G and H in Figure 2
are theta phasic distributions of another mPFC unit during correct (Figure 2
G) and error (Figure 2
H) test lever presses. This cell was highly theta-entrained on correct lever presses with a preferred phase between 180° and 270°, while during error lever presses the distribution of spikes was flat across the theta cycle. This cell had firing rate increases before and after the lever press, but not during the lever press, on both correct and error trials (Figure 2
F).
Difference in Theta-Entrainment on Correct vs. Error Trials Across the Entire Population
To examine theta-entrainment at a population level, a KS test was conducted on the cumulative density distribution of MRLs for error trials and correct trials, revealing that the two distributions were significantly different (K = 0.21; p = 0.0004; see Figure 3
A). To ensure that this difference in MRLs over the entire population was due to the error being made and not due to other factors (trial type or task stage), we also computed KS tests comparing sample and test periods from both trial types of correct trials (K = 0.071; p = 0.82) and combined sample and test periods between LR and RL trial types (K = 0.066; p = 0.885) for correct trials (see Figures 3
B,C).
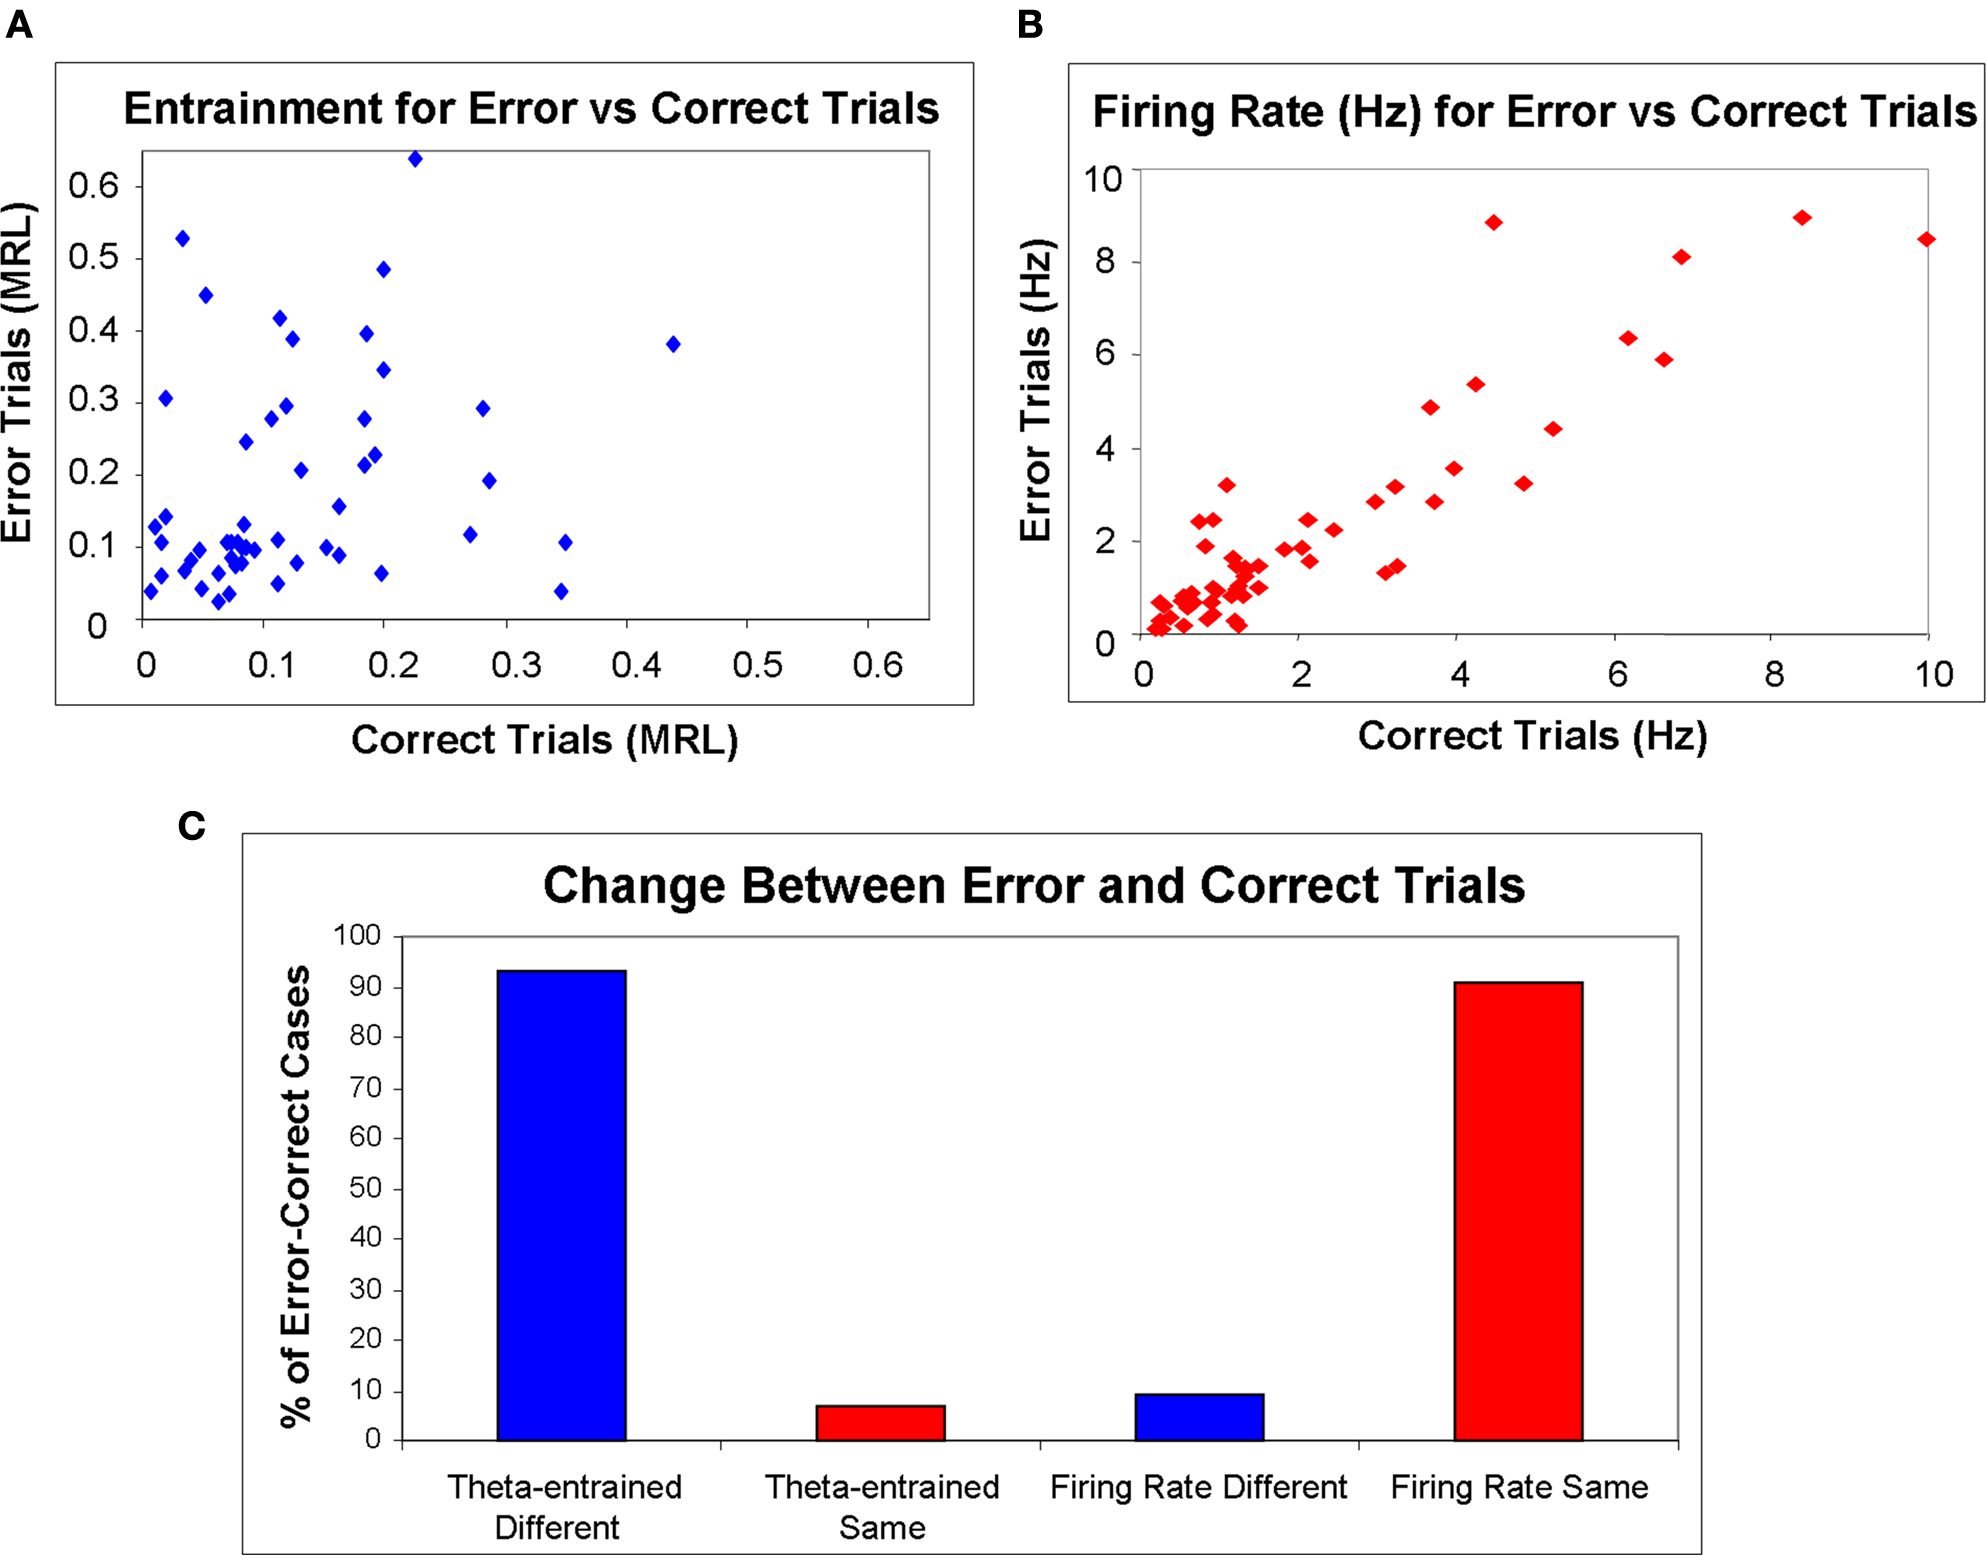
Figure 3. Cumulative density distributions of mean resultant lengths. All graphs are cumulative density functions of mean resultant lengths from the entire recorded mPFC population, with percentile on the Y axis and the log of MRLs on the X axis. To the right of each graph are the KS results and the associated p-values. (A) MRLs during correct (blue) and error trials (red) of both sample and test period activity. MRLs across the population were significantly different during correct and error trials (KS test; p < 0.01. (B) MRLs during sample (light blue) and test (dark blue) periods for correct trials. These two functions were not significantly different. (C) MRLs of LR (green) and RL (orange) trial types during correct trials for both sample and test periods. These two functions were not significantly different.
The Spearman’s rank correlation coefficient for MRL across all cases (significantly theta-entrained or not; n = 192) revealed a low positive correlation (R2 = 0.27) between error and correct trials. When we analyzed only the 50 cases in which neurons were significantly theta-entrained during correct trials, the Spearman’s rank correlation revealed a similar slight positive correlation (R2 = 0.34). Figure 4
B shows the XY scatterplot of MRLs for correct trial theta-entrained neurons comparing correct (X axis) and error trials (Y axis).
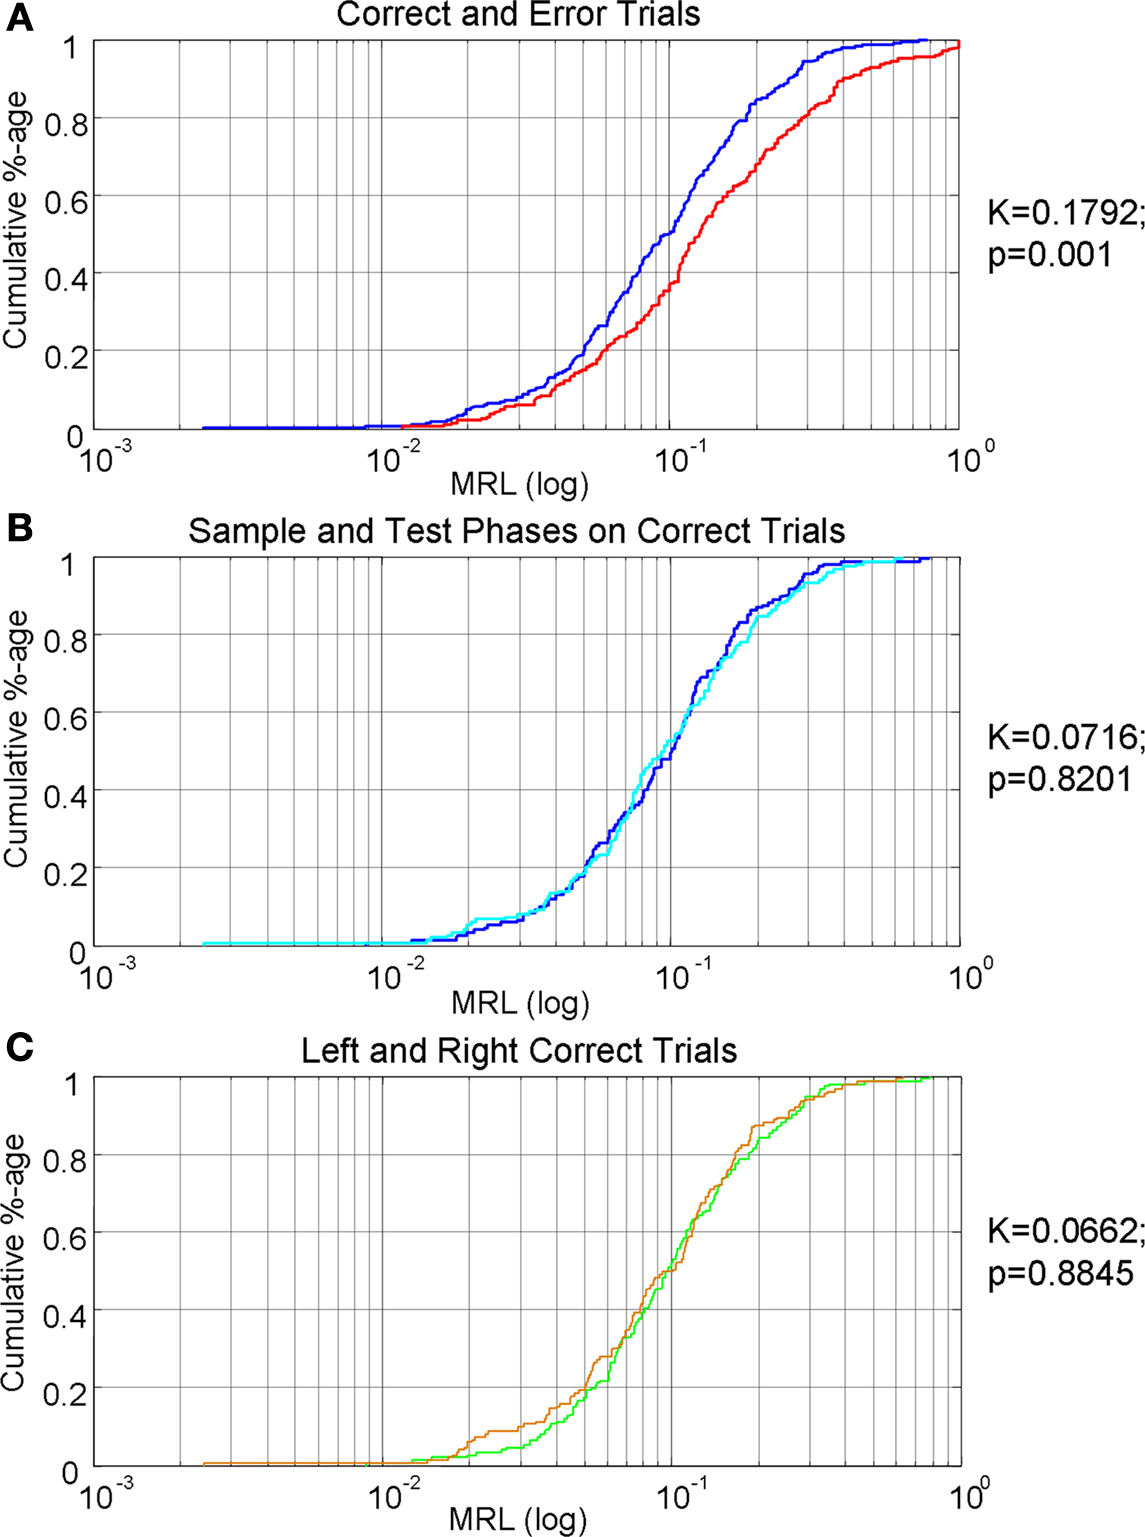
Figure 4. Firing rate and entrainment for correct vs. error trials. In plots (A,B), on the X axes are correct trial values and the Y axes are for error trials. (A) Scatterplot of mean resultant lengths. Mean resultant lengths were different for most cells between correct and error trials (R2 = 0.34). (B) Scatterplot of mean firing rate for theta-entrained cells. Firing rate did not change significantly for mPFC theta-entrained cells (R2 = 0.83) between correct and error trials. (C) The percentages of theta-entrained mPFC units, with statistically significant changes between correct and error trials for theta-entrainment (according to both Rayleigh’s test of uniformity and the modified Monte Carlo analysis of MRLs.
Differences in Firing Rate on Correct vs. Error Trials for Individual Units
A total of 74 mPFC recorded cells during the error criteria sessions were active enough during task performance to allow for further analysis. From these 74 cells, firing rates were compared between error and correct trials for a total of 188 trial stage matched cases. Only 17 out of the 188-KW non-parametric ANOVAs (Bonferroni corrected) returned significant results, indicating that the vast majority mPFC cells (90%) fired at similar rates during error and correct trials.
For the 47 cases of high error trial type theta-entrained neurons, only 4 out of 47-KW tests reported significant mean firing rate changes for correct vs. error trials (1 out of 26 sample stage cases and 3 out of 21 test stage cases). Thus, 91% of theta-entrained cells had similar discharge rates during error and correct trials. Representative examples from theta-entrained units displaying the similarities in firing rates between correct and error trials are shown in Figures 2
C,F.
Differences in Firing Rate on Correct vs. Error Trials Across the Entire Population
A KS test was performed on the cumulative density functions of firing rates on error vs. correct trials and revealed no significant difference between the two distributions (KS = 0.09; p = 0.48). Additional KS tests examined population firing rate differences between trial types (KS = 0.12; p = 0.5) and task stages (KS = 0.07; p = 0.95). Firing rates across the entire mPFC population were not affected by trial outcome, trial type or task stage.
To look further at changes in firing rates across the entire population, a Spearman’s rank correlation coefficient comparing correct lever press firing rates with error lever press firing rates revealed a strong positive correlation (R2 = 0.79). When we examined only the 47 cases when units were entrained for the high error trial type for either correct or error trials, the Spearman’s rank correlation reported a strong positive correlation (R2 = 0.83). In Figure 4
A, firing rate is plotted for these cells with correct trials on the X axis and error trials on the Y axis.
Unit Behavioral Correlates
Two-way ANOVAs were performed on the mean firing rates for the 74 mPFC neurons analyzed above. These ANOVAs examined firing rates dependent on trial type and time around the lever press as main factors. All 74 cells had at least one significant main effect (only 4 cells had a single significant main effect (p < 0.01)), and every cell had a significant interaction. A number of KW non-parametric ANOVAs were then performed to more accurately describe firing rate changes (comparing mean firing rates between the two different trial types and trial stages). Three general categories of behaviorally correlated cellular response patterns emerged: trial stimulus specific, task stage, and task stage with stimulus sub-specificity (see Table 1
). Twenty two cells were categorized as trial stimulus specific (for examples see Figures 5
A–C). Trial stimulus specific cells responded to only a single type of lever press (LR sample; LR test; RL sample; RL test) or to each lever press uniquely. Fourteen cells fell into the task stage category, with 8 of these cells displaying some significant stimulus specificity as well (see Figures 5
D–F). Task stage cells responded at highest rates for one trial stage (sample or test), and often featured scalar LR/RL trial differences too (task stage with stimulus specificity). The remaining cells had significant behavioral (time around lever press) and cognitive (lever press type) correlates in the two-way ANOVA analysis, however the KW ANOVAs from the entire 5 s surrounding each lever press did not return any significant results. It is likely if more KW tests were conducted for smaller time periods, more behaviorally correlated unit activity would have appeared but that was not the focus of the current study (KW tests are a one factor ANOVA, used here to examine the mean firing rates for the 5 s surrounding the lever press with lever press type as the main factor; while the two-factor ANOVAs used lever press type and time around the lever press as main factors).
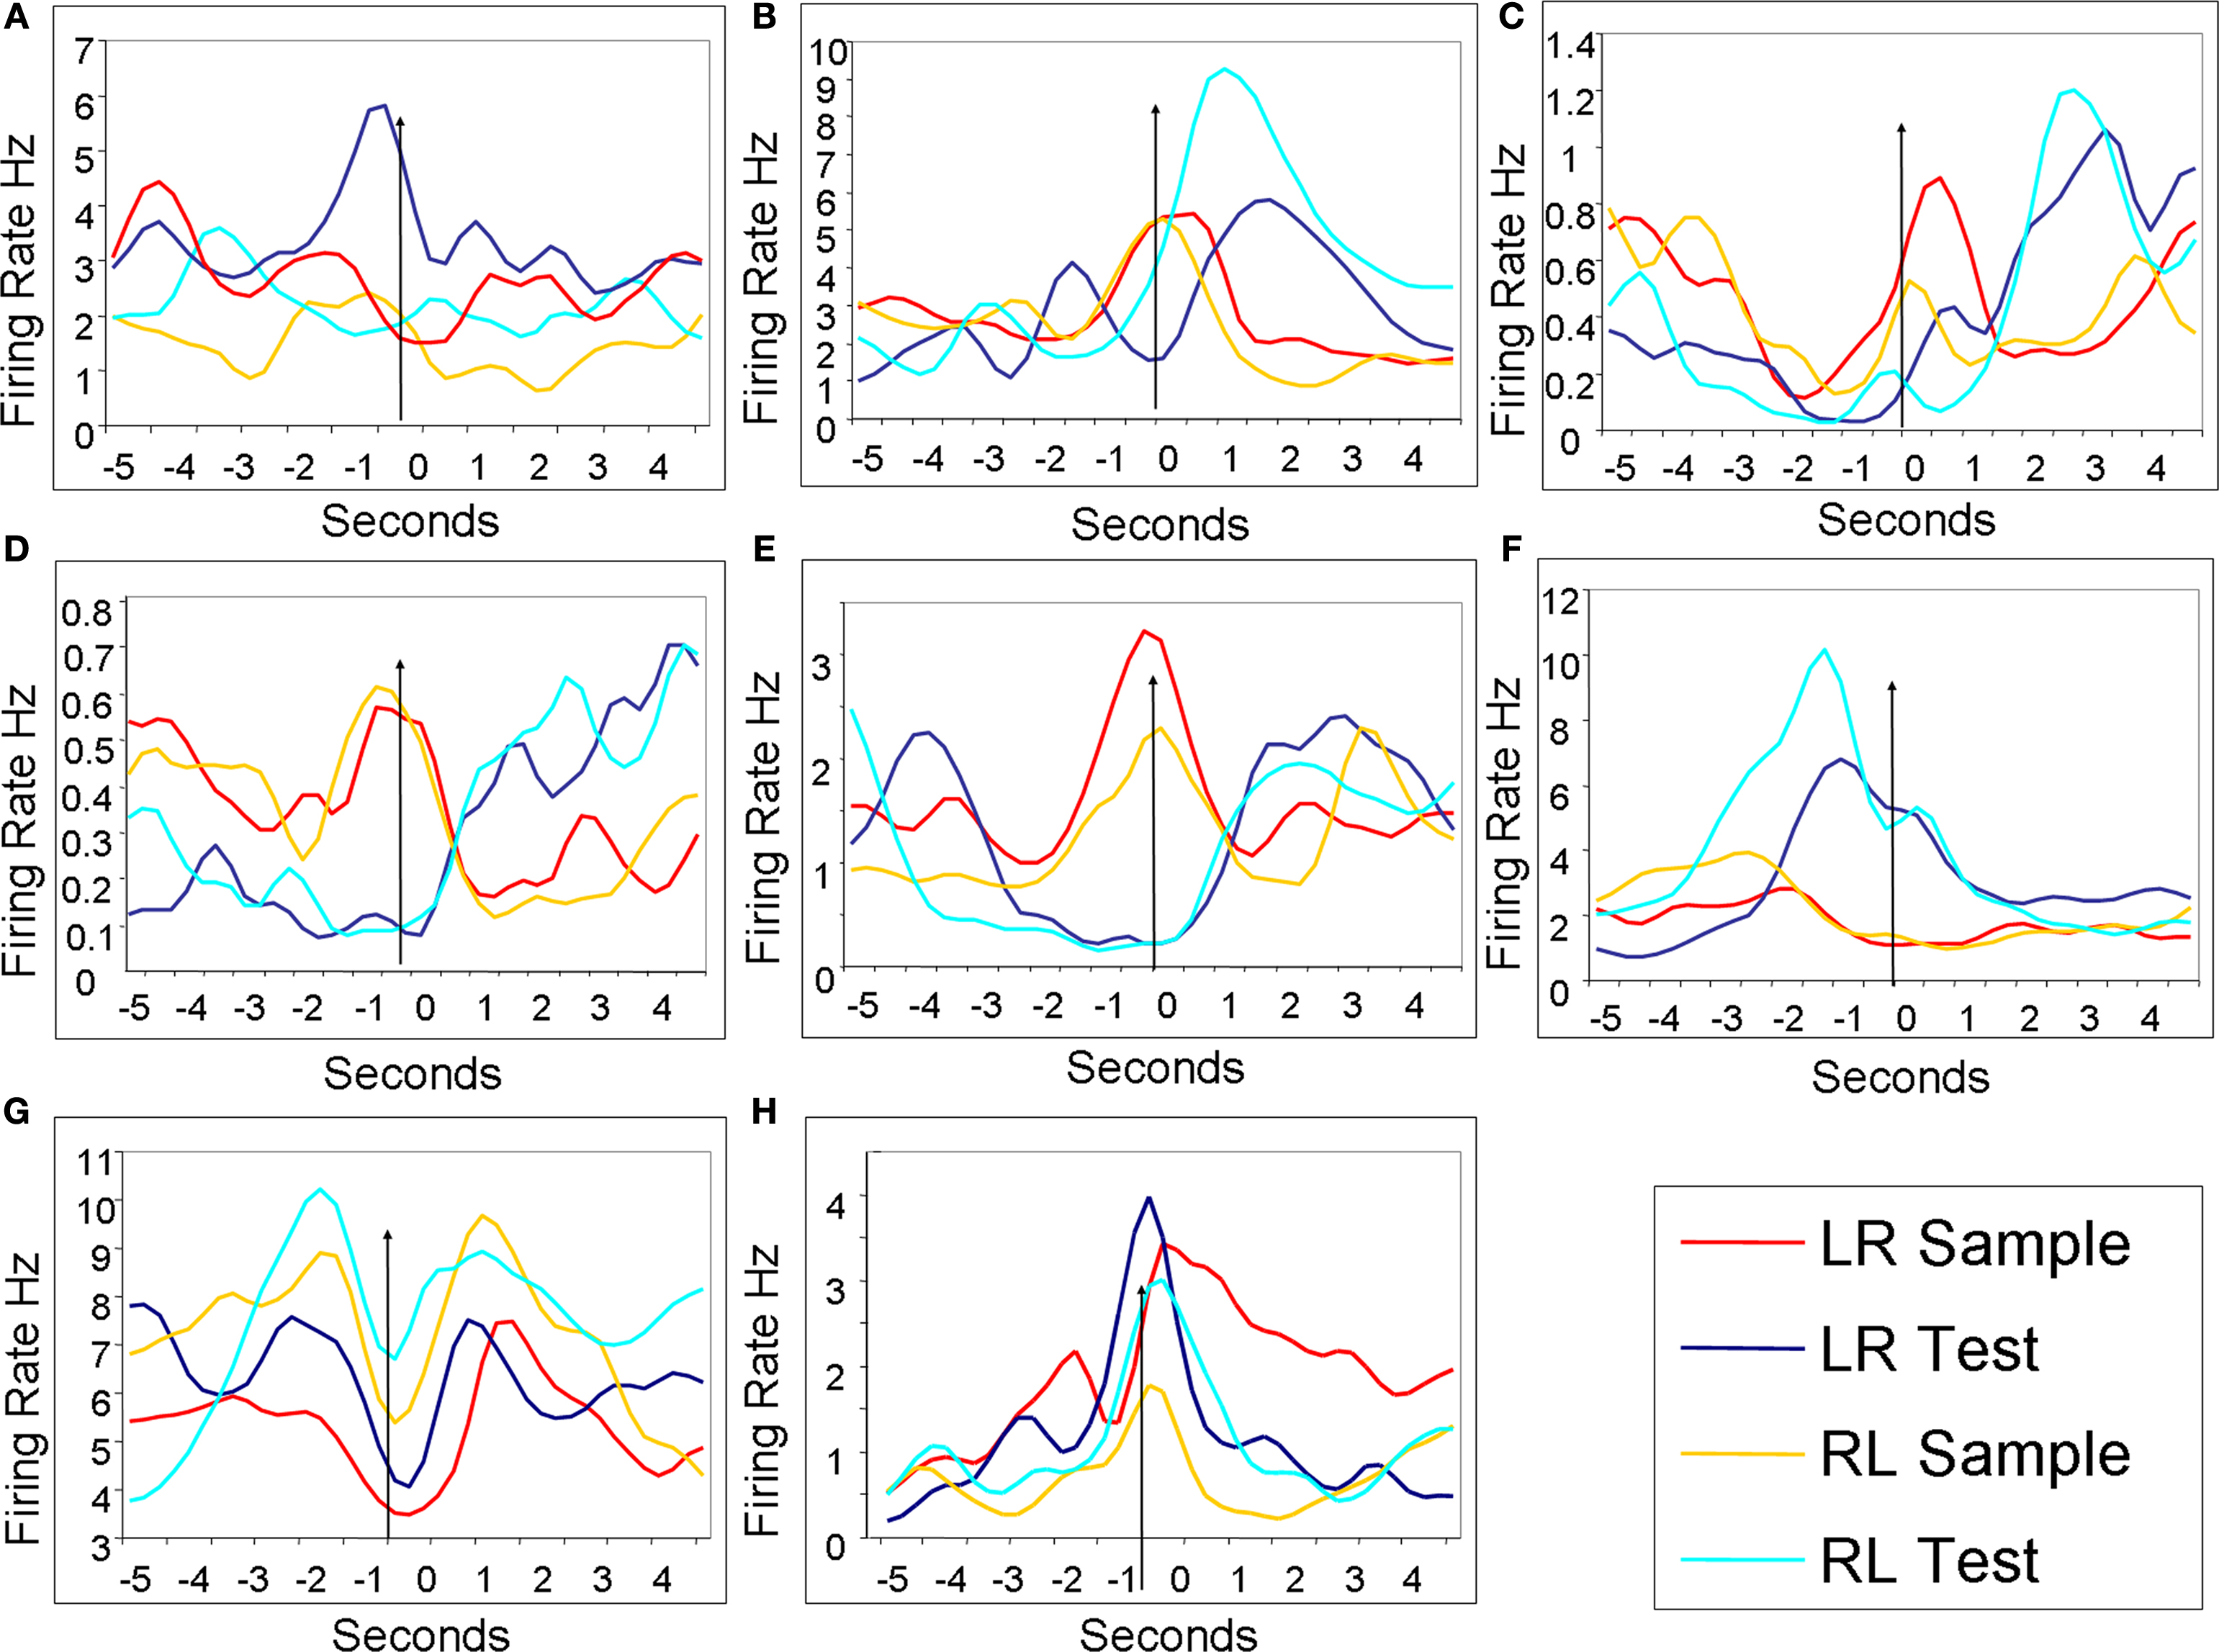
Figure 5. mPFC neuronal discharge patterns during DNMS task. Each plot contains the four mean discharge peri-stimulus histograms from the four different lever presses. All data are from correct trials. In all plots the arrow indicates the time of the lever press. (A) A trial stimulus specific cell that displayed elevated spiking activity just before the LR trial test lever press. (B) A trial stimulus specific cell that had significantly higher discharge only during the reinforcement period following a RL trial test lever press. (C) A trial specific stimulus cell that was preferentially active just after LR trial sample lever presses, and was also elevated during reinforcement periods for both trial types. (D) A trial stage cell with differential firing for sample and test lever presses irrespective of trial type. (E) A trial stage with stimulus sub-specificity cell. This cell was more active during both sample lever press types, but also differentially active during LR trials. (F) A trial stage cell with stimulus sub-specificity for test lever presses on RL trials. (G) A trial specific stimulus cell that was differentially active for RL trials lever presses. This cell displayed similar firing patterns around each type of lever press with periods of excitation just before and after the lever press, while firing rates decreased at the time of the actual lever press. (H) A trial stimulus specific cell that was most active during and after LR sample lever presses.
Working memory tasks make unique demands on both long term memory and working memory, and it has been speculated that mPFC-HPC interactions mediate the interplay of these two types of information (Winocur, 1992
; Doyere et al., 1993
; McIntosh, 1999
; Wall and Messier, 2001
; Koene et al., 2003
; Hasselmo, 2005
; Ranganath and D’Esposito, 2005
; Vertes, 2006
). The mechanism by which these two neural areas interact is not known. However, robust theta-range coordination has been recently discovered (Hyman et al., 2005
; Jones and Wilson, 2005a
,b
; Siapas et al., 2005
). Previous studies have shown similar decreases in mPFC hippocampal theta-entrainment during the test stage of working memory tasks, but this report is the first to our knowledge to show decreases during the sample stage (Jones and Wilson, 2005a
,b
). Here we report mPFC unit hippocampal theta-entrainment was selectively reduced during both sample and test stages of error trials in a DNMS task, while firing rates remained unchanged. During correct trial performance46% of mPFC neurons were hippocampal theta-entrained, while on error trials in the same population only 17% of mPFC cells were theta-entrained. In cases when cells were entrained during correct trials only 15% maintained entrainment during the same trial stage of error trials, however firing rates did not change in 96% of these cases. This indicates that theta entrainment was more reflective of a given trial’s outcome than the firing rate of mPFC units.
Surprisingly during the sample stage of error trials theta-entrainment was already impaired even though the incorrect response had not yet been made, suggesting that mPFC hippocampal theta-entrainment is involved in the encoding of the sample stimulus. Ninty two percentage of sample stage cases lost theta-entrainment on error trial sample stages of the same trial type, but in only 4% of these same cases were firing rates significantly different. Overall most error trial firing rates were comparable to correct trial rates for both sample and test stages, both in terms of mean firing rates and the temporal pattern of discharge. Comparing correct vs. error trials for both trial stages, only 6% of correct trial theta-entrained mPFC units displayed significantly altered firing rates, but 91% of these same cells had significantly altered theta-entrainment (see Figure 4
). Significance tests of MRL distributions from the complete recorded population revealed that only trial outcome affected the amount of theta-entrainment, while trial type and trial stage phases did not. No differences were seen in firing rates across the population for trial outcome, trial type or trial stage. For either individual neurons or the entire population, firing rate and theta-entrainment acted as independent measures (see Figure 2
).
Error trials featured some behavioral variability, and variability has recently been shown to affect mPFC unit activity (Euston and McNaughton, 2006
; Cowen and McNaughton, 2007
). These papers have suggested that behavioral variability could account for the behaviorally and cognitively correlated variance seen in rodent mPFC firing rates, putting forward the idea that the rodent mPFC is more involved in skeleto-motor strategies than cognitive strategies. It is also important to note that in the aforementioned studies behavioral variability led to significant changes in firing rates, but in the current data there were very few changes in firing rates for either sample or test stages between error and correct trials. Though behavior during error trial test stage responses was surely variable at the fine scale those papers employed (reporting significant firing rate changes with differences in head position or path of a couple centimeters; while in the current study animals were pressing different levers 6′′ apart during the test stage of correct or error trials), there were only a few theta-entrained cells with distinct firing rates during error trial test responses (14%). To minimize any effects behavioral variability had on our analysis of error and correct trials, we restricted the period of firing rate and entrainment analysis, as much as possible to compare these two disparate measures, to right around the lever press (see Methods). So any differences should reflect neuronal processes during relatively equivalent behaviors during error and correct trials (approach to lever, lever press, turning and running towards the nose-poke panel, and consumption of reward or absence of reward after the test lever press). The overwhelming uniformity of the effects on entrainment and firing rate across the population between sample and test stages indicates that these effects were most likely not due to slight discrepancies in body position or path.
The majority of the behavioral variability occurred after the sample lever press and before the nose-poke, so it was interesting that more mPFC cells lost theta-entrainment during the sample lever press than during the test stage lever press. When the sample lever press was made, the error had not yet occurred, but mPFC cells had already lost theta-entrainment. This indicates that the error on the resulting test stage may have been preordained (by non-phasic sample firing), and the behavioral variability seen after the sample lever press might also have been preordained. One could imagine that during error trial sample lever presses, a loss of mPFC-HPC theta interactions was reflective of a less attentive or concentrated state of the animal.
Poor performance on trials with a loss of theta entrainment during sample lever presses is similar to effects observed in HPC when animals were presented with a conditioned stimulus in the absence of theta compared to during a theta state. Animals learned significantly quicker when a conditioned stimulus was presented during theta (Seager et al., 2002
; Griffin et al., 2004
), analogous to improved performance following a sample lever press with normal mPFC theta-entrainment.
Medial prefrontal cortex cells responded differentially, in terms of firing rate and theta-entrainment, in an array of patterns. Every mPFC cell recorded had some sort of behaviorally correlated mean firing rate change between the four different lever press types according to 4 × 5 two-factor ANOVAs with trial stage type and temporal discharge rates before and after the lever press as main factors. To attempt to make sense of these results, and to minimize the number of potential categories, we chose to classify animals based upon the results of a battery of KW non-parametric ANOVAs examining the 5 s surrounding lever presses with lever press type as the single main factor. While the KW test is only a single factor ANOVA, thus prohibiting examination of temporal discharge differences, it is more accurate than traditional ANOVAs when analyzing non-normally distributed variables such as neuronal firing rates. Categorization still proved difficult for two main reasons: first, cells often had totally different mean discharge patterns for more than one of the four lever press types; and second, cells that did alter firing rate with certain behaviors (such as the sample lever press) did not change in a uniform pattern both between and within cells. For example, some cells reached peak firing 500 ms before lever press, while others peaked 500 ms after the lever press and still other cells peaked 1–3 s before or after the lever press. Because of these reasons we put cells into three general categories (trial stimulus specific, task stage, and task stage with stimulus sub-specificity; see Figure 5
for examples), although within each category a wide range of response patterns occurred. Clearly some neurons responded to working memory (trial stimulus specific), long term memory (task stage), and both working and long term memory components of the DNMS task (task stage with stimulus sub-specificity; see Table 1
). Overall, these types of behavioral correlates were similar to previous working memory studies of non-human primates (Fuster, 1973
; Kojima and Goldman-Rakic, 1982
; Yajeya et al., 1988
; Watanabe, 1990
; Takeda and Funahashi, 2002
) and rodents (Jung et al., 1998
; Baeg et al., 2003
; Lapish et al., 2008
). Because the vast majority of firing rates did not differ between error and correct trials, the role of firing rate changes on an animal’s performance of a given trial remains unclear.
The present results, showing loss of theta-entrainment of mPFC cells on error trials, suggest that the successful integration, or implementation, of trial specific and task universal information occurs via theta range interactions between the mPFC and HPC, supporting human studies showing strong mPFC-HPC theta coherence during working memory tasks (Tesche and Karhu, 2000
; Sauseng et al., 2004
; Onton et al., 2005
), and neural network models that employed theta rhythmic prefrontal-hippocampal interactions (Koene and Hasselmo, 2005
). During error trials hippocampal theta-entrainment was selectively disturbed, but mPFC unit firing rates did not change despite the disturbance. Future studies with simultaneous recordings from larger mPFC ensembles, could help to determine if there are network level firing rate effects that are not perceptible when examining individual cells. Studies have shown that pair-wise unit cross correlations between mPFC and HPC are stronger when mPFC theta-entrainment is more prevalent (Jones and Wilson, 2005a
,b
), and recordings of significant populations from both areas could provide insight into the mechanisms through which theta interactions enable successful working memory performance. In this current data, correct performance appeared to require the correct ensembles in HPC and mPFC to be theta synchronized.
The authors declare that the research was conducted in the absence of any commercial or financial relationships that could be construed as a potential conflict of interest.