Multisensory integration produces an initial response enhancement
- Department of Neurobiology and Anatomy, Wake Forest University School of Medicine, USA
The brain has evolved the ability to integrate information across the senses in order to improve the detection and disambiguation of biologically significant events. This multisensory synthesis of information leads to faster (and more accurate) behavioral responses, yet the underlying neural mechanisms by which these responses are speeded are as yet unclear. The aim of these experiments was to evaluate the temporal properties of multisensory enhancement in the physiological responses of neurons in the superior colliculus (SC). Of specific interest was the temporal evolution of their responses to individual modality-specific stimuli as well as to cross-modal combinations of these stimuli. The results demonstrate that cross-modal stimuli typically elicit faster, more robust, and more reliable physiological responses than do their modality-specific component stimuli. Response measures sensitive to the time domain showed that these multisensory responses were enhanced from their very onset, and that the acceleration of the enhancement was greatest within the first 40ms (or 50% of the response). The latter half of the multisensory response was typically only as robust and informative as predicted by a linear combination of the unisensory component responses. These results may reveal some of the key physiological changes underlying many of the SC-mediated behavioral benefits of multisensory integration.
Introduction
The brain has evolved multiple senses to transduce different forms of environmental energy. It has also developed mechanisms to pool information across the senses in order to improve the detection and disambiguation of salient events by making physiological and thus behavioral responses faster and more robust (Frens et al., 1995 ; Gielen et al., 1983 ; Goldring et al., 1996 ; Hughes et al., 1994 ; Jiang et al., 2001 ; Jiang et al., 2002 ; Meredith and Stein, 1983 ; Perrott et al., 1990 ; Rowland et al., 2007 ; Wilkinson et al., 1996 ). To understand how the more enhanced physiological responses resulting from multisensory integration produce faster behavioral responses, it is first necessary to identify the time course of this enhancement. Unfortunately, because physiological response magnitude is typically measured as an average over the entire response, this information is currently unavailable.
One possibility is that multisensory enhancement appears late in the response. This is plausible given evidence that: (1) special higher-order circuits are invoked for multisensory integration even at the level of the midbrain (Jiang et al., 2001 ; Jiang and Stein, 2003 ; Stein et al., 2002 ; Wallace et al., 1993 ), (2) recurrent interactions may be necessary for its expression (Pouget et al., 2002 ), and (3) receptors with slower time constants may be part of its implementation (Binns and Salt, 1996 ). However, the results of Rowland et al., (2007) suggest that modality-specific information is integrated as soon as it arrives at the neuron and thus, enhancements are evident at the beginning of the response.
Using the multisensory superior colliculus (SC) neuron as a model, these investigators found that multisensory integration shortens physiological response latencies and produces enhancements which are proportionally largest at the beginning of the response, a phenomenon described as initial response enhancement (IRE). However, these data seem to suggest something further. Specifically, that beginning at the onset of the multisensory response, information is accruing at a faster rate than it does in the component unisensory responses. The alternative is that the multisensory response, while translated in time (a highly significant effect, no doubt), actually has the same (or lower) rate of information accrual over its entire response. To examine these possibilities it is necessary to understand the temporal evolution of the multisensory response. This was the objective of the present study, and necessitated the use of a number of methodological innovations to quantify the time courses of a neuron's response to a cross-modal stimulus as well as its responses to its component modality-specific stimuli.
Materials and Methods
Surgical preparation
Two adult cats were implanted with stainless-steel recording chambers using aseptic surgical techniques in accordance with the Guide for the Care and Use of Laboratory Animals (National Institutes of Health publication 86–23) and an approved Institutional Animal Care and Use Committee protocol. Each animal was anesthetized with ketamine hydrochloride (20 mg∕kg, i.m.) and maintained with halothane (1.5–4%). The recording chamber was attached to the skull over a craniotomy giving access to the SC via the overlying cortex. Postsurgical analgesics (butorphanol tartrate; 0.1–0.4 mg∕kg for 6 hours) were administered as needed and antibiotics (cephazolin sodium; 25 mg∕kg) were administered b.i.d for 7 days.
Recording sessions began 7–10 days after surgery. No wounds or pressure points were induced during recording. The animal was prepared for recording with a mixture of ketamine hydrochloride (20 mg∕kg, i.m.) and acepromazine maleate (0.4 mg∕kg, i.m.), intubated, and paralyzed with pancuronium bromide (0.3 mg∕kg), and maintained with an infusion of ketamine (10–15 mg · kg−1 · hour−1, i.v.), pancuronium (0.1–0.2 mg · kg−1 · hour−1, i.v.), and 5% dextrose Ringer's (1 mg · kg−1 · hour−1, i.v.). Respiratory rate and volume were controlled so that end-tidal CO2 was ∼4.0%. At the end of each experiment anesthetics and paralytics were terminated, and the animal was returned to its home cage after it recovered normal respiration and was ambulatory.
Only SC neurons responsive to both visual and auditory stimuli were studied and some of the characteristics of this dataset were previously described (see Rowland et al., 2007 ). Visual stimuli were illuminated light-emitting diodes (LEDs), auditory stimuli were bursts of bandpass-filtered noise delivered by small speakers close to each LED. Stimuli were controlled using a Spike II (Cambridge Electronics Design, Cambridge, UK) analog-to-digital converter connected to a PC. Every isolated neuron was tested with brief (typically 50–100 ms) modality-specific (visual, auditory) and cross-modal (visual-auditory) stimuli at a given location. To ensure a broad sample of responses, each modality-specific stimulus was adjusted to three different intensities (selected online) to span its dynamic range from minimum to maximum effectiveness. Visual stimuli ranged from 0.65 to 13.0 cd∕m2 and auditory stimuli from 0.7 to 70 dB SPL (A-weighted). Stimulus onset asynchronies (SOAs) were chosen based on online estimates of modality-specific stimulus latencies and, typically, four SOAs were presented to bracket the estimates required to produce maximal temporal coincidence of the cross-modal inputs to the neuron (i.e., to offset differences in visual and auditory response latencies). The cross-modal conditions consisted of all 36 possible combinations of auditory intensity, visual intensity, and SOA (3 × 3 × 4).
Unisensory and multisensory trials were randomly interleaved during testing. Neurons were tested with 13–30 (median 20) trials per condition. For a multisensory condition to be considered for the broadest analysis, both the multisensory and associated unisensory responses (averaged across trials within each condition) were required to be significantly elevated over background firing rates (see below): 557 multisensory responses (from 25 neurons) met these criteria. A subset of conditions in which the earliest unisensory response was expected at least 8 ms after both stimuli were delivered (240 responses from 22 neurons) was used in all time-sensitive analyses (latency shifts and response profile changes). Unisensory response properties were analyzed separately for the 145 conditions containing statistically significant mean responses (55 visual, 90 auditory) recorded from 28 neurons.
Response measures
Multiple measures of the response were used to characterize the nature of the observed multisensory enhancements and compare the results obtained using time-insensitive and time-sensitive response measures.
Response onsets (i.e., latency) and offsets were determined by the three-step geometric method (Figure 1 ) which performs very well over a large range of response parameters (Rowland et al., 2007 ). First, the mean cumulative impulse count over time (C(T)) was calculated. Second, the function C(T)∕T was calculated, its maximum (E) after the stimulus onset (S) identified, and a “null hypothesis” line (H 0) drawn between C(S − (E − S)) and C(E). In the absence of a response, C(T) would follow H 0. The response onset (R) was identified as the time that C(T) maximally diverged from H0, measured by the length of a plumb line perpendicular to H0 that intersected C(T). The response offset was identified in a similar manner using a null hypothesis line drawn from C(R) to C(E + (E − R). Significant responses were identified using a t-test between impulse counts in the putative response and spontaneous windows, using a corrected alpha value to maintain a 5% error rate (Rowland et al., 2007 ).
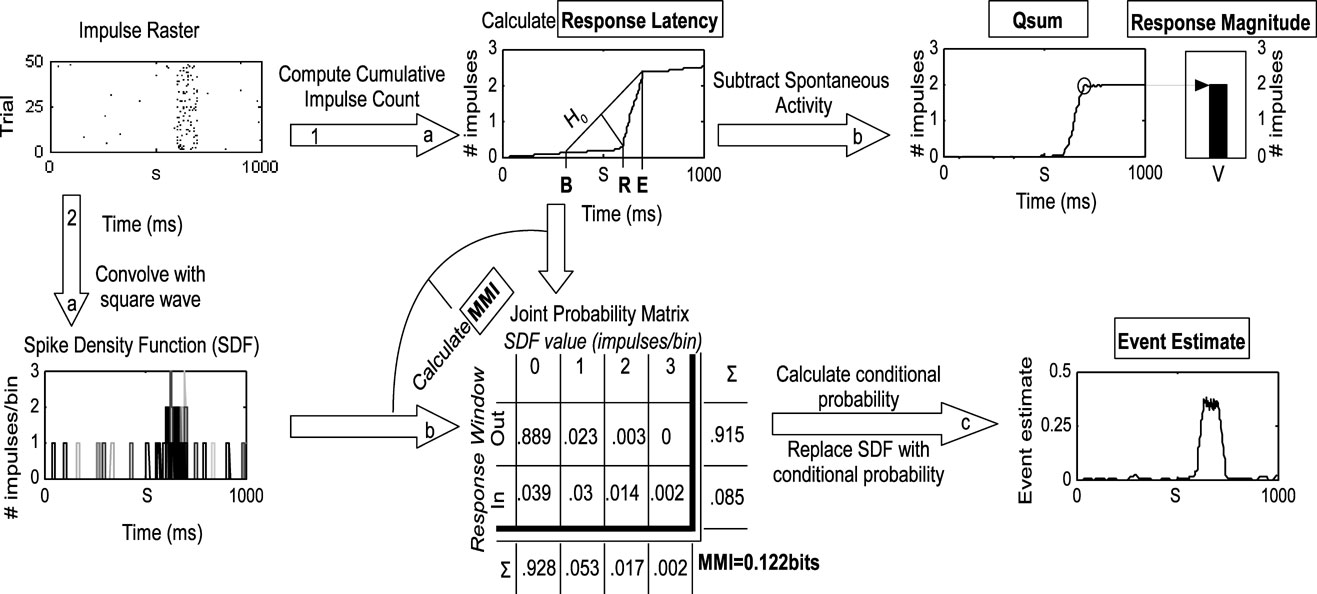
Figure 1. Methods employed in the analysis. This flow chart illustrates the two principal routes of analysis beginning at the impulse raster. The raster was generated from simulations of Poisson processes with a 0.5 Hz spontaneous rate, 20 Hz stimulus-driven rate, and a 100 ms response duration. The first route has two stages (1a and b) as follows: the raster is converted to a cumulative impulse count by keeping a running tally of the number of impulses over time and averaging across trials. The three-step geometric method is then used to first estimate the response offset (E), bracket the response onset with [B = S − (E − S)], and then find the maximum divergence of the C(T) from the null hypothesis line (H0) that connects C(B) and C(E). The time of the maximum divergence is R, the response onset. The estimate of the response offset (E) is then improved using a similar technique (not shown, see text for more details). The cumulative impulse count is then converted to the qsum by subtracting time multiplied by the spontaneous rate. The value of the qsum at E is the mean total impulse count. The second route has three stages (2a–c) as follows: the impulse raster is converted to an SDF by convolving it with a fixed-width square-wave function on a trial-by-trial basis (different shades indicate different trials in the plot). The response onset and offset are used to divide the SDF into two ranges according to whether activity is occurring inside or outside the response window. The SDF is sampled every millisecond on every trial to populate a joint probability matrix relating observed values of the SDF (e.g., 1 impulse∕bin) to the response window. The marginal distribution for each dimension is calculated by summing across each column and each row. The two marginal distributions are then multiplied to form the expected matrix given random association between SDF values and the response window (not shown). The joint probability matrix and random matrix are used together in calculating MMI as described in the text. The joint probability matrix is converted to a conditional probability by dividing each row by the marginal distribution of SDF values. The values in the bottom row of the resulting matrix replace the matching values in the SDF, thus indicating the probability at each moment in time on each trial that the observed response pattern belongs in the response window. The result is averaged across trials and corrected for spontaneous activity, resulting in the event estimate. In this example, the event estimate reaches and maintains a plateau during the response, as expected given the constant stimulus-driven firing rate in the simulation.
Response magnitude was calculated by averaging the number of impulses between R and E minus the expected number of spontaneous impulses adjusted for size of the response window.
Maximum mutual information (MMI) was calculated using a naÏve (bias uncorrected) estimator of mutual information (Nelken et al., 2005 ). Mutual information is a measure of the reliability of the sensory response, but not necessarily its magnitude (though these frequently covary). Briefly, the impulse raster was transformed to a spike-density function (SDF) through convolution with a square-wave (i.e., “boxcar”) kernel with width W. The resulting SDF was sampled every 1 ms on every trial to populate a 2-D joint probability matrix relating observed SDF values (e.g., 2 impulses∕bin) to whether they occurred inside the response window or outside of it. Next, the marginal probability distributions were calculated by summing across the columns and summing across the rows of this matrix. The marginal distributions were then multiplied (cross-product) to form the probability matrix expected from random association (not shown in Figure 1 ). The original joint probability matrix was then divided (dot quotient) by the random association matrix. The logarithm (base 2) of this matrix was then multiplied (dot product) by the original joint probability matrix. The sum of the resulting matrix (across columns and rows) determined the mutual information extractable from the SDF regarding the response window (between 0 and 1 bit) using the kernel with width W. Multiple values of W were tested for each response (2–200 ms); MMI was the largest value produced by any value of W.
The cumulative stimulus-evoked impulse count (qsum) was the mean number of stimulus-evoked impulses observed on or before each moment in time. It was calculated by correcting C(T) for spontaneous activity (subtracting time multiplied by the spontaneous rate). The qsum approximates a straight line when the firing rate is constant. Its slope corresponds to the elevation of the firing rate over spontaneous activity.
Event estimates were used as a measure of the instantaneous “report” obtainable from the neuron's response at each moment in time derived using an “optimal” decoder. This measure was derived from the SDF computed by convolving the impulse raster with the square-wave function producing the MMI. Each observed value in the SDF was replaced with the probability that that value was observed in the response window (versus being observed in the spontaneous window), calculated by transforming the joint probability matrix described above to a conditional probability matrix by dividing by the marginal distribution of SDF values. The result was averaged across trials, and corrected for spontaneous activity levels by subtracting the average estimate prior to the stimulus onset.
Data analysis
The data were analyzed in several steps. First, the unisensory responses (latencies, magnitudes, MMI, peak event estimates) were quantified and cross-correlated. Next, multisensory responses were compared to the best (i.e., fastest or largest) of the associated unisensory responses using each of these measures. The magnitude of the multisensory enhancement (MSI) for each measure was calculated as a percent change: MSI = 100 × (M − U)∕U, where M represents the multisensory response value and U represents the best unisensory value (Meredith and Stein, 1983 ). Cross-correlations between MSI values for the different measures were computed. These analyses thus quantified the incidence, magnitude, and relationships between multisensory enhancements measured over the entire response window (i.e., using time-insensitive measures).
The next part of the analysis quantified the temporal profiles of the multisensory enhancements over the population of responses using the qsum and event estimate measures. The focus here was on the average trend in the amount of enhancement over time; that is, whether response enhancements increased, stayed constant, or decreased throughout the response. All data samples were synchronized to the onset of the multisensory response. Enhancement was quantified as the difference between the multisensory response and its associated best unisensory response, which was determined by selecting the greatest value between the associated unisensory visual and auditory responses at each moment in time (the visual and auditory responses were frequently “best” at different times). This subtraction was performed for both the qsum and event estimate measures (producing Δqsums and Δestimates). The Δqsums and Δestimates were then averaged across all data samples (each is the difference between a multisensory and its best unisensory component response) to visualize the general trends. The derivative (slope) of the average Δqsum at every moment in time indicates the amount of enhancement at that moment in time, while the derivative of the Δestimate indicates the rate at which the amount of enhancement is changing. These derivatives were estimated from 10th-order polynomials fit to the average Δqsum and Δestimate functions. The derivative functions were expressed as a percentage of their maximum value. To determine how representative the resulting functions were of the average trends in the dataset, the polynomial-fitting procedure for quantifying the derivative was performed for each Δqsum and Δestimate prior to averaging, the derivative normalized by the maximum value, and then averaged across samples. If the derivatives calculated in this manner did not show the same trend as derivatives computed on the average Δqsum and Δestimate functions, then the averaged functions were unlikely to be representative of individual data samples (this did not happen here).
The above analysis profiled the existence and rate of enhancement at each moment in time after the multisensory response onset. These procedures were repeated after all data samples were normalized by the multisensory response duration, that is, all responses were “stretched” or “shrunk” in time to fit in the same window of 100 time units. This second analysis quantified the existence and rate of enhancement relative to the response duration.
Differences in the time-sensitive response measures were also assessed using a “time-to-criterion” assessment, which identified if and when each multisensory and unisensory response crossed particular threshold values (1–20 impulses for cumulative impulse count, 0–1 for event estimates). Quantification involved calculating the incidence of multisensory responses crossing thresholds earlier (or later) than either of their component unisensory response, and the timing difference between the crossings (assuming at least one unisensory response crossed the threshold).
Finally, the magnitude of the multisensory event estimate at each moment in time was compared to the predicted sum of the unisensory event estimates, computing by adding the two and subtracting their product. The multisensory response exceeds this unisensory sum when it contains additional informational information not present in the unisensory circumstance. The nature of this relationship was assessed at the beginning, middle, and end of the multisensory response.
Results
Unisensory response characteristics
The unisensory response characteristics of interest in the current dataset are shown in Figure 2 , and are consistent with previous reports using similar techniques (Perrault et al., 2005 ). On average, visual responses had a latency of 82 ms (median = 80 ms), contained 3.2 impulses (median = 1.5 impulses), communicated 0.15 bits of information (median = 0.12 bits), and produced peak event estimates of 0.37 (median = 0.35). Auditory responses exhibited an average latency of 17 ms (median = 15 ms), magnitude of 3.4 impulses (median = 1.9 impulses), information of 0.12 (median = 0.07 bits), and peak estimate of 0.45 (median = 0.37). The cross-correlations between impulse count, information, and peak estimate were high (0.82–0.89), and each was negatively correlated with latency (−0.33 to −0.43).
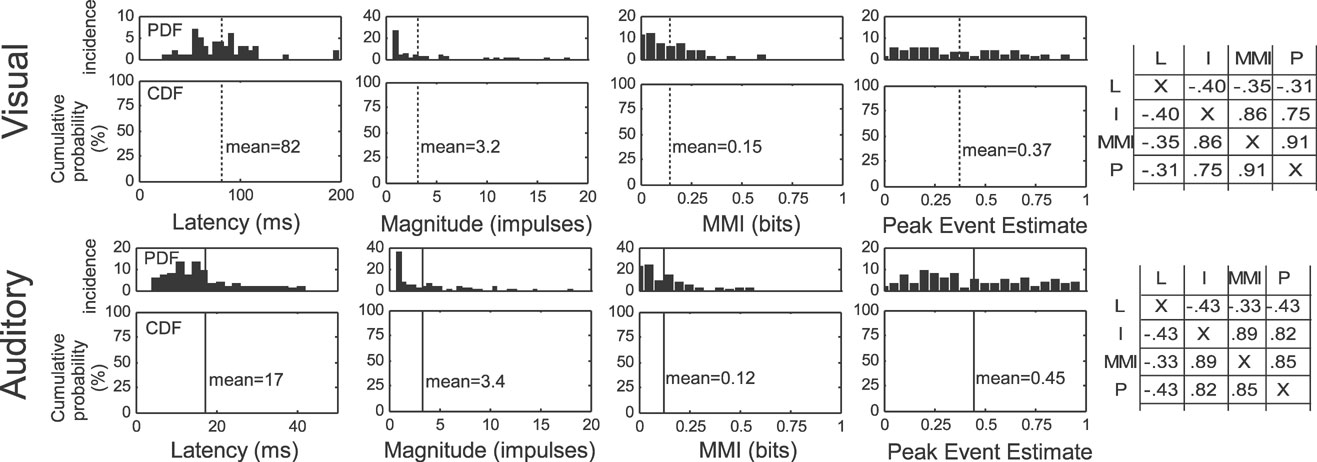
Figure 2. Unisensory response properties of multisensory SC neurons. Shown are the probability distributions (PDFs) and cumulative (probability) distribution functions (CDFs) of the response latency, magnitude, MMI, and peak event estimates for unisensory visual (top, N = 55) and auditory (bottom, N = 90) responses. Dotted lines identify the mean value for each parameter. Shown on the right are the cross-correlations between different parameters (L, latency; I, impulses (magnitude); MMI, maximum mutual information; P, peak event estimate), indicating strong positive correlations between all of the measures except response latency, which showed a weak, but consistent negative correlation (i.e., shorter latency) with the other measures.
Multisensory enhancement over the entire response
Changes in response latency, total impulse count, MMI, and the peak event estimate are measures of multisensory integration that are not time-sensitive and are derived from the entire response. The incidence and magnitude of the multisensory enhancements measured in this way were consistent with other observations (Rowland et al., 2007 ) that responses to cross-modal stimuli typically had shorter latencies and were more robust than responses to their modality-specific component stimuli. As shown in Figure 3 , the proportionate magnitude of multisensory enhancements (i.e., MSI) in response magnitude, MMI, and peak event estimate were inversely correlated with the magnitude of the best component unisensory response, a trend described as “inverse effectiveness” (Stein and Meredith, 1993 ). Multisensory-induced latency shifts also followed this trend (though not as obviously): when unisensory latencies were relatively short, multisensory responses were nearly as likely to be shorter or longer, but when unisensory latencies were comparatively long, multisensory responses were much more likely to be shorter. However, the magnitude of the latency shift did not appear to monotonically increase with the unisensory latency. Latencies were on average 23% shorter (median = 14%), magnitudes were typically 72% larger (median = 47%), MMI was usually 64% larger (median = 27%), and peak event estimates were on average 56% (median = 24%) larger in the multisensory versus the best unisensory component response. The distributions of enhancements in each response measure were biased to smaller values, but all exhibited long “tails” extending far in the enhanced direction which corresponded to the incidence of data samples with weak or modest unisensory responses.
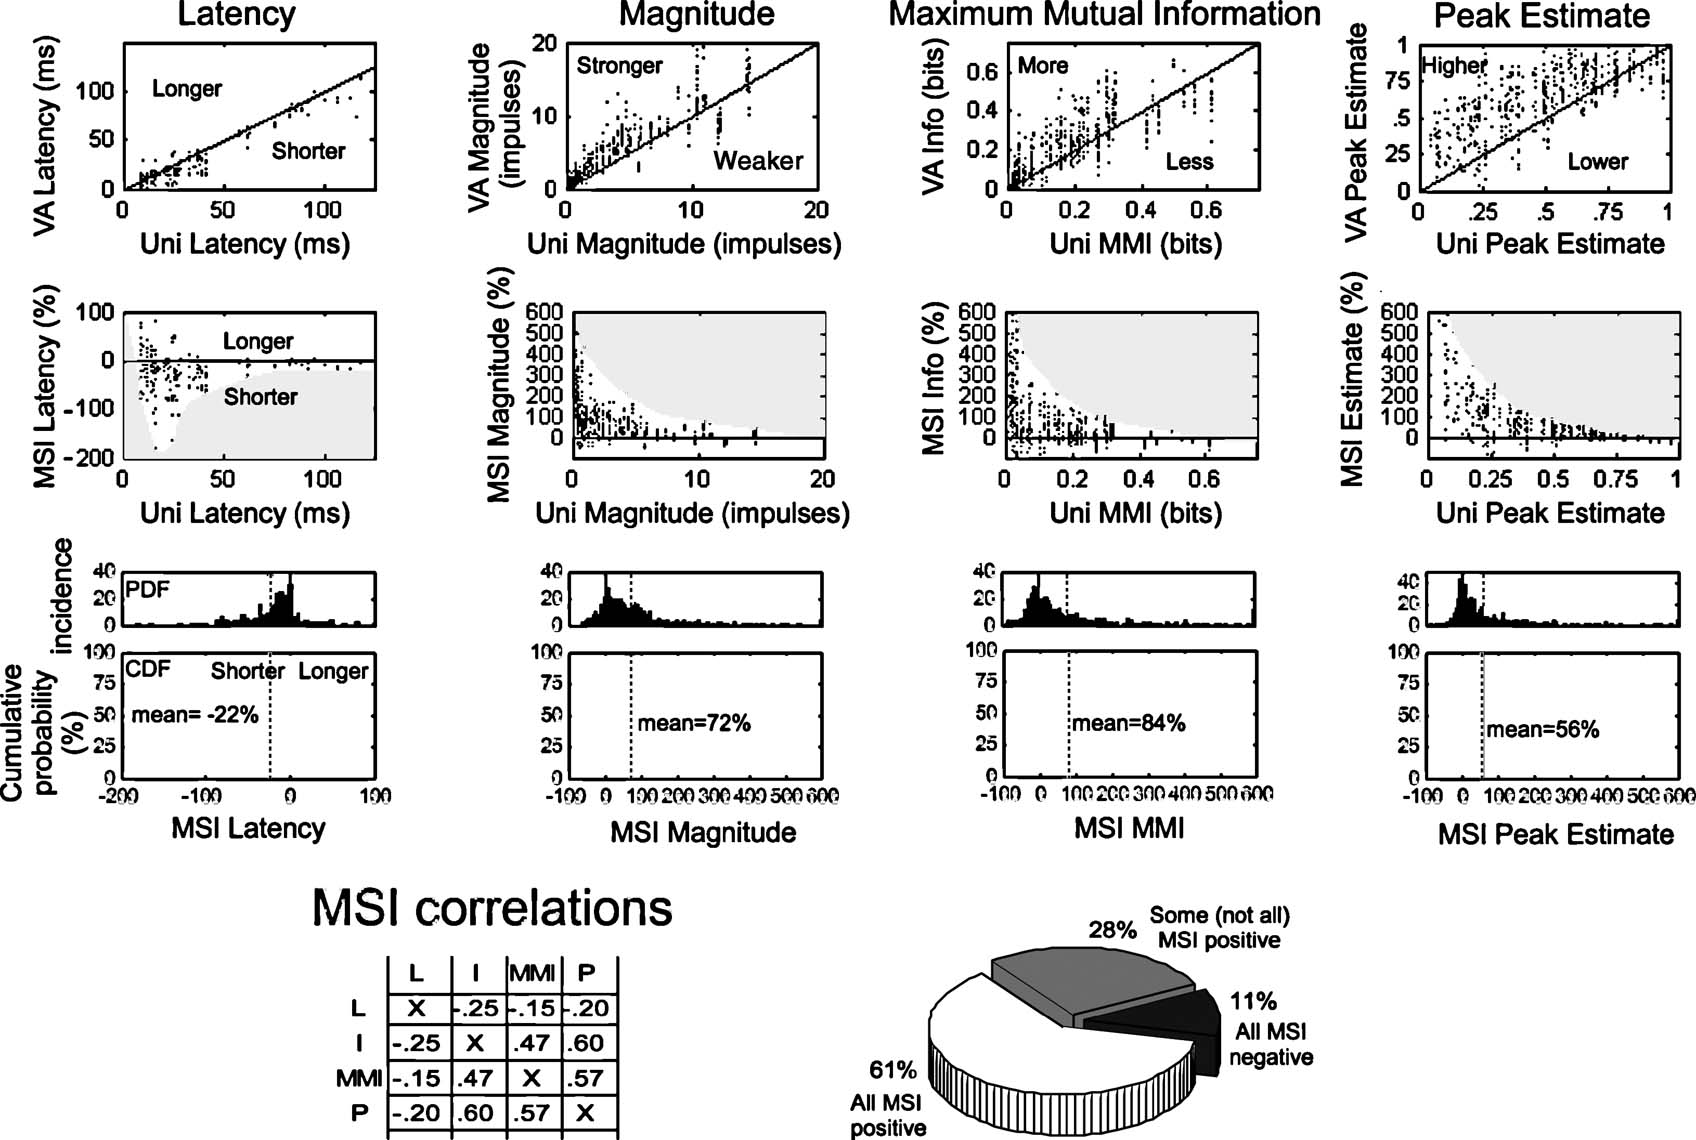
Figure 3. Measures of multisensory enhancement over the entire response. The four columns of graphs at the top profile the multisensory enhancements observed in different measures of the neural response: latency, response magnitude, MMI, and peak event estimate. The first row of graphs compares the multisensory (VA) response to the best (i.e., fastest, largest) unisensory (V or A) response value for each variable. The solid black line gives the line of unity: points falling below unity in the latency graph indicate a shorter (i.e., enhanced) multisensory latency, points falling above unity indicate enhanced multisensory responses in all other cases. The second row of graphs compares the MSI (% difference between multisensory and best unisensory response) for each measure to the best unisensory response. Gray shaded regions track the envelope of these relationships. The third row of graphs provides the probability distributions and cumulative probability distributions of MSI for each of the measures. Dotted lines identify mean values. The bottom left of the figure provides the cross-correlation between the MSI calculated using the different measures (conventions the same as Figure 2 ). The pie chart at the bottom right indicates how often the measures of response magnitude, MMI, and peak event estimate covary in the positive (61%) and negative (11%) directions.
As expected, there were significant correlations between the amounts of multisensory enhancement calculated using these different measures (0.47–0.6), albeit (as expected) weaker than the unisensory correlations (see Figure 2 ). In the majority of cases (61%) the responses had a positive MSI for all three measures, while 11% had a negative MSI in all three.
The temporal profile of multisensory enhancement
The continuous qsum and event estimate measures provide methods to assess the timing of multisensory enhancements; specifically, how they change over time. Because the qsum accumulates over time differences between qsums permit greater sensitivity to subtle or slowly evolving differences, while comparisons between event estimates allow direct assessments of the differences in the responses at each moment in time.
The multisensory and best unisensory qsums and event estimates at each moment in time were averaged across the data samples after synchronizing them by the multisensory response onset (Figure 4 , top). Because the data were not normalized by the robustness of the unisensory response, the average enhancements appeared to be modest, although in reality they represented large proportional enhancements (Rowland et al., 2007 ). Normalizing the data by the unisensory response magnitude did not affect the trends.
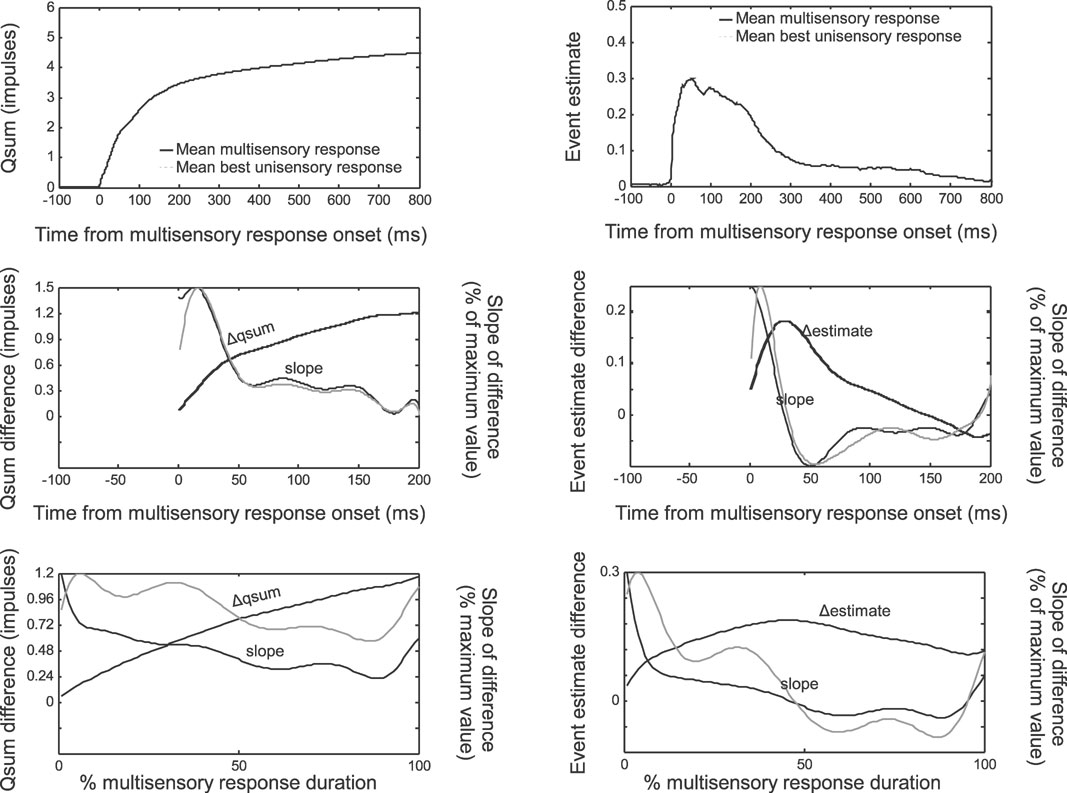
Figure 4. The temporal profile of multisensory enhancement. Multisensory and best (i.e., largest) unisensory responses are quantified as qsums (left) or event estimates (right), shifted to synchronize with the multisensory response onset, then averaged across data samples. Average multisensory qsums and event estimates reached higher values than the corresponding best unisensory responses (top). Subtracting the multisensory and unisensory responses and averaging across samples yielded mean difference functions (middle, black lines). The mean difference functions were fit with 10th-order polynomials, illustrated with dashed black lines but virtually invisible given the closeness of the fit. The derivatives of these functions are illustrated by dotted lines and scaled proportional to their maximum value (read off right axis). Darker lines indicate the slope of the function fit after averaging across samples. Lighter lines indicate the slope fit to the individual data samples and then averaged. Slopes show a general decreasing trend. Normalizing these functions for different values of response duration (bottom) revealed the same overall trend: enhancements were high at the beginning of the response, and decreased rapidly within 40 ms or 50% of the total response duration. However, enhancement continued throughout the response.
The average difference between the multisensory and best unisensory qsums (Δqsum) revealed a function that abruptly increased at the response onset and afterwards approached a plateau. This was also reflected in the decreasing slope (Figure 4 , middle left) of the mean Δqsum which was halved within the first 40 ms of the response. This indicated that after 40 ms the average difference between the multisensory and best unisensory qsums was still growing but not as quickly as earlier (the magnitude of the enhancement was not as great). The slope reached approximately zero within 200 ms. These qsum observations are paralleled by the trends evident in the average event estimate difference (Δestimate) between the multisensory and best unisensory responses (Figure 4 , middle right). The Δestimate function indicates the amount of enhancement present at each moment in time. Its slope indicates the rate of enhancement. In parallel to the result obtained from the Δqsum, the amount of enhancement indicated by the Δestimate peaked at around 40 ms after the response onset (slope of the line approached zero). There is a good deal of similarity between the slopes calculated after the responses are averaged and the individual data samples contained in the average.
When the data were normalized by the multisensory response duration, the same trends were apparent but were less dramatic (Figure 4 , bottom). The slope of the Δqsum was halved within the first 50% of the multisensory response duration, approximately at the same time that the slope of the 5«estimate approached zero. These results are consistent with the hypothesis that multisensory integration is characterized by an IRE (Rowland et al., 2007 ); that is, enhancements are present and the rate of response magnitude enhancement is greatest at the beginning of the response.
Multisensory enhancement speeds responses
Single neurons within a network are thought to act as logic gates, generating responses proportional to their inputs once they have exceeded a threshold value. Within this framework, it is reasonable to assume that neurons receiving input from the SC initiate their responses when inputs cross certain threshold criteria. A “time-to-criterion” analysis calculated the earliest time that each response crossed threshold criteria (Figure 5 ) and revealed that multisensory qsums and event estimates were roughly twice as likely to cross most threshold values than their unisensory component responses, and that there was a very low incidence (<5%) of multisensory responses that did not meet a criterion met by either of its unisensory responses (Figure 5 , middle row, see asterisk). Not only were multisensory responses more likely to reach threshold criteria, they almost always reached them earlier: multisensory responses reached criteria earlier than either unisensory response in 76–95% of the samples in each criterion set (average difference = 10 ms, no consistent trend across criteria). Multisensory enhancements in this regard were slightly more dramatic when the response was measured by event estimate versus qsum. Thus, multisensory integration had a more substantial impact when the time domain was considered, even greater than is evident from measures averaged across the entire response duration (e.g., see Figure 3 ).
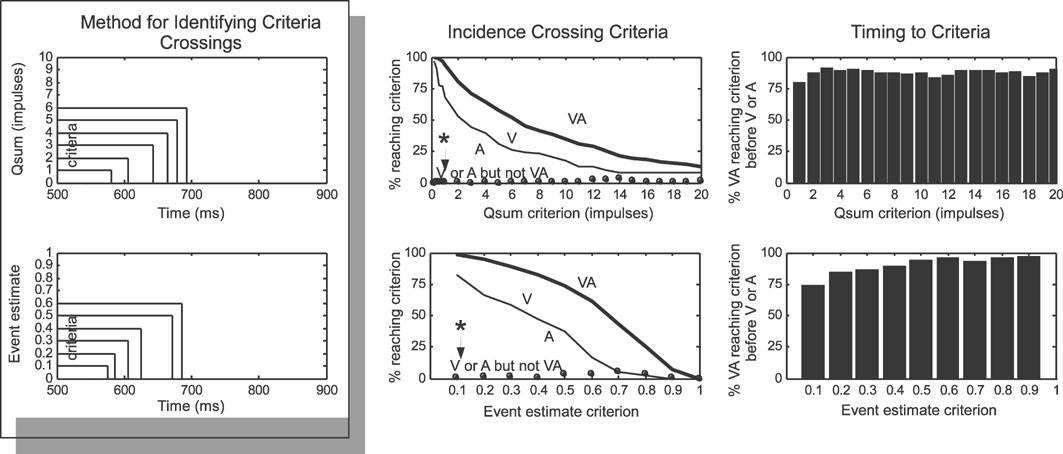
Figure 5. Multisensory responses reach higher levels earlier. Left: this analysis determined if and when responses quantified as qsums (top) or event estimates (bottom) reached threshold criteria levels. Middle and Right: multisensory responses crossed criteria levels more often (Middle) and earlier (Right) than did unisensory responses, and there were virtually no cases (see asterisk and arrow) where unisensory responses reached a criterion not also reached by the multisensory response. See text for more details.
Initial response enhancement
Summing two unisensory event estimates and subtracting their product (because event estimates are derived from probabilities) yields a prediction for the multisensory response that is exceeded when the multisensory response reflects a non-linear, superadditive interaction. Thus, the “impact” of integration is greatest when the multisensory response exceeds this sum. To evaluate this phenomenon, event estimates were sampled with 1 ms resolution and normalized by the multisensory response duration (see above). Multisensory event estimates during the response were then compared to the sum of the unisensory estimates, minus their product, revealing a clear trend over time (Figure 6 ). In the first quarter of the multisensory response, unisensory responses were minimal and multisensory event estimates exceed their sum 87% of the time (random = 50%). In the second quarter of the multisensory response, unisensory responses have increased but multisensory event estimates were still generally greater than the sum (83% of the time). The enhancement decreased in the third quarter, where multisensory estimates exceeded the sum 75% of the time. In the fourth quarter of the response, multisensory estimates still exceeded the sum in the majority of cases (65% of the time), but the incidence was significantly decreased from its initial value. The most significant declines in this incidence were observed in the latter half of the response.
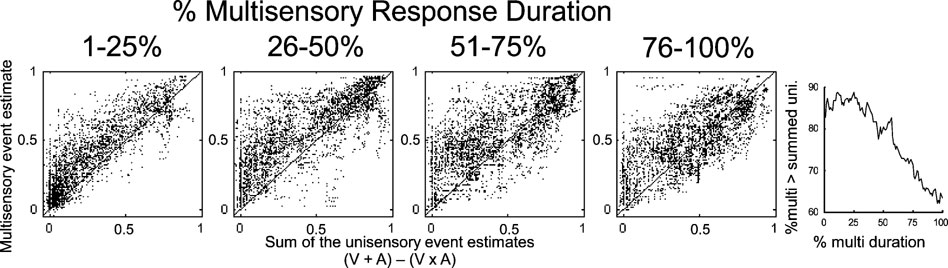
Figure 6. Initial response enhancement. The multisensory event estimate was compared to the sum of the two unisensory estimates (minus their product) in different stages of the multisensory response (240 multisensory responses sampled with 1 ms resolution). In the first quarter, multisensory event estimates were usually (87% of the time) greater than the sum of the unisensory estimates. This elevation was maintained in the second quarter, where multisensory event estimates exceeded the unisensory sum 83% of the time. The final two quarters showed increasing parity between the multisensory and summed unisensory event estimates (3rd = 75%, 4th = 65%). The figure on the right provides the incidence of multisensory event estimates greater than the unisensory sum over the duration of the multisensory response (1–100% in 1% steps). Initially more than 85% of multisensory estimates exceeded the sum, but at the end of the response, less than 65% did so.
Discussion
Prior research has established that multisensory enhancements are proportionally largest at the beginning of the response, creating what has been referred to as an initial response enhancement, or IRE (see Rowland et al., 2007 ). A major contributing component of that result was that multisensory responses typically exhibited shorter latencies; so that the initial responses were compared to non-existent or minimal (just beginning) unisensory responses. The present results showed that the IRE is not restricted to this circumstance. Indeed, the acceleration in the magnitude of the IRE continues even when the unisensory response is present. Overall, its acceleration is greatest during the first 40 ms (or 50% of the total multisensory response duration).
The implication of these results is that multisensory integration takes place immediately so that the streams of concordant information that are derived from cross-modal sources are being integrated as soon as they are available to the neuron. This functional model is consistent with shortening of response latencies to cross-modal stimuli (Figure 3 ), presumably due to the summation and integration of subthreshold inputs at the SC neuron where the computation is being performed (Rowland et al., 2007 ). This observation has yet to be reconciled with evidence that the SC obtains cross-modal information directly, but its multisensory response enhancement requires inputs that are also relayed through association cortex (Jiang et al., 2001 ; Jiang and Stein, 2003 ; Wallace et al., 1993 ). We believe that this likely reflects the long period during which subthreshold inputs from all sources are being integrated.
These issues speak of the importance of the temporal domain in the analysis of multisensory processes. The SC is believed to be engaged in the detection and localization of stimuli, and subsequently in the evocation of orienting responses (Sprague and Meikle, 1965 ). Ideally, responses should be made as soon as possible. Consequently, the amount of information present at the beginning of the response and the rate with which it is communicated are likely to be critically important in determining the success or failure of a behavioral product. This is likely achieved by shortening response latencies as shown here as well as decreasing the interval between the sensory and premotor responses (see also (Bell et al., 2006 ; Whitchurch and Takahashi, 2006 )).
Conflict of Interest Statement
The authors declare that the research was conducted in the absence of any commercial or financial relationships that could be construed as a potential conflict of interest.
Acknowledgements
We thank Nancy London for technical help and Stephan Quessy and Terrence Stanford for their help with initial dataset. This research was supported by NIH grants NS36916 and EY016716.
References
Bell, A. H., Meredith, M. A., Van Opstal, A. J., and Munoz, D. P. (2006). Stimulus intensity modifies saccadic reaction time and visual response latency in the superior colliculus. Exp. Brain Res. 174, 53–59.
Binns, K. E., and Salt, T. E. (1996). Importance of NMDA receptors for multimodal integration in the deep layers of the cat superior colliculus. J. Neurophysiol. 75, 920–930.
Frens, M. A., Van Opstal, A. J., and Van der Willigen, R. F. (1995). Spatial and temporal factors determine auditory-visual interactions in human saccadic eye movements. Percept. Psychophys. 57, 802–816.
Gielen, S. C., Schmidt, R. A., and van den Heuvel, P. J. (1983). On the nature of intersensory facilitation of reaction time. Percept. Psychophys. 34, 161–168.
Goldring, J. E., Dorris, M. C., Corneil, B. D., Ballantyne, P. A., and Munoz, D. P. (1996). Combined eye-head gaze shifts to visual and auditory targets in humans. Exp. Brain Res. 111, 68–78.
Hughes, H. C., Reuter-Lorenz, P. A., Nozawa, G., and Fendrich, R. (1994). Visual-auditory interactions in sensorimotor processing: saccades versus manual responses. J. Exp. Psychol. Hum. Percept. Perform. 20, 131–153.
Jiang, W., Wallace, M. T., Jiang, H., Vaughan, J. W., and Stein, B. E. (2001). Two cortical areas mediate multisensory integration in superior colliculus neurons. J. Neurophysiol. 85, 506–522.
Jiang, W., Jiang, H., and Stein, B. E. (2002). Two corticotectal areas facilitate multisensory orientation behavior. J. Cogn. Neurosci. 14, 1240–1255.
Jiang, W., and Stein, B. E. (2003). Cortex controls multisensory depression in superior colliculus. J. Neurophysiol. 90, 2123–2135.
Meredith, M. A., and Stein, B. E. (1983). Interactions among converging sensory inputs in the superior colliculus. Science 221, 389–391.
Nelken, I., Chechik, G., Mrsic-Flogel, T. D., King, A. J., and Schnupp, J. W. (2005). Encoding stimulus information by spike numbers and mean response time in primary auditory cortex. J. Comput. Neurosci. 19, 199–221.
Perrault, T. J., Jr., Vaughan, J. W., Stein, B. E., and Wallace, M. T. (2005). Superior colliculus neurons use distinct operational modes in the integration of multisensory stimuli. J. Neurophysiol. 93, 2575–2586.
Perrott, D. R., Saberi, K., Brown, K., and Strybel, T. Z. (1990). Auditory psychomotor coordination and visual search performance. Percept. Psychophys. 48, 214–226.
Pouget, A., Deneve, S., and Duhamel, J. R. (2002). A computational perspective on the neural basis of multisensory spatial representations. Nat. Rev. Neurosci. 3, 741–747.
Rowland, B. A., Quessy, S., Stanford, T. R., and Stein, B. E. (2007). Multisensory integration shortens physiological response latencies. J. Neurosci. 27, 5879–5884.
Sprague, J. M., and Meikle, T. H. (1965). The role of the superior colliculus in visually guided behavior. Exp. Neurol. 11, 115–146.
Stein, B. E., and Meredith, M. A. (1993). The merging of the senses (Cambridge, Massachusetts, MIT Press).
Stein, B. E., Wallace, M. W., Stanford, T. R., and Jiang, W. (2002). Cortex governs multisensory integration in the midbrain. Neuroscientist 8, 306–314.
Wallace, M. T., Meredith, M. A., and Stein, B. E. (1993). Converging influences from visual, auditory, and somatosensory cortices onto output neurons of the superior colliculus. J. Neurophysiol. 69, 1797–1809.
Whitchurch, E. A., and Takahashi, T. T. (2006). Combined auditory and visual stimuli facilitate head saccades in the barn owl (Tyto alba). J. Neurophysiol. 96, 730–745.
Keywords: multisensory, superior colliculus, physiology, cross-modal, information, latency
Citation: Benjamin A. Rowland and Barry E. Stein (2007). Multisensory integration produces an initial response enhancement. Front. Integr. Neurosci. 1:4. doi: 10.3389/neuro.07/004.2007
Received: 15 August 2007;
Paper pending published: 8 October 2007;
Accepted: 29 October 2007;
Published online: 30 November 2007
Edited by:
Sidney A. Simon, Duke University Medical Center, USAReviewed by:
Emiliano Macaluso, Neuroimaging Laboratory, Fondazione Santa Lucia, Rome, ItalySidney A. Simon, Duke University Medical Center, USA
Copyright: © 2007 Rowland and Stein. This is an open-access article subject to an exclusive license agreement between the authors and the Frontiers Research Foundation, which permits unrestricted use, distribution, and reproduction in any medium, provided the original authors and source are credited.
*Correspondence: Benjamin A. Rowland, Department of Neurobiology and Anatomy, Wake Forest University School of Medicine, Medical Center Boulevard, Winston-Salem, NC 27157, USA. e-mail: browland@wfubmc.edu