Spontaneous electrical activity and behavior in the leech Hirudo medicinalis
- 1 Departamento de Neurociencias, CIMA, Pio XII, Spain
- 2 Institute for Scientific Interchange (ISI), Viale S. Severo 65, Italy
- 3 Scuola Internazionale Superiore di Studi Avanzati (SISSA), AREA Science Park, Italy
In the absence of external stimuli, animals explore the environment by performing irregular movements, but the neuronal mechanisms underlying this arrhythmic motion are largely unknown. In this paper, we studied the relationship between the spontaneous neuronal activity in the leech (Hirudo medicinalis) and its behavior. We analyzed the electrical activity of isolated ganglia, chains of two connected ganglia, and semi-intact preparations. The spontaneous electrical activity in ganglia was characterized by the occurrence of irregular bursts of spikes with variable duration and size. Properties of these bursts were modified by synaptic inputs arriving from the neighboring ganglia and from the two primitive brains located in the head and tail. In fact, in semi-intact preparations, unusually large bursts of spikes occurring spontaneously were recorded and caused the leech to move even in the absence of any external sensory stimulation. These large bursts appear to act as internal triggers controlling the spontaneous leech behavior and determining the duration of stereotypical motor patterns.
Introduction
Basic mechanisms underlying muscle activation and motor control seem largely shared among different species (Grillner, 2003 ). Reflexes, such as the withdrawal from a noxious stimulation, and periodic behaviors, such as the beating of the heart or the pace of a walk, have been extensively studied (Grillner et al., 2005 ; Wenning et al., 2004a ; Wenning et al., 2004b ) and, to some extent, understood. Reflexes originating from feed-forward networks initiate movements as a direct response to sensory inputs (Sandrini et al., 2005 ). Central pattern generators (CPGs) are networks of neurons able to generate a rhythmic pattern of spikes when triggered by appropriate stimuli (Marder, 2001 ). CPGs have been found in a variety of preparations in both invertebrates (Nusbaum and Beenhakker, 2002 ; Marder et al., 2005 ) and vertebrate species (Grillner, 2004 ; Grillner et al., 2005 ), but it is obvious that the full range of animal motions consists of more than rhythmic movements and reflexes. Animals often perform irregular movements that are not directly evoked by external trigger events, but the neuronal mechanisms responsible for such proactive behaviors have been investigated only recently (Lee and Assad, 2003 ; Maimon and Assad, 2006 ) and are still largely unknown. We think that this kind of behavior could be driven by the spontaneous electrical activity that is always present in the nervous system (Harris, 2005 ; Raichle, 2006 ) and that is already known to affect the response of many neuronal networks to external stimuli (Arieli et al., 1996 ; Fiser et al., 2004 ; Hasenstaub et al., 2007 ; MacLean et al., 2005 ).
The leech is an ideal preparation to study the neuronal correlates of behaviors (Kristan et al., 2005 ) because of the extremely simple structure of its nervous system (Nicholls and Van Essen, 1974 ). Neuronal mechanisms initiating local bending (Garcia-Perez et al., 2004 ; Lewis and Kristan, 1998 ) and whole body shortening (Arisi et al., 2001 ; Shaw and Kristan, 1999 ) are currently well understood. CPGs controlling the periodic movements of swimming (Brodfuehrer and Friesen, 1986 ; Brodfuehrer and Thorogood, 2001 ) and crawling (Cacciatore et al., 2000 ; Eisenhart et al., 2000 ) have been discovered and studied in detail.
We have previously provided a quantitative characterization of the spontaneous behavior of the leech in the absence of direct sensory stimulation (Garcia-Perez et al., 2005 ) and a description of the motoneurons activity in isolated leech ganglia (Mazzoni et al., 2007 ). In order to understand the relationship between the onset of irregular movements and spontaneous electrical activity it is necessary to understand how this activity is determined within the entire leech nervous system and its effects on muscle activation. In this paper, we have analyzed and compared the properties of the spontaneous activity in semi-intact leeches, where the entire leech nervous system is present, in isolated chains of two connected ganglia and finally in isolated ganglia. Additionally, we investigated the spontaneous firing of single neurons and their role in bursts of electrical activity. Finally, we analyzed the relationship between spontaneous electrical activity and behavior and, in particular, how large bursts of spikes initiate spontaneous body motions. This multi-level analysis allows the investigation of spontaneous activity in an in vivo neuronal network.
Materials and Methods
Animals and preparations
Medicinal leeches (Hirudo medicinalis) were obtained from RICARIMPEX (Eysines, France) and kept at 5°C in tap water dechlorinated by aeration for 24 hours. Different preparations were used as illustrated in Figure 1 A. We used semi-intact preparations, where pairs of adjacent ganglia were cleaned from the surrounding tissue with the rostral ganglion usually lying between the 9th and 11th ganglion of the nerve cord. Ganglia were isolated from the body wall segment cutting the corresponding roots but remained connected to the rest of the animal (see Figure 1 A, left panel). In each ganglion we recorded the electrical activity of 3–6 roots drawn into glass suction pipettes (Arisi et al., 2001 ). In this way we recorded extracellular spikes (Figure 1 B) from leech motoneurons. In semi-intact preparations it was possible to record electrical signals from central ganglia and to observe the motion of the head and tail of the leech simultaneously (see Behavior analysis).
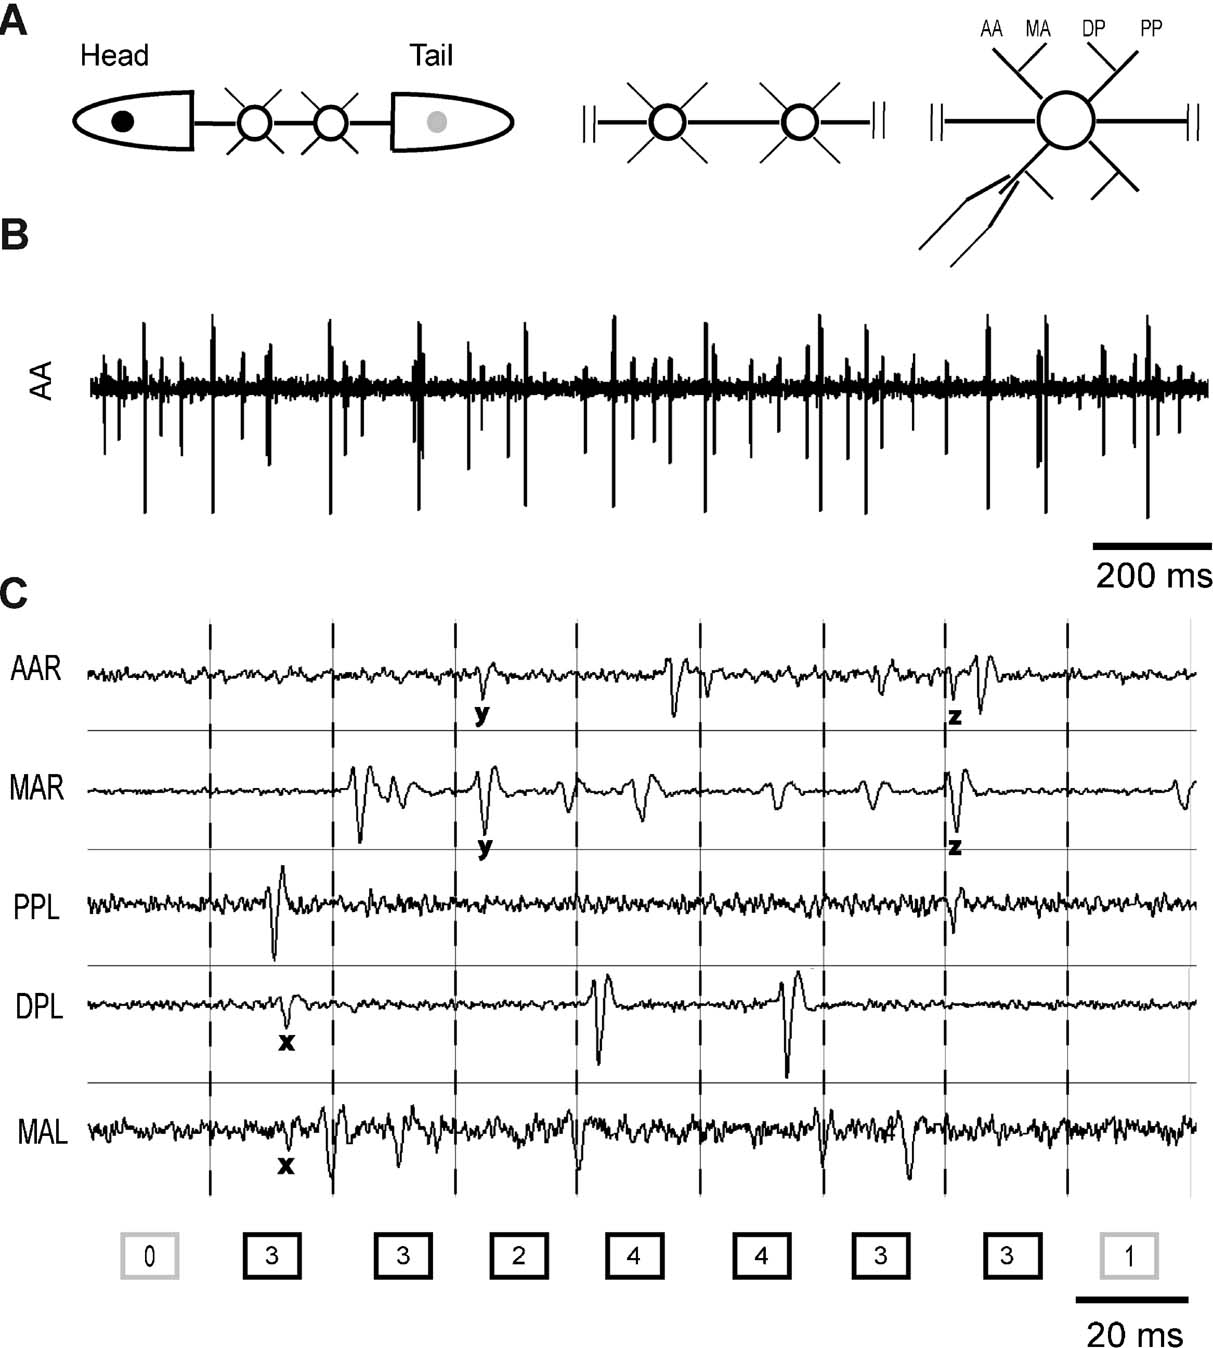
Figure 1. Preparations and burst identification. (A) From left to right: a semi-intact preparation with two exposed ganglia connected to the whole nervous system of the leech, a chain of two connected ganglia and an isolated ganglion. AA, MA, DP, and PP indicate respectively anterior anterior, median anterior, dorsal posterior, and posterior posterior root. (B) Example of an extracellular recording from the anterior anterior root. (C) Extracellular recordings from five roots on the right (R) and left (L) side of the same ganglion. Recording time is divided into bins and the number of spikes recorded in every bin is indicated in the boxes at the bottom. x, y, and z indicate spikes recorded in more than one root. Dark boxes correspond to active bins, with at least two spikes. A burst is identified by a strip of consecutive active bins separated by boxes having zero or one spike.
The connective fibers between the pair of ganglia and the two ends were subsequently cut and the second preparation consisting of a chain of two ganglia linked by the connective fibers (Figure 1 A, middle panel) was obtained. Finally, the connective fiber between the two ganglia was cut, in order to obtain two isolated ganglia (Figure 1 A, right panel).
All preparations were kept in a Sylgard-coated dish at room temperature (20–24°C) and bathed in Ringer's solution (in mM: 115 NaCl, 1.8 CaCl2, 4 KCl, 12 glucose, 10 Tris maleate buffered to pH 7.4).
Network firing rate
Spike sorting was carried out using software developed in our laboratory. The duration of the recording was divided into bins of constant width (Figure 1 C). For each single neuron the number of spikes occurring in each bin was counted, and the resulting discrete time series represented the neuron firing rate. The network firing rate is defined as the sum of all neuron firing rates (i.e., the number of all spikes recorded in the network for each bin).
Since some motoneurons project their axons in more than one root some spikes could be simultaneously recorded in different roots. For this reason, to avoid double recording, spikes occurring in different ipsilateral roots but in less than 2 ms were counted as one single spike in the network firing rate.
The power spectrum of the network firing rate was computed with a bin width of 10 ms by using pwelch function in Matlab.
For each pair of neurons we computed the correlation coefficient (Papoulis, 1984 ) of the neuron firing rates with a bin width of 500 ms. Correlation coefficients were then averaged over all pairs to obtain the network correlation coefficient.
Bursts identification
The bursts identification procedure was similar to that used for identifying bursts of local field potentials (Beggs and Plenz, 2003 ). As outlined in Figure 1 C, electrical recordings from several roots were divided into bins of a given duration. To assess the optimal bin size, the distribution of inter-spike intervals (ISIs) between successive spikes in the network was computed and fitted by a bi-exponential function

where C1 and C2 are two constants and τshort and τlong are a fast and a slow time constant, respectively. The network firing rate with a bin width equal to τlong was calculated, and strips of adjacent bins containing more than one spike were considered as bursts.
Notice that the bin width depended on the average activity: the lower the activity the larger the width. In this way, bursts were defined as intervals in which the firing was particularly intense in relation to the rest of the recording, and were correctly and independently identified based either on the average firing rate of the ganglion or on the number of recorded roots. The burst size is the total number of spikes within the burst, and its duration is the time interval between the first and the last spike of the burst.
Behavior analysis
Behavior was monitored as described in Mazzoni et al., (2005) . Briefly, the animal was anesthetized, two colored beads were glued on its dorsal side next to the head and to the tail, and when the animal recovered from anesthesia the motion of the beads was tracked in real time. A color CCD camera with 640 × 480 pixels of image size (WATEC 231S) monitored the leech from above. The beads were tracked at 20 Hz, using software developed in our laboratory with LabVIEW 6.1 (NATIONAL INSTRUMENTS). The position of the beads on the image plane was acquired as Cartesian coordinates and the following four time series were obtained

steps of 50 ms
The value of the displacement velocity of the beads was then calculated as

A bead was considered to be moving if its velocity was higher than (µnoise ± 3 σnoise).
For each experiment we recorded the position of the beads also when the animal did not move in order to estimate the mean velocity due to the noise (µnoise) and its standard deviation (σnoise).
Results
The spontaneous activity in leech ganglia
The spontaneous activity observed in leech ganglia was influenced by electrical signals arriving from the rest of the nervous system of the animal. These effects were observed in semi-intact preparations (Figure 2 A), where it was possible to record the activity of ganglia connected to the intact nervous system of the leech. In these preparations, the network firing rate of the ganglion was characterized by large bursts with an average duration of ∼5 seconds (Figure 2 A, left panel and Figure 3 B).
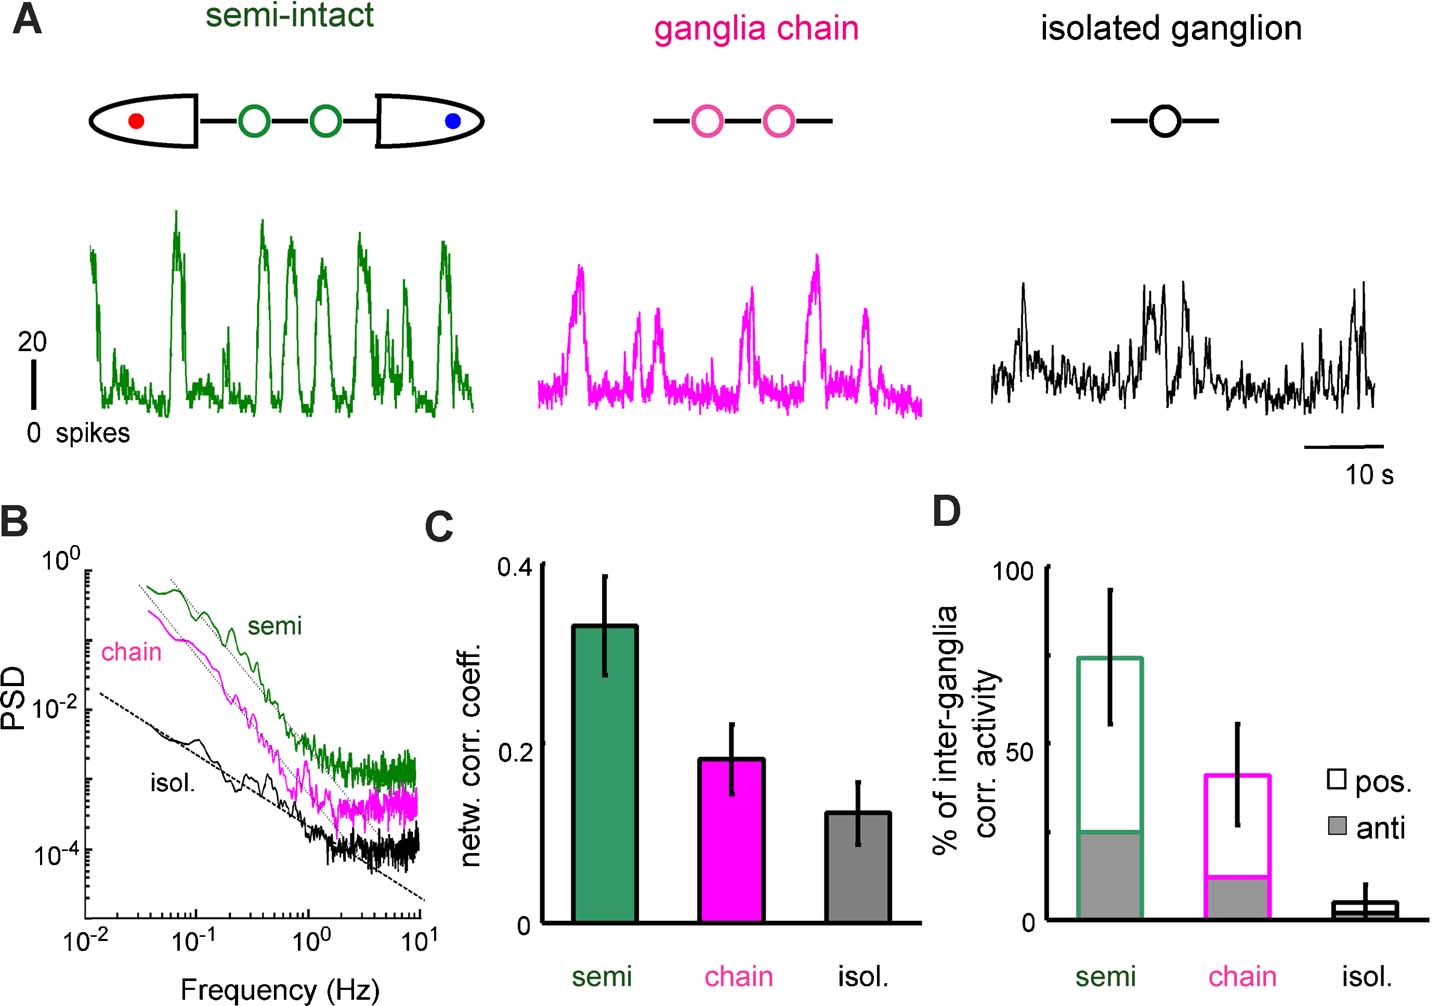
Figure 2. Spontaneous activity in isolated and connected ganglia. (A) Network firing rate in a semi-intact preparation (left), in a chain of two connected ganglia (center) and in an isolated ganglion (right). All electrical recordings were obtained from the same ganglion, starting from a semi-intact preparation and subsequently cutting the connective fibers, as illustrated in the upper portion of the panel. (B) PSD of the network firing rate of the same ganglion in the three preparations. Green and magenta plots of PSD were vertically shifted, respectively by factors 10 and 5, to allow a better comparison. The black dashed line has a −1 slope and the black dotted lines have a −2 slope. (C) Network correlation coefficient for the three preparations. (D) Percentage of time of correlated activity between the two ganglia in the three preparations. Correlation can be positive (in phase) or negative (in anti-phase).
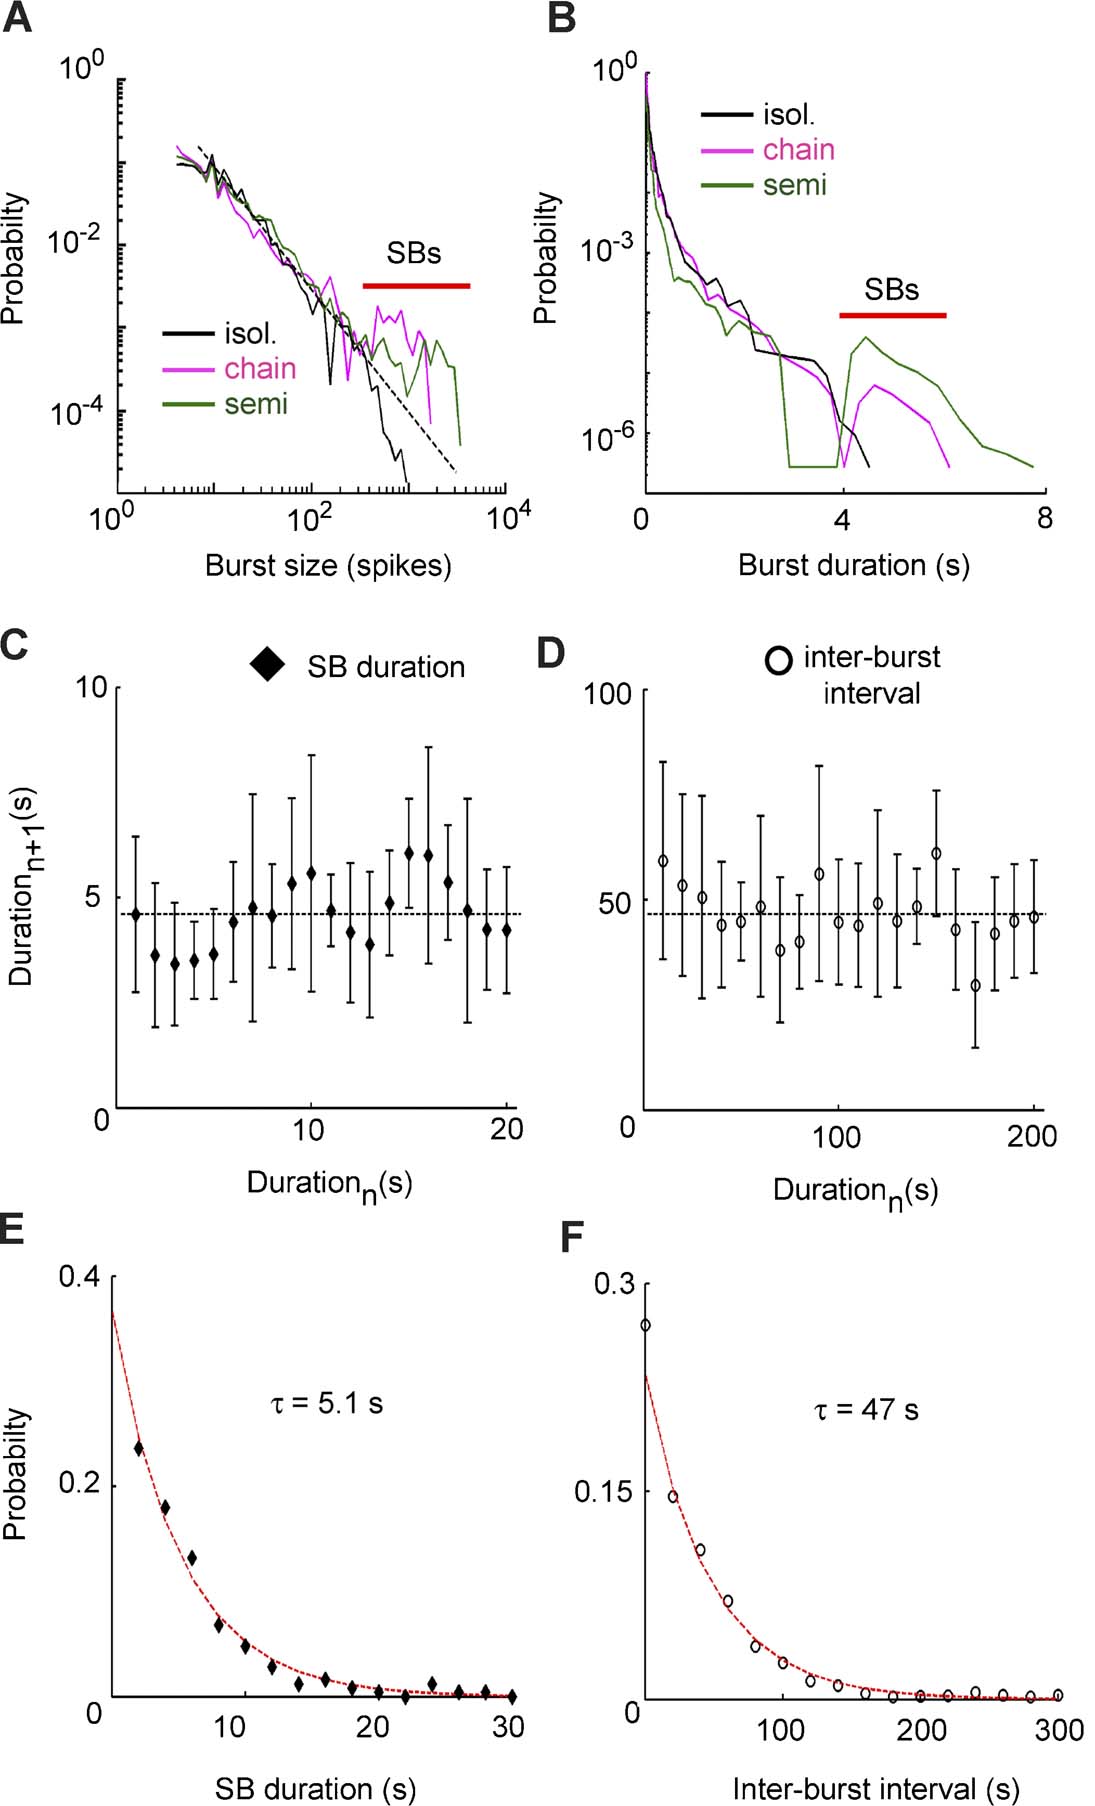
Figure 3. Bursts statistics in different preparations. Data plotted in panels (A) and (B) refer to the same representative ganglion. (A) Burst size distribution in the three preparations. Black dashed line indicates −3∕2 slope. The red line indicates sustained bursts (SBs). (B) Burst duration distribution for the three preparations in semi-log scale. The red line indicates SBs. Data plotted in panels (C)–(F) are collected from the complete set of the experiments. (C) Recurrent plot of SB durations. (D) Recurrent plot of inter-burst intervals duration. (E), (F) Distribution of SB durations and inter-burst durations. The red line indicates exponential fit (χ2 test, p > 0.05).
When the connective fibers joining the chain of the two ganglia to the rest of the animal were cut, these large bursts became less intense and more irregular (Figure 2 A, middle panel). When the connective fibers joining a ganglion to the neighbor ganglion were cut, and the ganglion remained isolated, bursts had a very variable size and a duration ranging from tens of milliseconds to several seconds (Figure 2 A, right panel, and Figure 3 B).
Changes in the properties of the firing rate were quantified by comparing the statistical properties of the same ganglion in different configurations. In all experiments (7∕7) in semi-intact and ganglia chain configurations (respectively green and magenta lines of Figure 2 B), the power spectral density (PSD) of the firing rate decreased with frequency as 1∕f2 (mean slope = 1.7 ± 0.4), whereas in the same isolated ganglion the PSD had a 1∕f behavior (mean slope = 0.97 ± 0.3, black line of Figure 2 B). This change in the slope indicates that in semi-intact and ganglia chain preparations, correlations on long timescales are more relevant than in isolated ganglia. No peak was present in the PSD in any configuration (0∕7), indicating the absence of periodic components in the firing rate. We analyzed the correlation between pairs of ganglia and between neurons inside the same ganglion in different configurations. The network correlation coefficient (see Materials and Methods ) among neurons in the same ganglion was 0.30 ± 0.04 in semi-intact leeches, but it decreased to 0.18 ± 0.02 when the ganglia pair was disconnected from the rest of the body, and decreased further to 0.12 ± 0.02 when the ganglia were completely isolated (Figure 2 C). The correlation coefficient among connected ganglia varied in time, so we divided the recording time into 30 seconds bins and we evaluated the correlation among the network firing rates of the two ganglia for each frame. On average, the anterior and the posterior ganglia were correlated (or anti-correlated) for 74 ± 13% of the time in semi-intact configurations and for 49 ± 9% of the time in ganglia chain configurations (Figure 2 D). The activities of the neighboring ganglia were significantly more correlated (t-test, p < 0.05) when the ganglia interacted also with the rest of the body. Therefore, in the semi-intact configuration, the spontaneous electrical activity was more correlated, both between neighboring ganglia and among neurons in the same ganglion.
In 7∕7 experiments, the burst size distribution in semi-intact leeches and in ganglia chains was described by a power law followed by a peak (Figure 3 A) corresponding to the occurrence of very large bursts (indicated by the red bar). Bursts belonging to this peak will be referred to as Sustained Bursts (SB). SBs caused a similar peak in the burst duration distribution (Figure 3 B), where the peak was, on average, set at ∼5 seconds. This duration was longer than the longest burst that we ever recorded in isolated ganglia.
Bursts in isolated ganglia had a very broad range of sizes and duration: the coefficient of variation (CV) was 3.6 ± 1.4 for burst sizes and 2.4 ± 0.9 for burst durations (n = 7). The SB present in ganglia chains and semi-intact preparations had instead a more regular shape: the CV decreased to 0.87 ± 0.4 (sizes) and 0.58 ± 0.2 (durations) for ganglia chains and 0.45 ± 0.2 (sizes) and 0.41 ± 0.15 (durations) for semi-intact leeches (n = 7). Standard errors refer to variability across different experiments.
To test whether SBs were periodic or had some other type of temporal pattern, we analyzed the distribution of intervals between successive SBs and the distribution of their duration in the semi-intact preparations.
If SBs were periodic, even for a subset of the recording time, the duration of one SB and∕or inter-burst intervals duration were expected to be similar to the next SB. The two values were instead not correlated (r < 0.05 for both correlations for 6∕7 experiments), indicating that SBs did not follow any periodic or regular dynamics (Figures 3 C and 3 D). In one experiment we observed a quasi-periodic bursting activity in both semi-intact and ganglia chain preparations with an inter-burst interval of 24 ± 6 seconds for most of the recording time. The distributions of SBs durations and inter-burst intervals were both exponential in the semi-intact preparations (n = 7, χ2 test, p > 0.05), as shown in Figures 3 E and 3 F. The average time was τ = 5.1 ± 0.8 seconds for SBs durations and τ = 47 ± 5 seconds for inter-burst intervals duration.
These results indicated that in isolated ganglia the activity was very irregular, but interactions with the rest of the body produced SBs with less variable size and duration. We observed that SBs were not periodic since inter-event intervals were not constant but exponentially distributed.
As a next step we investigated whether regular and SBs were initiated by the firing of a specific neuron or by a set of neurons and to do so, we determined which motoneurons fired the first spike in each burst. We then computed the percentage of spikes fired by one specific motoneuron during the entire experiment and the percentage of bursts in which that specific motoneuron was the first to fire in a burst. In all tested isolated ganglia (15) these distributions were not significantly different (paired t-test, p > 0.05), indicating that no motoneuron had a privileged role in burst initiation (Figure 4 A, left panel). The same analysis was repeated in semi-intact preparations computing the percentage of SBs triggered by each motoneuron and the percentage of spikes fired by each motoneuron over the entire experiment. The two distributions were similar (Figure 4 A, right panel) and in most cases (5∕7) were not significantly different.
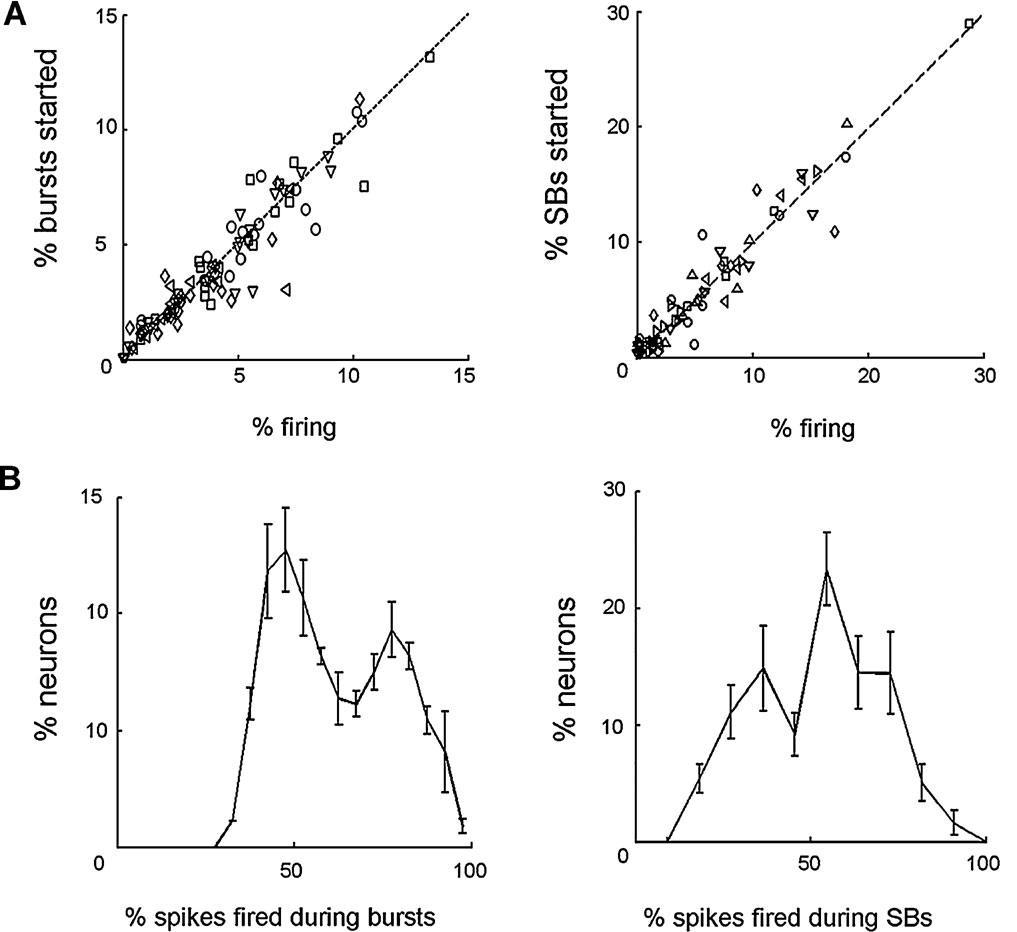
Figure 4. Neuron dynamics and bursts. (A) Left panel: percentage of bursts triggered by specific motoneurons as a function of the percentage of spikes fired for the same motoneurons over the total network firing. For 15∕15 isolated ganglia, the two percentages were not significantly different. For clarity, this plot shows data collected from five different experiments, each indicated with a different symbol. Right panel: The same as before but computed for sustained bursts in semi-intact preparations. For 5∕7 experiments the two percentages were not significantly different. All seven experiments displayed. In both panels the black dashed line represents the expected result if the probability of starting a burst for a neuron is simply determined by its firing rate. (B) Left panel: distribution of the percentage of spikes fired by each motoneuron during bursts, in isolated ganglia, averaged over 15 experiments. Right panel: average distribution of the percentage of spikes fired by each motoneuron during SBs, in semi-intact preparation, averaged over seven experiments.
Individual neurons, however, participated in bursts in a different way. For each motoneuron we computed the percentage of spikes occurring during bursts over the total number of spikes fired by the same motoneuron. In isolated ganglia the resulting distribution was bimodal (Figure 4 B, left panel): in the figure, the first peak corresponds to motoneurons firing equally during bursts and during inter-bursts intervals. These motoneurons represented approximately 65% of analyzed motoneurons. The remaining 35% of motoneurons were associated to the second peak of the distribution, corresponding to motoneurons firing preferentially during bursts. The same analysis was repeated in semi-intact preparations, but considering the percentage of spikes occurring during SBs. Also in this case the distribution was bimodal, but the number of motoneurons firing preferentially during SBs was approximately 65% whereas the remaining 35% fired equally during SBs and within consecutive SBs.
These results indicate that neither in isolated ganglia nor in semi-intact preparations are bursts initiated by a specific set of motoneurons. In semi-intact preparations, however, neurons are more influenced by the overall activity of the ganglion and fire preferentially during SBs.
The relationship between spontaneous activity and behavior
Spontaneous SBs were expected to influence the leech's behavior. To verify the possible role of SBs we monitored the movements of the leech in semi-intact preparations while recording simultaneously the spontaneous activity of the motoneurons.
In semi-intact preparations, the network firing rate recorded from one central ganglion (shown in black in Figure 5 A) and the speed of the bead glued onto the tail (shown in blue Figure 5 A) displayed similar temporal patterns. We performed an automatic classification of the movement by dividing the recording time into active and resting periods. The tail of the leech was considered to be active when the speed exceeded the threshold set according to the level of noise present in the system (see Materials and Methods ). Active periods ended when the tail speed was lower than the threshold. Movement onsets (yellow bars in Figure 5 A) were usually recorded close to the initiation of an SB. To quantify the degree of correlation between behavior and SBs, we measured the interval between the onset of every movement and the starting time of the closest SB. The distribution of these intervals collected from seven experiments displayed a large central peak close to 170 ms with a standard deviation of 250 ms, and two secondary peaks for intervals of 2 seconds or more (Figure 5 B). A movement onset and the occurrence of an SB were considered related if their delay belonged to the central peak (grey area in Figure 5 B), and unrelated if they were separated by a longer time interval (black area in Figure 5 B). With this criterion, 92 ± 5% of the tail movements were associated with SBs.
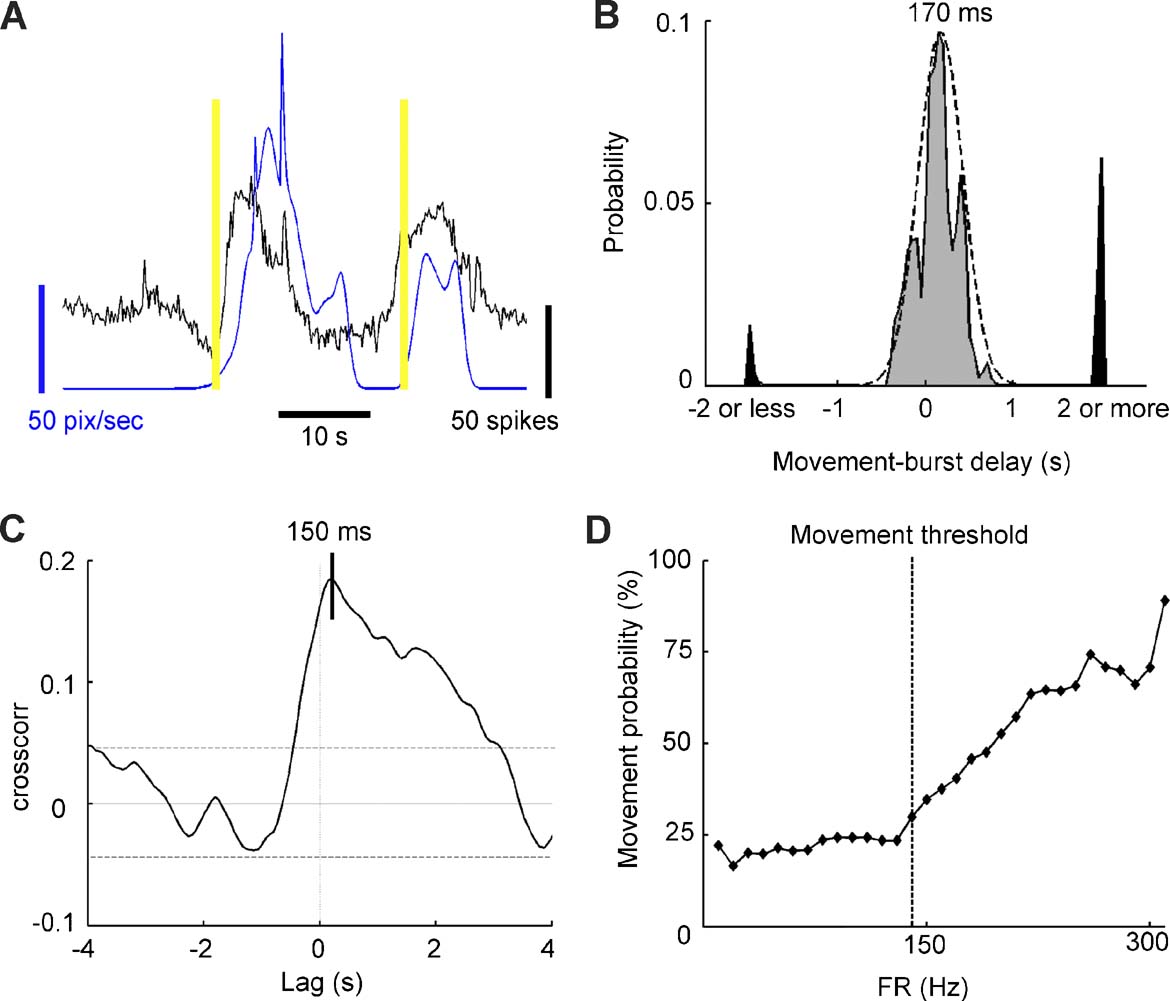
Figure 5. Burst dynamics and onset of movements. (A) Recording from a semi-intact preparation. The network firing rate and tail velocity are shown in black and blue, respectively. Yellow bars indicate movement onset. (B) Probability distribution of the interval between the movement onset and the closest burst onset collected from seven experiments. Gray and black areas indicate respectively movements correlated and uncorrelated with bursts. The black dashed line represents a Gaussian fit with mean = 170 ms and standard deviation = 250 ms. (C) Cross-correlation between the network firing rate and the tail speed in a representative semi-intact preparation. (D) Probability of tail movement as a function of network firing rate for a representative experiment. Above threshold frequency (140 Hz, corresponding to 1.7 times the average firing rate), probability increases with firing rate.
The relationship between the head movements and the electrical activity in body ganglia was less evident. The fraction of the head movements associated with SBs in body ganglia were, on average, 57%, varying from 42 to 78% in seven experiments, data that are in agreement with the observation that the leech head is able to move independently from the rest of the body (Sawyer, 1981 ) during exploratory movements or in the elongation phase leading to swimming or crawling (Esch et al., 2002 ).
We analyzed more in detail the tail movements and their relation to SBs recorded in midbody ganglia. The average delay between the onset of SBs recorded from the anterior ganglion of the pair and the related movement was 170 ms, as shown in Figure 5 B. A similar result was obtained by computing the cross-correlation between the network firing rate of the same ganglion and the tail speed: the maximum value of correlation was observed for a 150 ms lag (n = 7, values ranging from 35 to 290 ms, Figure 5 C). These observations indicate that the delay between activity and tail movements was about 150 ms.
As muscle contractions occur when a motoneuron firing rate exceeds a given threshold (Mason and Kristan, 1982 ), we decided to establish whether a leech movement would occur only when the network firing rate exceeded a given threshold. We computed the network firing rate at a bin width of 50 ms and we checked whether, after a delay between 100 and 200 ms, the leech moved. In this way we could establish the probability of a leech movement as a function of the network firing rate. In all experiments (7∕7) it was possible to identify a threshold associated with an increased probability of leech motion: this probability was low and stable until the firing rate reached a critical value, and then started growing rapidly (Figure 5 D). We measured the threshold for the different experiments and we found that it was set at 1.6 ± 0.3 times the average firing rate. The probability of leech motion was 18 ± 6% for the firing rate values recorded below the threshold, whereas it reached a maximum value of 69 ± 9% for those above it. In all experiments, the average firing rate during SBs was above the threshold (paired t-test, p < 0.05, ratio = 1.3 ± 0.1, n = 7), whereas smaller bursts had a firing rate lower than the threshold (paired t-test, p < 0.05, ratio = 0.82 ± 0.08, n = 7).
Finally, we investigated the origin of the burst-movement delay evident in the distribution of Figure 5 B. Before an SB can affect the tail movement, it must travel from a midbody ganglion where the electrical recording was obtained (indicated as the RG in Figure 6 ): therefore, a delay between these two events was expected. In our experiments, SBs propagated from one ganglion to the next in both directions, from the anterior end towards the posterior end or vice versa, and different propagation directions corresponded to different delays: (i) rearward progressing SBs (red arrows in Figure 6 A), reached tail ganglia after a time T1. The firing of tail motoneurons activates the tail muscles in a time T2, so that the total delay between the movement and the SB was T2 ± T1 (red peak in Figure 6 B); (ii) forward progressing SBs (green arrows in Figure 6 A) originating in tail ganglia, activate muscles in a time T2 from SB onset. SB propagated to the ganglion from which we recorded in a time T1, so that the delay between the movement and the SB was T2 − T1 (green peak in Figure 6 B). Therefore, two peaks were found in the delay distribution: one peak at T2 ± T1 for rearward progressing SBs, and one peak at T2 − T1 for forward progressing SBs (see Figure 6 B). Since T2 < T1, negative delays between movements and SBs were present, as shown in Figure 5 B.
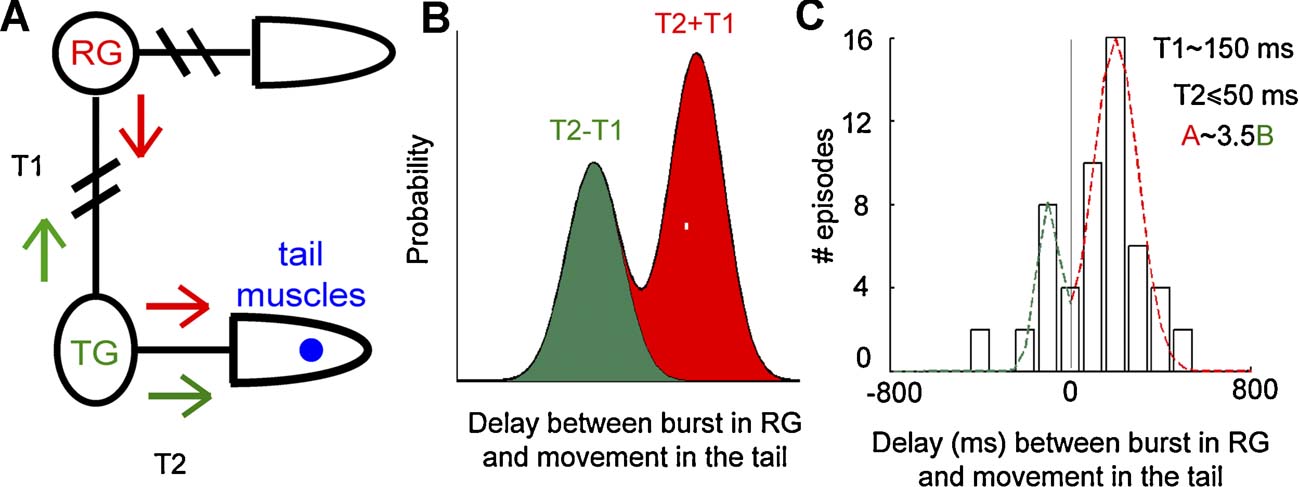
Figure 6. Forward and rearward progressing bursts. (A) Scheme of the two possible propagations of a movement-triggering burst. RG is the ganglion from which the electrical activity is recorded, and TG the tail ganglia. The red and green arrows indicate the direction of a rearward and forward progressing SB, respectively. The time required for an SB to go from RG to TG in both directions is T1; the time necessary for a burst in TG to trigger the movement in the tail is T2. (B) Model of burst-movement delay distribution. Red and green areas indicate delays originating by rearward and forward progressing burst, respectively. (C) Bursts-movement delay distribution for a representative experiment and associated parameter values.
From the burst-movement delay distribution we obtained an estimate of T1 (the mean between the two peaks) and T2 (half of their difference). For every experiment we fitted the delay distribution with two Gaussian functions (see Figure 6 C) peaked at −120 ± 25 ms and 180 ± 25 ms, indicating that T1 was about 150 ± 50 ms (n = 7 experiments for a total of 154 movements associated to SB). Analyzed ganglia were usually selected from the 9th to the 11th ganglion of the nerve cord, i.e., at a distance from the tail corresponding to 10–12 segments. Therefore, an SB propagates from one ganglion to the next one in approximately 14 ms. This value is in agreement with previous analysis (Shaw and Kristan, 1997 ) and computational models (Zheng et al., 2007 ) of activity propagation between leech segments. The value of T2 was too small (∼50 ms) to be properly evaluated with our measure accuracy. The ratio between the areas under the two peaks in Figure 6 C corresponds with the relative probability of the two propagation directions. The area associated with the rearward progressing SBs (under the red dashed line in Figure 6 C) was on average 3.6 ± 0.8 times larger than the area associated with forward progressing SBs (under the green dashed line in Figure 6 C), suggesting that rearward SBs were ∼3.5 times more probable than forward progressing SBs.
Discussion
The present manuscript provides an analysis of the spontaneous electrical activity of leech motoneurons and its relation to body motions. Statistical properties of the firing of single motoneurons and the degree of their correlation depend on the interactions among ganglia: motoneurons in isolated ganglia tend to fire in a less concerted way than in semi-intact preparations. The spontaneous electrical activity of leech motoneurons is characterized by the presence of bursts. These bursts occur also in isolated ganglia but their size and duration can be modulated by inputs arriving from neighboring ganglia and the two primitive brains located in the head and in the tail. Semi-intact preparations also display very large and regular bursts, here referred to as SBs, which are associated with the onset of movements in the whole leech. These SBs are present in the absence of any specific sensory stimuli, apparently playing a fundamental role during spontaneous behavior (Garcia-Perez et al., 2005 ). SBs appear to act as internal triggers initiating spontaneous movements in the absence of external stimuli.
Spontaneous bursts
We have shown before (Mazzoni et al., 2007 ) that modulation of excitatory and inhibitory synaptic pathways modifies the spontaneous activity observed in leech ganglia providing some insight into the mechanisms leading to the occurrence of spontaneous bursts of spikes. Blockage of NMDA receptors depresses the occurrence of large bursts, whereas blockage of GABA receptors increases their size and duration. The activation of NMDA receptors seems necessary for the onset of a burst: when several inputs reach the same neuron, long lasting excitatory post-synaptic potentials mediated by NMDA channels (Koch, 1999 ; Hestrin et al., 1990 ) are produced, leading to a sustained firing (Wang, 1999 ) that propagates to post-synaptic neurons.
Inter-ganglia interactions determine the properties of spontaneous bursts, as shown in Figures 2 and 3 . Spontaneous bursts in connected ganglia have a more regular set of dynamics, with a predominance of large bursts: when the same ganglia are separated from each other, bursts become more irregular in size and duration. Many neurons can be responsible for these inter-ganglia interactions: all six identified pairs of inhibitory interneurons participating in the swimming CPG (27, 28, 33, 60, 115, and 123) project their axons for about six segments through the connective fibers (Friesen and Hocker, 2001 ). Excitatory interneuron 208, participating in the swimming CPG, sends projections into ganglia as far as 10 segments away (Weeks, 1982 ). Also interneurons of the crawling CPG are expected to behave similarly (Cacciatore et al., 2000 ). S cells, involved in the whole body shortening behavior, also project axons both rostrally and caudally through the medial connective (Frank et al., 1975 ).
Both the correlations among the neurons of the ganglion and between neighboring ganglia increase in semi-intact preparations. This is probably due to the increased number of intersegmental interactions and to the neurons located in the cephalic ganglia and projecting into the body ganglia, such as trigger neurons Tr1 and Tr2 (Brodfuehrer and Friesen, 1986 ), the excitatory neuron SE1, the inhibitory neuron SIN (Brodfuehrer et al., 1995 ) and neuron R3b1 (Esch et al., 2002 ).
Sustained bursts and movement initiation
Previous findings (Mason and Kristan, 1982 ) demonstrated that muscle contractions in the leech are initiated when motoneuron firing rates exceed a given threshold. We found the same dynamics at the level of the collective firing of motoneurons in the ganglia: when the network firing rate exceeds a given threshold, detectable motions of the leech body are significantly increased.
Low frequency firing of motoneurons induces muscle contractions which are adequate to maintain the posture of the hydroskeleton of the leech, but not to elicit a movement of the entire body (Wilson et al., 1995 ). A significant movement of the leech body requires a concerted set of contractions caused by excitatory motoneurons and a set of relaxations caused by inhibitory motoneurons which implies a high level of firing of several motoneurons: in fact in our experiments the onset of the leech movement was associated with a higher firing rate (Figure 5 ). The firing rate reached by large bursts when ganglia are connected exceeds this threshold in such a way that these SBs induce body movements. Why is this threshold between 1.5 and 2 times the average firing rate? One hypothesis is that it must be sufficiently high to avoid movements caused by fluctuations in the baseline activity and, at the same time, sufficiently low to allow a small trigger to initiate motion.
SBs trigger movements in the leech tail with a delay of approximately 150 ms (Figure 5 ), with a positive or negative delay depending on the direction of propagation (Figure 6 ). If SBs are the units responsible for the onset of movements, their statistical properties are expected to affect the behavior of the intact animal. We previously analyzed the spontaneous behavior of intact leeches in the absence of external stimuli (Garcia-Perez et al., 2005 ) and we found that their behavior can be classified in a limited number of stereotyped states. The duration of stationary states was exponentially distributed with two time constants, one of the order of 5 seconds, and a longer one varying between 40 and 50 seconds, as shown in Figure 7 A. Short stationary states corresponded to pauses in the exploratory motion, while long stationary states reflected inactive periods in between two active behaviors. Their distribution is similar to that of intervals between successive SBs, i.e., an exponential distribution with a time constant of about 47 seconds (see Figure 7 B). This suggests that the same process that originates SBs could be responsible for the onset of movements in the intact animal. The ongoing bursting activity could then be the “internal state” (Brodfuehrer and Thorogood, 2001 ) responsible for the variability of the efficacy of trigger neurons in activating CPGs.
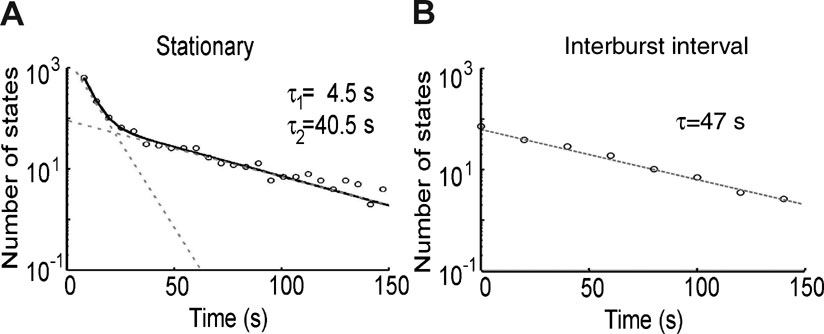
Figure 7. Stationary states and inter-burst intervals. (A) Distribution of the durations of the stationary behavioral states redrawn from Garcia-Perez et al., (2005) , showing short and long stationary states. (B) Inter-burst interval distribution of long stationary states. This distribution is similar to the distribution of intervals between successive SBs.
In intact leeches and in the presence of sensory stimuli CPGs are also expected to initiate structured movements (Kristan et al., 2005 ). The movement initiated by an SB was not associated with a well defined behavioral pattern: in some cases it appeared to be initiated by an elongation and in other instances by a lateral bending of the animal. This variety of tail movement is in agreement with the observation that SBs are not initiated by a specific set of motoneurons (see Figure 4 ).
The mechanism generating SBs appears to act as an internal clock, providing a trigger to the leech for the initiation of spontaneous movements even in the absence of any sensory input. The presence of a significant level of spontaneous activity has been observed in several other preparations and tissues (Arieli et al., 1996 ) even in the primate cortex (Vincent et al., 2007 ). It is possible that large bursts of electrical activity similar to SBs described here are present in most nervous systems where they play different roles, such as being internal triggers responsible for proactive behaviors (Lee and Assad, 2003 ; Maimon and Assad, 2006 ).
Although the present investigation of the spontaneous electrical activity of the leech is limited to motoneurons without any direct observation of the spontaneous activity of the other neurons, monitoring the activity of a larger fraction of the ganglion neurons, including interneurons, will provide a more exhaustive characterization of the spontaneous electrical activity of the leech nervous system. Moreover, imaging the leech ganglion with voltage-sensitive dyes as done in Briggman et al., (2005 ; 2006) will provide insights into the mechanisms responsible for spontaneous bursts.
We believe that our approach can be extended to the analysis of the spontaneous activity of a large variety of neuronal networks and can be useful in understanding the relationship between spontaneous firing and behavior in several invertebrate species and, possibly, in some more complex animals.
Conflict of Interest Statement
The authors declare no competing financial interests.
Acknowledgements
We are grateful to Dr. W. B. Kristan for helpful discussion. This work was supported by the EU grant NEURO, by a FIRB grant from the Italian Government and by the GRAND grant from CIPE∕FVG.
References
Arieli, A., Sterkin, A., Grinvald, A., and Aertsen, A. (1996). Dynamics of ongoing activity: explanation of the large variability in evoked cortical responses. Science 273, 1868–1871.
Arisi, I., Zoccolan, D., and Torre, V. (2001). Distributed motor pattern underlying whole-body shortening in the medicinal leech. J. Neurophysiol. 86, 2475–2488.
Beggs, J. M., and Plenz, D. (2003). Neuronal avalanches in neocortical circuits. J. Neurosci. 23, 11167–11177.
Briggman, K. L., Abarbanel, H. D. L., and Kristan, W. B. (2005). Optical imaging of neuronal populations during decision making. Science 307, 896–901.
Briggman, K. L., Abarbanel, H. D. L., and Kristan, W. B. (2006). Imaging dedicated and multifunctional neural circuits generating distinct behaviors. J. Neurosci. 26, 10925–10933.
Brodfuehrer, P. D., and Friesen, W. O. (1986). Control of leech swimming activity by the cephalic ganglia. J. Neurobiol. 17, 697–705.
Brodfuehrer, P. D., and Thorogood, M. S. E. (2001). Identified neurons and leech swimming behavior. Prog. Neurobiol. 63, 371–381.
Brodfuehrer, P. D., Debski, E. A., O'Gara, B. A. (1995). Neuronal control of leech swimming. J. Neurobiol. 27, 403–418.
Cacciatore, T. W., Rozenshteyn, R., and Kristan, W. B. (2000). Kinematics and modeling of leech crawling: evidence for an oscillatory behavior produced by propagating waves of excitation. J. Neurosci. V 20, P 1643-1655,
Eisenhart, F. J., Cacciatore, T. W., and Kristan, W. B. (2000). A central pattern generator underlies crawling in the medicinal leech. J. Comp. Physiol. A 186, 631–643.
Esch, T., Mesce, K. A., and Kristan, W. B. (2002). Evidence for sequential decision making in medicinal leech. J. Neurosci. 22, 11045–11054.
Fiser, J., Chiu, C., and Weliky, M. (2004). Small modulation of ongoing cortical dynamics by sensory input during natural vision. Nature 431, 573–578.
Frank, E., Jansen, J. K., and Rinvik, E. (1975). A multisomatic axon in the central nervous system of the leech. J. Comp. Neurol. 159, 1–13.
Friesen, W. O., and Hocker, C. G. (2001). Functional analyses of the leech swim oscillator. J. Neurophysiol. 86, 824–835.
Garcia-Perez, E., Zoccolan, D., Pinato, G., and Torre, V. (2004). Dynamics and reproducibility of a moderately complex sensory-motor response in the medicinal leech. J. Neurophysiol. 92, 1783–1795.
Garcia-Perez, E., Mazzoni, A., Zoccolan, D., Robinson, H. P. C., and Torre, V. (2005). Statistics of decision making in the leech. J. Neurosci. 25, 2597–2608.
Grillner, S. (2003). The motor infrastructure: from ion channels to neuronal networks. Nat. Rev. Neurosci. 4, 573–586.
Grillner, S. (2004). Muscle twitches during sleep shape the precise modules of withdrawal reflex. Trends Neurosci. 27, 169–171.
Grillner, S., Markram, H., De Schutter, E., Silberberg, G., and LeBeau, F. E. N. (2005). Microcircuits in action-from CPGs to neocortex. Trends Neurosci. 28, 526–534.
Harris, K. D. (2005). Neural signatures of cell assembly organization. Nat. Rev. Neurosci. 6, 399–407.
Hasenstaub, A., Sachdev, R. N. S., and McCormick, D. A. (2007). State changes rapidly modulate cortical neuronal responsiveness. J. Neurosci. 27, 9607–9622.
Hestrin, S., Nicoll, R. A., Perkel, D. J., and Sah, P. (1990). Analysis of excitatory synaptic action in pyramidal cells using whole-cell recording from rat hippocampal slices. J Physiol. (Lond.) 422, 203–225.
Kristan, W. B., Calabrese, R. I., and Friesen, W. O. (2005). Neuronal control of leech behavior. Prog. Neurobiol. 76, 279–327.
Lee, I. H., and Assad, J. A. (2003). Putaminal activity for simple reactions or self-timed movements. J. Neurophysiol. 89, 2528–2537.
Lewis, J. E., and Kristan, W. B. (1998). Representation of touch location by a population of leech sensory neurons. J. Neurophysiol. 80, 2584–2592.
MacLean, J. N., Watson, O. B., Aaron, G. B., and Yuste, R. (2005). Internal dynamics determine the cortical response to thalamic stimulation. Neuron 48, 811–823.
Maimon, G., and Assad, J. A. (2006). Parietal area 5 and the initiation of self time-movements versus simple reactions. J. Neurosci. 26, 2487–2498.
Marder, E., Bucher, D., Schulz, D. J., and Taylor, A. L. (2005). Invertebrate central pattern generation moves along. Curr. Biol. 15, 685–699.
Mason, B., and Kristan, W. B. (1982). Neuronal excitation, inhibition and modulation of leech longitudinal muscles. J. Comp. Physiol. 146, 527–536.
Mazzoni, A., Garcia-Perez, E., Zoccolan, D., Graziosi, S., and Torre, V. (2005). Quantitative characterization classification of leech behavior. J. Neurophysiol. 93, 580–593.
Mazzoni, A., Broccard, F. D., Garcia-Perez, E., Ruaro, M. E., Paolo, B., and Torre, V. (2007). On the dynamics of the spontaneous activity in neuronal networks. PLoS ONE 2, e439.
Nusbaum, M. P., and Beenhakker, M. P. (2002). A small-systems approach to motor pattern generation. Nature 417, 343–350.
Papoulis, A. (1984). Probability random variables and stochastic processes , 2nd edn. (New York, McGraw-Hill).
Sandrini, G., Serrao, M., Rossi, P., Romaniello, A., Cruccu, G., and Willer, J. C. (2005). The lower limb reflexion in humans. Prog. Neurobiol. 77, 353–395.
Sawyer, R. T. (1981). Leech biology and behavior. In Neurobiology of the Leech , K. J. Muller, J. G. Nicholls, and Stent, G. S. eds. (New York, Cold Spring Harbor Laboratory).
Shaw, B. K., and Kristan, W. B. (1997). The neuronal basis of the behavioral choice between swimming and shortening in the leech: control is not selectively exercised at higher circuit levels. J. Neurosci. 17, 786–795.
Shaw, B. K., and Kristan, W. B. (1999). Relative roles of the S cell network and parallel interneuronal pathways in the whole-body shortening reflex of the medicinal leech. J. Neurosci. 82, 1114–1123.
Vincent, J. L., Patel, G. H., Fox, M. D., Snyder, A. Z., Baker, J. T., Van Essen, D. C., Zempel, J. M., Snyder, L. H., Corbetta, M., and Raichle, M. E. (2007). Intrinsic functional architecture in the anaesthetized monkey brain. Nature 447, 83–86.
Wang, X. J. (1999). Synaptic basis of cortical persistent activity: the importance of NMDA receptors to working memory. J. Neurosci. 19, 9587–9603.
Weeks, J. C. (1982). Segmental specialization of a leech swim-initiating interneuron, cell 2051. J. Neurosci. 2, 972–985.
Wenning, A., Cymbalyuk, G. S., and Calabrese, R. L. (2004a). Heartbeat control in leeches. I. Constriction pattern and neural modulation of blood pressure in intact animals. J. Neurophysiol. 91, 382–396.
Wenning, A., Hill, A. A., and Calabrese, R. L. (2004b). Heartbeat control in leeches. II. Fictive motor pattern. J. Neurophysiol. 91, 397–409.
Wilson, R. J. A., Skierczynski, B. A., Meyer, J. K., Skalak, R., and Kristan, W. B. (1995). Mapping motor neuron activity to overt behavior in the leech. J. Comp. Physiol. A 178, 637–654.
Keywords: motor control, spontaneous behavior, spontaneous activity, invertebrates
Citation: Elizabeth Garcia-Perez, Alberto Mazzoni and Vincent Torre (2007). Spontaneous electrical activity and behavior in the leech Hirudo medicinalis. Front. Integr. Neurosci. 1:8. doi: 10.3389/neuro.07/008.2007
Received: 6 October 2007;
Paper pending published: 30 November 2007;
Accepted: 14 November 2007;
Published online: 30 October 2007.
Edited by:
Sidney A. Simon, Duke University Medical Center, USAReviewed by:
Brian M. Salzberg, University of Pennsylvania , USASridhar Raghavachari, Duke University, USA
Copyright: © 2007 Garcia-Perez, Mazzoni and Torre. This is an open-access article subject to an exclusive license agreement between the authors and the Frontiers Research Foundation, which permits unrestricted use, distribution, and reproduction in any medium, provided the original authors and source are credited.
*Correspondence: Vincent Torre, Scuola Internazionale Superiore di Studi Avanzati (SISSA), AREA Science Park, SS 14 km 163.5, 34012 Basovizza, Trieste, Italy. e-mail: torre@sissa.it