Department of Otorhinolaryngology: Head and Neck Surgery, University of Pennsylvania School of Medicine, Philadelphia, PA, USA
The neural correlates that relate auditory categorization to aspects of goal-directed behavior, such as decision-making, are not well understood. Since the prefrontal cortex (PFC) plays an important role in executive function and the categorization of auditory objects, we hypothesized that neural activity in the PFC should predict an animal’s behavioral reports (decisions) during a category task. To test this hypothesis, we tested PFC activity that was recorded while monkeys categorized human spoken words (Russ et al., 2008b
). We found that activity in the ventrolateral PFC, on average, correlated best with the monkeys’ choices than with the auditory stimuli. This finding demonstrates a direct link between PFC activity and behavioral choices during a non-spatial auditory task.
Neural correlates of auditory categories are found throughout the cortex. For example, neurons in the auditory cortex of humans and non-human animals code speech sounds and other perceptual categories (Guenther et al., 2004
; Ohl et al., 2001
; Poeppel et al., 2004
; Selezneva et al., 2006
; Steinschneider et al., 1995
). The auditory cortex also represents multi-modal categories, such as visual and auditory communication signals and bimodal-looming representations (Hoffman et al., 2008
; Maier et al., 2008
). More abstract categorical representations are found in the ventrolateral prefrontal cortex (vPFC), a cortical region involved in non-spatial auditory cognition (Rauschecker and Tian, 2000
; Russ et al., 2008a
,b
): in the vPFC, neurons code the functional meaning of vocalizations (food quality and food versus non-food) (Cohen et al., 2006
; Gifford III et al., 2005
).
Categories are useful because they provide an efficient means to represent information (Freedman et al., 2001
, 2002
, Miller et al., 2002
; Shepard, 1987
; Spence, 1937
). They are useful since by associating a new exemplar with an established category, information that has been learned previously is available to a signal receiver, such as a listener or a viewer. Consequently, categories allow these receivers a flexible way to process and represent novel stimuli, a fundamental property of goal-directed behavior (Miller et al., 2002
; Shepard, 1987
; Spence, 1937
).
Recently, we tested the neural correlates that relate auditory categories to a component of goal-directed behavior, namely decision-making (Russ et al., 2008b
). While we recorded from vPFC neurons, monkeys listened to a “reference” stimulus and “test” stimulus and reported whether these stimuli were the same or different. Using methods from signal-detection theory (Britten et al., 1992
; Green and Swets, 1966
; Gu et al., 2007
), we found that vPFC activity correlated better with the monkeys’ actual choices (i.e., their decisions) than with what the monkeys should have chosen (i.e., the acoustic/perceptual relationship between the reference and test stimuli).
However, the results from this previous study were limited since the signal-detection methods that we employed used different metrics to quantify the different components of the task (e.g., what the monkeys should have chosen and what they actually chose). Thus, it is not clear the degree to which individual vPFC neurons code the monkeys’ decisions (actually chose) relative to other components of a category task.
To address this question, we constructed and trained a simple neural network – a multi-layer perceptron (MLP) (Bishop, 1995
; Hertz et al., 1991
; Rosenblatt, 1962
; Widrow and Lehr, 1990
) – to quantify how well the spike trains of a vPFC neuron coded three components of our task: (1) the perceptual category of the test stimulus, (2) the relationship between the reference stimulus and the test stimulus (i.e., what the monkeys should choose), and (3) the monkey’s decisions (i.e., their actual choice). The latter components were analyzed in the previous study with signal-detection methods but the first component is a new analysis for this study. The advantage of the MLP, in contrast to our previous analyses (Russ et al., 2008b
), is that, on a neuron-by-neuron basis, we can quantify each of these three task-related components with a comparable metric. We found that vPFC neurons, on average, coded the monkeys’ decisions better than they coded the perceptual category of the test stimulus and better than they code the relationship between the reference and test stimuli. These results confirm and extend our earlier study (Russ et al., 2008b
) by demonstrating that, on average, vPFC activity reflects the decision-making processes that monkeys make during a non-spatial auditory task. These data also provide a direct link between single neurons and behavioral choices in the vPFC on a non-spatial auditory task.
The neural data set analyzed here has been the subject of a previous study (Russ et al., 2008b
). We recorded from neurons in the vPFC from one male and one female rhesus monkey (Macaca mulatta). Under isofluorane anesthesia, the monkeys were implanted with a scleral search coil, head-positioning cylinder, and a recording chamber. vPFC recordings were obtained from the male rhesus’ left hemisphere and from the female’s right hemisphere. All recordings were guided by pre- and post-operative magnetic resonance images of each monkey’s brain. The recording cylinder was centered on the region of the PFC that overlaps with areas 12/45 as defined by Romanski and colleagues (Romanski and Goldman-Rakic, 2002
; Romanski et al., 1999a
). Stereotaxically, this region is centered ∼26 mm anterior (relative to the interaural axis) and ∼20 mm lateral. The Dartmouth Institutional Animal Care and Use Committee approved the experimental protocols.
Auditory Stimuli
The prototype stimuli were the spoken words bad and dad. In humans, these stimuli differ in their place of articulation. The prototypes were digitized recordings of an American adult female and were provided by Dr. Michael Kilgard. Morphed versions of the prototypes were created using the STRAIGHT (Kawahara et al., 1999
) software package, which is run in the Matlab (The Mathworks Inc.) programming environment. Morphing was accomplished by calculating the shortest trajectory between the fundamental and formant frequencies of the two prototypes. Morphed versions of the two prototypes were created at 20, 40, 50, 60, and 80% of the distance along this trajectory. Spectrograms of the two prototypes and some of the morphed stimuli are shown in Figure 1
B.
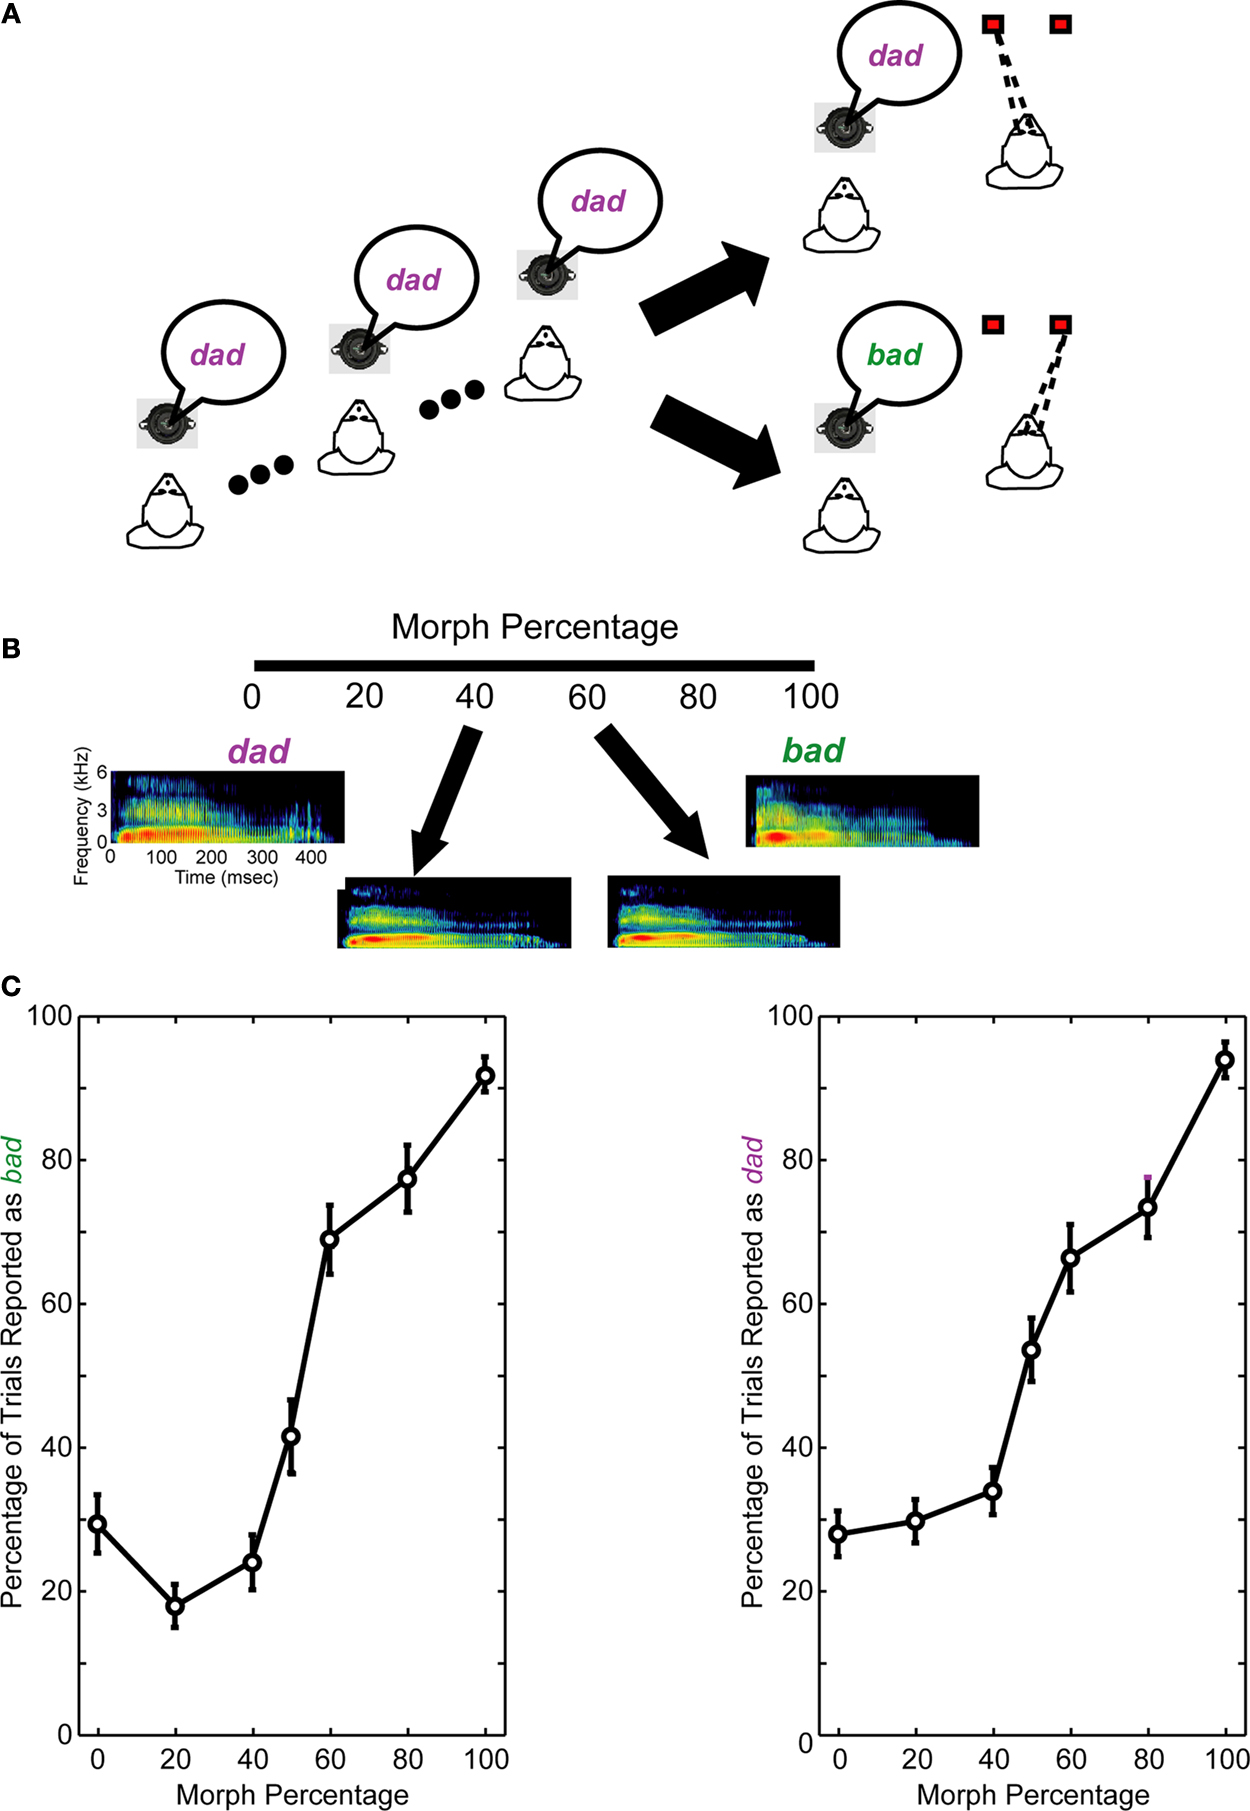
Figure 1. Same-different task and behavioral performance. (A) Following two to four presentations of the reference stimulus, a test stimulus was presented. The reference stimulus was always one of the two prototype spoken words (bad or dad). The test stimulus was a morphed version of the prototypes. If the monkeys perceived that the reference and test stimuli were the same, they made a saccade to a leftward target. If the monkeys perceived that the reference and test stimuli were different, they made a saccade to a rightward target. (B) Spectrographic representations of the prototype spoken words and two of the morphs. In this example, the reference stimulus is bad. Consequently, it is the 100% morph, whereas dad is the 0% morph; see Section “Materials and Methods” for more details. When the reference stimulus is the spoken word dad, the morph percentages are reversed (e.g., the 0% morph is bad and the 100% morph is dad). The axes for all of the spectrograms are seen in the leftmost spectrogram. (C) The average performance of the monkeys from those recording sessions reported in this manuscript. The monkeys’ performance is shown as a function of the reference stimulus: the prototype spoken word bad (left column) or dad (right column). A 0% morph means that the test stimulus was a different prototype than the reference stimulus (e.g., the reference stimulus was the prototype bad and the test stimulus was the prototype dad). A 100% morph means that the test and reference stimuli were the same (e.g., both were the prototype dad). Other values represent morphed stimuli between these two extremes. Error bars are standard error of the means.
Same-Different Task
As schematized in Figure 1
A, the task began with two to four presentations of a “reference” stimulus that was followed by the presentation of a “test” stimulus. The reference and test stimuli were 500 ms in duration. The inter-stimulus interval averaged 1600 ms. The stimuli were presented from a speaker (Pyle, PLX32) that was in front of the monkey at a level of 70 dB SPL. The reference stimulus was always one of the two prototype words. The test stimulus was either (1) one of the two prototypes or (2) a morph of one of the two prototypes. The 100% morph was operationally defined to be the same prototype as the reference stimulus; therefore, the 0% morph was the other prototype. 700-ms after test-stimulus offset, two LEDs were illuminated. If the test stimulus was a 0–40% morph, the monkeys were rewarded when they successfully reported that the reference and test stimuli were different by making a saccade to the LED that was 20° to the right of the speaker. If the test stimulus was a 60–100% morph, the monkeys were rewarded when they successfully reported that the reference and test stimuli were the same by making a saccade to the LED that was 20° to the left of the speaker. When the test stimulus was a 50% morph, which has been shown to be a (categorical) perceptual boundary in rhesus (see Figure 1
C) (Kuhl and Padden, 1982
, 1983
), the monkeys were rewarded based on their overall performance (Grunewald et al., 2002
). The reward was given 300 ms after the monkey fixated one of the target LEDs; the reward was a drop of juice or water (∼0.25–0.5 ml/correct trial).
Recording Procedure
Single-unit extracellular recordings were obtained with tungsten microelectrodes (Frederick Haer & Co., Bowdoin, MA, USA) seated inside a stainless-steel guide tube. The electrode and guide tube were advanced into the brain with a hydraulic microdrive (Narishige MO-95). The electrode signal was amplified (Bak MDA-4I) and band-pass filtered (Krohn-Hite 3700) between 0.6 and 6.0 kHz. Single-unit activity was isolated using a two-window, time-voltage discriminator (Bak DDIS-1). The time of occurrence of each action potential was stored for on- and off-line analyses.
The vPFC was identified by its anatomical location and its neurophysiological properties (Cohen et al., 2004
; Romanski and Goldman-Rakic, 2002
). The vPFC is located anterior to the arcuate sulcus and Area 8a and lies below the principal sulcus. vPFC neurons were further characterized by their strong responses to auditory stimuli.
Once a neuron was isolated, the monkeys participated in blocks of trials of the same-different task. Since vPFC neurons respond broadly to a wide range of auditory stimuli (Cohen et al., 2007
; Romanski et al., 2005
; Russ et al., 2008a
), we did not tailor the reference and test stimuli to the neuron’s response characteristics. In each block of trials, there were six trials in which the test stimulus was a 0% morph, six trials in which the test stimulus was a 100% morph, and two trials of each of the remaining morphs (i.e., the 20, 40, 50, 60, and 80% morphs). The test stimulus was chosen in a balanced pseudorandom order. We recorded at least five blocks of trials with each reference stimulus. Consequently, for each neuron, we typically had ≥200 spike trains that were available for subsequent off-line data analysis.
Data Analysis
A fully connected MLP (Bishop, 1995
; Hertz et al., 1991
; Rosenblatt, 1962
; Widrow and Lehr, 1990
) was constructed that contained an input layer, a single hidden layer with 100 nodes, and an output layer that contained 2 nodes (see Figure 2
); as is commonly done, the number of output nodes equaled the number of items that were learned by the network (i.e., 2) (Hertz et al., 1991
; LeCun et al., 1998
). The number of nodes of the input layer depended on the statistical properties of the spike trains (see below). The activation function of hidden units was tanh(x).
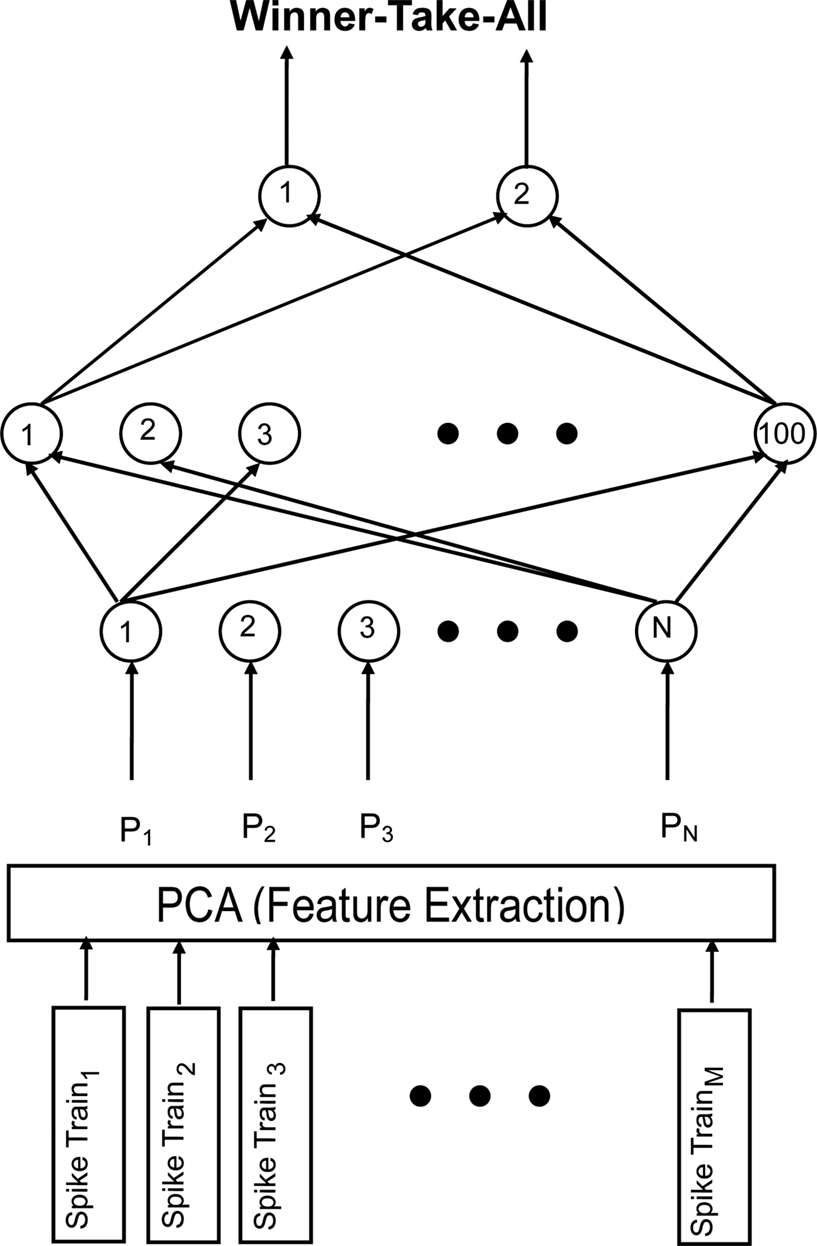
Figure 2. Schematic of the multi-layer perceptron (MLP). For each neuron, the interspike intervals of M spike trains underwent principal-component analysis (PCA) to extract relevant features. For each spike train, the N components derived from the PCA were fed into the input layer of the MLP sequentially. The hidden layer of the network contained 100 nodes and the output layer contained 2 nodes. The network was a fully connected feedforward network. A winner-take-all approach applied to the output node: thus, the node with the highest activation determined the MLP’s answer.
The MLP was not designed to mimic brain function. Instead, it was a platform that we used to quantify how well vPFC neurons coded different task-related components of the same-different task (see below). The advantage of the MLP, in contrast to our previous study (Russ et al., 2008b
), is that, on a neuron-by-neuron basis, we can quantify these different task-related components with a comparable metric. We chose a MLP versus a relatively simpler linear classifier for two reasons: (1) MLPs generally perform better than linear classifiers (LeCun et al., 1998
) and (2) since our data set is not linearly separable (results not shown), a linear classifier is not appropriate (Hertz et al., 1991
).
The input to the MLP was a vector of interspike-interval times. For each neuron, the interspike-interval times during the 1000-ms period that started with the test-stimulus onset was calculated on a trial-by-trial basis of the same-different task; this time period ended before the LEDs were introduced into the environment (see Figure 1
A).
A principal-component analysis (PCA) pre-processed these interspike-interval times (see Figure 2
). PCA extracts the relevant features of a dataset and also reduces its dimensionality (Battiti, 1994
; Jain and Zongker, 1997
; LeCun et al., 1998
; Liu and Wang, 1998
; Trier et al., 1996
; Turk and Pentland, 1991
). Indeed, the PCA decreased the dimensionality of our dataset by ∼25%. Such pre-processing is commonly used in neural networks, like ours, that are trained to recognize patterns and classify data. Dimensionality reduction, besides decreasing computation time, also improves the capacity of classifiers, such as a MLP, to generalize to novel inputs (Cristianini and Shawe-Tayler, 2000
; Jain and Zongker, 1997
).
For our PCA, a matrix was constructed for each neuron in which each row was a trial and the columns contained the interspike-interval times. Using this matrix, we calculated the principal components and the projections of each vector of interspike-interval times (i.e., the row of the matrix) in the principal-component space; each row vector was zero padded, relative to the longest trial, so that each row vector in the matrix was the same length. These projections formed the actual inputs to the MLP.
We trained different MLPs to decode three different components of the same-different task.
The first component was the perceptual category of the test stimulus or the “test-stimulus category.” For this training, one output node of the MLP network mapped neural activity elicited by a 60–100% test morph to one prototype stimulus (e.g., bad). The second output node mapped neural activity elicited by the 0–40% test morph to the other prototype stimulus (e.g., dad). These cut-offs were based on our monkeys’ behavioral performance which indicated that the monkeys perceived the bad–dad transition in a categorical manner (see Figure 1
C); this behavior is consistent with the extant literature (Eimas et al., 1971
; Kuhl and Miller, 1975
, 1978
; Kuhl and Padden, 1982
, 1983
). The MLP training was conducted independent of both (1) the reference stimulus and (2) the monkey’s behavioral reports (actual choices or decisions).
The second component was the relationship between the reference stimulus and the test stimulus – that is, what the monkeys should choose based on the acoustic/perceptual relationship between the reference and test stimuli (see Figure 1
C). For this training, one output node of the MLP network was trained to associate activity elicited by a 60–100% test morph with the reference stimulus. The other output node was trained such that activity elicited by a 0–40% test morph was not associated with the reference stimulus. Once again, these cut-offs were based on our monkeys’ behavioral performance which indicated that they perceived the bad–dad transition in a categorical manner (see Figure 1
C). This MLP training was done independently of the monkeys’ behavioral reports (actual choices or decisions).
The third and final component was the monkeys’ behavioral reports or decisions – that is, what the monkeys actually chose. For this training, one output node of the MLP network mapped neural activity with the monkey’s decision that the reference and test stimuli were the same. The second output node mapped neural activity with the monkey’s decision that the reference and test stimuli were different. This MLP training was accomplished independent of both the reference and test stimuli.
For all three of these task-related components (i.e., test-stimulus category, the relationship between reference and test stimuli, and monkeys’ decisions), we included both successful and error trials. We applied a winner-take-all rule to the output layer. Hence, the output node with the highest activation determined the MLP’s answer.
The MLP was trained using classic backpropogation (Almeida, 1988
; Chauvin and Rumelhart, 1995
; Hertz et al., 1991
; Pineda, 1987
; Rohwer, 1987
); the weights of the network were updated after propagating each spike train. Since the training of a MLP is stochastic, we trained a population of independent MLPs to generate bounds on the amount of information contained in vPFC activity. That is, for each neuron, an independent set of 50 MLPs was trained to decode the test stimulus from vPFC activity; a second independent set of 50 MLPs was trained to decode the relationship between the reference and test stimuli; and a third independent set was trained to decode the monkeys’ decisions. Each MLP was initialized with a different set of initial random weights and was trained and tested independently.
For each MLP, one half of a neuron’s spike trains (data) was used as the training set. The other half of the neuron’s spike trains was used to evaluate the MLP’s performance (decoding capacity). This approach is called the “split-sample” method (LeCun et al., 1998
; Prechelt, 1998
).
When a MLP is over-trained, its capacity to generalize to novel inputs becomes poorer while its performance on the training set continues to improve. To test for over-training, we instantiated an algorithm called “early-stopping” (Caruana et al., 2000
; Nelson and Illingworth, 1991
; Prechelt, 1998
). In early-stopping, a subset of data, the “validation set,” is removed from the training set. After each training epoch (i.e., a complete cycle of training that used all of the available data from the training set), the MLP is tested with the validation set. Validation error typically decreases as training commences and as the MLP learns the data. However, with more training, the validation error increases as the MLP overfits the data. Consequently, the evaluation set is tested on the weights that produced the lowest validation error.
In our instantiation of this algorithm, we randomly removed 20 spike trains from the training set to be used as a validation set. After each training epoch, the performance of the MLP on the validation set was evaluated. This process was repeated iteratively for 1000 training epochs to find the set of weights that produced the lowest validation error. After training was complete (1000 epochs), the “best” MLP was built using this set of weights. Finally, the evaluation set of spike trains was fed into this best MLP to test its decoding capacity on this novel data set.
Neurophysiological Recordings
We recorded from 91 vPFC “auditory” neurons while the monkeys participated in the same-different task (Figure 1
A); “auditory” neurons had reliably different firing rates during the 500-ms period that began with test-stimulus onset than during the 500-ms period that occurred prior to test-stimulus onset (t-test, p < 0.05). Approximately equal numbers of neurons were collected from both monkeys; we could not identify any differences between the data collected from the two monkeys so the data were treated as a unitary dataset. For 51 of these 91 neurons, we collected blocks of data in which both bad and dad were the reference stimulus. In the other 38 neurons, we only collected blocks of data in which either bad (22 neurons) or dad was the reference stimulus (16 neurons). All 51 of these neurons were classified as “auditory”; these neurons had reliably different firing rates during the 500-ms period that began with the test-stimulus onset than during the 500-ms period that occurred prior to the test-stimulus onset (t-test, p < 0.05).
The response profile from a vPFC neuron is shown in Figure 3
. The data in Figure 3
A were generated when the reference stimulus was bad. The neuron generally had a high firing rate when the monkey reported that the reference and test stimuli were different (see the blue colors). In contrast, when the monkey reported that the reference and test stimuli were the same (see red-purple colors), the neuron had a relatively lower firing rate. There are several interpretations of this neuron’s response. First, it could reflect the monkey’s decisions: high activity when the monkey reported that the reference and test stimuli were different and lower activity when the monkey reported that these stimuli were the same. Similarly, this activity could reflect the relationship between the reference and test stimuli. These two cases are different in that the former reflects what the monkey actually chose, whereas the latter reflects what the monkey should choose. Alternatively, this activity might reflect the monkey’s perception of the test-stimulus (see Figure 1
C) or the test stimulus’ acoustic features. For example, high responses could indicate when the monkey perceived the test stimulus as dad, and lower responses could indicate when he perceived it as bad.
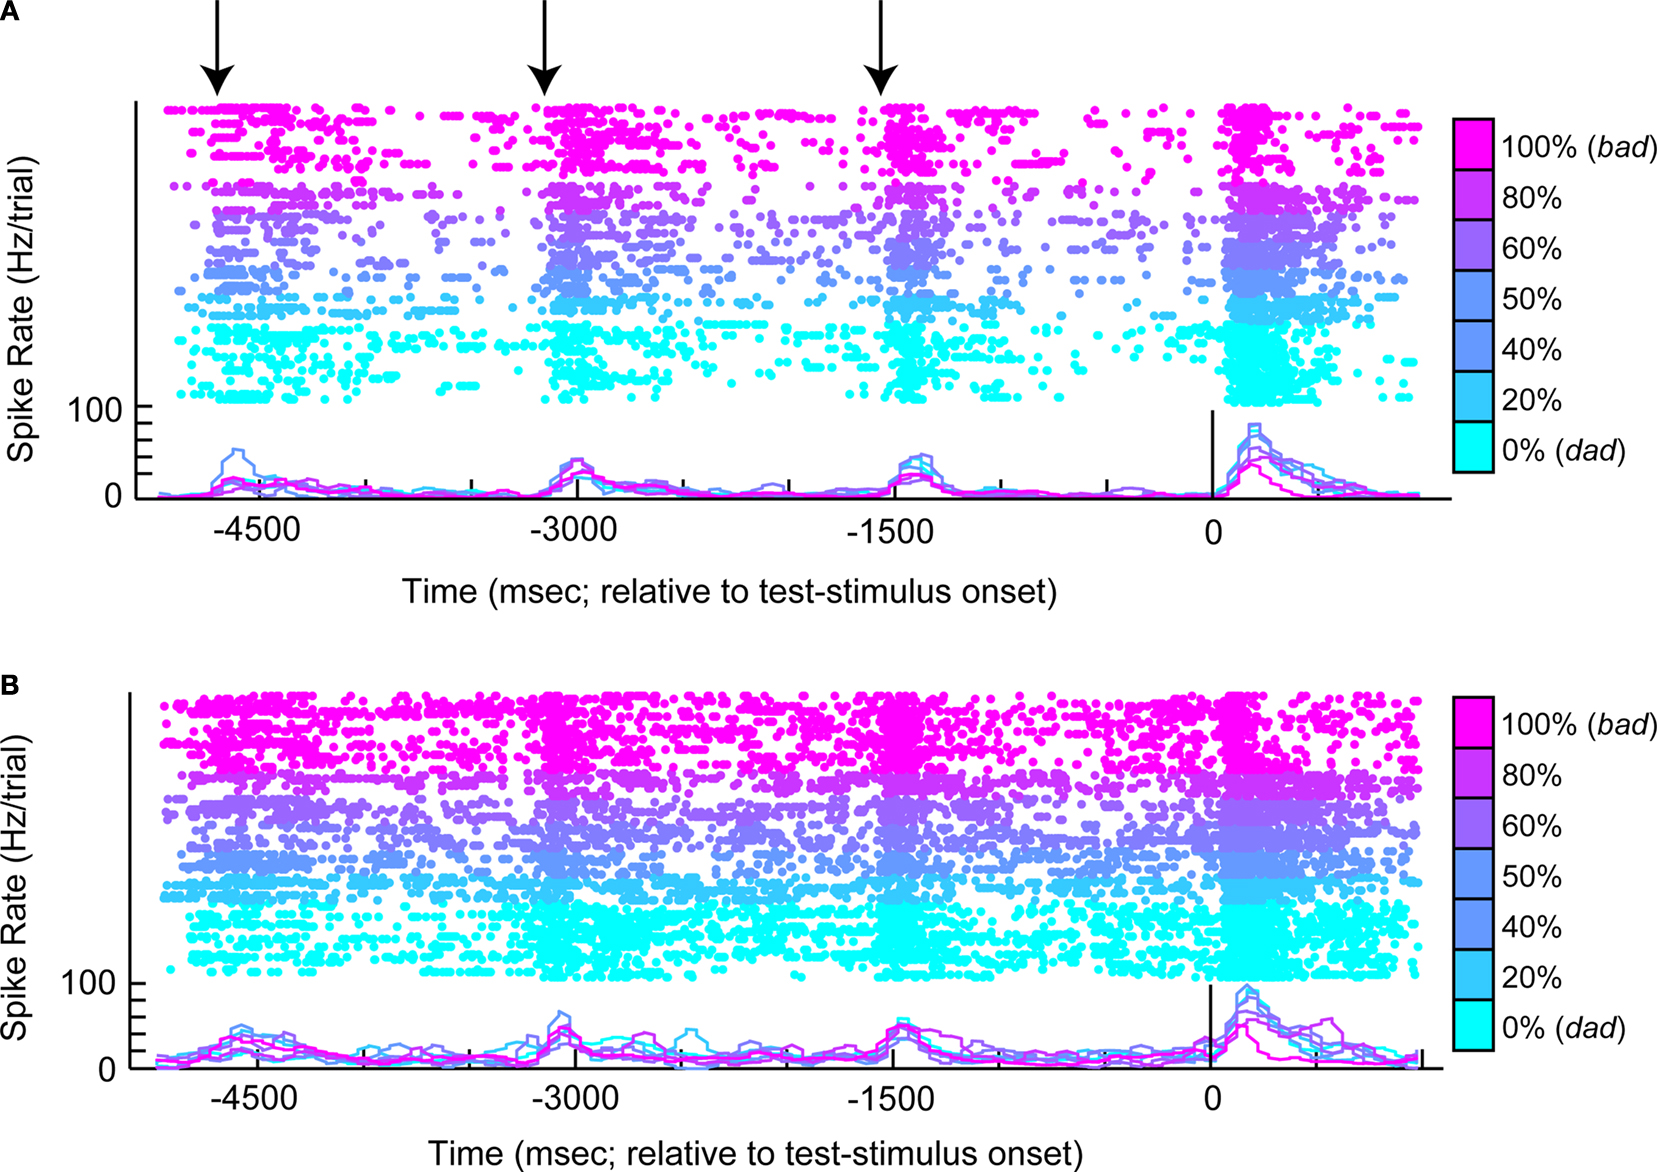
Figure 3. An example of neural activity from a single vPFC neuron during the same-different task. In (A), the reference stimulus was the prototype spoken word bad. In (B), the reference stimulus was the prototype spoken word dad. For both panels, the rasters and spike-density histograms are aligned relative to the onset of the test stimulus. The morph value of the test stimulus is indicated by color as shown by the color bar: 0% morphs are the lightest blue color and 100% morphs are the purple color. When the test stimulus was a 100% morph, it was identical to the reference stimulus. The arrows in (A) indicate the approximate times of each of the reference stimuli. In these two panels, only successful trials are shown.
These factors can be disambiguated, in part, by looking at the neuron’s response to the other reference stimulus, dad. These data are displayed in Figure 3
B. If the neuron was coding the monkey’s perception of the test stimulus, for example, the neuron should continue to elicit high responses when the monkey perceived the test stimulus as dad (see blue colors) and lower responses when he perceived it as bad (see red-purple colors). However, this pattern is not observed. Instead, we continue to find high levels of activity when the monkey reported that the reference and test stimuli were different and lower levels of activity when the monkey reported that the stimuli were the same. Consequently, vPFC activity does not appear to reflect the monkeys’ percept of the test stimulus but better reflects more abstract components of the same-different task relating to what he should chose or actually chose. To further test whether vPFC activity reflects (1) the monkeys’ decisions (actually chose), (2) the relationship between the reference and test stimuli (should choose), or (3) perceptual category of the test stimulus, we trained independent sets of MLPs to decode these three task-related components from vPFC activity.
MLP Decoding
We tested how well a MLP decoded three different components of the same-different task from vPFC activity: (1) perceptual category of test-stimulus (i.e., the test-stimulus category), (2) the relationship between the reference and test stimuli (i.e., what the monkeys should choose), and (3) the monkeys’ actual choice (i.e., their behavioral reports or decisions); see Section “Materials and Methods” for more details. To quantify their capacity to code each these three task-related components, 50 MLPs were independently trained for each of these three components on a neuron-by-neuron basis.
The MLPs were able to learn the relationship between vPFC activity and the desired task-related component. Figure 4
shows two examples of this relationship when two MLPs were trained to decode decision-related neural activity. The data in Figure 4
A were generated from the neuron whose activity most reliably reflected the monkey’s decisions (in terms of the MLP’s performance on the validation dataset); whereas the data in Figure 4
B were generated from the neuron whose activity least reliably reflected the monkey’s decisions.
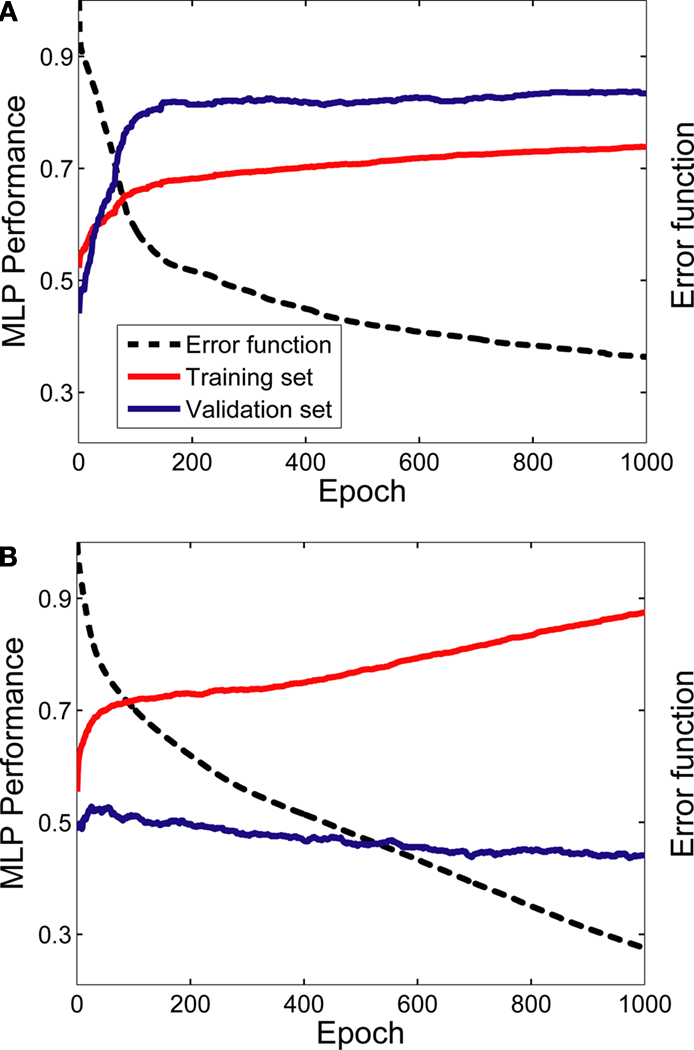
Figure 4. Learning examples from two neurons. Panel (A) was generated from the neuron whose activity most reliably reflected the monkey’s decisions (in terms of the MLP’s performance on the validation dataset); whereas the data in panel (B) were generated from the neuron whose activity least reliably reflected the monkey’s decisions. The graphs in both panels show the average training (red data) and validation (blue data) history; these average values were calculated from the 50 individual training histories that were generated from each of the 50 MLPs constructed for each neuron. The error function (dotted black line) is also shown as a function of training epoch; the error function is  where T is the theoretical value [0 or 1] and O is the actual value, which is a continuous function, of the output node i for each spike train j. The error function is calculated as a function of each training epoch.
where T is the theoretical value [0 or 1] and O is the actual value, which is a continuous function, of the output node i for each spike train j. The error function is calculated as a function of each training epoch.As can be seen, with more training, the MLP’s performance on the training set improved monotonically. However, whereas the MLP’s performance on the validation set in Figure 4
A improved greatly with training before reaching an asymptote, the MLP’s performance on the validation set in Figure 4
B did not show substantial improvement. Nevertheless, for both cases, the MLP’s performance on the validation set reached its maximum point relatively early in the training period. Thus, we often found that the 1000 training epochs were redundant. It is important to note, though, that this did not impact any interpretation of the data from the evaluation set since, in accordance with the early-stopping algorithm (Caruana et al., 2000
; Nelson and Illingworth, 1991
; Prechelt, 1998
), we used the weights from the MLP that gave the best performance, relative to the validation set, and not the weights generated on the last training epoch (see Section “Materials and Methods”).
To quantify the MLP’s performance for each vPFC neuron, we calculated the proportion of times that each of the 50 MLPs correctly decoded the test-stimulus category from the evaluation set. From these 50 decodings, we formed a distribution of “proportion correct.” Next, an analogous distribution was created from 50 MLPs that were (1) trained to decode the relationship between the reference and test stimuli and (2) trained to decode the monkeys’ decisions. Finally using a one-way ANOVA with post hoc comparisons, we tested, on a neuron-by-neuron basis, whether the proportion-correct distributions from the “test-stimulus-trained” MLPs, the “relationship-trained” MLPs, and the “decision-trained MLPs” were reliably different. We found that a significant population (n = 17/51; binomial probability; p < 0.05) of vPFC neurons decoded the monkeys’ decisions reliably better (p < 0.05) than they decoded the test stimulus and the relationship between reference and test stimuli. A non-significant population (n = 4/51) of vPFC neurons decoded the relationship between the reference and test stimuli better, and a small but significant population (n = 6/51; p < 0.05) of vPFC neurons decoded the test stimulus better. Finally, for 24 vPFC neurons, there was no reliable difference between the proportion-correct distributions. A chi-squared test indicated that this distribution of significant neurons was significantly different than that expected by chance (p < 0.05).
Next, for each neuron, we calculated the mean value for each of these three proportion-correct distributions. We defined this mean value as the “average decoding capacity” (ADC). Next, these three values were pair-wise correlated on a neuron-by-neuron basis. The results of these correlations are shown in Figure 5
. In each panel of this figure, a data point’s position along the horizontal and vertical axis represents two of the three possible ADC values for each neuron. For example in Figure 5
A, a data point’s position along the horizontal axis represents a neuron’s relationship-trained-ADC value, whereas a data point’s position along the vertical axis represents the neuron’s decision-trained-ADC value. As can be seen, on average, vPFC neurons had both significantly larger decision-trained-ADC values than relationship-trained-ADC values (Figure 5
A) and test-stimulus-trained-ADC values (Figure 5
B) (Wilcoxon test, p < 0.05). However, the test-stimulus-ADC values and the relationship-trained-ADC values were not reliably different (Figure 5
C).
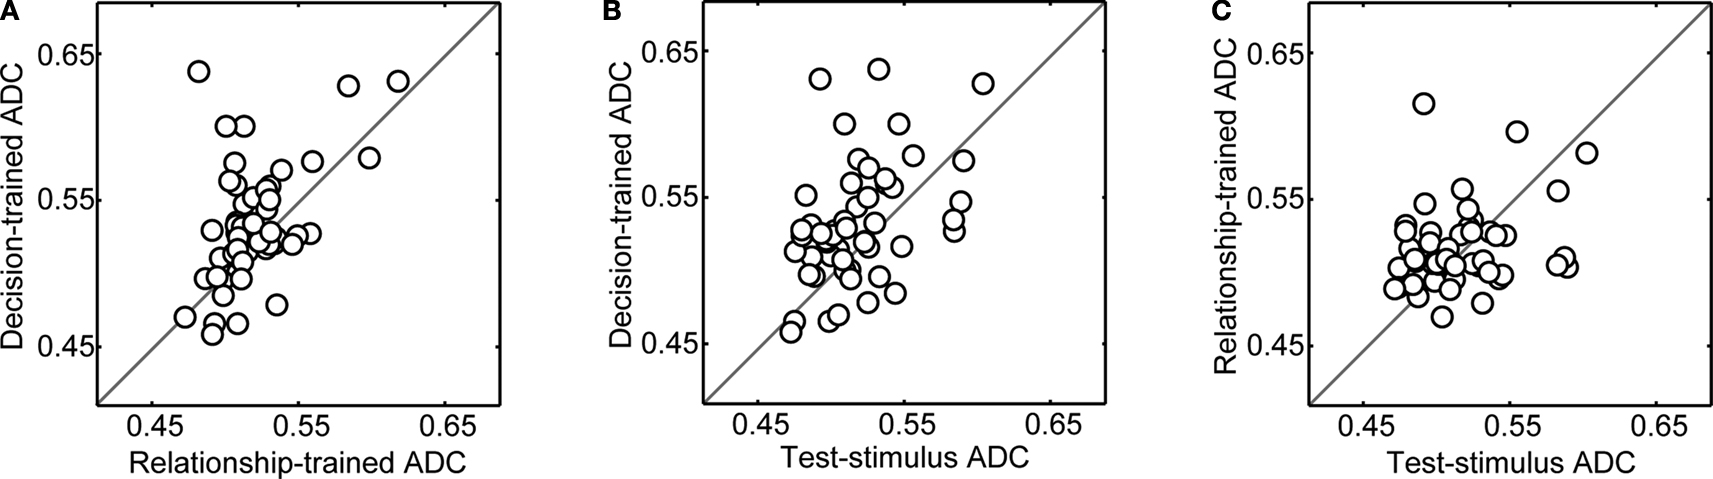
Figure 5. Population analysis of average decoding capacity (ADC). In each panel, on a neuron-by-neuron basis, two of the three ADC values are compared. In panel (A), the decision-trained-ADC values and relationship-trained-ADC values are compared. In panel (B), the decision-trained-ADC values and test-stimulus-trained-ADC values are compared. In panel (C), the test-stimulus-trained-ADC values and relationship-trained-ADC values are compared. In each panel, the solid line is the line of equal ADC value.
Sensitivity to the Type of Stimuli in the Training Set
To assess how robust the decoding capacity of the MLPs was to the particulars of the training set, we performed two additional analyses. First, for each neuron, we trained three new sets of MLPs with data only from those trials in which the test stimulus was a prototype stimulus (i.e., a 0 or 100% morph) and then tested the MLPs with data generated from trials in which the test stimulus was a prototype or a morphed stimulus. The purpose of this analysis was to test whether the MLPs could generalize from vPFC test-stimulus activity elicited by prototype test stimuli to vPFC activity elicited by the morphed test stimuli. This MLP-training paradigm also mimicked the actual training that the monkeys received: prior to recording, the test stimulus was always one of the two prototypes, but when recording began, morphed stimuli were also used as test stimuli.
The results of this analysis can be found in Figure 6
. Decision-trained-ADC values were, on average, significantly greater (Wilcoxon; p < 0.05) than both relationship-trained-ADC values (Figure 6
A) and test-stimulus-trained-ADC values (Figure 6
B). Whereas the magnitude of the ADC values is less than that seen in Figure 5
, the relative difference between decision-trained-ADC values and the other ADC values was substantially larger than that seen in Figure 5
. Also, unlike Figure 5
, on average, the relationship-trained-ADC values were significantly greater (Wilcoxon; p < 0.05) than the test-stimulus-trained-ADC values (Figure 6
C).
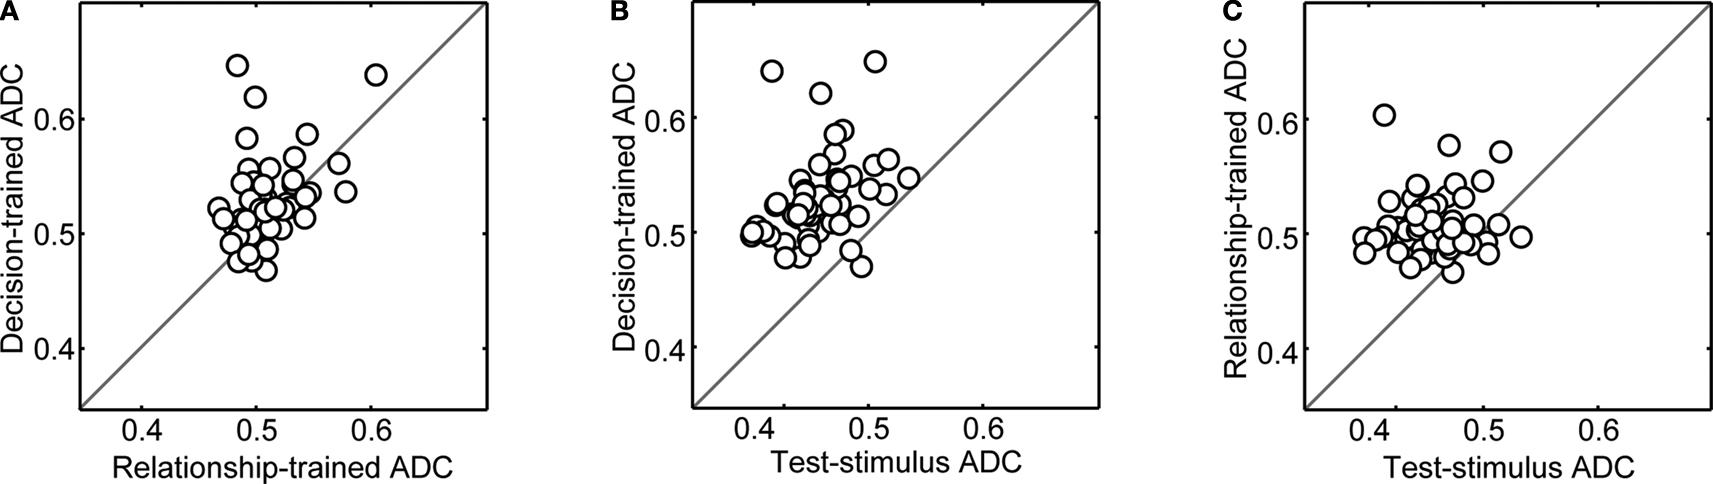
Figure 6. Population analysis of ADC values when the networks were trained using vPFC activity from trials in which the test stimulus was a prototype stimulus only. In each panel, on a neuron-by-neuron basis, two of the three ADC values are compared. In panel (A), the decision-trained-ADC values and relationship-trained-ADC values are compared. In panel (B), the decision-trained-ADC values and test-stimulus-trained-ADC values are compared. In panel (C), the test-stimulus-trained-ADC values and relationship-trained-ADC values are compared. In each panel, the solid line is the line of equal ADC value.
Next, to further assess how robust the decoding capacity of the MLPs was to the particulars of the training set, we trained three new sets of MLPs using data from one reference-stimulus prototype and evaluated the MLPs using data from the other reference stimulus. For example, if a MLP was trained using data in which bad was the reference stimulus, it was evaluated using only data in which dad was the reference stimulus. If the activity of vPFC neurons was dependent on the reference stimulus, we would predict that if the MLP was trained only on data in which bad was the reference stimulus, the MLP should perform poorly when tested with data in which dad was the reference stimulus. However, if a vPFC neuron’s response is not dependent on the reference stimulus, the MLP should perform relatively better when tested with data using a different reference stimulus than it was trained. For each of the 50 MLPs and for each neuron, we randomly picked which reference stimulus was used during training.
The results of this analysis can be found in Figure 7
. As in Figure 6
, the magnitude of the ADC values are reduced but the general pattern remains the same as that seen in Figure 5
. That is, on average, (1) decision-trained-ADC values were significantly greater (Wilcoxon; p < 0.05) than both test-stimulus-trained-ADC and relationship-trained-ADC values (Figures 7
A,B) and (2) the test-stimulus-trained-ADC and relationship-trained-ADC values were not reliably different (Figure 7
C). Together, the results shown in Figures 6 and 7
suggest that, independent of the type of training, vPFC neurons code the monkeys’ decisions better than other components of the same-different task.
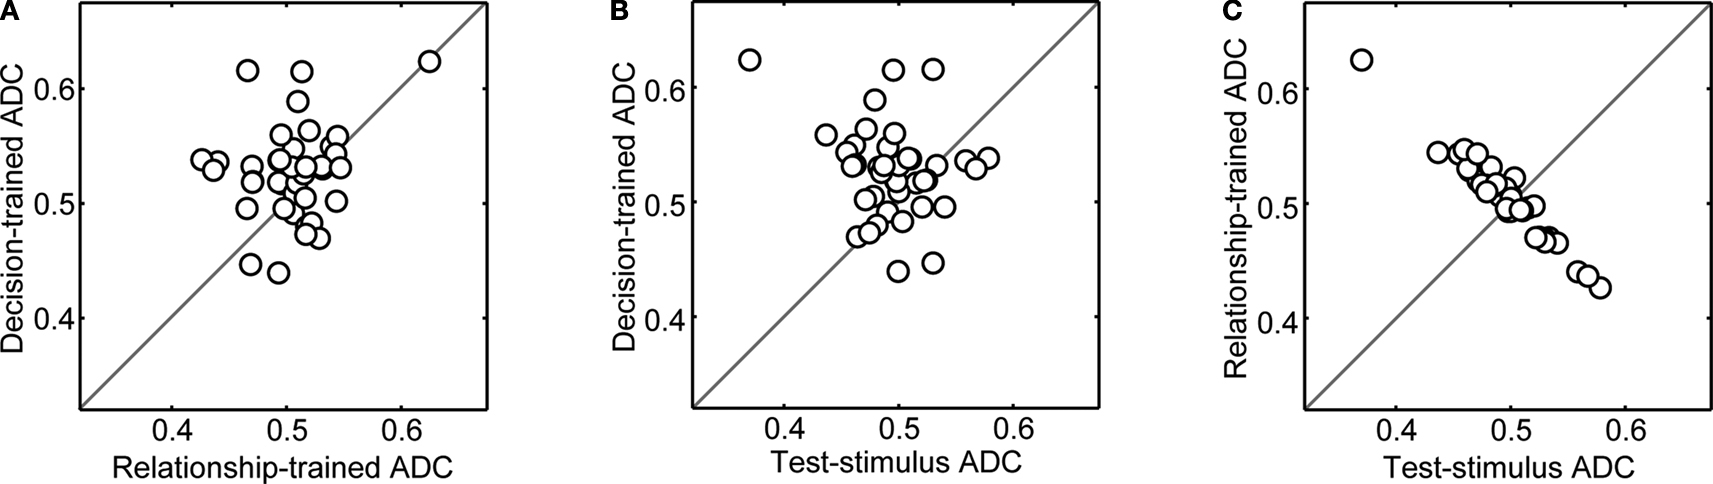
Figure 7. Population analysis of ADC values when the networks were trained using data generated from only one reference-stimulus prototype and evaluated with data from the other reference stimulus. In panel (A), the decision-trained-ADC values and relationship-trained-ADC values are compared. In panel (B), the decision-trained-ADC values and test-stimulus-trained-ADC values are compared. In panel (C), the test-stimulus-trained-ADC values and relationship-trained-ADC values are compared. In each panel, the solid line is the line of equal ADC value.
MLPs that were trained with the spike trains of vPFC neurons were able, on average, to decode the monkeys’ decisions more accurately than they were able to decode both the perceptual category of the test stimulus (test-stimulus category) and the relationship between the reference and test stimuli. These results confirm our previous study by Russ et al. (2008b) and extend it by quantitatively demonstrating that vPFC activity, on average, correlates better with decision-related activity on a neuron-by-neuron basis (Figure 5
).
Importantly, higher decision-trained-ADC values were still found when the MLPs were trained only with data in which test stimuli were prototypes and when the MLPs were trained only with data from one reference-stimulus prototype (Figures 6 and 7
). Together, these data indicate further that, on average, vPFC activity correlates best with the monkeys actual choices (decisions) and not with the perceptual category of the test stimulus or what the monkeys should choose (i.e., the relationship between the reference and test stimuli). These results also reinforce the hypothesis that the vPFC and the auditory regions leading to the vPFC play an active role in aspects of non-spatial auditory cognition (Rauschecker and Tian, 2000
; Russ et al., 2007
, 2008a
,b
); this hypothesis is discussed in further detail in the next section.
Relationship between vPFC and Auditory-Cortex Processing
Since spoken words, like bad, dad, and their morphs, can be considered to be auditory objects (Miller and Cohen, in press
), it might be fruitful to frame our interpretation of this study within a context of auditory-object analysis (Blank et al., 2002
, 2003
; Darwin, 1997
; De Santis et al., 2007
; Griffiths and Warren, 2004
; Micheyl et al., 2005
; Murray et al., 2006
; Nelken et al., 2003
; Poremba et al., 2004
; Rauschecker, 1998
; Scott, 2005
; Scott and Wise, 2004
; Scott et al., 2000
, 2004
; Sussman, 2004
; Ulanovsky et al., 2003
; Wise et al., 2001
; Zatorre et al., 2004
). The first step in auditory-object analysis is for the perceptual system to extract and code the spectrotemporal properties, localization cues, and other low-level features in the signal. These features are then “bound” together to form a representation of the object. The next components of auditory-object analysis involve computations that lead to the formation of increasingly abstract representations and to other perceptual/cognitive states that guide actions and decisions. We present these steps to be serial in nature only as a useful conceptual heuristic, which may not reflect true neural processing. Indeed, the cortex is likely to process an auditory object in a dynamic parallel system in which detection and discrimination are not separable processes but different read-out schemes (Geisler and Albrecht, 1996
; Gold and Shadlen, 2007
; Sternberg, 2001
).
Where in the cortical hierarchy are auditory objects processed? The most likely pathway for vocalization processing is the so-called “ventral” processing stream, a pathway that processes the non-spatial attributes of an auditory stimulus (Rauschecker and Tian, 2000
; Ungerleider and Mishkin, 1982
). This pathway originates in the auditory cortex (Kaas and Hackett, 2000
). The ventral stream is further defined by a series of projections that includes the anterior belt of the auditory cortex and regions of the prefrontal cortex (PFC), specifically the vPFC (Rauschecker and Tian, 2000
; Romanski et al., 1999a
,b
).
Our analyses indicate that, on average, vPFC activity correlates better with neural functions that follow auditory-object formation. Specifically, vPFC activity appears to better reflect the abstract neural states involved in decision-making. As noted above, on average, the ADC of vPFC neurons was highest when the MLPs were trained to decode the monkeys’ actual decisions and not the “lower-level” components of the task such as perceptual category of the test stimulus (Figures 5
–7
). Consistent with these neurophysiological data, a transcranial-magnetic-stimulation study from our laboratory has provided direct evidence that the vPFC is causally involved in decision-making during the same-different task (Orr et al., 2008
).
Where in this ventral processing stream do neurons code the perceptual features – specifically the categorical percept of bad or dad (see Figure 1
) (Eimas et al., 1971
; Kuhl and Miller, 1975
, 1978
; Kuhl and Padden, 1982
, 1983
) – and other components of the task such as comparison between the reference and test stimuli? We hypothesize that regions of the auditory cortex that are part of the ventral processing stream carry this type of information (Rauschecker and Tian, 2000
; Russ et al., 2008a
,b
). Several pieces of data support this hypothesis. First, category-related information about human-phoneme differences is seen in the auditory cortex of the untrained rhesus monkeys and rats (Engineer et al., 2008
; Steinschneider et al., 1995
). Indeed, it is thought that the capacity to discriminate between human speech sounds, such as phonemes like ba and da, relies mainly on general bottom-up auditory mechanisms that are common to all vertebrates (Aslin et al., 2002
). Second, preliminary data from our laboratory indicate that neurons in the superior temporal gyrus, a region of the auditory cortex that receives input from the primary auditory cortex and that projects to the vPFC (Rauschecker and Tian, 2000
; Romanski et al., 1999a
,b
) codes the perceptual category of the test stimulus reliably better than decision-related activity (Lee and Cohen, unpublished observations). Finally, a number of studies suggest that at the level of the primary auditory cortex, if not earlier (Nelken et al., 2003
), neurons are integrating the dynamic spectrotemporal properties of a stimulus, a fundamental requirement for object perception (Barbour and Wang, 2003
; Bendor and Wang, 2007
; Fishman et al., 2000
, 2001
; Wang and Kadia, 2001
; Wang et al., 2005
).
Our hypothesis that decision-related circuitry is a product of computations occurring in the PFC and not the “sensory” cortex is supported by analogous studies in the visual system. Miller and colleagues argue that PFC neurons tend to reflect a stimulus’ membership in a category more than its physical properties, whereas neurons in the infratemporal cortex tend to be better correlated with its physical properties than PFC neurons (Freedman et al., 2003
). More specifically, the responses of PFC neurons tend to vary with the rules mediating a task or the behavioral significance of stimuli, whereas responses in the infratemporal cortex tend to be invariant to these variables (Ashby and Spiering, 2004
; Freedman et al., 2003
).
Comparing the MLP with other Classifiers
In general, there is no a priori way to determine what type of classifier (e.g., MLP, linear classifier, etc.) works best with a particular data set. For example, LeCun et al. (1998)
compared the performance of a variety of classifiers on a standardized database of handwriting samples and found that a perceptron with two hidden layers performed better than a perceptron with a single hidden-layer. However, other studies indicate that classification does not always improve with more hidden layers (Bishop, 1995
).
In our study, we used a single hidden-layer perceptron for two reasons. First, the learning capacity of a single hidden-layer network is well described both theoretically and empirically (Bishop, 1995
; Cybenko, 1989
; LeCun et al., 1998
; Siegelmann and Sontag, 1991
). Second, this network can perform both linear and non-linear mappings between inputs and outputs; when the weights are small, a MLP implements a linear function. Overall, one has to be conservative when interpreting the data from the MLP since other classifiers may prove to be better for any particular data set.
Comments on Performance of the MLP
On average, the performance of the MLPs was relatively poor. This observation relates to at least three non-exclusive issues. First, we reported all of the results from a database that used a very minimal criterion for inclusion: responses to sounds. Consequently, the activity of some vPFC neurons was probably highly related to the task, whereas the activity of other neurons was not related to the task. Indeed, the categorization studies from Miller’s laboratory (Freedman et al., 2001
, 2002
) indicate that only ∼20–25% of their PFC neurons are engaged in categorization. So, it is conceivable that only a small percentage of PFC neurons are engaged in a given task.
Second, the poor performance might be inherent to components of the MLP’s training. Each MLP was trained by randomly selecting the training set and the initial weights. Consequently, it is reasonable to speculate that some MLPs failed to extract the learning (generalization) rule that was taught during training. Indeed, some MLPs learned the rule, whereas others did not. Since there is no a priori way to determine whether a MLP is trained appropriately (Bishop, 1995
; Hertz et al., 1991
) (i.e., one MLP can be well trained or poorly trained by a random selection of the training set or the initial weights), we choose to look at the ADC (i.e., the mean value for each of proportion-correct distributions for each neuron) to avoid the bias inherent in looking at the results of a single MLP.
Finally, it is possible that better behavioral performance and/or better ADC values might have been obtained if we had used a different stimulus set, such as species-specific vocalizations. However, we chose not to use vocalizations since vocalizations do not differ along a single dimension (e.g., some are noisy and some are harmonic stacks) (Hauser, 1998
). In contrast, the phonemes ba and da differ along a single dimension: their 2nd formant (Diehl et al., 2004
). Furthermore, if we had morphed species-specific vocalizations, we would have induced potential changes in both the referent and semantic meaning of the vocalizations and had to control for these two confounds.
Alternative Interpretations
One possible alternative interpretation is that since the stimulus-presentation dynamics in our same-different task are similar to that used in oddball tasks and stimulus-specific adaptation (Näätänen, 1992
; Ulanovsky et al., 2003
), stronger “pop-out” vPFC responses might reflect the automatic detection (Näätänen, 1992
) of uncommon test stimuli. However, several pieces of data argue against this possibility. First, if vPFC responses reflect detection of test stimuli that are acoustically distinct from the reference stimulus, then they should have responded strongly to any test stimulus that was acoustically distinct from the reference stimulus (i.e., the 0–80% morphs). However, since vPFC neurons respond weakly to several of these “novel” test stimuli (e.g., Figure 3
), vPFC activity cannot reflect the presence of acoustically distinct test stimuli. Moreover, some vPFC neurons have a low firing rate when the reference and test stimuli were acoustically distinct but a relatively higher firing rate when the reference and test stimuli were the same (Russ et al., 2008b
); once again, a pattern of responsivity incompatible with the idea that vPFC neurons automatically signal the detection of acoustically distinct test stimuli with strong pop-out responses (Näätänen, 1992
). Finally, if vPFC activity reflects the automatic detection of acoustically uncommon stimuli, we would expect that vPFC activity would habituate with repeated presentations of the reference stimuli as seen in stimulus-specific adaptation studies (Reches and Gutfreund, 2008
; Ulanovsky et al., 2003
). However, contrary to this hypothesis, separate studies from our lab have failed to note this pattern of activity (Gifford III et al., 2005
; Russ et al., 2008b
). Thus, several lines of evidence indicate that vPFC activity does not reflect acoustically novel stimuli.
It is possible that the higher responses reflect the detection of stimuli that are novel semantically or perceptually (Strange et al., 2000
). Indeed, we have argued previously that vPFC neurons reflect changes in a semantic difference between vocalizations (Gifford III et al., 2005
). Under this hypothesis, we would only see enhanced responses that were perceptually distinct from the reference stimulus (i.e., morphs >50%), a pattern consistent with our data. However, even this version of the novelty-detection hypothesis would predict decreases in neural response to repeated presentations of the reference stimuli, an observation that we have failed to note in previous studies (Gifford III et al., 2005
; Russ et al., 2008b
).
A second alternative interpretation is that vPFC neurons may not be coding decisions but may be correlated with saccadic-eye movement plans (Snyder et al., 2000
). Our analyses indicate that such eye-movement plans cannot wholly explain our data. First, previous experiments from our group demonstrated that eye movements do not appear to be correlated with changes in neural activity in the vPFC (Gifford III et al., 2005
). Second, using data from this study, a signal-detection metric could not identify a relationship between vPFC firing rates and the monkeys’ eye movements during the time period when they were saccading to one of the two LEDs (Russ and Cohen, unpublished observation). However, at this juncture, we cannot rule out the possibility that the vPFC is also involved in other components of the same-different task such as action selection (Miller and Cohen, 2001
).
This study provides further support for the involvement of the PFC in decision-making: vPFC neurons, on average, report the monkeys’ decisions during a same-different task. Since the vPFC has been hypothesized to be at the apex of a network of auditory regions that specialize in the processing of non-spatial auditory information (Rauschecker and Tian, 2000
; Russ et al., 2008a
,b
), future research should focus on how those regions that provide afferent input to the vPFC respond during the same-different task in order to better categorize the interactions between cortical regions.
The authors declare that the research was conducted in the absence of any commercial or financial relationships that could be construed as a potential conflict of interest.
We would like to thank Heather Hersh for helpful comments on the preparation of this manuscript, Ashlee Ackelson and Selina Davis for excellent technical assistance, and Farshad Chowdhury and Lauren Wool for assistance with preliminary aspects of data collection. Yale E. Cohen was supported by grants from the NIDCD-NIH and the NIMH-NIH. Brian E. Russ was supported by an NRSA grant from the NIMH-NIH.