Performance- and stimulus-dependent oscillations in monkey prefrontal cortex during short-term memory
1
Abteilung Neurophysiologie, Max-Planck-Institut für Hirnforschung, Frankfurt/M, Germany
2
Frankfurt Institute for Advanced Studies, Johann Wolfgang Goethe University, Frankfurt/M, Germany
3
University of Maryland School of Medicine, Maryland Psychiatric Research Center, Baltimore, MD, USA
4
Department of Psychology, University of Glasgow, Centre for Cognitive Neuroimaging, Glasgow, UK
5
Brain Imaging Center Frankfurt, Johann Wolfgang Goethe Universität, Frankfurt/M, Germany
6
Department of Cognitive Neuroscience, Faculty of Psychology, Universiteit Maastricht, Maastricht, The Netherlands
7
Abteilung Physiologie kognitiver Prozesse, Max-Planck-Institute für biologische Kybernetik, Tübingen, Germany
Short-term memory requires the coordination of sub-processes like encoding, retention, retrieval and comparison of stored material to subsequent input. Neuronal oscillations have an inherent time structure, can effectively coordinate synaptic integration of large neuron populations and could therefore organize and integrate distributed sub-processes in time and space. We observed field potential oscillations (14–95 Hz) in ventral prefrontal cortex of monkeys performing a visual memory task. Stimulus-selective and performance-dependent oscillations occurred simultaneously at 65–95 Hz and 14–50 Hz, the latter being phase-locked throughout memory maintenance. We propose that prefrontal oscillatory activity may be instrumental for the dynamical integration of local and global neuronal processes underlying short-term memory.
The maintenance of information during short-term memory (STM) has originally been associated with sustained firing of cells in prefrontal cortex (PFC) (Fuster and Alexander, 1971
; Goldman-Rakic, 1995
; Miller et al., 1996
; Rainer and Miller, 2000
). It has been proposed that persistent neuronal activity is sustained by cellular bistability (Lisman et al., 1998
; Seamans et al., 2001
) or by reverberating neuronal activity (Durstewitz et al., 2000
; Machens et al., 2005
). Reverberating neuronal activity that could serve the maintenance of stimulus information has been proposed to express itself in common rate modulations (Golomb et al., 1990
) or irregular (Compte et al., 2003
) or oscillatory activity patterns (Compte et al., 2000
). If oscillatory activity is involved in the organization of STM, the question arises whether oscillations participate in the coding of specific content as has been suggested previously (Lisman and Idiart, 1995
; Singer, 1999
) and which has been shown for parietal (Pesaran et al., 2002
) and extrastriate visual cortex (Lee et al., 2005
), or, whether they reflect unspecific arousal due to behavioral demands, or provide a temporal reference signal for the coordination of distributed representations (Lisman and Idiart, 1995
; Sommer and Wennekers, 2001
). In the context of distributed perceptual processing in visual cortex, synchronized beta- and gamma-frequency oscillations have been shown to be involved in attention dependent stimulus selection (Fries et al., 2001
; Bichot et al., 2005
; Taylor et al., 2005
; Lakatos et al., 2008
). Oscillations provide an effective mechanism for the synchronization (Pikovsky et al., 2001
) of neuronal activity both at global and local scales (Buzsaki and Draguhn, 2004
) and, thus, could play a role in the coordination of STM sub-processes serving the encoding, retention, and retrieval of information. Physiological evidence for neuronal oscillations participating in STM has been obtained in parietal (Pesaran et al., 2002
) and extrastriate temporal cortex (Tallon-Baudry et al., 2004
), but not for prefrontal cortex.
Two female monkeys (M. mulatta) were trained to perform a visual STM task which consisted of a 0.5-s sample presentation, 3-s delay and 2-s test presentation (Figure 2
A) during which the monkey had to respond by pressing one of two buttons. Stimulus presentation and behavioral control were provided by a custom-made program. The monkeys did not have to fixate, but we measured eye movements at high resolution with the double magnetic induction method (Bour et al., 1984
). The percentage of correct behavioral responses ranged between 71% and 87% across sessions. Anatomical MRI scans (T1-flash, 1 mm3 isovoxel, 1.5 T) were used to guide implantation of recording chambers and to reconstruct recording positions. All procedures were approved by the local authorities (Regierungspräsidium) and are in full compliance with the guidelines of the European Community (EUVD 86/609/EEC) for the care and use of laboratory animals.
Simultaneous recording of unit and field potential activity (Figure 2
B) was performed with up to 16 platinum-tungsten-in-quartz fiber microelectrodes (Thomas RECORDING, Giessen, Germany) from ventral PFC. Electrodes had been arranged in a square shaped 4 × 4 grid with a distance between nearest neighbors of 500 µm. Signals were filtered (0.5–5 kHz (MUA) and 5–150 Hz (LFP) 3 dB/octave) and digitized at 1 kHz, preprocessed by rejecting artifacts (movements, licking) and removing line noise at 50 ± 0.5 Hz. Spectral analyses were performed for sets of trials constructed from the stimulus and behavioral protocol using the NeuronMeter software package (http://neuronmeter.convis.info
).
Assessment of Power and Phase-Locking
In order to assess dynamical changes of oscillatory activity in LFP recordings, we estimated signal power (p) based on a sliding window FFT (window length 200 ms, shifted by 10 ms, signal tapered by a Hamming window). Pairwise phase relations between recording sites were assessed by computing the phase-locking value (PLV), which describes the stability of phase differences across trials among pairs of sites. Phase locking values were used to measure phase synchronization. A constant phase difference is described by PLV = 1, while random phase differences are expressed as PLV = 0.
Analysis of Performance-Related Changes at Individual Sites/Pairs (λ-Maps)
We compared changes of both power and phase locking in relation to behavioral performance. The performance amounted on average to ∼80%, yielding four times as many correct than error trials. Therefore we selected subsets of trials balanced in number for correct and incorrect behavioral responses to allow for an unbiased estimation of performance-related differences. For each recording session correct and incorrect trials were matched in terms of number of trials and temporal proximity, leading to subsets containing in total 2402 trials (7 sessions, 86 sites, 507 pairs) for monkey 1 and 1722 trials for monkey 2 (5 sessions, 66 sites, 414 pairs). To assess significant differences between trials with incorrect and correct responses, we used: (1) bootstrapping to estimate variability and stability, and (2) permutation of trials between conditions to construct H0 which predicts no performance-dependent difference. It is important to note that both the bootstrapping and the permutation test serve different purposes. While the bootstrapping is used to estimate the variability in the data, the permutation test is used to assess the statistical significance of potential differences between the two conditions (Figure 1
). The bootstrapping procedure comprised a total of 16 samples. 12 of the 16 bootstrap samples, each constructed by a random selection of 75% of all trials within one condition (correct/incorrect), were used for assessing variability. The four remaining bootstrap samples were used for detection of slow trends or other instabilities throughout a session. They each lacked systematically the first, second, third or last quarter of trials (Figures 1
A,B). This procedure will only retain performance-related changes which are reliable and stable over time. Differences between conditions are assessed in analogy to a Mann–Whitney U-test by a difference of rank sums (k) between the two sets of 16 bootstrap samples. This difference is used as the test statistic in order to determine significance. To test whether an observed difference was significant we used a permutation test. Permutation tests are non-parametric procedures which consider the exact empirical distribution of the data and therefore provide extremely robust results. The permutation test used here is based on 160 permutations (Figures 1
C,D). For each permutation, the trials of condition 1 and 2 were randomly permuted. This destroys condition related differences and provides an estimate of distributions occurring just by chance. Here, the permutation is used to estimate the distribution of differences in rank sums k0 under H0 (H0: no difference between conditions). To this end the bootstrapping procedure described above was applied to each permuted set of trials. The p-value is estimated by computing pL(k < = k0) for a left sided and pR(k > = k0) for a right sided test. Please note that the false positive level is independent of the bootstrapping procedure, since the permutation test was used to derive an empirical distribution under H0 (H0: no difference between conditions) that considers the exact empirical distribution of the bootstrapping itself. Therefore the choice regarding the type of bootstrapping, as well as the number of bootstraps can only effect the test power as well as the level of correction on certain properties of the data. We decided to correct for variability as most approaches do, but we also aimed at correction of slow instabilities, by adding four bootstrap samples that systematically lacked one-quarter of the data (Figure 1
).
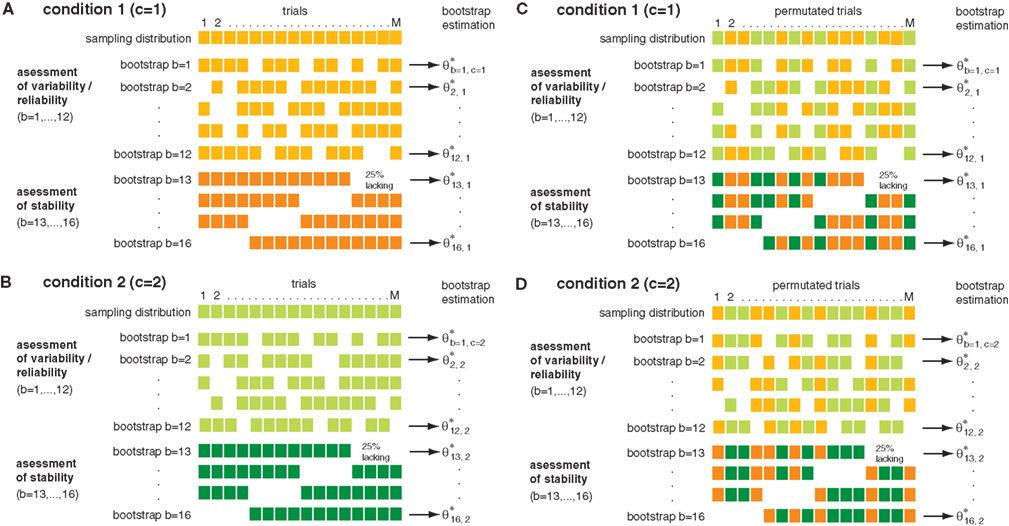
Figure 1. Permutation and n-jackknife test for bivariate testing of performance-related changes. The example illustrates the concept of the testing procedure. Bootstrapping and n-jackknife of two-samples [(A): sample 1, (B): sample 2] from two conditions [(C) condition 1, (D) condition 2] were used. These data were sub sampled based on a combination of an n-jackknife and bootstrapping. The bootstrapping generates 12 bootstrap samples which contain random 75% of the trails and were used to determine variability in each data set (upper plots). In addition an n-jackknife resampling was used to partition the data into four quarters in order to check for stability during the experiment (lower plots). In total, the bootstrap data comprise 16 sub samples for each condition. To test whether differences between conditions were significant, a second permuted dataset was used. To this end, trials were permuted across conditions. After trial permutation, the same n-jackknife bootstrap procedure was employed on the permuted data.
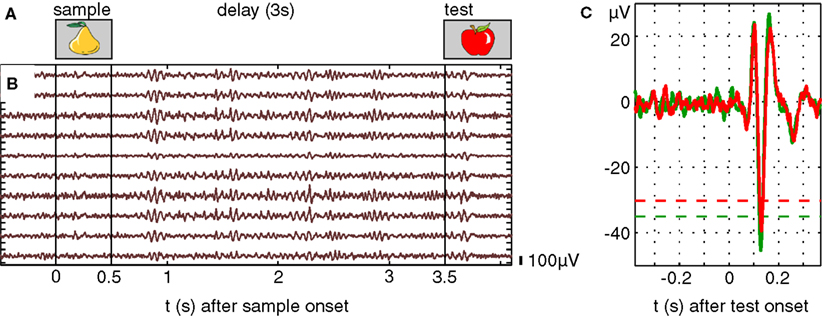
Figure 2. Oscillations and time-frequency responses in prefrontal cortex during a visual short-term memory task. (A) Visual memory task in case of a non-match condition. After sample stimulus presentation for 0.5 s, the information of the sample has to be maintained for 3 s and compared to the test stimulus. (B) Ten simultaneous field potential recordings from microelectrodes in ventral prefrontal cortex, scale bar indicates 100 µV. (C) Evoked responses computed from prefrontal LFPs by estimating the distribution of signal amplitude in a pre-stimulus epoch 500 ms before stimulus onset. Responses were considered significant if five or more successive bins exceeded a 1% threshold. Green and red traces represent evoked responses in trials with correct and false behavioral responses, respectively.
After estimating the p-value for each time-frequency bin for each electrode or electrode pair in the case of computing phase locking values, in all sessions, we derived population statistics based on λ-maps. λ-maps describe population statistics as time-frequency plots and measure the percentage of electrodes or pairs of electrodes that exhibited a significant change of power or phase locking as a function of time and frequency. The detailed procedure to estimate λ-maps is as follows. Based on the p-value (test level 1%, see permutation test described above) for each frequency bin and sliding window, we computed the percentage of sites and pairs of sites per session which showed an increase in power or PLV for trials with correct [fc(P), fc(PL)] and incorrect [fi(P), fi(PL)] responses, respectively. To estimate the expected probability of sites/pairs with significant modulation in power/phase locking, fc and fi are averaged across sessions. To allow for variability in the timing and frequencies of states or processes across sessions and subjects, time-frequency maps of fc and fi were smoothed with a Gaussian kernel (st = 150 ms/sf = 5 Hz). The parameter st and sf were selected based on properties of the data and have been fixed before estimating the λ-maps in order to prevent over-fitting and increased false positive levels. The parameter st was selected to match approximately the observed latency variation of evoked responses during sample and test stimulation (range 58–176 ms, δt = 118 ms), while sf is matches the uncertainty of the frequency revealed by Fourier transformation based on a 200-ms long rectangular sliding window. Smoothed time-frequency maps of f are referred to as λ-maps. λc describes the percentage of sites with a significant increase in power for correct trials and λi an increase in incorrect trials. Note that an increase in λc does not imply a decrease in λi for incorrect responses. Two different subpopulations could still behave in an opposite fashion. One subpopulation could exhibit increased power for correct and the other for incorrect responses. To compute the modulation of the percentage of sites with increased power λc(P) and pairs λc(PL) with increased PLV for correct behavioral responses with respect to the baseline (−0.5–0 s) we computed baseline-corrected z-scores and applied a significance criterion of 1% which we corrected according to Bonferroni for 450 comparisons (all sliding windows from 0 to 4.5 s). Frequencies are treated separately to consider frequency-band specific pre-sample differences like attention-related increases of certain oscillation frequencies. To compare the modulation λc and λi in relation to baseline, we contrasted the z-score for correct and incorrect trials, describing a percentage difference in z for correct with respect to incorrect trials. Note, that the results based on permuted classes ‘correct’ and ‘incorrect’ are based on the same amount of data as the original results with intact trial classes. Hence, the modulation across frequency and time indicate the expected amount of change and an expected modulation of lambda values in case the observed results are not related to the performance of the monkey. This allows for using mean and variance of permuted data to express lambda as statistical modulation measured by a z-score (Figure 4
).
Comparison of the Performance Dependent Modulation of Grand Average Power/Phase-Locking with Modulation of λc- and λi-Maps
Both, the performance dependent modulation of grand-average power and phase-locking, as well as the modulation of λc and λi-maps, are assessed by the contrast between the two conditions correct (c) versus incorrect (i) responses:
This contrast ranges between −1 and 1. The contrast is a nonlinear transformation and the relative difference between c and f increases supra-linearly with increasing contrast. If we assume a modulation factor a scaling c and f with c = α × i, the contrast can be expressed only by α:
And we can express a by the contrast:
Thus, the maximum contrast observed for grand-average power (phase-locking) and the maximum contrast of λ-maps, both describing the performance dependent modulation, can also be expressed by a modulation factor a. For example, z = 0.5 leads to a modulation factor a = 3, meaning that the compared value (e.g. power, phase-locking or λ) had been three times, or 300% higher for correct than for incorrect responses. The maximum observed contrast in case of the grand-average power and phase-locking amounted to 0.07, which is equal to a modulation factor of 1.005. Note that the performance-related modulation of λ-maps amounted to 0.5 which is equal to a modulation factor of 3. Thus, the performance-related modulation of λ-maps exceeds the modulation of the grand-average power and phase-locking by a factor of 298. This illustrates the advantage of the combination of bootstrapping and permutation tests, applied on each individual site (pairs) and time-frequency bin, to identify performance-related or stimulus-selective modulations in power and phase-locking.
Detailed Description of Selectivity Analysis
The structure of the selectivity analysis is identical to the structure of the performance analysis, the only difference being that the number of conditions was larger. To assess stimulus selective differences in the power of oscillations (time-frequency resolved), we balanced the number of trials for all presented stimuli per session by taking random subsets of the same size. To correct for sequence effects, which could lead to stimulus selective pre-sample activity, we rejected trials in which the sample stimulus was identical with the test stimulus of the preceding trial. Stimulus sets consisting of 16 or 20 different stimuli had been used. Sessions which had been considered for the analysis of performance-related changes and had less than 20 trials per stimulus were discarded, leading to 4 sessions for monkey 1 (in total 2280 trials, 56 sites) and 3 sessions for monkey 2 (in total 1760 trials, 38 sites). Since phase-locking statistics require more trials than the estimation of average power to reach the same reliability of the estimation, the number of trials for individual objects had not been large enough to check for selective differences in phase-locking.
As for the analysis of performance-related changes we used a bootstrapping procedure that yielded 16 Bootstrap samples for each object to compute the mean power per frequency bin and sliding window. In analogy to an ANOVA we computed on these samples the  . The same bootstrapping approach was used on each set of 100 permutations of the trials of all conditions, leading to a distribution of F0 under H0 (all µi = µj). We performed a right sided significance test (test-level 1%) for each frequency bin and sliding window and estimated the percentage fs(P) of sites per session with stimulus selective responses in power. To estimate the probability of stimulus selective modulations in power at individual sites λs(P) we averaged fs(P) across sessions and smoothed the average with a Gaussian kernel (st = 150 ms, sf = 5 Hz as used for performance-related modulation). Smoothed time-frequency maps of fs are referred to as λs-maps. λs(P) allows for variability in the timing and frequencies of selective states or processing across sessions and subjects. Increase to baseline (−0.5–0 s) was measured by the base-line corrected z-score, where average baseline selectivity and its standard error was estimated across all frequencies. This takes into consideration that stimulus-selective changes during baseline must be false positives irrespective of their frequency. Please note, that the level of false positives is independent of the choice of test statistics, the distribution of the test statistics and bootstrapping procedure since the permutation test considers the exact empirical distribution of the test statistics to estimate the p-value. Therefore the bootstrapping procedure as well as the test statistics could be chosen freely.
. The same bootstrapping approach was used on each set of 100 permutations of the trials of all conditions, leading to a distribution of F0 under H0 (all µi = µj). We performed a right sided significance test (test-level 1%) for each frequency bin and sliding window and estimated the percentage fs(P) of sites per session with stimulus selective responses in power. To estimate the probability of stimulus selective modulations in power at individual sites λs(P) we averaged fs(P) across sessions and smoothed the average with a Gaussian kernel (st = 150 ms, sf = 5 Hz as used for performance-related modulation). Smoothed time-frequency maps of fs are referred to as λs-maps. λs(P) allows for variability in the timing and frequencies of selective states or processing across sessions and subjects. Increase to baseline (−0.5–0 s) was measured by the base-line corrected z-score, where average baseline selectivity and its standard error was estimated across all frequencies. This takes into consideration that stimulus-selective changes during baseline must be false positives irrespective of their frequency. Please note, that the level of false positives is independent of the choice of test statistics, the distribution of the test statistics and bootstrapping procedure since the permutation test considers the exact empirical distribution of the test statistics to estimate the p-value. Therefore the bootstrapping procedure as well as the test statistics could be chosen freely.Choice of Parameters, False Positives and Effects on the Population Level
The estimation of λ-maps involves a choice of many parameters and bootstrap strategies. For many parametric statistical procedures the choice of parameters matters regarding the distribution of the test statistics and the resulting level of false positives. To prevent this we employed a non-parametric permutation test. This test uses the exact empirical distribution and therefore is extremely robust. To illustrate that false positives are not increased regarding the test level, permutation tests offer the appealing option that one compares a test statistic, here k, form a permuted trial set, with other permuted trial sets. This procedure allows for an estimate of the level and the time-frequency λ-map of pure chance effects. Figures 4
G,H show this chance modulation of λperm-maps for power and phase–locking. In turn, the random variation and the average level in such a permutation λ-map can be used to estimate the statistical importance. To this end we use the z-scores that compare the difference between the λperm-maps and the corresponding λ-map with the standard deviation as observed in the λperm-map.
Significance of Phase Locking Values and Spatial Extend of Phase Synchronization
To assess whether an estimated phase locking value is meaningful we used the Rayleigh test which can determine whether a cyclic measure like the phase of an oscillation is uniformly distributed between 0 and 2π. To assess significance we computed the p-value using the Fischer approximation. The latter estimates the p-value as a function of the phase locking value and the number of trials used. On average, we used 343 trials per session. Given that number, we can compute the p-value for each phase locking value. For n = 343, a phase locking value of 0.2 leads to p-value of 0.027, while a phase locking value of 0.5 leads to a p-value smaller 10−10. To correct for multiple comparisons regarding time, we used a Bonferroni correction for 450 sliding windows, leading to a critical p-value of 0.0002. Therefore, phase locking values larger than 0.5 indicate significant phase synchronization between pairs of LFP signals in our data, while phase locking values below 0.2 can be explained by chance.
We used this split for qualifying phase locking values in order to estimate an approximate extension of phase synchronization between electrodes. Recordings had been performed with up to 16 electrodes arranged in a square shaped 4 × 4 grid, with a short distance between electrodes of 500 µm. In these grids, the average distance based on an eight neighbor definition between nearest neighbors was 606 µm in the XY plane, including the second nearest neighbors. Because of the non-planar shape of the cortical sheet, slight bending of electrodes or placement at different depth for recording, this average distance can shorten or extend with regard to cortical coordinates. Despite this fuzziness, we can estimate the approximate spatial extent of phase synchronization based on the average electrode distance. On the one hand, phase locking values above 0.5 indicate phase synchronization across electrodes, the spatial extent of phase synchronization being larger than the shortest average electrode distance (∼600 µm). On the other hand, phase locking values below 0.2 indicate that phase synchronization was either not present or confined to a spatial extent smaller than the average electrode distance.
In this study we investigated first, whether task-related oscillations occur in local field potentials (LFPs) of ventral PFC and second, whether power and phase-locking of oscillations in various frequency bands correlated with behavioral performance and the identity of the memorized visual stimuli. Third, we studied the spatial coordination of task-related neuronal oscillations. And fourth, we integrated experimental findings into a functional model of prefrontal memory function. When the two monkeys reliably performed the memory task, we implanted a recording chamber over lateral prefrontal cortex and recorded simultaneously multi-unit and field potential activity from up to 16 fiber microelectrodes.
Multi-Unit Responses and Evoked Potentials
Stimulus selectivity of encoding and maintenance related multi-unit activity, estimated by ANOVA (5% level), amounted to 25% stimulus-selective sites, which is compatible with published data for single unit recordings (Miller et al., 1996
; Rainer and Miller, 2000
). The dynamics of local field potentials were analyzed for evoked responses, spontaneous and induced oscillations. Evoked responses (Figure 2
B) were observed in 78% of the recording sites during the presentation of sample and test stimuli with a mean latency of 112 ms (range 58–176 ms). The amplitude of evoked field potential responses to sample and test stimuli was slightly larger in trials with correct behavioral responses (compare green and red traces in Figure 2
C, mean difference 10.4%, p < 0.01).
Grand Average Power/Phase Locking
We then assessed properties of oscillatory activity in the LFP, separately for balanced sets with matching numbers of trials for correct and incorrect behavioral responses, by quantifying oscillation amplitudes and phase synchronization. To this end we used time-frequency maps of average power and phase-locking, averaged across all trials, channels or channel pairs, respectively, and sessions. Induced and spontaneous oscillations in the frequency range between 12 and 95 Hz occurred during all epochs of the trial. Highest power values and strongest phase locking was observed during stimulus presentation times which therefore was stimulus evoked activity. Immediately after the strong peaks of evoked power and phase locking, both measures dropped to the lowest level during the trial at lower frequencies between 12 and 35 Hz. In the next step, we checked whether power and phase locking was stable across sessions and channels or channel pairs, respectively. To this end we estimated the variability of power and locking across sessions and channels or channel pairs.
We then normalized the grand average power and phase-locking values by computing z-scores (mean/std). Large z-scores indicate relatively small variability across sessions and channels or channel pairs, compared to the grand average. We found that, although the mean amplitude of oscillations was about three times higher in the range of 12–35 Hz than in the range of 35–95 Hz, oscillatory activity in the high-frequency range occurred reliably across sessions (Figures 3
C,G). Grand-average time-frequency spectra of all field potential recordings revealed that oscillatory activity (Figures 3
A,E) was stable throughout all recording sessions. Highest z-scores for power were observed during the delay period in the range of 50–95 Hz.
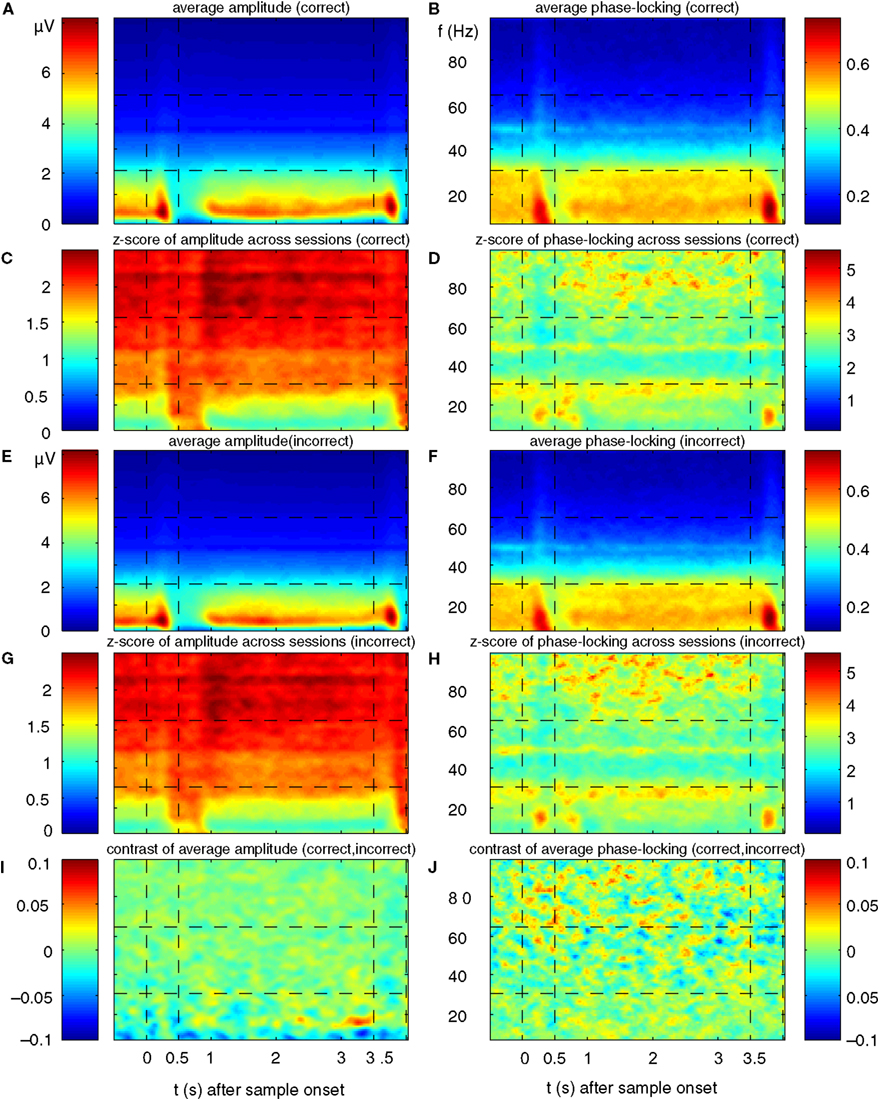
Figure 3. Grand-average power and phase-locking of prefrontal LFPs. (A,E) Grand average power for trials with correct and incorrect responses, respectively of all simultaneously recorded signals from two monkeys recorded in 12 sessions with a total of 4124 trials, from 146 sites and 921 pairs. (C,G) Z-score for grand average power is plotted in relation to variance (SEM) across experiments for trials with correct and incorrect responses, respectively. (B,F) Grand average phase-locking plotted for trials with correct and false responses, respectively. (D,H) Z-score for grand average phase-locking in relation to variance (SEM) across experiments for trials with correct and incorrect responses, respectively. (I,J) Contrast of grand average power [(A − E)/(A + E)] and phase-locking [(B − F)/(B + F)] plotted as TF map. The maximum contrast of c = 0.08 indicates a relative difference between trials with correct and false responses of 0.5%.
Synchronization of oscillations was assessed by means of phase synchronization and by computing phase-locking values (Lachaux et al., 1999
). In the grand-average, the time course of phase-locking resembled that of power across all frequencies (Figures 3
B,F) and the reliability of phase locked oscillations across sessions was larger for higher frequencies (Figures 3
D,H).
In a last step we compared the grand average power and phase locking time-frequency maps across the conditions with correct and incorrect behavioral responses, by computing the difference normalized to the sum [correct-incorrect/(correct + incorrect)] between the maps for correct and incorrect behavioral responses (‘contrast maps’). Contrast maps for power or phase locking revealed no noteworthy differences between correct and incorrect trials (Figures 3
I,J). The maximal observed contrast was smaller than 0.08, reflecting a difference of 0.5% in grand average power or phase locking.
Regarding grand average of power and phase locking, neither the average (Figures 3
A,B,E,F) nor stability measures across sessions (Figures 3
C,D,G,H) describe any difference with respect to behavioral performance. This indicates that the variability across sites/pairs and sessions is too large in comparison to differences which might exist for individual site and pairs in power and phase-locking. This finding is a strong indication that methods based on averaging first and looking for statistical differences between classes later are very likely to fail due to large variability. This motivated us to develop a method searching for differences at individual sites and pairs first, and in a second step, describing the population of analyzed sites/pairs for each time-frequency bin. To assess effects on the level of individual channels for power, or pairs of channels for phase-locking, we used λ-maps as we successfully applied to spike-field-coherence before (Wu et al., 2008
). Using the method of computing λ-maps, we investigated performance effects, by comparing neuronal activity recorded during trials in which the monkey gave a wrong response (‘error trials’) with activity recorded during trials with a correct response (‘correct trials’).
Performance-Related Modulation of LFP Power (P) and Phase Locking (PL)
On average, the monkeys gave correct responses in 80% of the trials, ranging from 71% to 87% across sessions. λc-maps for the entire data set of both monkeys were based on 12 recording sessions, 152 sites and a total of 4124 trials. For each session and time-frequency bin, we computed the percentage of sites (pairs), which exhibited a significant modulation in power (phase-locking). To identify performance-dependent modulations, we computed the percentage of sites with increased power (phase-locking) for correct [λc(P); λc(PL)] and incorrect [λi(P); λi(PL)] responses, assuming that oscillatory events reoccurred with a precision of st = 150 ms and a bandwidth of sf = 5 Hz. Values for both, st and sf, have been carefully selected and fixed before λ-maps were computed, to prevent multiple comparisons (see Materials and Methods for more details). The percentage of sites with significant performance-related modulation of power ranged between 0.3% and 3.7%, while the observed amount of pairs with significant performance-related modulation of PLV ranged between 0.7% and 2.6% (Figures 4
A–F), 1% representing chance level. Memory-related activity during correct behavioral responses is characterized by several prominent modulations in λc-maps for power λc(P) (Figures 4
A,C) and phase-locking λc(PL) (Figures 4
B,D) in both monkeys (Monkey 1: 2402 trials, 7 sessions, 86 sites, 507 pairs; Monkey 2: 1722 trials, 5 sessions, 66 sites, 414 pairs).
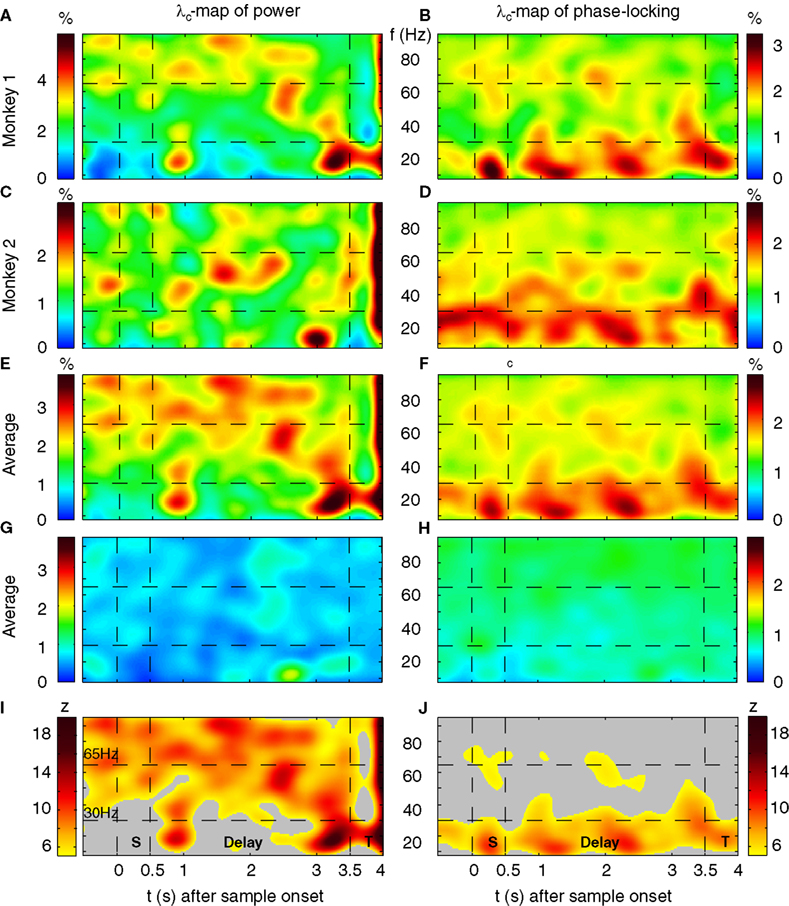
Figure 4. Performance-dependent increases of β- and γ-oscillations and their phase-locking in prefrontal field potentials. (A–F) Time-frequency λc-maps for individual monkeys (A–D) and as average across subjects (E,F) provide the percentage of sites/pairs with significant increases of power/phase-locking in trials with correct responses, based on 12 sessions, 4124 trials, 152 sites and 921 pairs of sites. Abscissa and ordinate represent peri-stimulus time aligned to the onset of sample stimuli and signal frequency, respectively. Color-codes provide the percentage of sites/pairs with significant changes (‘S’, ‘T’: Sample and Test stimulus presentation, ‘Delay’: during delay the information of the sample has to be maintained). The left column provides maps for power and the right column maps for phase-locking. (G,H) shows the same as (E,F), but for scrambled (λchance) trials to destroy any existing performance effect. Hence, λchance-maps show the amount of modulation of λc and of λi for power in (G) and for phase-locking in (H) that can be expected purely by chance. (I,J) The same modulation of λc-maps as shown in (E,F), but expressed as a z-score in relation to the mean and standard deviation of purely random modulation of the λchance-maps shown in (G,H)  . The critical z-score (zcrit = 4.19) for a two sided modulation and a test level 1% has been Bonferroni corrected for 24 non-overlapping sliding windows during pre-sample, sample, delay, and test and 16 non-overlapping frequency bands between 7 and 95 Hz.
. The critical z-score (zcrit = 4.19) for a two sided modulation and a test level 1% has been Bonferroni corrected for 24 non-overlapping sliding windows during pre-sample, sample, delay, and test and 16 non-overlapping frequency bands between 7 and 95 Hz.Statistical Significance of Modulations of λ-Maps
Because the percentage for both, power and PLV was rather small, we set out to assess the statistical significance of the observed modulation in λ-maps. We computed the same maps for permuted sets of trials drawn randomly from all trials with correct and incorrect responses. Hence we assessed the chance level and chance variability of λ-maps across frequency and time, based on pure chance effects (Figures 4
G,H). Both λ-maps for power and phase locking have values very close to the expected value of 1% and are much more extremely homogenous compared to modulations of λ in the original data. We then characterized the strength of modulation in λc and λi statistically, by computing a z-score in relation to chance modulations of λcperm and λiperm for permuted trials (Figures 4
I,J). In contrast to the effect size of a few percent of the modulation of λc and λi, the respective z-sores range up to 18, which show that this modulation is highly significant. Therefore, performance-related modulation of power and phase-locking are rare, but highly significant.
Pre-Stimulus- and Stimulus Response Related Oscillations
Already during the pre-sample period λc was enhanced for high gamma-frequencies (60–70 and 80–95 Hz) and reached values up to 2.7%, yielding a z-score between 5 and 12 (Figures 4
A,C,E,I). This increase of λc persisted for high gamma-frequencies throughout most of the delay until 500 ms before the test stimulus onset. During the period of maintenance, the λc(P)-map exhibits four prominent zones with an increased number of sites expressing enhanced power for correct responses. Two circumscribed zones simultaneously cover beta (14–27 Hz) and low gamma-frequencies (30–45 Hz) in the early delay (0.6–1.2 s). A very similar pattern occurs directly before test stimulus onset (2.8–3.5 s). Note that the monkeys could anticipate the time of test stimulus presentation. Both zones extended over 500–650 ms. The third zone included mid gamma-frequencies (45–70 Hz) during the late delay (2.1–2.7 s) and preceded the second zone. In contrast to the previous three zones, the fourth zone covered the entire first 2.5 s of the delay at frequencies in the high gamma band (65–95 Hz).
Spatial Coordination of Neuronal Oscillations
If oscillatory activity provides a temporal reference (Lisman and Idiart, 1995
; Sommer and Wennekers, 2001
) for distributed processes or drives subsequent circuits (Salinas and Sejnowski, 2001
), it should be synchronized across sites. We studied the precision and spatial extent of synchronization in the neuronal network by assessing phase-locking and its performance-related modulation across all recording sites, given the average electrode distance. This measure describes the stability of phase differences in a given time-frequency bin across trials. For frequencies below 35 Hz, grand-average-phase-locking was particularly strong (>0.5), while for frequencies above 50 Hz, it was rather weak (<0.2) (Figure 4
F).
Performance modulated increases of phase-locking during trials with correct responses occurred in three TF zones with increased λc(PL) (Figure 4
F). First, during sample presentation a transient increase occurred in the beta band, which is remarkable, because the λc(P)-map did not reveal a related change. Second, λc(PL) exhibits a prolonged increase in the beta band with peaks at 900 and 1900 ms after the beginning of the delay, and third, as for power, there is a zone of enhanced phase-locking at beta and low gamma-frequencies (15–50 Hz) that starts before and merges into the test response.
To test whether the observed phase locking values can be considered as significant phase synchronization, we used a Rayleigh test. Based on a 1% criterion and after Bonferroni correction for 450 sliding windows, we found that grand average phase locking values (Figures 4
B,F) for frequencies below 50 Hz indicate significant phase synchronization, while higher frequencies appear to be not-phase synchronized. This in combination with an average short distance of ∼600 µm between electrodes allows for an estimate of the approximate spatial extension of phase synchronization. The phase locking values >0.5 for low frequencies indicates a spatial extension of phase synchronization of larger than ∼600 µm, while high-frequency oscillations are confined to a volume with a radius of smaller than ∼600 µm or smaller than the shortest electrode distance in the electrode array (500 µm). This indicates that neuronal oscillations in the beta and low-gamma band synchronized over a larger spatial extent than the average electrode spacing (∼600 µm), while neuronal oscillations above 50 Hz were much less well synchronized across recording sites. This suggests that faster oscillations are restricted to single or at most a few cortical columns (Pucak et al., 1996
) while slower oscillations involve many columns and probably other cortical areas. This is supported by studies showing that beta- but not gamma-oscillations synchronize across remote cortical areas (Roelfsema et al., 1997
; Brovelli et al., 2004
).
Inter-Monkey Comparison of λ-Maps for Correct Responses (λc-Maps).
Power λc–maps of each of the two monkeys show an increase above chance level by a factor of 3–6 (Figures 4
A,C): first, during early delay (∼0.35 s after sample off) and second, shortly before the onset of the test stimulus at beta- and low gamma-frequencies (10–45 Hz). This means that 3–6 times more sites than expected by chance generated significantly more power for correct responses in the respective time-frequency zones. Both periods lasted for about 1 s. At halftime of the memory delay (∼1.2–2.7 s), both monkeys expressed a 2- to 4-fold increase of λc at low gamma-frequencies (45–70 Hz). Although weaker but much more extended in time, λc was elevated by a factor of 1.5–3 for 2.5 s into the delay at high gamma-frequencies (65–95 Hz).
As described for λc(P)-maps, λc(PL)–maps of each of the two monkeys (Figures 4
B,D) exhibited several common features. First, a 2- to 3-fold increase of pairs with significantly increased phase-locking of beta- and low gamma-frequencies (7–35 Hz) during sample presentation in trials with correct responses. This increase, however, was more tightly locked to the presentation of sample stimuli for one of the monkeys (Figure 4
B). Second, during the delay, λc(PL) was increased during several epochs by a factor of 2–3 in the range of 7–35 Hz (Figures 4
B,D). Third, similar to λc(P), λc(PL) was increased shortly before the onset of the test stimulus, albeit at higher frequencies. Fourth, increases of λc(PL) in the high gamma band throughout the delay were less consistent across subjects and like for power, their dominant frequency was lower in monkey 2. Because λ-maps of the two monkeys shared a substantial number of features, we assume that the underlying processes are tightly coupled to the task and are compatible across subjects.
Stimulus Specific Oscillations
The results described so far do not differentiate among performance- and stimulus-related processes. We therefore assessed differences in power and related these to the presented stimuli (16 or 20 different memoranda). Bootstrapping and permutation tests were used in analogy to an ANOVA  to determine the percentage λs(P) of sites per session and time-frequency bin which exhibited stimulus-selective changes in power. The resulting ‘λs(P)-maps’ are shown in Figure 5
A. Because stimulus-selective activity can only occur after sample stimulus presentation, the power modulations observed in the pre-stimulus period, which only reached chance level, were used as baseline. Stimulus-selective increases in power as revealed by λs(P)-maps were restricted to the delay period (Figure 5
B), although evoked potentials expressed selectivity for the memorized stimuli already at much shorter latencies of 58–153 ms. This suggests that oscillatory activity in PFC, which outlasts the initial encoding, contains stimulus-selective information. To distinguish between performance- and stimulus-related power changes, we compared λc(P) and λs(P)-maps. Because the dynamical range of λc(P) and λs(P)-maps was different, we considered 30% of the respective relative modulations of each map relative to chance level (Figures 5
C,D) as a threshold for the comparison (Figure 5
E), which in case of λs(P)-maps (Figure 5
D) corresponds to an increase of z > 2 with respect to baseline. The low-gamma components (30–45 Hz) of the two transient TF-zones that occurred during early and late delay were modulated both in a performance-related and stimulus-selective way, while the beta components showed only performance-related modulation. The sustained increases in the high-gamma band (65–95 Hz) during the first 2.5 s of the delay were stimulus-selective as well as performance-related.
to determine the percentage λs(P) of sites per session and time-frequency bin which exhibited stimulus-selective changes in power. The resulting ‘λs(P)-maps’ are shown in Figure 5
A. Because stimulus-selective activity can only occur after sample stimulus presentation, the power modulations observed in the pre-stimulus period, which only reached chance level, were used as baseline. Stimulus-selective increases in power as revealed by λs(P)-maps were restricted to the delay period (Figure 5
B), although evoked potentials expressed selectivity for the memorized stimuli already at much shorter latencies of 58–153 ms. This suggests that oscillatory activity in PFC, which outlasts the initial encoding, contains stimulus-selective information. To distinguish between performance- and stimulus-related power changes, we compared λc(P) and λs(P)-maps. Because the dynamical range of λc(P) and λs(P)-maps was different, we considered 30% of the respective relative modulations of each map relative to chance level (Figures 5
C,D) as a threshold for the comparison (Figure 5
E), which in case of λs(P)-maps (Figure 5
D) corresponds to an increase of z > 2 with respect to baseline. The low-gamma components (30–45 Hz) of the two transient TF-zones that occurred during early and late delay were modulated both in a performance-related and stimulus-selective way, while the beta components showed only performance-related modulation. The sustained increases in the high-gamma band (65–95 Hz) during the first 2.5 s of the delay were stimulus-selective as well as performance-related.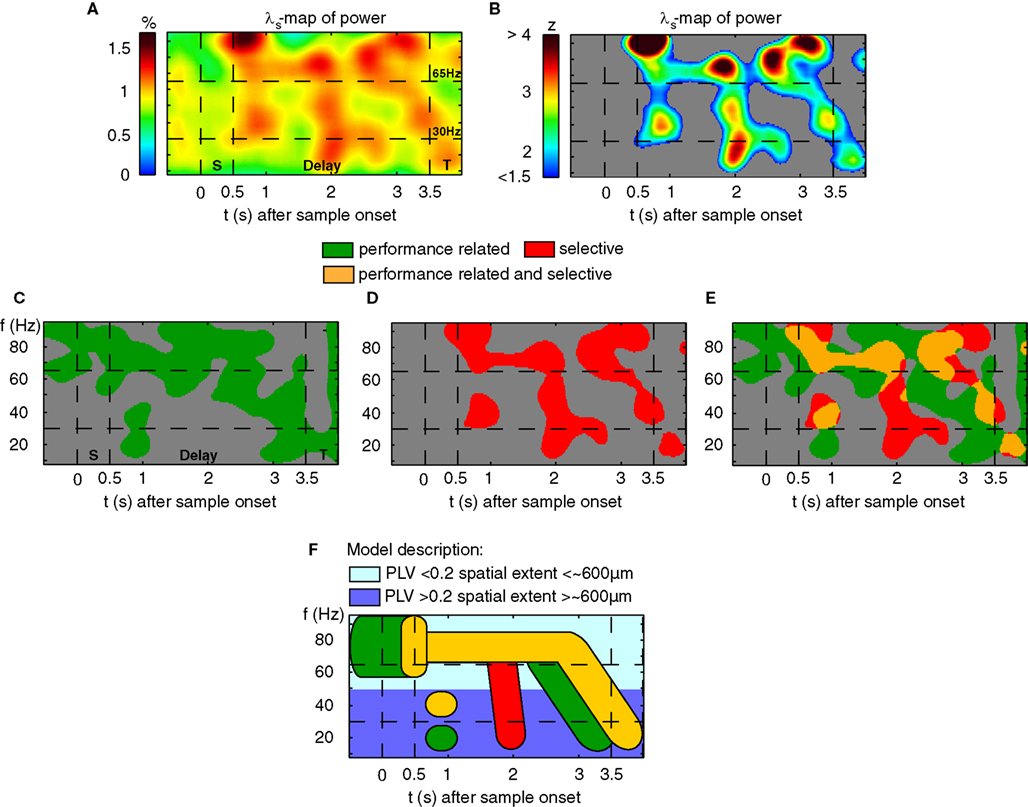
Figure 5. Stimulus-selective and performance-dependent increases of
ß- and γ-oscillations in prefrontal field potentials. (A) Time-frequency λs-map averaged across data from two monkeys (7 Sessions, 4040 Trials, and 94 Sites). Abscissa and ordinate represent peri-stimulus time aligned to the onset of sample stimuli and signal frequency, respectively. Color codes provide the percentage of sites with significant differences in power across different stimuli (‘S’, ‘T’: Sample and Test stimulus presentation). (B) Modulations of the λs(P)-map expressed as z-score in respect to baseline (−0.5–0 s). (C) Performance-related (λc-maps, green) and (D) stimulus-selective (λs-maps, red). The threshold used in (C–E) reflects 30% of the modulation between chance level and maximum λs during delay. (E) Direct comparison of performance-related (green) and stimulus-selective (red) modulation in power. Zones marked in orange represent periods during which significant increases of both performance and stimulus-related oscillations are present in the same frequency range. (F) Model description of time-frequency zones with: (1) performance-related increase in power (green), (2) object-selective power increase (red) and (3) overlapping zones that exhibit both effects (orange). Light blue indicates grand average PL lower than 0.2, reflecting oscillatory processes confined to the average spacing between two electrodes. In contrast, dark blue indicates PL higher than 0.2, which is compatible with spatially more extended processes that span average distances of ∼600 µm.
Do Eye-Movements have an Effect on Induced Power?
We directly tested whether the incidence of saccades in trials with correct and false responses can explain the time course of λc-maps of power and phase-locking. To this end, we computed the difference of saccade probabilities for trials with correct and incorrect responses during each sliding window for both monkeys (Figure 6
A). This analysis provided a time course for each monkey which then had been correlated (Pearson correlation coefficient, test level 1%) to the time course of λc-maps of power and phase-locking for each individual frequency. The Pearson correlation coefficient indicates if dynamical changes of the differences in saccade probability co-varied with the time course of λc-maps for each individual frequency. Positive differences in saccade probability reflect an excess of saccades in trials with correct behavioral responses. A significant positive Pearson coefficient indicates that the difference in saccades and the values of the lambda map are both either strengthened or weakened when memory processing was successful, while, a negative Pearson correlation coefficient indicates that dynamical changes are mirrored which implies that less power was observed for an increasing number of saccades and vice versa.
Both monkeys showed an increased saccade probability during sample stimulus presentation compared to baseline, if they gave a correct response at the end of the trial. This could be explained by more stimulus reaching saccades in correct trials. However, during sample processing no relevant power changes occurred in relation to the behavioral success. During delay, both traces differed significantly from each other. Common for both is the notable decrease of the number of saccades and the performance-related difference in the early delay and directly before test onset, the latter indicating that both monkeys expected the test stimulus. The finding that saccade probability diverged across animals is incompatible with the hypothesis that saccade probability explains changes of LFP power, which were largely consistent across animals. The resulting time courses were then correlated (Pearson correlation coefficient, test level 1%) to the time course of λc-maps of power and phase-locking for each individual frequency (Figures 6
B,C). This analysis revealed that, again mostly inconsistent across monkeys, some frequency ranges like high gamma-frequencies in monkey 1 and lower frequencies between 10 and 40 Hz in both monkeys were significantly correlated with a difference in performance-related to saccade probability (Figure 6
B). In particular for the phase locking, these correlations could have opposite signs in the two animals (Figure 6
C).
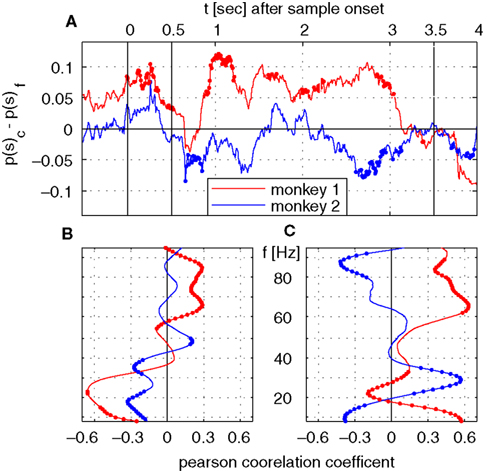
Figure 6. Time course of saccade probability and correlation analysis with time course of λc. (A) Difference in saccade probability in trials with correct and incorrect behavioral responses per sliding window for monkey 1 (red) and 2 (blue). Dotted segments identify periods which are significantly different (1% level) from zero. (B,C) Pearson correlation coefficients for monkey 1 (red) and monkey 2 (blue) for time course of saccade probability difference of saccades per sliding window displayed in (A) and the percentage of sites with increased power (B) or pairs of sites with increased phase-locking (C) for trials with correct behavioral responses.
Among the memory-related signals described above, only the performance- and stimulus-related increase of oscillations in the high gamma band lasted throughout the entire memory delay. Because these high-frequency oscillations exhibited also stimulus selectivity, the sustained modulation of high-frequency gamma oscillations might constitute an important part of the maintenance process. The relatively small number of sites that express performance- and stimulus-dependent oscillatory activity as reflected in the λ-maps may be an indication that the circuits involved in organizing memory processes are highly distributed and thus reflect the under sampling of our recording technology. The low average phase-locking (<0.2) of these high-gamma oscillations (65–95 Hz) implies that the spatial extent of the processes based on high-frequency oscillations was small. However, the information about the memorized stimuli must be distributed across a large number of such locally oscillating networks, because otherwise our arbitrary sampling of a few sites from a small patch of cortex would not have yielded that many sites with memory-related activity. The high phase-locking (>0.5) of beta- and low-gamma oscillations (14–45 Hz) across the extension of the electrode grid, its persistence throughout the entire trial duration and the performance-dependence of this locking suggest that slower oscillations might provide a global temporal reference signal for the coordination of the distributed local processes that contain information about the stimuli.
The approach chosen for this study combines a demanding cognitive memory paradigm in non-human primates with simultaneous recordings from on average 12 sites, by the standards of excellent papers in the field of LFP research (Liu and Newsome, 2006
) a large number of trials (4124), comparable number of sites (152) and powerful statistical assessment using a bootstrapping procedure and permutation tests. Of course, as with every study, there are limits and weaknesses which we want to address directly: (1) This study does not contain an experimental control for free viewing although there is growing evidence that even micro saccades can cause oscillatory responses in widespread brain areas (Yuval-Greenberg et al., 2008
). However, there is also evidence that neuronal coding in frontal cortex is not affected when free viewing and gaze fixation are directly compared for the same neurons (Balan and Ferrera, 2003
). Up until now there has been no published study in which the effect of eye movements on oscillatory activity in prefrontal cortex was determined. In contrast, there have been reports which suggested that the suppression of eye movements induced activity in lateral prefrontal cortex (Kuwajima and Sawaguchi, 2007
). It appears to be extremely unlikely that all of our results on performance and stimulus selectivity of prefrontal oscillations will turn out to be an artifact of eye movements as after all the monkeys performed their memory task very well. We can imagine that part of the performance-related oscillatory activity might be caused by attentional mechanisms which are tightly linked to the control of eye movements. (2) Compared to established methods like variance analyses, our statistical approach has several advantages and disadvantages. The approach is non-parametric and therefore completely model free. Furthermore it accounts for some of the variability in time and frequency. λ-maps provide the incidence of effects across the entire population of recordings. However, as for any time-frequency analysis, one needs to correct for multiple comparisons. Given the strict testing based on bootstrapping and permutation tests we used here, the effective significance threshold is very high thus reducing the number of observations into the range of a few percent. A more sensitive analysis might use either a multi resolution time-frequency estimation based on wavelet transforms or cluster techniques as they are used in EEG research. However, the aim of our approach was to test the effects of behavioral performance or stimulus information with a most robust analysis, the cost being that we compromised test power. (3) A further limitation of our study is that phase locking was only analyzed for pairs of sites, not groups of sites larger than two which could potentially reveal very interesting information about cortical coding mechanisms. However, this is also a complicated issue and is objective of a future study.
The power decrease that occurred across a broad range of frequencies shortly after sample presentation (Figures 3
A,E) appears incompatible with the possibility that these oscillations are directly involved in stimulus encoding. However, comparison between trials with correct and incorrect responses revealed a reliable performance-related power increase at distinct sites. The transient episodes of beta- and low-gamma oscillations which occurred at the beginning and the end of the maintenance interval were performance-dependent, but only the gamma and not the beta-oscillations were stimulus-selective during these epochs. This might suggest that the transient beta/low-gamma oscillations serve the organization of the memory process during transitions from encoding to maintenance and from maintenance to retrieval. Alternatively, these episodes with beta/low-gamma oscillations could directly reflect encoding and retrieval processes. We prefer the first interpretation, because these low-frequency oscillations were not stimulus-selective. A more likely correlate of encoding and retrieval processes is provided by the high-gamma oscillations, because they had shorter latencies and were stimulus-selective. However, the observation that performance-dependent high-gamma oscillations also occurred before the predictable onset of the sample stimuli suggests that oscillations at a particular frequency do not necessarily represent a unique and homogenous phenomenon, but reflect a general property of neuronal circuits which can serve quite different processes. In the case of high-gamma oscillations occurring before the processing of sample stimuli, it is more likely that they represent a process mediating attention or expectancy, while very similar oscillations which occurred during stimulus encoding and memory maintenance probably reflect processes that coordinate neuronal circuits to support information coding. As suggested by strong phase locking of low-frequency oscillations across the whole electrode grid, these oscillations appear to comprise larger networks. Because low-frequency oscillations persisted during maintenance while stimulus-selective oscillations decreased their frequency in mid delay, these slower oscillations could reflect a rehearsal or recruitment process that involves representations in other cortical areas, such as V4, for which locking of spikes to slow oscillations has been shown to occur during maintenance (Lee et al., 2005
).
As summarized schematically in Figure 5
F, performance-related TF-zones overlap with stimulus-selective TF-zones. This could reflect interactions of different sub-processes that need to be coordinated during the memory process. In particular, during early delay, two transient zones around 20 Hz and 40 Hz coincided with a sustained TF-zone around 80 Hz, all reflecting increases of power in correct trials. The 80 Hz increase started earlier and coincided with stimulus encoding. Since power around 60 Hz was not modulated, the interaction of the 20 Hz and 80 Hz processes could be mediated by a 40-Hz process, as a harmonic of the 20 Hz and a sub-harmonic of the 80 Hz process. This suggests that the 40 Hz process could mediate a handshake between a global performance-dependent 20 Hz- and a local stimulus-selective 80 Hz process by means of a 1:2 and 2:1 synchronization. Such synchronization among harmonic frequencies was reported for human MEG (Palva et al., 2005
) and monkey auditory cortex (Lakatos et al., 2005
, for review see Schroeder and Lakatos, 2009
). During the proposed period of handshaking, the bandwidth of the local high-frequency processes is sharpened in relation to the pre-sample and sample periods. Therefore it is conceivable that the power increase of the global and performance-dependent 20 Hz and 40 Hz-oscillations serves to tune and coordinate the local stimulus-selective high-frequency processes. The persistence of the performance-dependent increase in phase-locking of the 20 Hz-oscillations during the entire delay supports the idea that the global 20 Hz-oscillations function as a temporal reference signal for the maintenance of the 1:4 synchronization with the local 80 Hz-oscillations.
In conclusion, the organization of STM seems to involve networks of different sizes within and most probably beyond PFC that oscillate at different frequencies. Small groups of neurons probably comprising a cortical column participate in high-gamma oscillations around 80 Hz and their activity carries partial information about the memorized stimulus, while larger networks in and most likely beyond PFC appear to be coordinated by coherent low-gamma- and beta-oscillations (14–45 Hz) which are correlated with performance but not stimulus content. These global oscillations could coordinate the various stages of the memory process, provide a link to representations in other cortical areas containing more detailed information, and eventually organize executive functions. Global cortical circuits that organize behavior might employ short episodes of beta- and low-gamma oscillations to embed local processes into a distributed maintenance network. Oscillatory brain activity and its synchronization across space and frequencies might serve as a mechanism for the integration of distributed signals over different temporal and spatial scales.
The authors declare that the research was conducted in the absence of any commercial or financial relationships that could be construed as a potential conflict of interest.
We are grateful to Hanka Klon-Lipok, Michaela Klinkmann and Urda Franzius for their enduring effort to train the animals and prepare recording equipment, Thomas Maurer for excellent technical support, and Christiane Kiefert and Clemens Sommer for animal care.