Influence of aggression on information processing in the emotional Stroop task – an event-related potential study
1
Department of Psychology, University of Trier, Trier, Germany
2
Department of Medical Pharmacology, Leiden University, Leiden, Netherlands
Aggression is a common behavior which has frequently been explained as involving changes in higher level information processing patterns. Although researchers have started only recently to investigate information processing in healthy individuals while engaged in aggressive behavior, the impact of aggression on information processing beyond an aggressive encounter remains unclear. In an event-related potential study, we investigated the processing of facial expressions (happy, angry, fearful, and neutral) in an emotional Stroop task after experimentally provoking aggressive behavior in healthy participants. Compared to a non-provoked group, these individuals showed increased early (P2) and late (P3) positive amplitudes for all facial expressions. For the P2 amplitude, the effect of provocation was greatest for threat-related expressions. Beyond this, a bias for emotional expressions, i.e., slower reaction times to all emotional expressions, was found in provoked participants with a high level of trait anger. These results indicate significant effects of aggression on information processing, which last beyond the aggressive encounter even in healthy participants.
Aggression is a common social behavior in both humans and animals. Not surprisingly, aggression and violence are among the leading causes of death worldwide (e.g., more than 1.6 million lives in 2000) and exert enormous economic costs (Krug et al., 2002
). Neuroscientific research has mainly focused on pathologic aggression (e.g., Raine and Venables, 1988
; Raine, 1989
; Blair, 2004
). However, aggression is also common in psychologically and neurologically healthy individuals. Aggression is necessary for human survival as it serves important purposes of allowing an individual to compete effectively for limited resources and to establish and maintain his/her position in society. The omnipresence of aggression and its impact on our everyday lives highlights the importance of finding an explanation of its causes and underlying mechanisms.
Information processing patterns at “higher levels” (e.g., scripts and schemata) have frequently been proposed as a possible explanation for aggressive behavior (e.g., Huesmann, 1988
; Dodge and Crick, 1990
; Bushman and Anderson, 2001
; Anderson and Bushman, 2002
). Even so, researchers have started to investigate the influence of aggression on basic information processing operations in healthy individuals only in the last decade. These studies show alterations in the cortical activity of healthy participants while they were engaged in a reactive aggression paradigm (Krämer et al., 2007
, 2008
; Lotze et al., 2007
). For instance, participants with a high level of trait aggression displayed an enhanced early frontal negative event-related potential (ERP) in trials with high provocation while deciding about punishing an opponent (Krämer et al., 2008
). A similar study with functional magnetic resonance imaging (fMRI) (Krämer et al., 2007
) revealed that, in this decision phase, the activity in the rostral and dorsal parts of the anterior cingulate cortex and the anterior insula was greater in highly provocative than less provocative trials. Activity in these brain areas has been associated with emotional processing and this might reflect heightened emotional involvement of the participants under high provocation. Furthermore, an increase in activity in the medial prefrontal cortex (mPFC) has been reported during retaliation in a similar paradigm (Lotze et al., 2007
). Enhanced activity in the dorsal mPFC might represent a stronger need for conflict management and response selection in the provoking situations. Increased activity in the ventral mPFC might indicate affective processes, such as compassion with the opponent. Hence, these findings show changes in the processing of information during an aggressive encounter in a laboratory setting.
From a therapeutic point of view, it may be even more interesting to investigate why aggressive behavior is often hard to stop and why it is easily transferred from one setting to another. Thus, the aim of the current study is to discover possible alterations in psychophysiological indicators of information processing after an aggressive encounter.
So far, this has only been addressed by a few behavioral studies, which have mainly focused on the influence of trait anger on reaction times for responding to threat-related stimuli. These studies have revealed that trait anger (Eckhardt and Cohen, 1997
; Cohen et al., 1998
; van Honk et al., 2001a
,b
), previous self-reported aggressive experience (Smith and Waterman, 2004
), and criminal convictions for violent offending (Smith and Waterman, 2003
) predict an information processing bias for threat- or aggression-related material in various cognitive tasks. Thus, individuals with a high level of trait anger, who have experienced many incidences of aggression or violence seem to spend more attention on threat- or aggression-related information than less angry, aggressive, or violent individuals. This results in slower reactions to stimuli which are threat-related (emotional Stroop task) or surrounded by threat-related stimuli (visual search task) compared to neutral stimuli. In addition, there is evidence that participants with a high level of trait anger, who are experimentally induced to experience anger, process task irrelevant anger-related material in an emotional Stroop task (Cohen et al., 1998
) and a visual search task (Eckhardt and Cohen, 1997
). Nevertheless, the underlying mechanisms of these changes in information processing associated with anger and/or aggression remain unclear. Research has only investigated differences in behavioral responses (i.e., reaction times) between individuals with high and low levels of trait anger or self-reported aggression. However, impaired reaction times are only an indirect measure of attention towards threat-related material or of an information processing bias.
Recent neuroimaging studies have proposed the involvement of a neural network consisting of the amygdala, the ventral anterior cingulate, and the ventral striatum in the processing of facial signals of aggression (Beaver et al., 2008
; Passamonti et al., 2008
). In particular, the ventral striatum and its associated dopaminergic system seem to play a specific role in the recognition of angry facial expressions. Selectively impaired recognition of angry expressions has been reported in patients with lesions in the ventral striatum (Calder et al., 2004
) as well as after the administration of the dopamine antagonist sulpiride to healthy participants (Lawrence et al., 2002
). Thus, biased responses for angry or threat-related material in participants with high state and/or trait anger or aggression might steam from an increased striatal activity.
In addition to functional neuroimaging, ERP studies might help to shed light at attention-related cortical processes related to anger and aggression. Because of their excellent temporal resolution, ERPs allow a finer, more sensitive and more direct examination of differences in the time course and cortical resources of information processing (Hillyard and Kutas, 1983
). This is especially important, as numerous behavioral studies have reported no differences in the reaction times of healthy participants towards threat-related and neutral stimuli in cognitive tasks like the emotional Stroop task or the visual search task (for a meta-analytic review see Bar-Haim et al., 2007
). However, even in the absence of behavioral effects, significant differences could be found in the ERPs in some of the studies (Weinstein, 1995
; Bernat et al., 2001
; Carretié et al., 2001a
; Bar-Haim et al., 2005
; Thomas et al., 2007
).
For instance, Thomas et al. (2007)
reported greater parietal positivities to threat-related compared to neutral words in an emotional Stroop task with healthy individuals. Although there were no differences in the reaction times, increased P2 (150–210 ms) and P3 (340–600 ms) amplitudes indicate an enhanced processing of threat-related compared to neutral words. Similar ERP responses have been found during the processing of emotional material when pictures of facial expressions were used. These studies also found rapid effects (<250 ms post-stimulus), indicating a very early preferential processing or categorization of emotional – especially threat-related – facial expressions (Eimer and Holmes, 2002
; Ashley et al., 2004
; Bar-Haim et al., 2005
; Williams et al., 2006
; Bediou et al., 2009
), followed by an alteration of later stages of ERP responses (Eimer and Holmes, 2002
; Schupp et al., 2004
; Williams et al., 2006
). Alterations in the P2 and P3 amplitudes are thus sensitive indicators for early and later processing stages of emotional information. However, the levels of trait or state anger or aggression were not measured in these studies.
In summary, research indicates strong influences of anger and/or aggression on information processing. Trait anger and trait aggression are associated with reaction time biases towards threat- and aggression-related stimuli. Furthermore, healthy individuals show altered information processing while involved in aggressive behavior. However, the influence of experimentally induced aggression on information processing beyond an aggressive encounter and its underlying neural mechanisms has not been reported. Therefore, the present paper reports on an ERP study that investigated this research question.
Like previous studies, our present ERP study used the emotional Stroop task (Williams et al., 1996
) to investigate information processing biases. This task requires the participant to identify the color of an emotional word, picture, or facial expression as fast as possible while ignoring its emotional content. An information processing bias (or interference) is inferred when the color naming takes longer with a threat-related stimulus than with a neutral stimulus. This has been frequently reported for clinically and subclinically anxious individuals (e.g., Bar-Haim et al., 2007
), but also for individuals with high levels of trait anger (see above). Before performing an emotional Stroop task with happy, neutral, angry, and fearful facial expressions, the participants took part in a competitive reaction time task. This task was a modified Taylor aggression paradigm (TAP; Taylor, 1967
), which was used to induce aggression in half of our group of healthy participants.
We expected differences in the reaction times of the provoked and non-provoked participants in the emotional Stroop task. In particular, we hypothesized an information processing bias, that is longer reaction times for angry and fearful facial expressions in the provoked participants. Furthermore, we anticipated an increase in both early (P2) and late (P3) positive amplitudes in the provoked participants compared to the non-provoked participants for angry and fearful facial expressions.
Participants
Twenty students of the University of Trier (10 female and 10 male, mean age = 23 years, SE = 0.60, range 20–29 years) took part in the study. Exclusion criteria were left-handedness, color blindness, psychiatric disorders, regular medication (besides contraceptives), or any acute or chronic medical disease. The study was approved by the local ethics committee. Participation was compensated with €30 (approximately US$40). The participants were randomly assigned to either an experimental (provoked participants) or a control (non-provoked participants) group, but sex was balanced across groups (five male and female participants in each group).
Materials
The Taylor aggression paradigm
Aggression was elicited and assessed with a modified version of the TAP (Taylor, 1967
). The TAP has shown good construct, external, discriminant, and convergent validity (Bernstein et al., 1987
; Giancola and Zeichner, 1995
; Giancola and Chermack, 1998
; Anderson et al., 1999
).
The participants were led to believe that they were playing a competitive reaction time game with another participant who they met before the experiment started. The TAP consisted of 30 trials, which were divided into three blocks of 10 trials. The participants’ task was to react as fast as possible to a green square by pressing a key. They were told that whoever reacted slower would receive a blast of aversive noise. Prior to each trial, the participants had to set the volume and the duration of a noise for the opponent on two separate scales each ranging from 0 to 10. Corresponding to the 11 levels, the duration could be varied between 0 (level 0) and 5 s (level 10) in 0.5-s increments. The volume varied between 60 (level 1) and 105 dB (level 10) in 5 dB increments. The level 0 on the volume scale corresponded to 0 dB. After each trial, the participants received feedback about the outcome of the trial, i.e., whether they won or lost, as well as about the opponent’s settings. In fact, there was no opponent and the outcome of the trials was held constant for all participants – each of them won and lost half of the trials. The experimenter also set in advance the “opponent’s” volume and duration settings according to the block and experimental condition of the participant. During the first block, all participants received short and gentle noises when they lost a trial (volume: M = 62.5 dB, range 0–70 dB; duration: M = 0.075 s, range 0–1.5 s). Participants of the non-provoked group received noises of the same volume and duration during the second and third block, as well. Participants of the provoked group were exposed to noises of intermediate volume and duration in the second block (volume: M = 82.5 dB, range 75–90 dB; duration: M = 2.75 s, range 2–3.5 s) and of high volume and duration in the third block (volume: M = 99 dB, range 90–105 dB; duration: M = 4.4 s, range 3.5–5 s) when they lost a trial. The volume and duration settings of the participants were recorded in each trial from 0 to 10. For each participant and each trial, an average of the volume and duration setting was computed, except for those trials in which one of the settings was 0. In that case, the total score was set to 0, since no noise would have been presented to the opponent and this trial would not have constituted an aggressive act. Finally, the 10 trials which belonged to one block of TAP were averaged for each participant. These values were then used as the dependent variable of aggressive behavior in the statistical analysis.
The emotional Stroop task
Stimuli were taken from Ekman and Matsumoto’s Japanese and Caucasian Facial Expressions of Emotion (JACFEE) and Japanese and Caucasian Neutral Faces (JACNeuF) (Matsumoto and Ekman, 1988
). We used pictures of four male and four female faces, displaying happy, angry, fearful, and neutral expressions. Duplications of each picture were colored in transparent red, blue, yellow, and green, resulting in 32 different stimuli. In total, the emotional Stroop task consisted of eight practice trials and 256 experimental trials. Each trial comprised the presentation of a colored facial expression, which was backwardly masked after 26.7 ms (two frames at 75 Hz), since backward masking after 25–30 ms has been reported to produce large effects in regard to anger (e.g., van Honk et al., 2001a
; Putman et al., 2004
). The masks were individually constructed for each facial expression and represented a distorted version of the picture, keeping hue and saturation constant. The mask remained on the screen until the participant responded by orally naming the color of the picture. The participants were instructed to respond as fast as possible, whilst making as few errors as possible. The responses were recorded via microphone, and reaction times (i.e., voice onset times) were measured for each trial. The voice onset times were measured online with a microphone and serial voice response box (both provided by Psychology Software Tools, Inc.). Prior to each facial presentation, a fixation cross appeared at the center of the screen for 1990 ms (the timing of a single trial is displayed in Figure 1
).
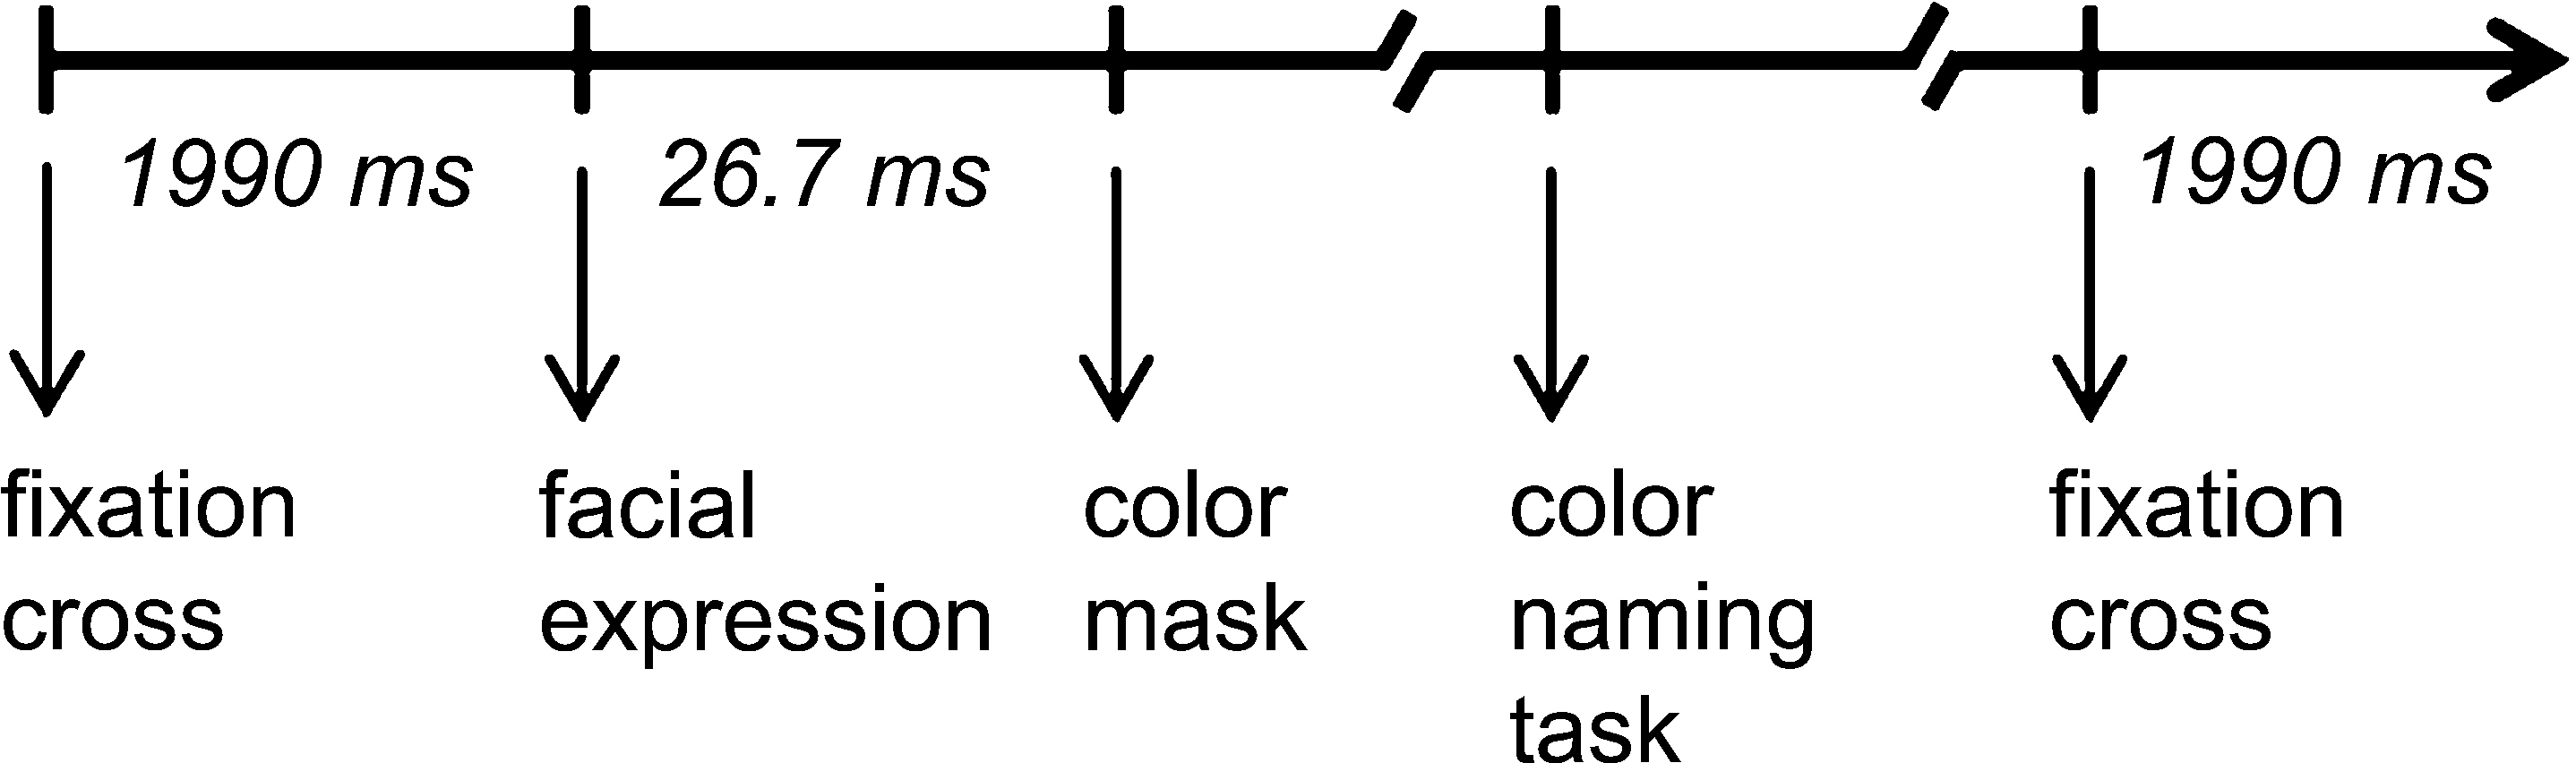
Figure 1. Time line for a single trial of the emotional Stroop task.
All stimuli were presented in the center of the screen on a black background. The image sizes were 5.55″ × 5.20″ and the vertical and horizontal visual angles were 0.28° and 0.26°, respectively. The stimuli were presented in a pseudorandomized fashion, which allowed a presentation of no more than three pictures of the same color or facial expression in a row. The task was divided into two random blocks of 128 pictures by a 2-min break.
Trait measures
Trait anger was measured prior to the experiment with the subscale anger of the Buss and Perry Aggression Questionnaire (BPAQ; Buss and Perry, 1992
; German version: Hewig et al., 2004
). The BPAQ is a 29-item questionnaire, which consists of four subscales: anger, physical aggression, verbal aggression, and hostility. The four subscales have shown high internal and construct validity as well as high test-retest reliability (Buss and Perry, 1992
; Harris, 1997
). All items are scored using a 5-point Likert scale (1 = never or hardly ever applies to me, and 5 = very often applies to me). Two items on the scale are reverse scored. The BPAQ anger subscale is a good predictors for information processing biases in the emotional Stroop task and other cognitive tasks (Smith and Waterman, 2003
, 2005
).
Procedure
All participants were tested individually. We invited them to a preliminary interview, at which we checked for exclusion criteria and informed them about the aim of the study and the experimental procedure. They were told that the study would concern the investigation of the relationship between the steroid hormone cortisol, personality, and the perception of and reaction to visual stimuli. After a description of the experiment, the EEG and salivary cortisol measurement, written informed consent was obtained for all participants. Finally, the participants also received a battery of personality questionnaires to fill out at home as well as home sampling devices for salivary cortisol.
The experimental procedure was kept constant for all participants. On arrival, the participant was acquainted to another participant of the same sex, who was in fact a confederate of the experimenter. The participant and the confederate both handed over the filled out questionnaires and the salivary cortisol samples. The participants were then led to the EEG laboratory, where they were comfortably seated in a dimly lit sound-attenuated room 1 m away from the 19″ computer screen with a computer keyboard on a table in front of them. After the EEG electrodes were applied, the participants were left alone in the room for the remainder of the experiment and received all instructions via the computer screen. All participants first played the TAP, which lasted for about 10 min, and then performed the emotional Stroop task for about 15 min. Before and after the TAP, as well as after the emotional Stroop task, the participants gave salivary cortisol samples, filled in a short mood questionnaire, and relaxed while the baseline resting EEG was measured during a 2-min period. A forth salivary cortisol sample was collected shortly before the participants left the laboratory. The results of these cortisol data are reported elsewhere (Böhnke et al., in review). Finally, the participants were debriefed about the true aim of the study as well as the TAP and the confederate. We thanked and compensated them for their participation.
Stimulus presentation and response logging were controlled using E-Prime software (Version 1.1, Psychology Software Tools, Inc.) and a serial voice response box and microphone. The experiment, including preparation and debriefing had a duration of 90 min.
EEG Recording and Quantification
The EEG was recorded from 32 electrode sites according to the 10-10 electrode reference system (Chatrian et al., 1988
) including the mastoids with the Easy-Cap electrode system (Falk Minow Services). All sites were referenced to vertex (Cz). A bipolar horizontal electrooculogram (EOG) was recorded from the epicanthus of each eye, and a bipolar vertical EOG was recorded from supra- and infra-orbital positions of the left eye. The EEG and the EOG were recorded with Ag/AgCl electrodes. Prior to the electrode placement, the electrode sites on the participant’s scalp and face were cleaned with alcohol and gently abraded. All impedances of the EEG electrodes were below 5 kΩ. EEG and EOG were amplified with a 32-channel SynAmps Model 5083 amplifier (input impedance: 10 MΩ; Neuroscan, Inc.) in AC mode. The pass-band was set to 0.05- to 40-Hz (−12 dB/octave rolloff); the signals were digitalized at 500 Hz and stored to hard disk for later analysis.
The EEG was re-referenced to linked mastoids. Artifacts due to eye movements were corrected via the algorithm developed by Gratton et al. (1983)
. Trials with non-physiological artifacts were excluded from analysis via semiautomatic artifact rejection. EEG and EOG were epoched off-line into 1400-ms periods, starting 200 ms prior to stimulus onset and ending 1200 ms after stimulus onset. A baseline correction was performed using the first 200 ms as a reference. Separate averages were computed for each electrode, individual, and facial expression condition (happy, angry, fearful, and neutral).
Based on visual inspection of grand average ERPs, averaged across all participants and emotional facial expressions and a point-by-point inspection of effect sizes (Strelzyk et al.,in review) performed on all channels and time-frames, the following two stimulus-locked ERP components (peak amplitude relative to baseline) were identified and used for further analysis: P2 (the first major positive wave occurring 160–200 ms post-stimulus) and P3 (300–400 ms). The P2 and P3 waveforms had a centroparietal to parietal maximum. Therefore, we used the following nine central to parietal positions for further analyses: C3, Cz, C4, CP3, CPz, CP4, P3, Pz, and P4.
Statistical Analyses
Aggressive behavior in the TAP
To check whether the induction of aggressive behavior in the provoked group was successful, we performed a 2 × 3 analysis of variance (ANOVA) including the factors provocation (provoked, non-provoked participants; between-subject) and TAP block (block 1, block 2, block 3; repeated measure).
Behavioral data in the emotional Stroop task
Outliers (±2 SD) and trials with incorrect responses were individually rejected for each participant. We calculated the mean reaction time for each of the four emotional facial expression conditions. Bias scores were computed by subtracting the mean reaction time for neutral pictures from each of the three emotional categories (e.g., the individual mean response latencies for angry faces minus the individual mean response latencies for neutral faces) (e.g., van Honk et al., 2001a
; Smith and Waterman, 2003
, 2005
). Note that positive bias scores are referred to as interference and negative scores as facilitation. To examine differences in reaction times towards facial expressions, we submitted the mean correct responses to a 2 × 3-mixed-design ANOVA examining the factors provocation (provoked, non-provoked participants; between-subject) and facial expression conditions (happy, angry, fearful; within-subject).
Electrophysiological data in the emotional Stroop task
For the ERP average amplitudes, we calculated separate 2 × 4 × 3 × 3-mixed-design ANOVAs including the factors provocation (provoked participants, non-provoked participants; between-subject), facial expression conditions (happy, angry, fearful, neutral; repeated measure), caudality (central, centroparietal, parietal; repeated measures), and lateralization (left, middle, right; repeated measures) for each component (P2, P3).
Additional analyses
As trait anger has been previously found to be associated with an information processing bias (i.e., more interference) for threat-related stimuli (e.g., Eckhardt and Cohen, 1997
; van Honk et al., 2001a
; Smith and Waterman, 2003
, 2005
), we recalculated the statistical analyses for the behavioral and the electrophysiological data including the continuous between-subject factor of trait anger. For the behavioral data, we performed a 2 × 3-mixed-design ANOVA including the factors provocation (provoked participants, non-provoked participants; between-subject), facial expression conditions (happy, angry, fearful; repeated measure), and trait anger (continuous between subject). Prior to this analysis, the mean trait anger scores were z-standardized (Aiken and West, 1991
). For the electrophysiological data, separate 2 × 4 × 3 × 3-mixed-design ANOVAs were calculated for the P2 and P3 components including the factors provocation (provoked participants, non-provoked participants; between-subject), facial expression conditions (happy, angry, fearful, neutral; repeated measure), caudality (central, centroparietal, parietal; repeated measure), lateralization (left, middle, right; repeated measure), and trait anger (continuous between subject; again, the z-standardized mean trait anger values were used for this analysis; Aiken and West, 1991
).
For all ANOVAs, the degrees of freedom were Huyn-Feldt corrected if the assumption of sphericity was violated (Huynh and Feldt, 1976
). We calculated Hays’ ω2 (Hays, 1974
) as an effect size measure, with 1% considered a small effect, 5% considered a medium effect, and 14% considered a large effect (Cohen, 1988
). A power analysis performed with GPOWER 2.0 (Buchner et al., 1996
; Erdfelder et al., 1996
) revealed a statistical power of 1 − β ≥ 0.90 for medium sized interaction effects of ω2 = 0.05 for the ERP data. According to Cohen (1962
, 1988
, 1992
), values of 1 − β ≥ 0.80 can be regarded as adequate statistical power for the interpretation of non-significant effects.
In case of significant effects, we used Dunn’s multiple comparison tests as well as Pearson product moment correlations as post hoc tests. All statistical analyses were conducted with SPSS for Windows (Version 14.0, SPSS Inc.).
Aggressive Behavior in the TAP
The experimental manipulation of aggressive behavior was successful. The provoked group showed generally more aggressive behavior (M = 3.3, SE = 0.4) than the non-provoked group (M = 2.1, SE = 0.4), F(1,18) = 4.59, p = 0.046, ω2 = 0.15. Aggressive behavior increased from the first to the third block of the TAP, F(2,36) = 12.92, p = 0.001, ω2 = 0.28. Post hoc tests showed significant differences between block 1 (M = 2.1, SE = 0.3) and block 3 (M = 3.4, SE = 0.4, p < 0.010) as well as between block 2 (M = 2.6, SE = 0.3) and block 3 (M = 3.4, SE = 0.4, p < 0.010) of the TAP. There was also a significant interaction between provocation and TAP block, F(2,36) = 9.03, p = 0.003, ω2 = 0.21. According to the post hoc test, aggressive behavior increased only in the provoked group (p < 0.010), but not in the non-provoked group. Moreover, the mean aggressive behavior of the groups differed in TAP block 2 (p < 0.050) and block 3 (p < 0.010), but not in block 1, where no provocation took place. Means and standard errors of each group and TAP block are presented in Figure 2
.
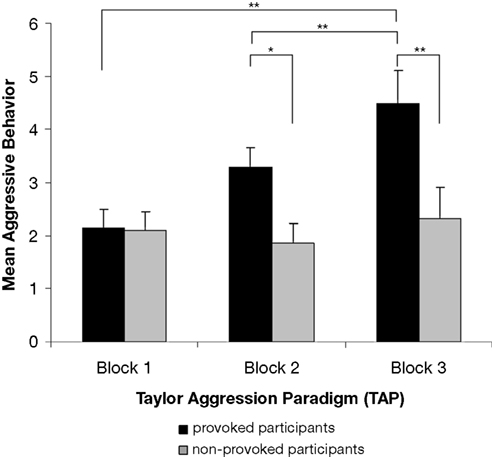
Figure 2. Mean aggressive behavior of the provoked and the non-provoked group in the three blocks of the Taylor aggression paradigm. Note: mean aggressive behavior represents the average of the loudness and duration setting. Each block consists of 10 trials (block 1: trial 1 to 10, block 2: trial 11 to 20, block 3: trial 21 to 30). The error bars represent ±1 standard error.
Behavioral Data in the Emotional Stroop Task
The error rate in this task was 2.19% (M = 5.6, SE = 0.8) and the provoked and non-provoked participants did not differ in their error rates, t < 1.00, p > 0.050. The behavioral performance in the emotional Stroop task of the provoked and non-provoked participants is summarized in Table 1
.
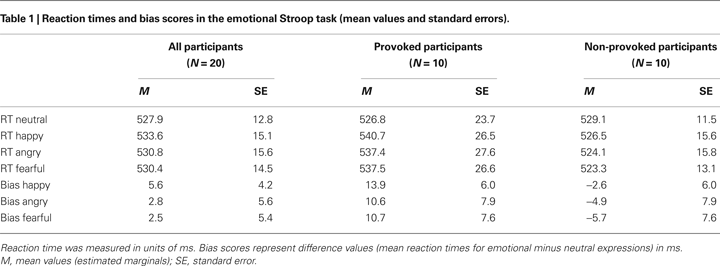
Analysis of the bias scores revealed a marginally significant main effect of provocation, F(1,18) = 3.08, p = 0.096, ω2 = 0.09, with provoked participants showing more interference (M = 11.7, SE = 6.5) for all emotional expressions (i.e., they were slower to name the color of emotional compared to neutral expressions) than the non-provoked participants (M = −4.4, SE = 6.5). Beyond this, no further significant effects were found (all Fs < 1.0, ps > 0.050).
Electrophysiological Data in the Emotional Stroop Task
Figure 3
shows grand average ERP responses to the facial expressions for the provoked and the non-provoked participants, averaged over the four facial expression conditions for all electrode positions. The general morphology of the waveform included a prominent, early negative peak at 135 ms (N1), followed by a positive wave at 180 ms (P2), a second negative wave at 250 ms (N2), and a final positive wave at 350 ms (P3). Descriptively large differences between the provoked and non-provoked participants can be observed in the time window of the P2 (160–220 ms) and P3 (300–400 ms; see Figure 3
).
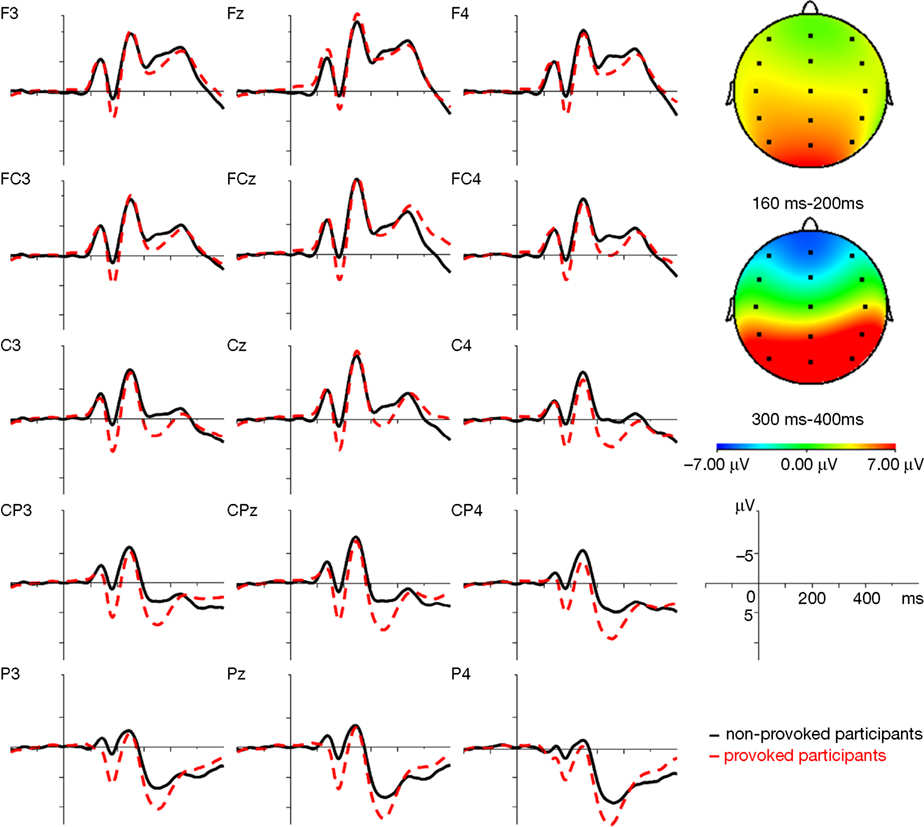
Figure 3. Grand average ERP waveforms for the provoked (--) and the non-provoked (–) group averaged over the four facial expressions (happy, neutral, fearful, and angry) and difference maps averaged over the four facial expressions (happy, neutral, fearful, and angry) for the time domains of the P2 (160–200 ms) and P3 (300–400 ms). Note: in the difference maps, red indicates a greater positivity in the provoked than in the non-provoked group and blue refers to a greater positivity in the non-provoked compared to the provoked group.
P2 (160-200 ms)
The P2 amplitude was greater in the provoked than in the non-provoked group, F(1,18) = 5.77, p = 0.027, ω2 = 0.19. This main effect of provocation was qualified by a significant interaction between provocation, caudality, and lateralization, F(3,72) = 2.93, p = 0.031, ω2 = 0.04. According to the post hoc tests, the group difference was greatest at P3 and Pz (p < 0.010). Moreover, there was a significant interaction between provocation and facial expression, F(3,54) = 3.78, p = 0.016, ω2 = 0.09 (see Figure 4
). The post hoc tests indicated that the difference between the provoked and non-provoked participants was greatest for fearful and angry expressions (both ps < 0.001), although significant group differences were also found for happy and neutral expressions (both ps < 0.010).
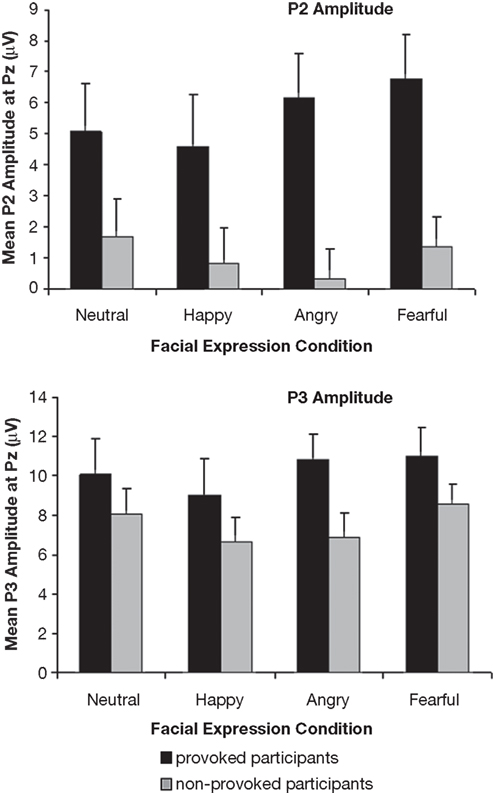
Figure 4. Mean P2 and P3 amplitudes (μV) for the provoked and non-provoked participants at Pz electrode site separately for the neutral, happy, angry, and fearful expressions.
P3 (300-400 ms)
We found a large main effect of provocation, F(1,18) = 4.70, p = 0.004, ω2 = 0.16, with a greater positivity in the provoked compared to the non-provoked participants. In addition, there was a significant interaction between facial expression and lateralization, F(6,108) = 2.82, p = 0.014, ω2 = 0.04. Post hoc tests showed that the P3 amplitude was greater for happy than for neutral expressions at all electrode positions (p < 0.05), and greater for neutral than for angry expressions at right hemispheric electrode positions (C4, CP4, and P4; p < 0.05).
Additional Analyses
As in previous studies a greater information processing bias (i.e., more interference) were found in the emotional Stroop task for individuals with higher levels of trait anger, we recalculated the repeated measure ANOVAs and included the continuous between-subject factor of trait anger.
For the behavioral data, this analysis revealed a significant main effect of provocation, F(1,18) = 7.10, p = 0.017, ω2 = 0.23, a significant main effect of trait anger, F(1,18) = 5.06, p = 0.039, ω2 = 0.17, as well as a significant interaction between provocation and trait anger, F(1,18) = 6.07, p = 0.025, ω2 = 0.20. Again, the provoked participants showed more interference for all emotional expressions than the non-provoked participants. Bivariate correlations revealed a positive association between trait anger and the bias scores for all emotional expressions only in the provoked group, 0.81 ≤ r ≤ 0.86, p ≤ 0.005. Thus, participants with a high level of trait anger who were experimentally provoked showed more interference to all emotional expressions (i.e., they were slower to name the color of emotional compared to neutral expressions) than participants with lower levels of trait anger and non-provoked participants.
For the electrophysiological data, the additional analyses did not reveal any further effects.
Changes in information processing have been discussed in the context of aggression and higher level information-processing patterns (i.e., scripts or schemata), and have frequently been used to explain the occurrence of aggressive behavior (Huesmann, 1988
; Dodge and Crick, 1990
; Anderson and Bushman, 2002
). There are also indications from recent ERP and fMRI studies that, even in healthy individuals, information processing is changed while they are involved in aggressive encounters (Krämer et al., 2007
, 2008
; Lotze et al., 2007
). Moreover, anger, self-reported aggression, and violent convictions have been associated with information processing biases for threat- and aggression-related material in several behavioral studies (Eckhardt and Cohen, 1997
; Cohen et al., 1998
; van Honk et al., 2001a
,b
; Smith and Waterman, 2003
, 2004
). However, the influence of experimentally induced aggression on information processing and its underlying neural mechanisms has not been reported. Thus, in this ERP study, we measured reaction times as well as ERPs during the presentation of facial expressions in an emotional Stroop task (Williams et al., 1996
) after provoking aggressive behavior in half of our healthy participants with the TAP (Taylor, 1967
).
The provocation of aggressive behavior was successful. On average, the participants in the provoked group set significantly louder and longer noises for their opponents when provoked (TAP block 2 and 3) compared to the non-provoked group and compared to TAP block 1, where no provocation took place. This experimental provocation of aggression led to a changed processing of facial expressions in both early and later stages of information processing, and on the behavioral level to more interference for emotional facial expressions.
Electrophysiological Data in the Emotional Stroop Task
One aim of the study was to investigate differences in the ERPs directly after experimentally induced aggression as indicators for the processing of facial expressions in the emotional Stroop task. The principle advantage of ERPs is their excellent temporal resolution, which allows for the direct examination of differences in information processing and its time course (Hillyard and Kutas, 1983
). The ERP results showed large differences between the provoked and non-provoked participants in two positive ERP components: the P2 and P3. This large main effect of provocation indicates that the experimental provocation had an impact on information processing in early as well as later stages of information processing, partly independent of the emotional content of the facial expressions.
First, the provoked participants showed an enhanced P2 amplitude compared to the non-provoked participants at posterior electrode positions. This very early component has been associated with bottom up or low level processing of information, such as stimulus classification and categorization (Crowley and Colrain, 2004
). In this time window, we also found a significant interaction between provocation and facial expression condition, due to a greater positivity for threat-related (angry and fearful) expressions in the provoked participants. Similarly, Carretié et al. (2001b)
reported a greater posterior P2 amplitude for negative compared to neutral and positive emotional pictures. This was interpreted in terms of a greater mobilization of attentional resources. Recently, Thomas et al. (2007)
also found a greater P2 amplitude for threat-related compared to neutral words in an emotional Stroop task.
Schapkin et al. (2000)
understand the underlying processes of enhanced centro-parietal P2 amplitudes for emotional relative to neutral stimuli as an early global affective evaluation, which appears to be critical for further approach or withdrawal behavior. According to studies by Calder and colleagues (Lawrence et al., 2002
; Calder et al., 2004
; Beaver et al., 2008
; Passamonti et al., 2008
), a neural network consisting of amydala, anterior cingulate, and ventral striatum is involved in the processing of facial signals of aggression, i.e., angry facial expressions. One might speculate that the induction of aggression in the present study might have altered early global affective evaluation or categorization processes of all, and particularly threat-related facial expressions, potentially involving an altered striatal activity. However, this can only be resolved with studies using simultaneous measurements of EEG and fMRI, a now evolving technique (see e.g., Debener et al., 2006
).
Second, we found a greater P3 amplitude in the provoked compared to the non-provoked participants. This component, which had a definite parietal localization, was independent of the emotional content of the facial expressions. An enhanced P3 with a centroparietal distribution has been previously found for less frequent, more salient and meaningful stimuli (Naumann et al., 1992b
; Picton, 1992
; Johnson, 1993
). Unlike preceding ERP studies, we did not find a greater P3 amplitude for threat-related (Thomas et al., 2007
) or emotional (Naumann et al., 1992a
; Carretié et al., 2001a
; Herbert et al., 2006
) compared to neutral stimuli. Contrary to Thomas et al. (2007)
, we found significantly greater P3 amplitudes for neutral than for angry expressions, at least at right hemispheric electrode sites. However, Thomas et al. (2007)
reported that P3 amplitude differences between threat and neutral words were considerably smaller when word meaning was not relevant for the task performance. It should be noted that there are several differences concerning the experimental design and material between the study of Thomas et al. (2007) and the present study (i.e., the use of angry and neutral words versus happy, angry, fearful, and neutral facial expression as well as a stimulus presentation time of 200 versus 26.7 ms). In particular, the different presentation times might at least partly account for the dissimilar results (see e.g., Kiss and Eimer, 2008
). Moreover, none of those earlier studies included an experimental induction of aggression prior to the processing of emotional and neutral stimuli.
Recently, the P3 has been discussed with regard to the locus coeruleus norepinephrine (LC-NE) system (Nieuwenhuis et al., 2005
). According to this theory, motivationally significant stimuli elicit a greater P3 amplitude due to a norepinephrine induced phasic enhancement of neural responsivity in the neocortex (especially the temporal-parietal junction). This enhancement is triggered by the outcome of task-relevant decision processes (e.g., stimulus categorization). It is supposed to optimize information processing by modulating post-decision response processes. According to Nieuwenhuis et al. (2005)
, the LC-NE system might be a generator of the P3.
When provoked, all facial expressions are motivationally significant, because they might contain important and life-saving information about the opponent. Thus, provocation affects the processing of facial expressions at different levels. First, it alters early global affective evaluation processes. At this early stage of information processing, all facial expressions and particularly threat-related expressions are classified as motivationally significant (indicated by increased P2 amplitudes). Following this, an enhancement in the phasic LC-NE activity to all (motivationally significant) facial expressions results in an enhanced neural responsivity in the neocortex (indicated by increased P3 amplitudes). As mentioned above, such an interpretation has to be validated by joined fMRI and EEG measurements.
Behavioral Data in the Emotional Stroop Task
Beyond the large group differences between provoked and non-provoked participants in the positive components of the ERPs, we also found behavioral effects related to the experimental induction of aggression. The provoked participants displayed more interference for all emotional (happy, angry, and fearful) facial expressions (i.e., they were slower to name the color of emotional compared to neutral facial expressions) than the non-provoked participants. This was especially the case when trait anger was included as a continuous between-subject factor. This additional analysis revealed positive correlations between trait anger and the bias scores for all emotional expressions within the provoked group, indicating slower reaction times in participants with high levels of trait anger after provocation.
This is partly in line with the results of previous behavioral studies, which found an information processing bias for threat-related material associated with anger and aggression (e.g., Eckhardt and Cohen, 1997
; Cohen et al., 1998
; van Honk et al., 2001a
,b
; Smith and Waterman, 2003
, 2004
). However, the induction of aggression in the present study resulted in a rather broad, less specific change of information processing and a processing bias (i.e., more interference) for all emotional facial expressions. In contrast, the information processing bias of participants with high levels of trait anger, self-reported experiences of aggression, or violent incidences, which has been reported by other studies, was specific for threat- or aggression-related material. So far, it remains unclear why induced aggression should lead to a broader change in information processing. One could speculate that all emotional facial expressions gain relevance after being involved in an aggressive encounter. Facial expressions inform us more rapidly than language about the state of mind of other individuals and are, thus, biologically and socially salient stimuli in human nonverbal communication (Le Doux, 1998
). Even a laughing face might be provoking in such a situation, as this person might be laughing at you. Moreover, the immediate and reliable awareness about potential friends and enemies might be more important and even lifesaving in the context of an acute aggressive encounter. This is supported by the ERP data of the present study. An increase in the P2 and P3 amplitudes in the provoked participants indicate a greater relevance and salience of all facial stimuli after an aggressive encounter independent of the individual’s level of trait anger. In other words, the induction of aggression seems to produce a general gating effect of the neural response at the level of both early and later ERP components. Only in participants with high levels of trait anger, the provocation also resulted in behavioral differences, i.e., more interference for emotional expressions.
Limitations
Before strong conclusions can be drawn, two limitations of the present study should be noted. First, we did not include a control condition with non-facial stimuli in the present study. Hence, it remains unclear whether the changes in information processing due to aggression are specific for facial expressions or are more general, going beyond (or not depending upon) facial expressions.
Second, like previous studies using the emotional Stroop task (e.g., van Honk et al., 2001a
,b
; Smith and Waterman, 2003
, 2004
, 2005
; Putman et al., 2004
), we requested the participants to orally name the color of the presented stimuli. This might have introduced artifacts in the EEG. However, it should be noted, that the mean response latencies (around 530 ms) did not overlap with the time domains of investigated components (160–200 ms and 300–400 ms).
Third, we only found a marginally significant and emotion-unspecific effect of aggression in the behavioral data. Greater behavioral effects were found, when trait anger was included as a continuous between-subject factor. However, the study was not designed to investigate interaction effects of trait anger. As the statistical power for the behavioral data is not adequate to interpret non-significant effects, these behavioral results need to be replicated in a larger sample. Nevertheless, for the statistical analyses of the ERP data the statistical power was sufficient to interpret non-significant interaction effects (see Materials and Methods). To overcome these limitations, a second study with more participants, which also includes a non-facial control condition, is in preparation.
In summary, this study showed that experimentally induced aggression has a strong impact on early as well as later stages of information processing. The ERPs revealed large differences between provoked and non-provoked participants during the processing of facial expressions in an emotional Stroop task, largely independent of the emotional content of the facial expressions and the individual level of trait anger. Moreover, aggression led to slower reaction times and therefore an information processing bias for emotional facial expressions, especially in participants with a high level of trait anger. Together with the findings from previous studies, our results demonstrate pronounced effects of aggression on information processing during and after an aggressive encounter. It is intriguing that even a mild provocation in a laboratory setting affects several stages of information processing and results in behavioral differences even up to 15 min after the aggressive encounter took place. This suggests profound effects from real-life conflicts and aggressive encounters on information processing and consequent behavior.
The authors declare that the research was conducted in the absence of any commercial or financial relationships that could be construed as a potential conflict of interest.
The authors are grateful to Renate Freudenreich, Helmut Peifer, Johann Kim, and Patrick Britz for their help with data acquisition and programming as well as their technical support. We also thank Terry Blumenthal, Florian Strelzyk, and Stefan Telega for helpful comments on an earlier version of this manuscript. The authors are members of the International Research Training Group “Psychoneuroendocrinology of Stress: From Molecules and Genes to Affect and Cognition” funded by the German Research Foundation (Deutsche Forschungsgemeinschaft: DFG), grant GRK 1389/1.
Naumann, E., Huber, C., Maier, S., Plihal, W., Wustmans, A., Diedrich, O., and Bartussek, D. (1992b). The scalp topography of P300 in the visual and auditory modalities: a comparison of three normalization methods and the control of statistical type II error. Electroencephalogr. Clin. Neurophysiol. 83, 254–264.