Oscillatory brain activity related to control mechanisms during laboratory-induced reactive aggression
1
Department of Neuropsychology, Otto-von-Guericke-University, Magdeburg, Germany
2
Helen Wills Neuroscience Institute, University of California, Berkeley, CA, USA
3
Leibniz Institute for Neurobiology, Magdeburg, Germany
4
Center for Behavioral Brain Sciences, Magdeburg, Germany
Aggressive behavior is a common reaction in humans after an interpersonal provocation, but little is known about the underlying brain mechanisms. The present study analyzed oscillatory brain activity while participants were involved in an aggressive interaction to examine the neural processes subserving the associated decision and evaluation processes. Participants were selected from a larger sample because of their high scores in trait aggressiveness. We used a competitive reaction time task that induces aggressive behavior through provocation. Each trial is separated in a decision phase, during which the punishment for the opponent is set, and an outcome phase, during which the actual punishment is applied or received. We observed provocation-related differences during the decision phase in the theta band which differed depending on participants’ aggressive behavior: high provocation was associated with an increased frontal theta response in participants refraining from retaliation, but with reduced theta power in those who got back to the opponent. Moreover, more aggressive decisions after being punished were associated with a decrease of frontal theta power. Non-aggressive and aggressive participants differed also in their outcome-related response: being punished led to an increased frontal theta power compared to win trials in the latter only, pointing to differences in evaluation processes associated with their different behavioral reactions. The data thus support previous evidence for a role of prefrontal areas in the control of reactive aggression and extend behavioral studies on associations between aggression or violence and impaired prefrontal functions.
Aggressive behavior is common in both humans and animals and often serves important purposes in securing power and resources. It can be defined as “any behavior directed toward the goal of harming or injuring another living being that is motivated to avoid such treatment” (Baron, 1977
). Although research on the neural underpinnings of social behavior has seen increasing interest during the last years, studies on neural correlates of aggression in healthy, neurological normal people remain sparse. Gaining insight into neural mechanisms of aggression and its regulation in healthy people is important, however, to reveal what is specific to and possibly causing pathological aggression or violence. The present study sought to identify neural processes related to the decision and evaluation processes during an aggressive interaction by means of electroencephalography (EEG) and event-related changes in the time–frequency domain.
Social psychological research and theoretical work on aggression have pointed out the importance of cognitive resources in the control of aggressive behavior, which may determine whether certain situational variables (e.g., provocation) lead to retaliation or not (see for review Anderson and Bushman, 2002
). Similarly, studies with neurological and psychiatric patients have stressed the role of prefrontal areas in the regulation of aggressive and impulsive behavior (Raine, 1993
; Anderson et al., 1999b
; Raine et al., 2000
; Blair, 2004
). Moreover, neuropsychological research has provided evidence for the role of executive functions, i.e. “higher” cognitive functions traditionally ascribed to the prefrontal cortex, in the control of aggression (Morgan and Lilienfeld, 2000
; Hoaken et al., 2003
; Giancola, 2004
; Blair et al., 2006
). We were thus especially interested in electrophysiological correlates of prefrontal control in the course of an aggressive encounter.
A reliable method to induce aggressive behavior in a laboratory setting is the Taylor Aggression Paradigm (TAP; Taylor, 1967
), which is disguised as a reaction time competition and seeks to elicit aggression through provocation. Participants are instructed that they will be playing successive competitive reaction time trials against opponents sitting in an adjoining room. Whoever wins the trial is entitled to punish the loser with an electric shock. Aggressive behavior is quantified as the intensity of the punishment set for the opponents. The paradigm is well established in social psychological research and there is good evidence for its convergent and discriminant validity (Bernstein et al., 1987
; Giancola and Zeichner, 1995
; Anderson et al., 1999a
). As each trial comprises a decision phase during which participants select the prospective punishment for the opponent and an outcome phase during which the actual punishment is applied or received, the paradigm has been proven useful in delineating the neural correlates of the different decision and evaluation processes during an aggressive encounter (Krämer et al., 2007
, 2008
; Lotze et al., 2007
).
Previous studies using the TAP in combination with functional magnetic resonance imaging (fMRI) could specify the contribution of frontal and subcortical structures to reactive aggression. Presenting one opponent who turned from nice to unfair, Lotze et al. (2007)
could dissociate different roles of the ventral and dorsal prefrontal cortex, with the former thought to be related to affective processes such as compassion and the latter supporting cognitive processes engaged by the social interaction. By introducing two opponents – one highly and one less provoking – Krämer et al. (2007)
could disentangle general social interaction processes and cognitive and motivational mechanisms specific to reactive aggression, reflected in activations in the dorsal and rostral parts of the cingulate gyrus and the striatum.
Most importantly for the present study, a recent EEG-study could demonstrate personality dependent modulations of aggression-related event-related potentials (ERPs) during both the decision and outcome phase in the TAP (Krämer et al., 2008
): an enhanced frontolateral negativity was observed during the decision phase in high provocation trials that was positively correlated to participants’ ability to refrain from aggressive retaliation. This was found for high trait aggressive participants only, pointing to a higher need for prefrontal control in these persons. In the outcome phase, a mediofrontal negativity was detected in loss compared to win trials, which was more prominent in participants reacting aggressively to the provocation. This mediofrontal negativity resembled ERP results in previous studies as response to negative feedback and was thus interpreted as a correlate of the evaluation of the punishment’s negative valence. Furthermore, as ERPs of participants refraining from aggressive retaliation did not differ between winning and losing, this was taken as evidence for their empathic response to the punishment of the opponent.
The present study aimed at strengthening these findings by conducting a further EEG-study with high trait aggressive participants who performed in the TAP. Extending the previous EEG-study (Krämer et al., 2008
), we focused on event-related oscillatory changes during both the decision and outcome phase. Oscillations are believed to be a key mechanism for the communication between brain regions (Fries, 2005
). Moreover, in contrast to ERPs, single-trial wavelet-based time–frequency analysis enables us to study also electrophysiological activity that is non-phase-locked which is of interest especially regarding higher frequency bands (Tallon-Baudry et al., 1997
).
Higher prefrontal activity related to action control or cognitive effort as in interference resolution, inhibition, error-related processing or working memory has repeatedly been shown to modulate oscillations in the theta band (4–7 Hz) (Onton et al., 2005
; Kirmizi-Alsan et al., 2006
; Yeung et al., 2007
; Hanslmayr et al., 2008
; Cavanagh et al., 2009
). Based on the results of the previous ERP study (Krämer et al., 2008
), we therefore expected provocation effects during the decision phase especially on the theta band. Moreover, these effects should covary with participants’ aggressive behavior, reflecting the role of prefrontal control in the regulation of aggression. Regarding the outcome phase, we expected an increase in the theta band after negative feedback, replicating previous findings of feedback-related changes in the time–frequency domain (Luu et al., 2003
; Gehring and Willoughby, 2004
; Marco-Pallares et al., 2007
). This effect again should be dependent on participants’ aggressive behavior matching our previous ERP findings. Importantly, recent studies using a gambling paradigm could dissociate negative feedback eliciting a theta increase and positive feedback associated with an increase in the beta range, which was non-phase-locked and thus not detectable in ERPs (Cohen et al., 2007
; Marco-Pallares et al., 2007
, 2009
). The beta response was interpreted as reflecting the functional coupling in cortico-subcortical networks involved in reward processing. We therefore expected feedback-related effects in the beta range with a stronger increase in win compared to loss trials.
All procedures were cleared by the ethical review board of the University of Magdeburg. The study was conducted in compliance with the Declaration of Helsinki.
Participants
Note that none of the participants had taken part in the previous EEG-study (Krämer et al., 2008
). Participants were selected from two larger groups of students on the basis of their scores on an aggression questionnaire (see below). The first sample comprised 231 economy students (129 women; mean age 22.6, SD 1.9) and the second sample consisted of 520 students from engineering, economics, medicine and humanities (286 women; mean age 22.9 years). From these groups, we selected participants with high values in the aggressiveness score (see below for further explanation). As in our previous EEG study, we did not include psychology students as they are familiar with experiments and thus more likely to be suspicious regarding the experiment’s motivation.
Thirty-two students (17 women, mean age 24.7) participated in the EEG-study after giving informed consent. All were free of neurological or psychiatric disorders and had normal or corrected to normal vision. Four participants were excluded from further analyses because they were deemed not to have been completely deceived (n = 2) or because of excessive eye artefacts. Thus, 28 participants (15 women; mean age = 24.7 years) were included in the analyses. All participants gave written informed consent and received money for taking part (€7/h).
Questionnaire
Participants were selected based on their trait aggressiveness assessed with a German inventory for the assessment of factors of aggression (FAF, Fragebogen zur Erfassung von Aggressivitätsfaktoren) (Hampel and Selg, 1975
). With this questionnaire five sub-scales (spontaneous aggression, reactive aggression, impulsiveness, autoaggression, aggression inhibition) and a control scale (openness) can be obtained. Spontaneous aggression (19 items) refers to unrestrained verbal or physical aggression. A typical item is “I sometimes like to tantalize others.” Items of the reactive aggression scale (13 items) ask for aggressive reactions to some kind of provocation or unfairness, such as “If someone provokes me, I want to punish him badly.” Items of the impulsivity scale (13 items) deal with the affective component of aggression, as “I flare up quickly, but get over it quickly.” The sum of the scales “spontaneous aggression,” “reactive aggression” and “impulsiveness” gives a reliable measure for outwardly directed aggression (maximal value 45; internal consistency Cronbach’s alpha = 0.85) and was thus used for selection of high trait aggressive participants. The sum score has been proven to be significantly different between both adolescent and adult violent criminals on the one hand and non-violent controls on the other hand (Hampel and Selg, 1975
), providing evidence for its external validity. The mean score of a student sample reported by the authors was 13.4 for men (±7.5 SD; n = 72) and 12.3 for women (±6.7 SD; n = 69).
Task and Procedure
Aggression was elicited and assessed using a modified version of the TAP (Taylor, 1967
). Participants were instructed that they were playing successive competitive reaction time trials against one of two opponents in alternating trials. The opponents (one man, one woman), confederates of the experimenters, met the participant prior to the experiment to jointly listen to the instructions: they were told that whoever lost would be punished by the opponent with a mildly painful electric shock. The severity of the punishment, that is the intensity of the shock, had to be selected for each trial on a range from 1 to 8. In fact, selections of the putative opponents and outcome of the trials (50% winning and losing trials for each opponent) were under control of the experimenter. The order of high and low provocation trials as well gains and losses was randomized. For technical reasons, we used the same order in all participants. The experiment comprised seven blocks of 40 trials each, yielding a total of 280 trials. Participants were told that the opponents would play in alternating trials and rest during the others. We always introduced one man and one woman as opponents, as the sex of the target is known to affect the level of aggressiveness (Taylor and Epstein, 1967
). As the respective target’s sex was not revealed during the experiment, this effect could not influence the behavior, however. At the end of the experiment participants were completely debriefed about the deception and the experiment’s motivation.
At the beginning of each trial, participants were informed against whom they were playing the up-coming trial (opponent A or B) and asked to consider the punishment for the respective opponent (in the following referred to as decision phase; duration of 1.5 s). A prompt to press the respective keyboard button followed. After the reaction time task proper (a visual cue, which prompted the players to press a button as fast as possible), the selection of the opponent was presented: opponent A mainly selected low punishments (level 1-4 with a mean of 2.3), whereas opponent B selected mainly high punishments (level 4-8 with a mean of 6.55), yielding conditions of low and high provocation, respectively. Finally, feedback was given whether the participant had won or lost (in the following referred to as outcome phase, duration of 1000 ms). After the feedback, a red flash was shown indicating on win trials the punishment of the opponent and on loss trials the punishment of the participant, i.e. the electric stimulation (following 100 ms after the red flash). Intertrial interval was 2 s. Participants were given a longer break after each block. For the timing of each trial see also Figure 1
. Note that there are two important changes with respect to the previous EEG study with the TAP (Krämer et al., 2008
): Provocation was not manipulated blockwise but on a trial-by-trial basis, similar to the fMRI-study with the TAP (Krämer et al., 2007
). Also, electric shocks were used as punishment in contrast to aversive noises. The experiment including preparation and debriefing had a duration of about 2.5 h.
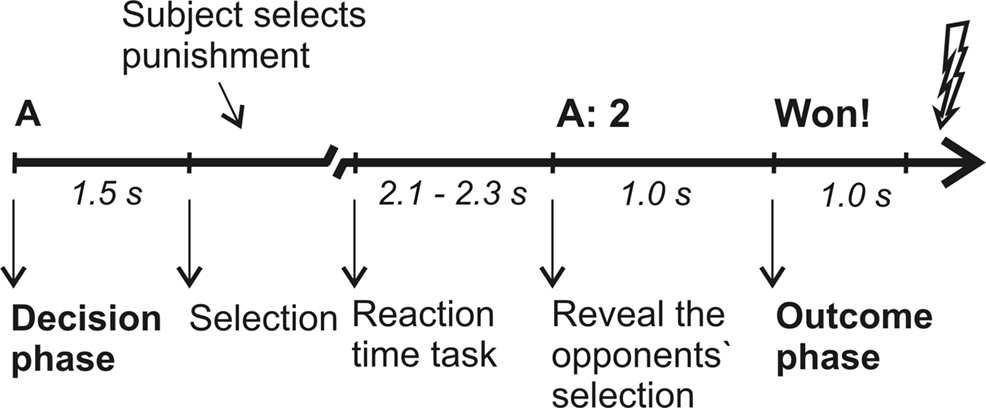
Figure 1. Time line for a single trial. A trial of low provocation, in which opponent A selects 2, is shown as example. The duration of the selection phase depended on the participants’ reaction time to make the selection. Intertrial interval were 2 s.
Electrical stimuli consisted of constant current pulses (duration 1 ms) applied transcutaneously to the left index finger by a constant current stimulator (DS7A, Digitimer, UK). Ring electrodes were attached to the distal (anode) and middle (cathode) phalanges of the index finger. Stimulus intensities were adapted to the participants’ individual pain threshold. The mean intensity of the highest punishment was 9.1 mA (SD = 3.7). The intensities of the lower punishments were set by reducing the maximal value in steps of 10%. Stimulus presentation and behavioral data acquisition were controlled with Presentation software
1
.
EEG Recordings
The electroencephalogram was recorded from 27 tin electrodes mounted in an elastic cap (Easycap−; positions: Fp1/2, F3/4, C3/4, P3/4, O1/2, F7/8, T7/8, CP1/2, PO3/4, FC1/2, FC5/6, CP5/6, Fz, Cz, Pz) with reference electrodes placed on the right and left mastoid. Electrode positions were according to the extended 10–20 system (Nuwer et al., 1998
). The electrodes were prepared with abrasive paste (Nuprep; D.O. Weaver & Co., Aurora, CO, USA) and filled with electrode jelly (Electro-Cap International, Inc., Eaton, OH, USA). A QuickAmp amplifier (Brain Products GmbH, Munich, Germany) was used for recordings. During recording, all scalp electrodes were referenced against common average reference and offline re-referenced against the algebraic mean of the activity at the two mastoid electrodes. Electrode impedances were kept below 5 kΩ. To monitor horizontal eye movements, electrodes were placed on the outer canthus of the right and left eye. Vertical eye movements and blinks were monitored by electrodes placed below and above the right eye. EEG and EOG were recorded continuously with a bandpass of 0.01–70 Hz and digitized with a sampling rate of 250 Hz.
Data Analysis
To study the stimulus-related oscillatory activity during the decision and outcome phase, 3 s epochs were generated (1500 ms before and after the stimulus). Vertical and horizontal ocular artefacts were corrected by visually identifying and removing the respective components after running an extended infomax ICA (Bell and Sejnowski, 1995
; Lee et al., 1999
) on the decision and outcome phase epochs. The ICA was performed using EEGLAB v6.02b (Delorme and Makeig, 2004
). In addition, trials with extensive amplitude differences (>180 μV) were excluded from further analyses. Single trial data were then convolved with a complex Morlet wavelet:
with the relation f0/σf [where σf = 1/(2πσt)] set to 6.7 (Tallon-Baudry et al., 1997
). For both the decision and the outcome phase in each trial, we computed and averaged for each subject changes in time varying energy (square of the convolution between wavelet and signal) in the studied frequencies (from 1 to 30 Hz; linear increase) with respect to baseline (100 ms before the stimulus). Epochs in which participants pressed a button during the decision phase were excluded from the analyses. Mean increase/decrease in power during the decision and feedback were obtained and entered into a repeated measures ANOVA. Based on preliminary wavelet analyses in our previous EEG-study (Krämer et al., 2008
) and on visual inspection of the present data, we focused for the theta band on the time-range between 200 and 400 ms and for the beta band on the time-range between 400 and 600 ms.
As outlined in the introduction, we expected differences in the neurophysiological effects depending on the participants’ aggressive behavior in the paradigm. More specifically, we were interested in differences between participants responding aggressively to the provocation and those that did not and hence compared in the further analyses people with high experimentally (HE) and low experimentally (LE) induced aggression. To this end, we divided our sample based on participants’ average punishment selection under high provocation (see below for further explanation). To reduce the complexity of the statistical analysis and the number of statistical tests, we performed statistical tests for three pairs of lateral electrodes. This allowed us to assess hemispheric differences and topographical differences in the anterior posterior direction. We use the data from the entire set of 27 electrodes to illustrate topographies of the studied effects. Visual inspection of the data indicated that this procedure captured differences between conditions and groups adequately. For the decision phase, we computed an ANOVA with the within-subject factors Provocation (high vs. low) and electrode location (Anterior–Posterior: F3/4, C3/4 and P3/4; Hemisphere: right vs. left) and the between-subject factor Group (HE vs. LE). For the outcome phase, the ANOVA comprised the within-subject factors Provocation (high vs. low), Feedback (won vs. lost) and electrode location (same as before) and the between-subject factor Group (HE vs. LE). For all statistical effects involving more than 1 df in the numerator, the Huynh and Feldt correction was applied to correct for possible violations of the sphericity assumption (Huynh and Feldt, 1976
). The uncorrected degrees of freedom and the corrected p-values are reported. Results of post hoc t-tests are reported with two-tailed level of significance and as well as ANOVAs with an alpha-level of 0.05 (p-values between 0.05 and 0.1 are reported as marginally significant).
Questionnaire Data
The mean FAF score was 13.19 (±6.57) in the first and 10.4 (±6.6) in the second sample. The score was higher for men (first 14.3 ± 7.23, second 12.0 ± 7.3) than for women (first 12.3 ± 5.88, second 8.9 ± 5.4; first t229 = 2.32, p = 0.021, second t518 = 5.42, p < 0.001). From these samples, 32 participants were selected whose FAF scores ranged in the upper half of the distribution. As specified above, four participants were excluded because of artefacts or unsuccessful deception. The remaining 28 participants had FAF scores between 13 and 36 with a mean of 17.8. No significant sex differences were observed in the smaller sample (men 19.4 ± 6.7, women 16.4 ± 2.1; t26 = 1.55, p = 0.14).
Behavioral Data
Participants selected higher punishments for the highly provoking opponent (mean 5.25 ± 1.16 SD) compared to the non-provocative opponent (2.86 ± 1.16; t27 = 6.9, p < 0.001; Figure 2
). The average time to make the selection under high provocation was 1080 ms (±482 SD), which did not differ from the time taken to select the punishment under low provocation (1078 ± 454 ms; t27 = −0.053, p = 0.96). Participants’ mean reaction time to the target was 202 ms (±39).
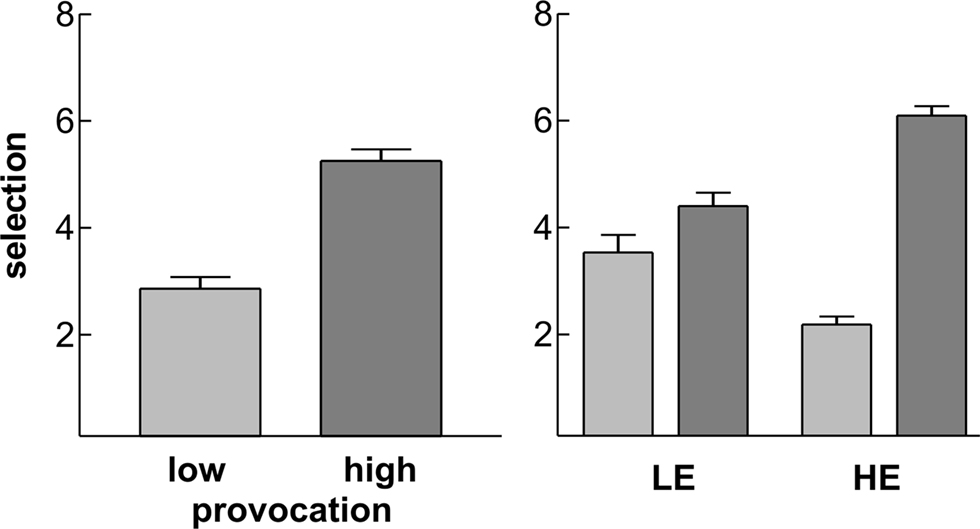
Figure 2. Behavioral results. Depicted are the mean selections under low (light grey) and high (dark grey) provocation for the whole EEG sample (left panel) and separately for the two groups LE (low experimentally induced aggression) and HE (high experimentally induced aggression; right panel). Error bars reflect standard errors.
As we were interested in differences between participants responding aggressively to the provocation (high experimentally induced aggressiveness, HE) and those that did not (LE), we divided our sample by a median-split into two groups based on their average selection under high provocation (Figure 2
). The provocation effect was evident in both groups, but clearly higher in the HE group (within-group paired sample t-test: t13 = −20.4, p < 0.001) than in the LE group (t13 = −2.7, p = 0.019), yielding a significant interaction of Group and Provocation (F1,26 = 64.6, p < 0.001). As can be observed from the figure, the two groups did differ also in their average selection under low provocation with a lower value in the HE group compared to LE participants (independent sample t-test: t26 = 3.74, p = 0.001). As we focused on provocation related effects in the time–frequency data, we decided to divide the sample based on their behavioral response to the (high) provocation, too. The two groups did not differ with respect to their mean FAF-score (independent sample t-test: t26 = 1.32, p = 0.20) or regarding gender distribution (χ2 = 0.337, p = 0.561).
Finally, we analyzed whether the outcome of the previous trial had an impact on the selection in the current trial. In the previous EEG-study (Krämer et al., 2008
), we observed less aggressive behavior in trials following win compared to lost trials in those participants, who showed no feedback-related differences in the ERPs. We thus analyzed the average selections in high vs. low provocation trials after win or loss trials with a repeated measures ANOVA comprising the within-subject factors Provocation and Outcome (previously lost vs. won) and the between-subject factor Group (HE vs. LE). The LE group showed indeed less aggressive behavior after win compared to lost trials irrespective of the current opponent (Outcome: F1,13 = 4.85, p = 0.046). The HE group did so only in high provocation trials whereas selections in low provocation trials did not depend on the previous outcome (Provocation × Outcome: F1,13 = 13.4, p = 0.003), yielding a significant three-way interaction of Group, Provocation and Outcome (F1,26 = 9.45, p = 0.005; Figure 3
).
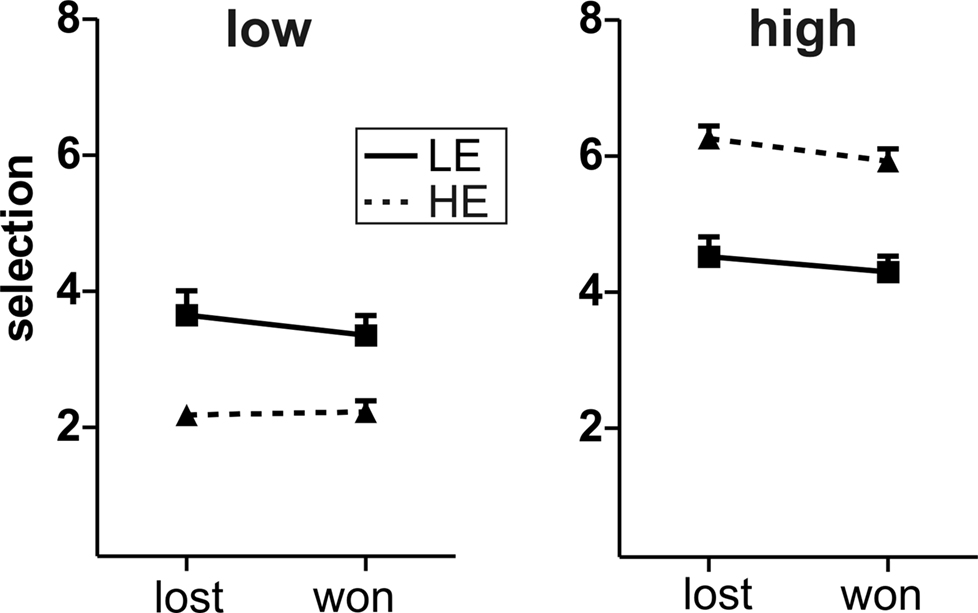
Figure 3. Behavior after lost/won trials. Depicted are the mean selections after lost and won trials, separately for low (left panel) and high (right panel) provocation trials and for the two groups LE (low experimentally induced aggression; solid line) and HE (high experimentally induced aggression; dashed line). Error bars reflect standard errors.
Time–Frequency Data for the Decision Phase
During the decision phase, we observed a clear increase in the theta band (4–7 Hz), most prominent between 200 and 400 ms, which was evident under both provocation conditions and in both groups. This theta band response was maximally pronounced at frontocentral electrodes (Figures 4
A,B).
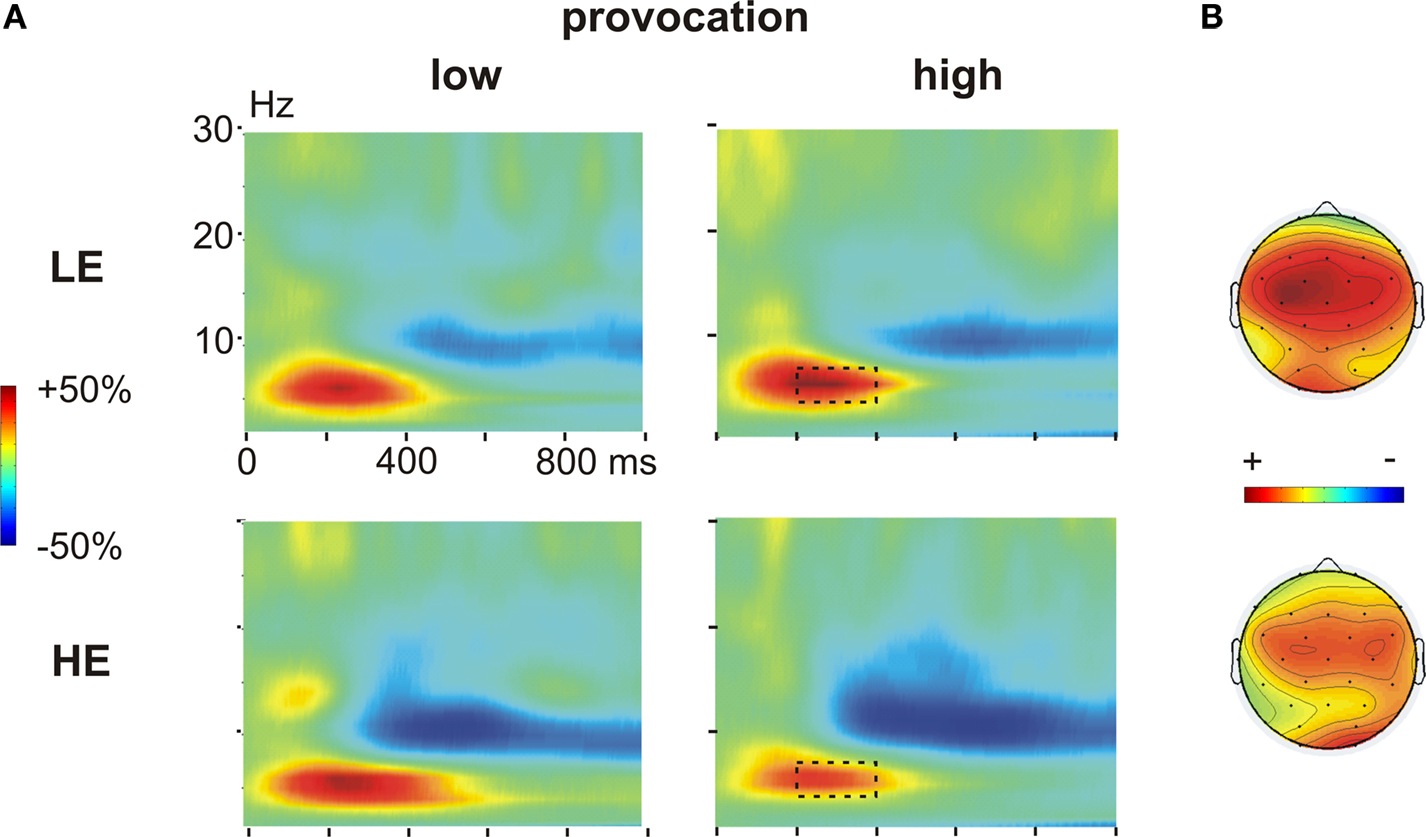
Figure 4. Time frequency results decision phase. (A) Changes in power (%) relative to the baseline (100 ms before the decision phase) in low (left panel) and high (right panel) provocation trials at the left frontal electrode F3, separately for the LE (low experimentally induced aggression; upper row) and HE (high experimentally induced aggression; lower row) groups. Highlighted is the frequency (4–7 Hz) and time range (200–400 ms), which was analyzed for the theta effect. (B) Topography of the theta increase under high provocation in the LE (upper map) and HE (lower map) group. The scaling of the maps is −20 to 40% of power change. Note the higher theta power increase in the LE compared to the HE group.
First visual inspection suggested differential effects of the provocation in the two groups, namely a provocation related increase in the theta response in the LE group, but a provocation related decrease in the HE group. To address this, we subjected the mean power values for the respective frequencies (4–7 Hz) between 200 and 400 ms to a repeated measures ANOVA with the within-subject factors Provocation (low vs. high), Anterior–Posterior (F3/4, C3/4 and P3/4) and Hemisphere (left vs. right), and the between-subject factor Group (HE vs. LE).
There was a significant provocation effect in both groups, which was more lateralized in the LE group. Importantly, the provocation effect was inverted in the two groups (Figure 6
A): high provocation led to a higher theta increase compared to low provocation trials in the LE group (Provocation × Hemisphere: F1,13 = 5.01, p = 0.043), but to a reduced theta increase in the HE group (Provocation F1,13 = 7.43, p = 0.017). This led to a significant three-way interaction of Group, Provocation and Hemisphere (F1,26 = 4.59, p = 0.042) and a marginally significant interaction of Group and Provocation (F1,26 = 3.21, p = 0.085). The provocation effect was larger on the left than on the right hemisphere in the LE group (Fleft > Fright). Although a similar trend for lateralization was observed in the HE group, it did not yield significance (p > 0.1). These results suggest that the theta response might reflect prefrontal control mechanisms: after provocation, it showed to be enhanced in participants refraining from retaliation, whereas a decreased response could be observed in participants showing reactive aggression.
Based on this interpretation, we reasoned that the increase of aggressive behavior after lost trials should be associated, too, with a decreased theta band response. We addressed this question by comparing the theta power in the decision phase after lost vs. won trials. This comparison was done for the three left hemisphere electrodes only, where the provocation effect had been found to be strongest (in the LE group, in particular). We analyzed high provocation trials only, as in these trials a clear effect of the previous outcome could be observed in both groups (see Behavioral Data for behavioral results). The repeated measures ANOVA thus included the within-subject factors Outcome (won vs. lost), Ant–Pos (F3, C3, P3) and the between-subject factor Group. The theta response was reduced in trials after losses (mean 23.5%) compared to trials after wins (29.5%), but yielding only marginal significance (Outcome: F1,26 = 4.15, p = 0.052). This effect did not differ between the two groups (interaction Outcome × Group: F < 1).
Time–Frequency Data for the Outcome Phase
During the outcome phase, an increase in the theta band (4–6 Hz) between 200–400 ms together with an increase in the beta band (20–25 Hz) between 400–600 ms was observed. First visual inspection suggested differential effects of the feedback (won vs. lost) and the provocation: whereas the theta effect differed between won and lost trials, the beta increase was clearly larger in high compared to low provocation trials (Figure 5
A). In addition to the theta and beta effects, we observed an enhanced power increase in the alpha band in lost compared to won trials. As we did not have hypotheses on this band and as the effect might likely reflect expectation effects related to the punishment, we decided to not further analyze this effect.
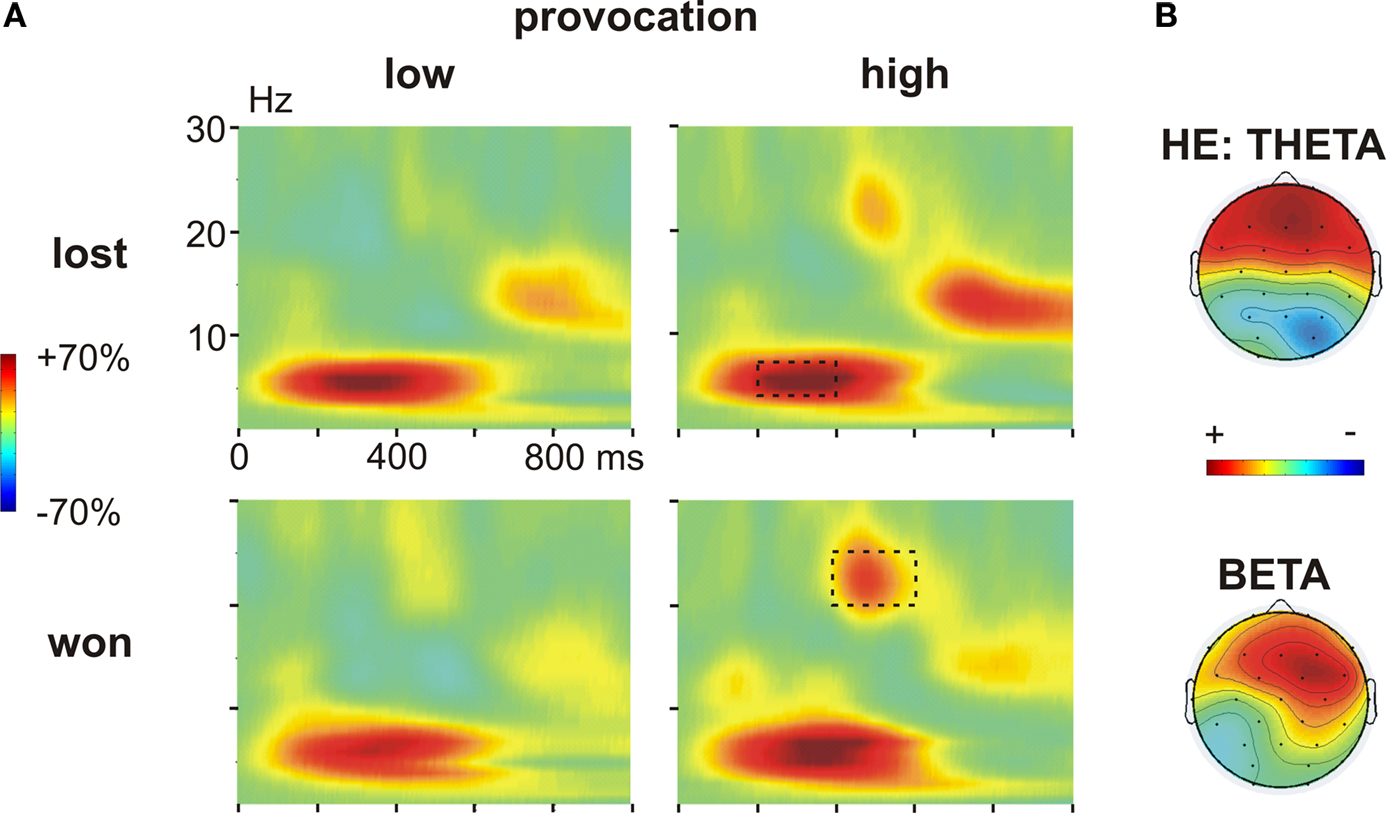
Figure 5. Time frequency results outcome phase. (A) Changes in power (%) relative to the baseline (100 ms before the feedback) in low (left panel) and high (right panel) provocation trials at the frontal electrode Fz, separately for lost (upper row) and won (lower row) trials. Highlighted are the analyzed frequency and time ranges of the theta (4–6 Hz, 200–400 ms) and beta (20–25 Hz, 400–600 ms) effects. (B) Topography of the theta increase in lost compared to won trials in the HE group (high experimentally induced aggression; upper map) and of the beta increase in won trials under high compared to low provocation trials (lower map). The scaling of the theta map is −15 to 15% of power change, of the beta map −25 to 25.
To further analyze the theta effect, we subjected the mean power values (4–6 Hz) between 200 and 400 ms to a repeated measures ANOVA with the within-subject factors Feedback (won vs. lost), Provocation (high vs. low), Anterior–Posterior (Ant–Pos; F3/4, C3/4 and P3/4) and Hemisphere (left v. right) and the between-subject factor Group (HE vs. LE). The higher theta increase in lost compared to won trials was confirmed by the interaction of Feedback and electrode position (Feedback × Ant–Pos: F2,52 = 4.57, p = 0.026). This effect differed between the groups, however (Feedback × Ant–Pos × Group: F2,52 = 5.05, p = 0.019). In fact, the feedback-related theta effect was seen in highly aggressive participants (Feedback × Ant–Pos: F2,26 = 7.06, p = 0.011), who showed higher theta power after negative compared to positive feedback. This effect was absent in the LE group (both main effect of Feedback and interaction Feedback × Ant–Pos: F < 1; Figure 6
B). The theta increase in the HE group was largest at frontal electrodes (main effect Provocation: FF3/4 > FC3/4 > FP3/4), as can be assessed from Figure 5
B.
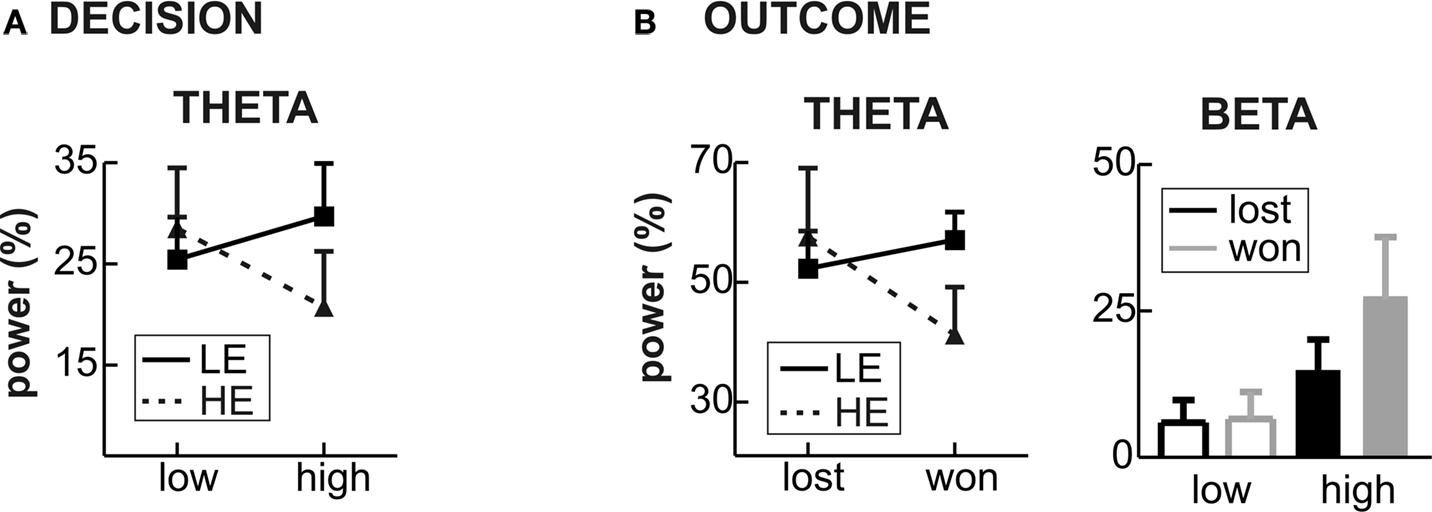
Figure 6. Group differences for Theta and Beta bands. (A) Decision phase: the mean power change in the theta band in low and high provocation trials is shown for the LE (low experimentally induced aggression; solid line) and HE groups (high experimentally induced aggression; dashed line), showing the interaction of provocation and Group. (B) Outcome phase: the mean power change in the theta band in won and lost trials (left panel) is shown for the LE and HE group, revealing the relative theta decrease in won trials in the HE group and no feedback-related difference in the LE group. The right panel illustrates the mean power change for the beta band, separately for the four conditions (won and lost under high and low provocation). The highest beta increase is found in won trials under high provocation.
To address the beta effect, we subjected the mean power values in the respective frequency band (20–25 Hz) between 400 and 600 ms to a repeated measures ANOVA with the same factors as above. High provocation trials were associated with a significantly higher beta increase compared to low provocation trials (Provocation: F1,26 = 5.609, p = 0.026), which was highest at frontal electrodes (Provocation × Ant–Pos: F2,52 = 4.057, p = 0.037), and more prominent on the right hemisphere (Provocation × Hemisphere: F1,26 = 4.870, p = 0.036) as can be assessed from Figure 5
B. Importantly, this effect differed depending on the current trial’s outcome: the provocation-related beta increase was higher in won trials (Provocation × Hemisphere: F1,26 = 10.04, p = 0.004) than in lost trials (Provocation: F1,26 = 4.09, p = 0.054; Provocation × Hemisphere: F < 1), resulting in a significant three-way interaction of Provocation, Feedback and Hemisphere (F1,26 = 4.447, p = 0.045). That is, the beta increase was larger when winning against the highly provocative opponent compared to both winning under low provocation or losing under high provocation (see Figure 6
B). This provocation related beta effect did not differ between the two groups (all interactions involving Provocation and Group: p > 0.1).
The present study aimed to identify neural processes related to decision-making and evaluation during an aggressive interaction. We could demonstrate differences in oscillatory activity in the decision as well as in the outcome phase between those high trait aggressive participants who reacted aggressively to provocation and similarly trait aggressive subjects who largely refrained from retaliation. These data go in line with and extend previous evidence for prefrontal control mechanisms involved in the regulation of human aggression.
Behavioral Data
As expected and shown in earlier studies with the TAP, provocation led to a clear increase of aggressive behavior in the sense of higher punishment selections. Interestingly, the provocation effect was considerably higher compared to the previous EEG-study (Krämer et al., 2008
). This is likely due to the trial-by-trial manipulation of the provocation in the present study with explicit information about the opponent (“A” vs. “B”), whereas the opponent changed block-wise in the previous experiment and had to be inferred from the behavior. Moreover, the punishment with an electric shock might have been more aversive (and thereby provocative) compared to the aversive noise. Like in the previous study, we observed higher punishment selections after loss compared to win trials. However, whereas this effect was shown by LE participants only in the earlier study, it was observable in the HE group, too, in the present study (for high provocation trials at least). Again, it can be speculated only that this was due to the more aversive punishments in the current study. Finally, it should be noted that the two groups were derived based on their behavior under higher provocation, but differed also in their behavior under low provocation. One might thus argue for the overall punishment selection (across provocation level) as measure for aggressive behavior. Importantly, this should be reflected in general group differences in the electrophysiological data, too, irrespective of the experimental condition. Group main effects are however more difficult to interpret and more prone to irrelevant interindividual differences (such as overall amplitude differences). We thus decided to analyze group differences based on participants’ reaction to (high) provocation and respective interactions of experimental conditions and group.
Decision Phase
During the decision phase, we observed an increase in the theta band in both low and high provocation trials compared to the pre-stimulus baseline. Theta oscillations have repeatedly been found in a wide range of tasks calling for increased cognitive effort and frontal control, related to working memory, response inhibition, error- or feedback-related processes (Klimesch, 1999
; Onton et al., 2005
; Sauseng et al., 2005
; Kirmizi-Alsan et al., 2006
; Yeung et al., 2007
; Hanslmayr et al., 2008
; Cavanagh et al., 2009
). Based on dipole models, the frontal theta response has been suggested to emanate from the dorsal part of the anterior cingulate cortex (ACC) (Onton et al., 2005
). As oscillations in the theta frequency range have also been observed in the hippocampus (Buzsaki, 2002
), error- and feedback-related theta responses might also reflect activity in a broader circuitry involved in adaptive action regulation (Luu et al., 2003
).
Importantly, high provocation led to an enhanced or reduced theta activity depending on the participant’s response to the provocation: the LE group, who did not react more aggressively when being provoked, showed an enhanced theta increase in high provocation trials, likely reflecting their higher cognitive control in these trials. The HE group in contrast, getting back to the provocative opponent, showed reduced theta response under provocation, supposedly associated to reduced cognitive control. Moreover, we could show that trials after a punishment (i.e. lost trials) came along with both more aggressive behavior and a reduced theta response compared to trials after wins. This is further support for the notion of the theta effect as a cognitive control mechanism in the regulation of aggression.
These results dovetail with the ERP findings of the previous EEG-study with the TAP (Krämer et al., 2008
). In that study, an increased frontolateral negativity was observed in high compared to low provocation trials. However, this was evident only in those high trait aggressive participants who refrained from retaliation (LE group). The present data can extend those results as they in addition suggest a decrease of prefrontal activity both in the HE group and related to the more aggressive behavior directly after being punished. However, the two effects, the frontolateral negativity and the theta response do not necessarily reflect the same neural processes: whereas the frontolateral negativity was right-lateralized, the theta effect was rather left-lateralized. Moreover, the ERP effect was a later and longer-lasting effect (300–600 ms) in contrast to the earlier theta response (200–400 ms). However, there were also modifications in the paradigm such that provocation was manipulated on a trial-by-trial basis in contrast to the earlier block-wise manipulation. This likely caused generally higher cognitive demands for the decision phase and differences in the behavioral (see Behavioral Data) and neurophysiological effects.
Although our results suggest that the provocation-related theta effect is associated with cognitive control or inhibition of aggression, they cannot pinpoint the exact neural or cognitive mechanism underlying this association, especially as an increased theta power has been observed in a broad range of different tasks asking for enhanced cognitive effort, as mentioned above. It is interesting to note, that this effect is very early (about 300 ms) after the opponent is revealed and on average about 2 s before the actual selection is made (i.e. the respective button is pressed). Importantly, these findings suggest that neural processes previously associated to “cold” executive functions play a role also in the control of social interactions and aggression in particular. This evidence for control mechanisms impacting decision-making in a social context thus extends previous research on the relationship between executive functions and aggression, which was rather based on behavioral and patient data. For instance, studies have compared psychopathic patients to control participants for various neuropsychological measures of executive functions (Kiehl et al., 2000
; Morgan and Lilienfeld, 2000
; Blair et al., 2006
; Munro et al., 2007
). They could show impairments in tasks related to orbitofrontal, dorsolateral prefrontal and ACC functions with quite heterogeneous results though, likely depending on the tasks applied and characteristics of the patients group. In addition, researchers examined aggressive behavior in the TAP in healthy young participants being classified as high or low in executive functions based on previous neuropsychological assessment, showing group differences in particular in combination with alcohol consumption (Hoaken et al., 2003
; Pihl et al., 2003
; Giancola, 2004
). However, only neurophysiological data like the present can speak to the role and temporal dynamics of prefrontal functions during an aggressive interaction itself (Krämer et al., 2007
, 2008
; Lotze et al., 2007
).
Outcome Phase
The outcome phase was associated with an increase in the theta band in loss compared to win trials and a provocation-related increase in the beta band. Importantly, the feedback-related theta effect was observed in HE participants only, whereas no difference in the theta band was seen for the LE group. The beta effect on the other hand was seen in particular in win trials yielding the highest power increase in win trials under high provocation.
An increased oscillatory activity in the theta range has repeatedly been found in response to negative feedback, mostly studied with probabilistic learning or gambling paradigms (Luu et al., 2003
, 2004
, Cohen et al., 2007
; Marco-Pallares et al., 2007
). As mentioned above, this theta activity has been ascribed to the ACC or to a broader circuitry involving the ACC as well as subcortical structures (Luu et al., 2004
; Onton et al., 2005
). It is widely accepted that the mediofrontal negativity observable in ERP studies on negative feedback (or after errors) reflects oscillatory activity in the theta range, although the mechanism, be it a phase-resetting of theta oscillations or a power increase per se, is under debate (Luu et al., 2004
; Yeung et al., 2007
). The theta findings in the current study thus replicate our previous ERP findings of an increased medio-frontal negativity to losses in HE participants only (Krämer et al., 2008
). This was taken as evidence for an empathic response to the opponent’s loss in the LE group, leading to their decreased aggressiveness after wins. In contrast, both groups selected lower punishments after wins (in high provocation trials at least) in the present study, questioning this direct link of the theta response and subsequent behavioral adaptations. However, results from a recent lesion study in macaques suggested a role of the ACC in the integration of reinforcement information over time rather than in error detection or post-error adjustments (Kennerley et al., 2006
). This might explain the lack of group differences in behavioral effects immediately after negative feedback in spite of their differences in feedback-related ACC activity.
In addition to the feedback-related theta increase, we observed an enhanced beta power in particular when participants had won against the highly provocative opponent. This effect did not differ between the two groups and could not be found in the ERP study, because of less phase-locking of this high frequency activity (Krämer et al., 2008
). As outlined in the introduction, previous studies on oscillatory activity in gambling paradigms (Marco-Pallares et al., 2007
, 2009
) and probabilistic reinforcement learning (Cohen et al., 2007
) have reported increased activity in the range of 20–30 Hz in response to positive feedback, arguing for differential neural mechanisms underlying processing of positive and negative feedback. Furthermore, the beta response was modulated by reward magnitude and probability, in contrast to the theta response (Cohen et al., 2007
; Marco-Pallares et al., 2007
). The beta response was taken to reflect activity in a broader fronto-striatal circuit of brain regions involved in the processing of rewards.
The present findings differ from those previous results: the beta power was mainly found to be enhanced in high compared to low provocation trials with an additional boost in win trials under high provocation. This cannot easily be reconciled with a relation of this beta response to reward processing. One might argue that winning under low provocation had no motivational impact as losing did not really mean a punishment. This cannot explain the increased beta response to high losses, however, which would rather point to a signal reflecting behavioral significance. In contrast, an fMRI study with the TAP showed activations in reward-related areas (dorsal striatum) during the decision phase, supposedly related to reward expectation (Krämer et al., 2007
). In addition, winning was associated with an increased activation in the ventral striatum compared to losing. More studies (and replications) are clearly needed to specify the functional role of the present beta response and to link it to findings of reward-related activations in previous fMRI studies of the TAP (Krämer et al., 2007
).
Conclusions
The present study is the first to examine oscillatory brain activity during laboratory-induced reactive aggression. The data provide further support for changes in prefrontal activity related to the decision to get back to a provoking opponent or to refrain from retaliation. As all participants included in this sample had a rather high predisposition for aggression, these results suggest that higher cognitive resources enabled some participants to control their aggressive tendencies. This specifies cognitive routes and decision processes previously postulated by social psychological models of aggression (Tedeschi and Felson, 1994
; Anderson and Bushman, 2002
). The General Aggression Model, for instance (Anderson and Bushman, 2002
), assumes that personality factors like aggressiveness determine the response to situational factors as provocation via cognitive, affective and arousal routes, leading to impulsive or premeditated behavior. Simply observing behavior, though, cannot speak to the underlying cognitive processes but only allows to infer them based on the behavior. Studies on the involved neurophysiological processes provide us with deeper insight into relevant cognitive and emotional mechanisms and can thereby give better predictions of future behavior. Finally, future studies will be needed to gain a better understanding of the exact nature of the observed differences in oscillatory activity, regarding for instance similarities with effects seen in rather cognitive, executive function tasks. Moreover, one important prediction for the outcome-related effect, given our interpretation of it as some kind of empathic process to the opponent’s loss, would be that it should be sensitive to the situational and interpersonal context (Batson et al., 1997a
,b
).
The authors declare that the research was conducted in the absence of any commercial or financial relationships that could be construed as a potential conflict of interest.
We thank Josep Marco-Pallares for advice on the time–frequency analysis. This work was supported by grants from the BMBF and from the DFG to TFM. UMK is supported by a fellowship from the DFG (KR 3691/1-1).
Gehring, W. J., and Willoughby, A. R. (2004). Are all medial frontal negativities created equal? Toward a richer empirical basis for theories of action monitoring. In Errors, Conflicts and the Brain: Current Opinions on Performance Monitoring, M. Ullsperger and M. Falkenstein, eds (Leipzig, Max-Planck Institute of Cognitive Neuroscience), pp. 14–20.
Marco-Pallares, J., Cucurell, D., Cunillera, T., Krämer, U. M., Camara, E., Nager, W., Bauer, P., Schüle, R., Schöls, L., Münte, T. F., and Rodriguez-Fornells, A. (2009). Genetic variability in the dopamine system (DRD4, COMT) modulates neurophysiological responses to gains and losses in humans. Biol. Psychiatry. 66, 154–161.
Nuwer, M. R., Comi, G., Emerson, R., Fuglsang-Frederiksen, A., Guerit, J. M., Hinrichs, H., Ikeda, A., Luccas, F. J., and Rappelsburger, P. (1998). IFCN standards for digital recording of clinical EEG. International Federation of Clinical Neurophysiology. Electroencephalogr. Clin. Neurophysiol. 106, 259–261.