1
Institute for Learning and Brain Sciences, University of Washington, Seattle, WA, USA
2
UCLA Department of Psychology, Department of Psychiatry and Biobehavioral Sciences, and Brain Research Institute, Franz Hall, Los Angeles, CA, USA
The world is an unpredictable place, presenting challenges that fluctuate from moment to moment. However, the neural systems for responding to such challenges are far from fully understood. Using fMRI, we studied an audiovisual task in which the trialsquotidn difficulty and onset times varied unpredictably. Two regions were found to increase their activation for challenging trials, with their activities strongly correlated: right frontal cortex and the brainstem. The frontal area matched regions found in previous human studies of cognitive control, and activated in a graded manner with increasing task difficulty. The brainstem responded only to the most difficult trials, showing a phasic activity pattern paralleling locus coeruleus recordings in monkeys. These results reveal a bridge between animal and human studies, and suggest interacting roles for the brainstem and right frontal cortex: the brainstem may signal that an attentional challenge is occurring, while right frontal cortex allocates cognitive resources in response.
In order to meet the challenges that are thrown at it, the brain must skillfully control its attentional resources. As illustrated in Table 1
, the nature of this control can be described as varying along two dimensions: what is controlled, and what that control is in response to.
Of these two dimensions, the latter has been explored in great detail across its full range: the control of attention may be in response to external events, as in the case of stimulus-driven attention, or in response to internal events, as with goal-driven attention. In contrast, the former dimension, namely what is controlled, has been explored almost entirely in terms of what type of entity is to be attended, e.g., whether the attention is to be directed to a feature (Maunsell and Treue, 2006
), an object, or a spatial location (Yantis and Serences, 2003
).
However, this dimension of what is controlled covers another important variable: how much of the brain’s limited cognitive resources it directs towards an attended item. Some tasks demand significant resources, whereas others need little or none at all. These demands may change in response to internal events, e.g., deciding to start work on a cross-word puzzle, or they may fluctuate unpredictably from moment to moment, such as when fleeing a pack of predators in a forest. The present study explores the control of cognitive resource allocation in response to unpredictable external events; this process could be called “challenge-driven attention.”
Overview of Paper
In the following sections of the paper, we describe an fMRI task designed to probe challenge-driven attention, and the patterns of neural activation that the task was found to elicit. We then propose a hypothesis about how the observed neural activity might implement challenge-driven attention, and discuss how this hypothesis may explain, and provide a bridge between, studies from both the human and the animal literatures. We then discuss the relations between challenge-driven attention and other types of attention, exploring in more detail the relationships that are schematically illustrated in Table 1
. Finally, we suggest some testable predictions that follow from our hypothesis.
Devising a Task to Probe Challenge-Driven Attention
The key ingredient for a task to probe challenge-driven attention is unpredictability, more specifically the unpredictability of how task demands will fluctuate from moment to moment. A sudden increase in task difficulty constitutes an attentional challenge, and in order to meet that challenge extra cognitive resources must be allocated in response. Thus, for a task to probe challenge-driven attention, it should be the case that at any given moment the subject must be unable to predict when the next trial will occur, and how difficult that trial will be.
We used the task of audiovisual simultaneity detection (Bushara et al., 2001
; Lewkowicz, 1996
) in which, on each trial, subjects were presented with a flashed white disc and a burst of noise, with their task being to decide whether the auditory and the visual stimuli seemed to be simultaneous or successive. The onset-times were determined using an optimised stochastic event-related fMRI design (Dale, 1999
), with the inter-trial interval ranging between 2.5 and 7 seconds. The stimulus onset asynchrony (SOA) between the auditory and the visual stimuli ranged over eleven different values, from –300 ms (visual preceding auditory) to +300 ms (auditory preceding visual). Stimuli with either very long or very short SOAs were easily and consistently judged by the subjects to be successive or simultaneous, respectively. However, stimuli with intermediate SOAs were more difficult to judge, and showed more uncertainty in the subjects’ responses, tending to be classified as either simultaneous or successive with approximately equal probability. This allowed us to define a “difficulty score” for each SOA-type for each subject, as a linear function of the difference between the proportion of “simultaneous” responses and the 50–50 simultaneous/successive point of maximal uncertainty. Figure 1
shows the subjects’ averaged responses while performing the task in the scanner, and the associated difficulty scores.
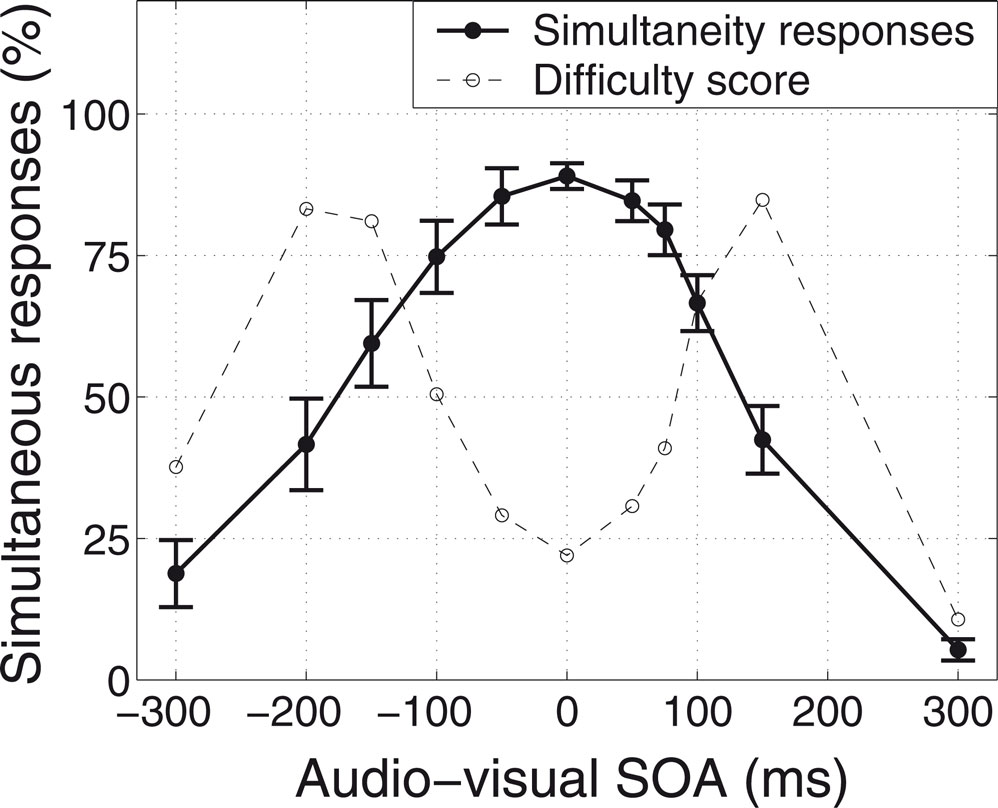
Figure 1. Subjects’ averaged psychophysical responses while performing the audiovisual simultaneity task in the scanner, and the associated difficulty scores. The auditory stimulus was a burst of white noise, and the visual stimulus was a flashed white disc, both lasting for 100 ms. The subjects’ task was to judge whether the stimuli appeared to be simultaneous or successive. The stimulus onset asynchrony (SOA) between the auditory and the visual stimuli ranged from –300 ms (visual preceding auditory) to +300 ms (auditory preceding visual). A “difficulty score” was calculated for each SOA-type for each subject, as a linear function of the difference between the proportion of “simultaneous” responses and the 50–50 simultaneous/successive point of maximal uncertainty. Error-bars show the across-subjects standard error (n = 12).
These difficulty scores, it is important to note, are quite distinct from other aspects of the task, such as the degree of cross-modal fusion or of temporal integration that takes place. Both fusion and integration reach their maximum at an SOA of zero, when the auditory and visual stimuli are perfectly simultaneous. The difficulty of a given trial, in contrast, reaches its peak for intermediate SOAs, which are close to a subject’s decision criterion. Judgments about zero-SOA trials, which produce a strong percept of fused cross-modal simultaneity, are easy.
Subjects
The study participants were 12 subjects (3 males), all right-handed (as assessed using the Edinburgh Handedness Inventory), average age 25.6 years. All gave informed consent according to procedures approved by the Human Research Committee of Massachusetts General Hospital.
Stimuli
The stimulus onset asynchrony (SOA) between the auditory and the visual stimuli ranged over eleven distinct values: Visual-then-auditory: 300, 200, 150, 100, 50 ms; Simultaneous: 0 ms; Auditory-then-visual: 50, 75, 100, 150, 300 ms. The SOAs for the auditory-then-visual conditions were clustered around somewhat shorter values than those for visual-then-auditory, in order to try to sample better around their respective simultaneity thresholds; previous studies of audiovisual simultaneity tasks have standardly found that the perceived “simultaneity window” is longer for visual-then-auditory than for auditory-then-visual stimuli (Bushara et al., 2001
; Lewkowicz, 1996
), and indeed our data showed the same pattern. Both the auditory and the visual stimuli lasted for 100 ms. Between trials, a fixation cross was presented as the null condition. Each subject had six functional runs, lasting for 440 seconds each. An average of around 130 audiovisual trials and 120 null fixation trials were presented per run.
MRI Acquisition
Twenty one axial slices (5 mm thick, 1 mm gap) were collected on a Siemens 3T Allegra scanner, using a quadrature headcoil and a gradient-echo echo-planar pulse sequence: repetition time, TR = 2000 ms; echo time, TE = 30 ms, field of view = 200 mm, matrix size 64 × 64. High-resolution T1-weighted scans (MP-RAGE; Siemens) were also acquired, for anatomical localisation.
Data Analysis Methods
Preprocessing and statistical analysis of the data were performed using SPM99 software (Wellcome Department of Cognitive Neurology). Preprocessing included slice timing correction, motion correction, normalization to the MI1305 stereotactic space (interpolating to 3 mm cubic voxels) and spatial smoothing with an 8 mm isotropic Gaussian kernel. Global signal scaling was not applied, in order to prevent spurious deactivations. The event-related design was modelled using a canonical haemodynamic response and its temporal derivative (Friston et al., 1998
). This analysis was performed individually for each subject, and contrast images for each subject were used in a second-level analysis treating subjects as a random effect. The statistical overlay images were made using MRIcro (Rorden and Brett, 2000
).
The difficulty-weighted random effects analyses were statistically thresholded at p < 0.001, uncorrected, yielding the brainstem and right-frontal ROIs. A brief note is in order about the use of uncorrected p-values for the activation clusters found in the present study: there is no doubt that p-values that have been explicitly corrected for multiple comparisons are preferable to uncorrected comparisons (Poldrack et al., 2008
). However, existing methods for multiple comparisons correction make it unduly difficult for clusters from small subcortical nuclei to survive. The intensity of activation in small nuclei will tend to be reduced by spatial smoothing with tissue from outside the nucleus. Therefore, intensity-based voxelwise correction will tend not to count the nuclei’s activity as significant. Both cluster-based correction and non-parametric correction in SnPM (Nichols and Holmes, 2002
) set thresholds based on cluster size, and hence will also tend to penalise clusters arising from small nuclei. Similarly, False Discovery Rate correction (Genovese et al., 2002
) requires the presence of a large number of very small p-values in the sample in order for p-values later in the sorted list to meet significance, with the result that when only small active clusters are present this condition will rarely be met. The brainstem and right-frontal clusters reported here consist of 4 and 7 voxels respectively, at a normalised voxel-size of 3 × 3 × 3 mm. Given these considerations, we report results that were significant at p < 0.001, uncorrected, and thus the present results should be taken as preliminary. Additional studies will be needed to investigate more fully the hypothesised noradrenergic network for challenge-driven attention that we describe here. Such future studies may with justification use the present results as a basis for statistically homing in on the locus coeruleus.
For calculating the difficulty-scores, the following formula was used: difficulty score = 1 – 2 × |p – 0.5|, where p is the proportion of “simultaneous” responses for each SOA-type. This formula makes the difficulty score range between 0 and 1, taking the value of 1 when exactly half the responses are for simultaneous, and the value of zero when either all the responses are for simultaneous or all are for successive. Each difficulty-weighted contrast was a weighted sum across task conditions, where the different conditions were the eleven different SOA-types. For each subject, the contrast coefficient for each SOA-type was the corresponding difficulty score for that subject. The difficulty scores for each subject were zero-meaned prior to being used for the contrast, so that the contrast coefficients would sum to zero.
Activity Related to Task Difficulty
In order to look for brain areas whose activation increases as a function of task difficulty, the difficulty scores for each condition for each subject were used to define a general linear model contrast. The resulting difficulty-weighted contrast images were then passed into a second-level random effects analysis. The unthresholded random effects results are shown in Figure 2
A, and the maximum intensity projection of the same results thresholded at p < 0.001 (t > 4.02, df = 11, uncorrected) is shown in Figure 2
B. As can be seen from the unthresholded images, two regions stand out from the rest of the brain as showing a significant effect. The first of these regions is the brainstem, in a region matching the anatomical location of the locus coeruleus, or LC (Mai et al., 1997
), a nucleus which is the brain’s primary source of the modulatory neurotransmitter noradrenaline. Although fMRI on its own lacks the spatial resolution to definitively identify a particular brainstem subregion as being the LC, we will argue below that the neural activity that we observed in this brainstem region supports this identification, as its pattern of behaviour parallels those found in studies of LC neuronal activity in animals. The second activated region is in right frontal cortex, at the junction of the anterior insula and the opercular part of the inferior frontal gyrus.
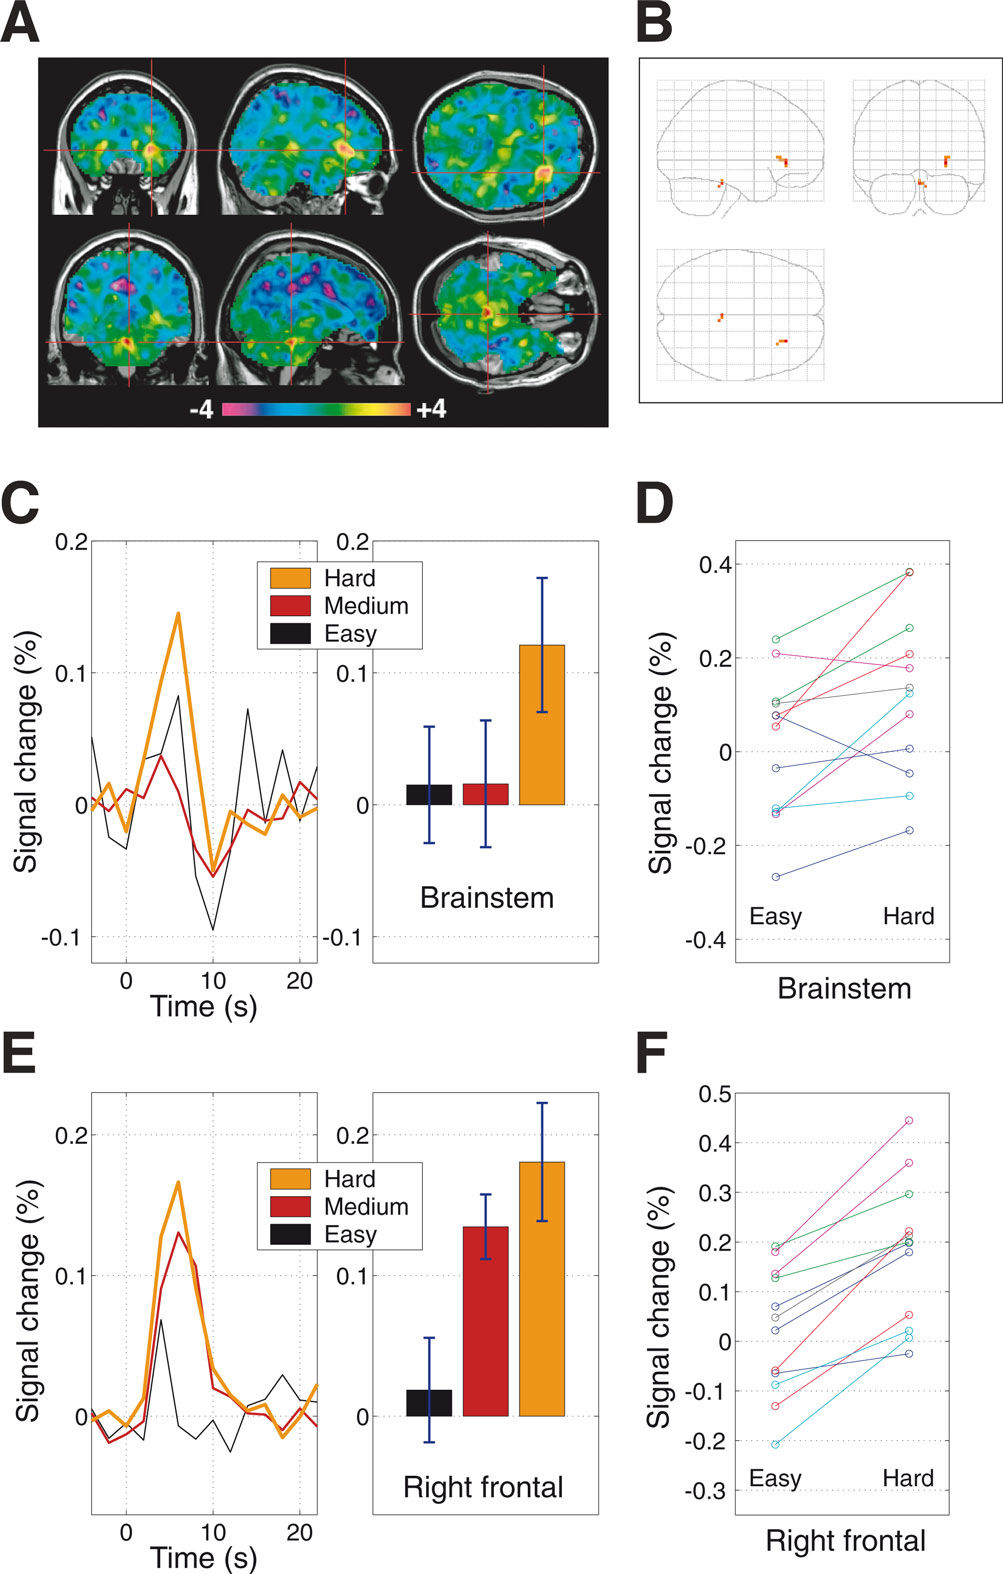
Figure 2. Neural activity that increases as a function of task difficulty. (A) Unthresholded statistical map of difficulty-weighted activation t-values. The difficulty scores for each condition for each subject were used to define a general linear model contrast, and the resulting difficulty-weighted contrast images were passed into a second-level random effects analysis. (B) Maximum intensity projection of the same t-map, thresholded at p < 0.001 (t > 4.02, df = 11, uncorrected), with no extent threshold applied. The local maximum of the right frontal cluster has MNI-space coordinates [27, 33, –3], and that of the locus brainstem cluster is at [0, –33, –24]. (C–F) Region-of-interest (ROI) analyses. For each subject, the difficulty scores were used to sort the various trial-types into three classes: easy, medium and hard, and the peri-stimulus time-courses and average percentage signal-change values were calculated. Error-bars show the across-subjects standard error (n = 12). (C) The brainstem showed low levels of activity for all but the most difficult trials. Easy trials appeared to elicit a small neurally-evoked haemodynamic response function (HRF) combined with a larger amount of noise, whereas medium and hard trials evoked cleaner HRFs that were small and large respectively. (D) The pattern of increasing brainstem activation with increasing task difficulty was highly consistent across subjects, more so than were the MRI signal levels with respect to the “baseline” defined by the response to the null trials (within-subjects paired t-test, t = 2.91, p = 0.007, df = 11). (E) The right frontal region exhibited a more graded increase in activity as a function of trial difficulty, responding to medium-difficulty trials as well as the hardest trials. (F) All twelve subjects showed greater activity for hard trials than for easy trials in this frontal region (within-subjects paired t-test, t = 7.49, p < 10–5, df = 11).
In order to explore the response properties of these two areas in more detail, region-of-interest (ROI) analyses were performed. For each subject, the difficulty scores for the various SOA-types were sorted and grouped into three classes: easy (the lowest quartile of difficulty scores), medium (the inter-quartile range) and hard (the highest quartile). The peri-stimulus time-courses and average percentage signal-change values were calculated for each of the ROIs, as shown in Figures 2
C–E. The pattern of increasing activation with increasing task difficulty was highly consistent across subjects, more so than were the MRI signal levels with respect to the “baseline” defined by the response to the null trials (Figures 2
D,F).
Functional Connectivity Between the Locus Coeruleus and Right Frontal Cortex
The locus coeruleus and the prefrontal cortex, the two areas activated by our task, have been found in animal studies to be both functionally and anatomically connected to each other (Arnsten and Goldman-Rakic, 1984
; Dalley et al., 2001
; Jodo et al., 1998
; Porrino and Goldman-Rakic, 1982
). This raises the question of whether a correspondence might be found between the activity in the brainstem and right frontal regions in our fMRI data. Several different methods have been proposed for examining correlations in fMRI, with consensus yet to emerge (Horwitz, 2003
). We therefore pursued parallel approaches, looking for a functional correspondence across subjects and across time.
Across subjects, we looked across the whole brain for areas whose task-difficulty-related activation was proportional to that of the brainstem. As is shown in Figure 3
A, a distinct cluster of right frontal voxels emerges as highly correlated across subjects with the brainstem. These voxels form a subcluster of the right frontal ROI that was activated by task-difficulty. The close correspondence between this right frontal subcluster’s difficulty-weighted activation and that of the brainstem is shown in scatterplot form in Figure 3
B. The correlation across subjects of these two regions suggests that the brainstem and the right frontal cortex form two inter-related subcomponents of a network for stimulus-driven attention. Different subjects activated this attentional network to differing degrees, but the degree to which a given subject activated the brainstem subcomponent was highly predictive of the degree to which that same subject activated the right frontal subcomponent. The different parts of the attentional network rise and fall together.
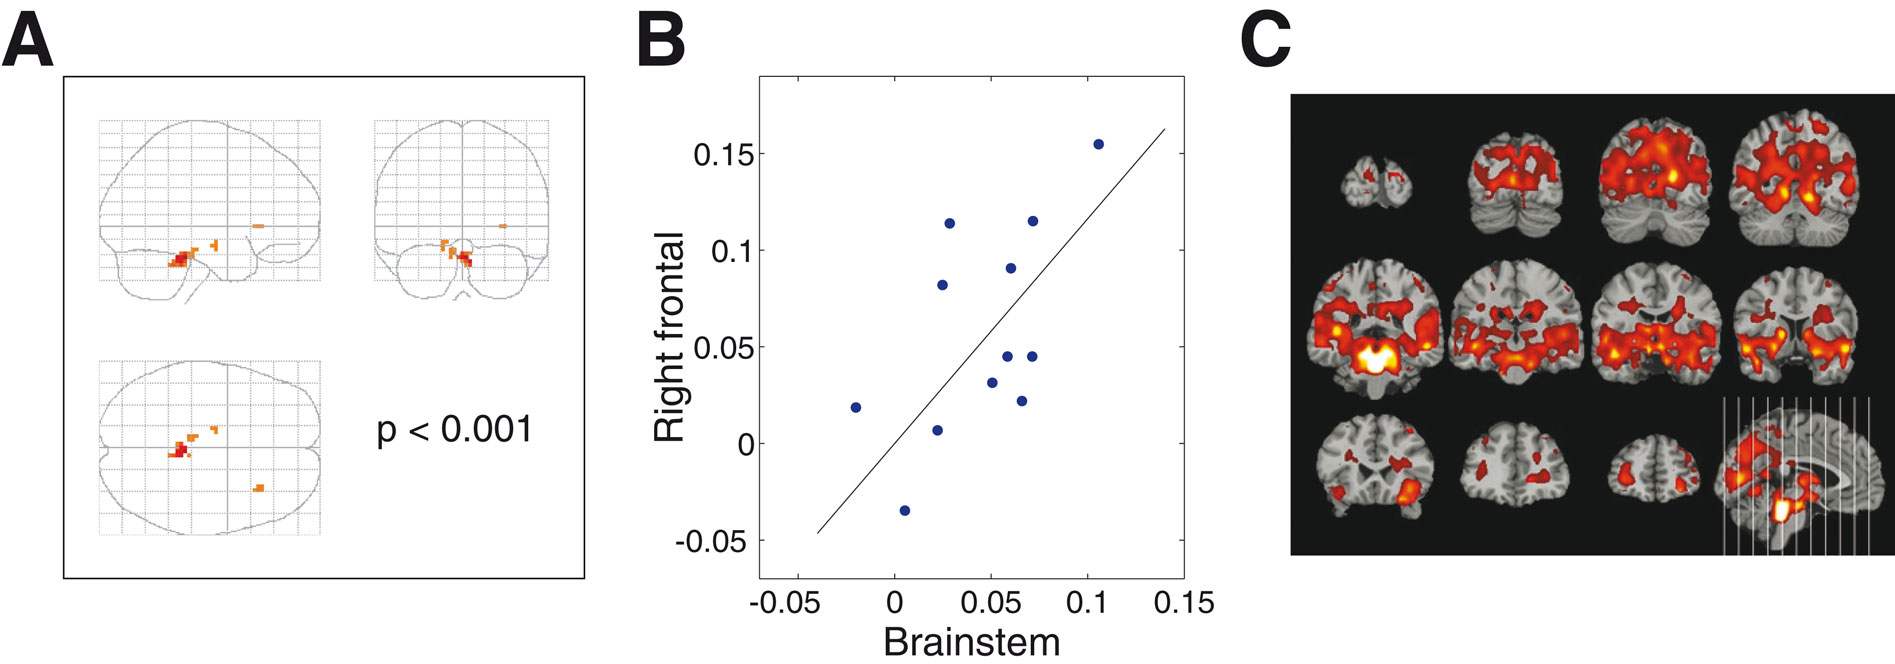
Figure 3. Correspondence between activity in brainstem and right frontal cortex. (A) Maximum Intensity Projection of results from a regression performed across subjects, looking for areas whose task-difficulty-related activation was proportional to that of the brainstem. Results are shown thresholded at p < 0.001 (t > 4.02, df = 11, uncorrected), with an extent threshold of k = 4 voxels. The brainstem is, trivially, highly correlated with itself, with high correlations also found in its immediate surroundings and some voxels in the midbrain. A distinct cluster of right frontal voxels emerges as highly correlated with the brainstem. These voxels are a subcluster of the right frontal ROI that was activated by task-difficulty, and their local maximum has MNI-space coordinates [33, 24, 0]. (B) Scatterplot of the average difficulty-weighted contrast values for each of the twelve subjects, with the values from the brainstem ROI plotted along the x-axis, and those of the right frontal cluster from panel (A) along the y-axis. (Slope of regression line = 1.16, general linear model test for significance of positive slope: t = 5.13, p = 1.6 × 10⁻⁴, df = 11). (C) Correlations with the time-course of the brainstem. Results are shown thresholded at p < 0.001 (t > 4.02, df = 11, uncorrected), with no extent threshold. t-values greater than 10 are shown as white. Several cortical areas emerge as strongly correlated with the brainstem time-course, including the right frontal area, and also visual, auditory and parietal cortices.
A second level of analysis looks at the correlation across time of the MRI signals from different brain areas. Within subjects, the time-course of the brainstem activity was extracted and used as a regressor, looking across the whole brain for voxels whose time-courses were correlated with it. This generated a set of twelve brainstem-correlation contrast images, one from each subject, which were then passed into a standard second-level random effects analysis.
The results of this analysis are shown in Figure 3
C: one of the cortical areas which is strongly correlated with the brainstem time-course is the same right frontal area that emerged in the previous analyses, but the brainstem is also correlated with broad areas of cortex, especially the visual, auditory and parietal cortices. This is consistent with the sensory and attentional demands of the audiovisual crossmodal task used in the study, as well as with the known anatomical pattern of widespread projections from the locus coeruleus across cortex (Berridge and Waterhouse, 2003
), including visual (Tigges et al., 1982
), auditory (Rouiller et al., 1989
) and prefrontal regions (Porrino and Goldman-Rakic, 1982
). The broad pattern of correlation suggests that, although direct anatomical interconnections between the coeruleus and right frontal cortex may be active, such connections are, on their own, insufficient to explain why these two regions respond similarly to each other as a function of task difficulty. Instead, this similarity may be due to the two regions functioning as inter-related subcomponents in a broader network for challenge-driven attention.
A Hypothesis
We propose the following hypothesis, which, we wish to argue, can account for our results and also other studies from the human and animal literatures. Our hypothesis is that challenge-driven attention is mediated by a frontal-brainstem network, and, more specifically, that the brainstem signals when an attentional challenge is occurring, and that right frontal cortex allocates cognitive resources in response.
The information-flow between these two regions, under this hypothesis, is bidirectional, consistent with the fact that they are reciprocally interconnected (Arnsten and Goldman-Rakic, 1984
; Dalley et al., 2001
; Jodo et al., 1998
; Porrino and Goldman-Rakic, 1982
): the brainstem’s task of determining whether or not an attentional challenge is occurring depends, in part, on information about how the right frontal cortex is currently allocating cognitive resources. Although this hypothesis helps to explain the experimental results presented here, future studies will certainly be needed to test how these two regions might share or divide up the alerting and resource-allocating roles that we suggest for them here.
In the following sections, we will argue that this hypothesis can explain, and provide a bridge between, studies from both the human and the animal literatures, and how it can account for some puzzling findings in the human fMRI literature. Finally, we discuss the relations between challenge-driven attention and other types of attention, and suggest some testable predictions that follow from our hypothesis.
Interpretation of Observed Activation
The two difficulty-related regions exhibited different patterns of activity as a function of trial difficulty. The right frontal region, as shown in Figure 2
C, increased its activity in a graded manner, with easy trials inducing little activation, medium trials eliciting more, and hard trials triggering the largest amount. In contrast, the brainstem, shown in Figure 2
E, exhibited low levels of activity for all but the most difficult trials.
These difficulty-triggered bursts of brainstem activity show a strong parallel with locus coeruleus activity found in studies of monkeys by Aston-Jones and colleagues, in which the animals performed attentional tasks (Aston-Jones and Cohen, 2005
; Aston-Jones et al., 1999
; Usher et al., 1999
). When the monkeys were performing the task well, the locus coeruleus exhibited a “phasic mode” of firing, in which it responded phasically to attentional targets but had tonically low levels of activity otherwise. This phasic LC firing was not purely stimulus-driven, but instead was involved in the animals’ task performance, as its timing tracked the monkeys’ behavioural responses more closely than it tracked stimulus presentation (Clayton et al., 2004
).
We propose that the phasic responses to target stimuli observed in monkeys may play the same role as the phasic responses to the most difficult trials in our fMRI data: each such response signals an attentional challenge, helping to maintain good task performance in the face of draining cognitive resources.
The more gradual difficulty-related increase in activation exhibited by the right frontal region suggests that, unlike the brainstem that is recruited only for the most pressing challenges, frontal cortex may be involved in a broader range of attentional tasks. Bushara et al. (2001)
, using a very similar audiovisual simultaneity task but in a blocked-design PET study, found that an almost identical right frontal region increased in activity with increasing task difficulty (see their Figure 3
), thus providing an independent corroboration of our finding. However, they did not observe brainstem activation, probably because their blocked design grouped together trials of a given SOA-type, thereby reducing both the unpredictability and the difficulty of the task. Their difficulty-related pattern of right frontal but not brainstem activation may correspond to that elicited by the medium-difficulty trials in our task.
The fact that blocked-designs remove trial-by-trial unpredictability is also relevant to the interpretation of a study from the Aston-Jones lab (Rajkowski et al., 2004
). In that experiment, trials of two different difficulty levels were used. The trials with greater difficulty were found to elicit neural activity with a longer latency, but not a greater magnitude, than that induced by the easy trials. That study, like the Bushara et al. (2001)
experiment discussed above, used a design in which trials of equal difficulty were blocked together. Our results suggest that in order to elicit differentially greater LC activity, the greater unpredictability offered by fully intermixing trials of varying difficulties may be required. Moreover, it may be necessary to use trials spanning several levels of task difficulty, rather than just two. A trial presents a true attentional challenge only if it stands out as markedly more difficult than those immediately preceding it. Under our hypothesis, extra bursts of LC activity function as an “alarm system,” signalling when such challenges occur.
Is the Brainstem Activation Really in the LC?
Although the the brainstem activation in our data closely matches the anatomical location of the locus coeruleus (Mai et al., 1997
), fMRI on its own lacks the spatial resolution needed to distinguish between the many small nuclei that cluster together in that part of the brain. An excellent summary of the anatomical positions of these nuclei in the human brainstem can be found in Parvizi and Damasio (2003)
: nuclei located nearby to the LC include the pontine raphe nucleus, the pontis oralis nucleus, the parabrachial nucleus and the superior cerebellar peduncle. Our fMRI observations on their own are insufficient to rule out such nuclei as possible sources. However, several other types of evidence are relevant for assessing whether a region may correspond to a particular nucleus, over and above just spatial location. For example, the raphe nucleus produces serotonin, a neurotransmitter which has not been implicated in phasic attentional signalling, and which therefore would not be expected to be involved in the task used here. In the present study, three factors support our identification of the brainstem activation as coming from the LC: the pattern of neural activity in the region, the pattern of functional connectivity, and the task-conditions that cause it to activate.
As was described above, the way in which the brainstem activated only for the most difficult trials is similar in several respects to the phasic LC firing observed by Aston-Jones and colleagues, in studies of monkeys performing attentional tasks (Aston-Jones and Cohen, 2005
; Aston-Jones et al., 1999
; Usher et al., 1999
). The pattern of functional connectivity is also consistent with this region being the LC: the brainstem region shows functional connectivity with frontal cortex, in accord with animal studies showing that the LC and frontal cortex are connected both functionally and anatomically (Arnsten and Goldman-Rakic, 1984
; Dalley et al., 2001
; Jodo et al., 1998
; Porrino and Goldman-Rakic, 1982
). The fact that the coactivated frontal region was in the right hemisphere is consistent with anatomical studies showing that the human noradrenergic system may also be somewhat right-lateralised (Oke et al., 1978
). Finally, the task-conditions that caused the brainstem region to activate are also consistent with it being the LC. We used a cross-modal attentional task in which the trials’ onset-times varied unpredictably; studies in rats and monkeys have shown that the LC responds to stimuli from multiple sensory modalities (Foote et al., 1980
), fires more to behaviourally relevant stimuli (targets) than to irrelevant distractors (Usher et al., 1999
), and is needed especially during attentional tasks that are made difficult by temporal unpredictability or distractor interference (Carli et al., 1983
; Cole and Robbins, 1992
, Witte and Marrocco, 1997).
Despite these converging lines of evidence, our identification of the brainstem region as the LC must remain somewhat tentative. Other fMRI studies have presented a variety of types of evidence in support of claims of LC activation, and, as is discussed below, each of these types of evidence has its own strengths and imperfections. Any such study, including the present one, can at best hope to serve as a useful starting point for further investigations. The strongest potential source of cross-validatory evidence, we believe, is likely to stem from studies conducted in parallel both in humans and in animals.
Other fMRI Studies Showing LC Activity
The present study looks at the role of the LC in directing attentional resources specifically to some items, namely difficult trials, and not to others. However, the LC is also involved in non-specific arousal, which is not directed preferentially to any given stimulus. This non-specific arousal is often induced by stress. Relatively few human neuroimaging studies have reported locus coeruleus activation (Coull et al., 1999
; Dunckley et al., 2005
; Knutson et al., 2000
; Liddell et al., 2005
; Sterpenich et al., 2006
; Sturm et al., 1999
; Tracy et al., 2000
) and, amongst these, several activated the LC using stress of various sorts: Tracy et al. (2000)
used aversive loud noises, Knutson et al. (2000)
used monetary punishment, Dunckley et al. (2005)
used pain stimuli, Liddell et al. (2005)
presented facial expressions of fear, and Sterpenich et al. (2006)
presented emotionally aversive images such as snakes. Sturm et al. (1999)
used a non-specific but also non-aversive alertness task, in which subjects had to respond rapidly with a key-press every time a light was flashed. Of the studies reporting LC-activation, probably the most relevant to the present work is a PET study by Coull et al. (1999)
, who found that the α2-receptor agonist clonidine impaired subjects’ performance of an attentional task (rapid serial visual presentation, or RSVP) and suppressed resting state LC activation, probably via stimulating inhibitory α2-autoreceptors in LC neurons. This finding further supports the role of the LC in attention, although it cannot speak to the issue of challenge-driven attention, as it used a blocked design and did not present task demands that varied unpredictably from moment to moment.
In all of these studies, as in ours, the identification of an activation site as the locus coeruleus must remain tentative, on grounds of the limited spatial resolution of fMRI and the very small size of that brainstem nucleus. As was discussed above, the task conditions used and observed patterns of neural activity can provide corroborating evidence.
However, additional types of measurement can also be used, over and above the standard fMRI and behavioural measures used here. One such approach is to use noradrenergic drugs, as in the Coull et al. (1999)
study cited above. Drug studies, however, do not solve the problem of LC-identification. The effects of drugs on the LC depend both on dosage and on the subjects’ arousal level (Arnsten, 2006
). Moreover, they affect the activation not only of noradrenaline’s source (the LC), but also of the transmitter’s targets, including many cortical areas such as prefrontal and parietal, and also different transmitter systems such as that of dopamine (Pan et al., 2004
). Thus, the use of a noradrenergic drug guarantees neither that the LC will be activated, nor that observed brainstem activation must have the LC as its source.
Recent anatomical MRI studies have used neuromelanin as an in vivo marker of the LC in humans (Sasaki et al., 2006
; Shibata et al., 2006
, 2007
). These results show promise for improving the localisation of the LC in structural scans, but attempts to ascribe fMRI activity to the LC still face the problem of determining whether activation observed in the lower resolution BOLD images corresponds to the LC tissue identified in a higher resolution anatomical scan, as opposed to tissues from other nearby nuclei. Future studies acquiring high-resolution thin slices focused around the brainstem might be helpful for homing in on the LC, possibly using cardiac-gating to counter against pulsatory motion.
Measures of sympathetic nervous system activity have been found to be correlated with LC activation, including skin conductance (Tracy et al., 2000
) and pupil-dilation (Gilzenrat et al., 2003
; Sterpenich et al., 2006
). However, multiple transmitter systems affect these measures, meaning that although they may sometimes correlate with LC activity, they do not index it directly. For example, the sympathetic pathway acts to dilate the pupil and ends at a noradrenergic terminal (Patel, 1999
), but the resulting level of dilation is controlled by the balance between this sympathetic input and the opposing parasympathetic input which acts to constrict the pupil. Therefore, it is possible that not all pupil-dilating tasks may involve LC activity. For example, Siegle et al. (2003)
found that the difficulty-level of a working memory task correlated both with pupil dilation and with fMRI activity in prefrontal cortex, but no such correlation was found with activity in the brainstem. We hypothesise that only a subset of pupil-dilating tasks involve the LC: those that are in response to unpredictable external challenges.
This hypothesis is consistent with the seminal studies of Kahneman and Beatty, who showed that the exertion of what they called “mental effort” is accompanied by pupil dilation across a wide variety of tasks (Beatty, 1982
; Kahneman, 1973
; Kahneman and Beatty, 1966
). Kahneman described this process as a form of arousal, i.e., autonomic change that is due to cognitive exertion, not “such miscellaneous determinants of arousal as muscular strain or anxiety” (Kahneman, 1973
). As illustrated in Table 1
, this “mental effort” spans both the factors to which control responds, as its accompanying pupil dilation was found both for externally driven tasks such as auditory signal detection and internally controlled exertions such as working memory and mental arithmetic (Beatty, 1982
). Thus, Kahneman’s “mental effort” encompasses a very large range of cognitive exertions; challenge-driven attention specifically describes the allocation of cognitive resources in response to the fluctuating demands thrown at us by our environment.
Relations to Other Types of Attention, and to ADHD
The relations between challenge-driven attention and other attentional varieties are illustrated in Table 1
, which categorises the different processes along two dimensions: what is controlled, and what that control is in response to. Kahneman’s “mental effort” occupies the same position as challenge-driven attention along the dimension of what is controlled, but spans the whole length of the other dimension, as it responds both to internal and to external events. In contrast, executive attention spans the entire dimension of what is controlled, as its schemas and plans control not only the allocation of cognitive resources but also where those resources are to be directed (Posner and Fan, 2008
; Posner and Petersen, 1990
).
Stimulus-driven attention is co-located with challenge-driven attention along the dimension of what the control is in response to: both processes respond to events in the external world. It seems likely, therefore, that the two processes might share some neural systems in common. Indeed, converging evidence from several human neuroimaging studies (Corbetta and Shulman, 2002
) shows that stimulus-driven attention activates a right-lateralised ventral frontoparietal network, including the right inferior frontal region that was activated in the present study. This region has also been found to be activated by the detection of low-frequency “oddball” events and by novel stimuli (Downar et al., 2002
), both of which are examples of unpredictable events that may require attentional resources in order to be evaluated. A quite different set of tasks has also been found to involve this right inferior frontal cortex region: response-inhibition (Aron and Poldrack, 2006
; Aron et al., 2003
, 2004
; Bunge et al., 2002
; Rubia et al., 1999
). In these tasks, the sudden and unpredictable occurrence of a “stop” or “no-go” signal requires the recruitment of extra cognitive resources in order to inhibit a prepotent response.
According to our hypothesis, the underlying process that stimulus-driven attention and response-inhibition have in common is challenge-driven attention. This commonality may explain why both tasks activate the same right frontal region. We hypothesise that other types of challenge-driven attentional tasks will also be found to activate this region, with the most difficult challenges also recruiting the locus coeruleus. The role of the right frontal region in response inhibition is especially interesting in connection with ADHD, a disorder in which such inhibition has been found to be particularly impaired (Rubia et al., 1999
), and which has been found to be amenable to treatment by noradrenergic drugs (Arnsten, 2006
; Scahill et al., 2001
; Solanto, 1998
). This suggests that response-inhibition, like the crossmodal task used in the present study, requires the kind of challenge-driven attention that is supported by the hypothesised frontal-LC network, and that impairments in this network may underlie several of the symptoms of ADHD. This hypothesised relation to ADHD remains, of course, no more than a theoretical speculation until experiments are carried out to test it. It is our hope that the present discussion may help to motivate future investigations of these issues.
A Recent Parallel Proposal: Sarter on “Attentional Effort”
A very interesting paper, independently developing closely related ideas about attention but in the context of the cholinergic system, was recently published by Martin Sarter and colleagues, entitled: “More attention must be paid: the neurobiology of attentional effort” (Sarter et al., 2006
). In that paper, Sarter describes attentional effort as the “motivated activation of top-down mechanisms to counter performance decline” (p. 147, Figure 1
) and argues that “attentional effort represents a viable construct for cognitive neuroscience research” (p. 145). Sarter primarily discusses the possible role of acetylcholine in attentional effort (Kozak et al., 2006
), but also considers the possible involvement of the dopaminergic (p. 153) and noradrenergic systems (p. 155).
Thus, there are strong parallels between Sarter’s proposal and ours, with both frameworks hypothesising attentional control by reciprocal loops between prefrontal cortex and midbrain regions releasing neuromodulatory transmitters. We believe that this convergence of theoretical and empirical findings lends support to the concept of challenge-driven attention, and raises interesting new research questions about the functional and anatomical interconnections between the cholinergic and noradrenergic systems.
However, there are also significant differences between Sarter’s proposal and ours. These are primarily differences of emphasis: in Sarter’s proposal, the trigger for increases in attentional effort comes from feedback about declining performance, whereas in our hypothesis we emphasise the role of unpredictable fluctuations in task demands. These approaches are by no means mutually incompatible, and may well simply be different vantage points on the same underlying process. Nonetheless, the two approaches suggest different types of experimental tests. For example, in the simultaneity task of the present study, the subjects receive no feedback at all about their performance, but they are confronted with task-demands that vary unpredictably from trial to trial. A testable hypothesis is that these types of circumstances may trigger noradrenergic mechanisms of attentional control, whereas in tasks where feedback is given, more gradual declines in performance may activate cholinergic attentional processes. The process of attentional effort, or “challenge-driven attention”, has been relatively underexplored to date, and may offer many potentially fruitful questions for future research.
We propose that the concept of challenge-driven attention is a useful theoretical addition to the varieties of attention that have previously been considered. This psychologically defined concept has a direct biological substrate, namely a frontal-brainstem network of correlated neural activity. We hypothesise that the anatomical subcomponents of this network map onto the cognitive subcomponents of the task: the brainstem signals that an attentional challenge is occurring, and right frontal cortex allocates cognitive resources in response. Anatomical and physiological evidence suggests that the observed brainstem activity may originate in the locus coeruleus, thereby bridging between findings in humans, rats and monkeys. Deficits in this network for challenge-driven attention may underlie ADHD, a disorder in which both the right frontal cortex and the noradrenergic system are crucially involved. These hypotheses clearly require many tests beyond the data presented here. By describing a frontal-brainstem network for challenge-driven attention, and by laying out specific task conditions that drive it, our results may help to provide a framework for such explorations, both in humans and in animals.
The authors have no competing financial, personal, or professional interests relevant to this publication.
R.D.S.R. was supported in part by a Postdoctoral Fellowship from the McDonnell-Pew Program in Cognitive Neuroscience. The authors would like to thank Adam Aron, Jackson Beatty, Stephen Engel, David Lischner, Gordon Logan, Steve Keele, Michael Posner and Steve Stufflebeam for very helpful comments on various versions of the manuscript. The fMRI scans were conducted at the MGH-NMR Center/Martinos Center for Biomedical Imaging.
Carli, M., Robbins, T. W., Evenden, J. L., and Everitt, B. J. (1983). Effects of lesions to ascending noradrenergic neurones on performance of a 5-choice serial reaction task in rats; implications for theories of dorsal noradrenergic bundle function based on selective attention and arousal. Behav. Brain Res. 9, 361–380.
Gilzenrat, M. S., Cohen, J. D., Rajkowski, J., and Aston-Jones, G. (2003). Pupil dynamics predict changes in task engagement mediated by locus coeruleus. Society for Neuroscience Abstracts, Program No. 515.19.
Posner, M. I., and Fan, J. (2008). Attention as an organ system. In Topics in Integrative Neuroscience: From Cells to Cognition, J. Pomerantz ed (Cambridge, Cambridge University Press). To appear In Neuro-biology of Perception and Communication: From Synapse to Society the IVth De Lange Conference, pp. 31–61.
Scahill, L., Chappell, P. B., Kim, Y. S., Schultz, R. T., Katsovich, L., Shepherd, E., Arnsten, A. F., Cohen, D. J., and Leckman, J. F. (2001). A placebo-controlled study of guanfacine in the treatment of children with ticdisorders and attention deficit hyperactivity disorder. Am. J. Psychiatry 158, 1067–1074.
Sturm, W., de Simone, A., Krause, B. J., Specht, K., Hesselmann, V., Radermacher, I., Herzog, H., Tellmann, L., Muller-Gartner, H. W., and Willmes, K. (1999). Functional anatomy of intrinsic alertness: evidence for a fronto-parietal-thalamic-brainstem network in the right hemisphere. Neuropsychologia 37, 797–805.