Event related potentials reveal that increasing perceptual load leads to increased responses for target stimuli and decreased responses for irrelevant stimuli
1
Department of Communication Sciences and Disorders, University of South Carolina, Columbia, SC, USA
2
Department of Psychology, University of Hull, Hull, UK
3
School of Psychology, University of Aberdeen, Aberdeen, UK
4
School of Psychology, University of Nottingham, Nottingham, UK
5
Department of Psychology, University of South Carolina, Columbia, SC, USA
Lavie (1995) have suggested that perceptual processing is influenced by perceptual load. Specifically, relevant information receives additional processing in high load situations exhausting the available capacity. On the other hand, irrelevant information receives less processing with increasing load on a relevant task, as there is a reduced amount of residual processing available. Rees et al. (1997) provided the first physiological evidence for this model, showing this pattern in a functional magnetic resonance imaging study. Likewise, Handy et al. (2001) offered supporting evidence measuring event related potentials (ERPs). Both of these studies presented irrelevant information in peripheral vision. Here we manipulated load while using the identical stimuli and the same task (a peripheral gap judgment task) with centrally presented irrelevant stimuli. ERPs show the pattern predicted by Lavie and colleagues, specifically for the N1 component. This work offers further evidence that visual attention modulates relatively early processing of perceptual information. Specifically, increasing load resulted in stronger N1 responses to relevant information and weaker N1 responses to irrelevant information.
In order to respond effectively to our environment, the visual system must selectively process relevant items while concurrently suppressing irrelevant signals. The processing devoted to irrelevant stimuli is one of the enduring topics in psychology. Proponents of early selection suggest that unattended stimuli are attenuated at the initial stages of processing. According to this view, unattended stimuli receive little higher-order processing (Broadbent, 1958
). On the other hand, supporters of late selection models believe both attended and unattended information receive substantial processing, with a processing bottleneck only occurring at a late stage (e.g., response selection) (Deutsch and Deutsch, 1963
), with irrelevant material being substantially processed. Surprisingly, different behavioral studies appear to support for each of these apparently contradictory models of perception. Lavie and colleagues (Lavie, 1995
; Lavie and Robertson, 2001
; Lavie and Tsal, 1994
) have provided an elegant model to account for this paradox. They argue that the split between ‘early’ and ‘late’ selection is a false dichotomy, driven by different task demands. According to their model, the visual system has a limited capacity to process information. When the visual scene is relatively impoverished (imposing a relatively low perceptual load), both attended and unattended information will be processed (i.e., late selection). On the other hand, when confronted with very complex, rapidly changing scenes the visual system is overwhelmed, and only attended information can be processed (i.e., early selection). This model powerfully explains evidence from the supporters of both early and late selection. Importantly, according to this model the extent to which irrelevant stimuli are processed does not only depend on the participants’ intention, but is dependent on the processing demands of the relevant stimuli. In low load situations, irrelevant information will be processed to a high level, regardless of the participants’ intention. To summarize, the perceptual load model suggests that the visual system has a limited capacity, and that the role of selective attention is to prioritize the deployment of attention in high load situations.
In addition to the behavioral predictions, the perceptual load model also makes clear physiological predictions (Handy, 2000
). Specifically, this model makes two predictions. First, brain activation in response to attended information should be positively correlated with perceptual load: increasing task demands will result in increased processing. Second, brain activation in response to unattended stimuli should be negatively correlated with perceptual loads: during difficult tasks there will be little residual processing capacity and therefore unattended stimuli should not drive a powerful neural response. It should be noted that the first prediction is compatible with many models of perceptual processing: the idea that increasing task demands will lead to increasing neural activation is not unique to the perceptual load model. On the other hand, the second prediction is counterintuitive and not compatible with many conventional models of attention. Examining the influence of perceptual load on neural response offers a way to both test the perceptual load model of attention as well as offering a tool to determine both the brain regions involved with attentional modulation and the time course of top-down control. For example, neuroimaging techniques such as functional magnetic resonance imaging (fMRI) can reveal whether early cortical regions such as V1 (striate cortex) respond differently to attended compared to unattended information, allowing us to infer whether these visual centers always process information in the same way, or whether top-down control modulates the neural response. On the other hand, electrophysiological techniques such as event related potentials (ERPs) can determine whether attended and unattended information lead to different neural responses within the first 200 ms of processing, or whether only later responses are modulated by attention. Crucially, the perceptual load model makes clearly testable physiological predictions, allowing the model to be validated and potentially offering insight into the anatomy and timing of the stages of perceptual processing.
The first study to directly test the physiological predictions of the perceptual load model was conducted by Rees et al. (1997)
. In this fMRI study the participants were asked to do either a simple (low perceptual load task) or difficult task (high perceptual load task). Specifically, words were presented at the center of the screen and during the low-load blocks subjects were instructed to press a button when the words were printed in uppercase letters, and in the high load task to press the button when the words were bisyllabic. During some blocks, the background was a static image, while in other blocks the peripheral regions of the display presented a moving ‘starfield’ pattern, which the participants were asked to ignore throughout the experiment. When subjects performed the difficult central task, activity in the motion sensitive regions of the brain were reduced compared to when the subjects did the simple central task. This finding accords with the perceptual load model: during the high load task, more attention was required by the central task, so there was less residual capacity left for motion processing.
This influential study demonstrates that the perceptual load model makes testable physiological predictions. However, some have noted a pair of limitations in this seminal work (Handy et al., 2001
). First, very different tasks were used for the two levels of perceptual load. The difficult language task may require drive very different neural processing than the letter case identification task, regardless of perceptual load. Second, the block-design MRI design offers fairly poor temporal resolution. Therefore, it is unclear whether these findings show differences in initial perceptual processing or later influences of top-down feedback.
Yi et al. (2004)
also examined perceptual load in a functional MRI study. In their study participants viewed pictures of central (relevant) faces surrounded by (irrelevant) scenes of places. The participants were tested in situations of low perceptual difficulty, high perceptual difficulty and a perceptually easy task that required high working memory load. The experimenters measured the response of the parahippocampal cortex (PPA), which typically shows a strong response to pictures of places. They found that novel irrelevant stimuli generated more robust responses than repeated stimuli under low perceptual load or high working load. However, the PPA did not show a novelty effect in the high perceptual load situation, as predicted by Lavie’s model. As the same task was used for the low and high perceptual load task, it addresses one of the potential criticisms of the study by Rees et al. (1997)
.
Likewise, Pinsk et al. (2004)
used fMRI to investigate perceptual load. They presented target stimuli to the attended hemifield, with distractors simultaneously presented to the unattended hemifield. The target stimuli were either unambiguous (a single complex picture) or ambiguous (alpha blending two complex images, one with 70% weighting and the other with 30% weighting), while the distractor stimuli were composed by blending two pictures (each with 50% weight). In the low-load blocks participants were asked to count the number of nonambiguous targets, while in the high load blocks the task was to count the number of times the same target stimulus was presented twice in a row. Thus, the stimuli were identical across tasks, though the task differed. The authors found that activity to the target stimuli increased with increasing attentional load. On the other hand, increasing attentional load correlated with decreasing responses to the distractor items in areas V4 and the inferior temporal cortical area referred to as TEO, but not the early visual centers of V1 and V2. Therefore, this work suggests that the earliest cortical visual centers are not modulated by load.
A study by Handy et al. (2001)
attempted to use ERPs to investigate this topic. ERPs provide excellent temporal resolution that is particularly well suited for identifying and discriminating the brain’s initial cortical responses to external stimuli. While techniques such as fMRI can identify brain activation in low level sensory cortices, the sluggish nature of blood flow measured by fMRI make it difficult to determine the temporal sequence of these activations, therefore it can be difficult to dissociate feedforward versus feedback modulation (particularly once data has been temporally smoothed). Furthermore, in their second experiment both high and low load conditions used the same task: a simple letter discrimination task (participants had to judge whether a foveally presented stimulus was an A or H). During low load trials, the target letters were presented in isolation, while in the high load task the target letters were masked and presented for a shorter interval. The (foveal) target letters were presented in 75% of trials, while irrelevant parafoveal distractor items were presented in the remaining trials. P1 is a positive electrophysiological component that occurs around 120 ms after the onset of a visual target. Combined ERP and imaging studies have linked the P1 to initial sensory input or bottom-up processing in fusiform gyrus (Herrmann and Knight, 2001
). Previous studies suggest that the amplitude of P1 is modulated by spatial selection (e.g., larger amplitude signals are observed if an object appears at an expected location versus an unexpected location). Handy and colleagues found that the P1 component measured at electrode positions POZ and OZ (posterior locations) were statistically larger for distractors that occurred during low load situations than those that occurred under high load, compatible with predictions of the perceptual load model of attention.
However, the crucial prediction of the perceptual load model specifically predicts an interaction effect: with increasing load correlating with stronger responses to target stimuli, but weaker responses to distractor stimuli. Unfortunately, Handy et al. (2001)
do not report the effect of perceptual load on the foveal target stimuli. This is probably due to the fact that the target stimuli were physically different in the low and high perceptual load studies. Therefore, with their design, different P1 responses to the high and low load target stimuli might reflect different attentional load or merely different physical properties. However, in the discussion the authors suggest that there is evidence for an interaction of the P1, based on their present work combined with some of their previous findings (Handy and Mangun, 2000
). However, inspection of their earlier work (Handy and Mangun, 2000
) reveals that stronger P1 components are not always seen with increasing perceptual load: rather they found that perceptual load results in stronger P1 responses only when a target appears at an expected location. In this same work the authors, supporting previous findings by Hillyard et al. (1998)
, suggest that attention-related modulations in the N1 may arise under any conditions of high perceptual load. In other words, N1 attentional effect reflects a limited-capacity discriminative process. The N1 is a posterior negative deflection observed around 160 ms after the onset stimulus onset, which is believe to be generated in the lateral extrastriate cortex (Herrmann and Knight, 2001
). While the P1 is often described as being associated with spatial selection in general, the N1 appears to be related with object-selective attention (Martinez et al., 2007
).
Our present study was designed to extend the work by Handy et al. (2001) and Rees et al. (1997)
. Specifically, we aimed at making two major improvements. First, we wanted to use an identical task with physically identical stimuli across high and low loads. As noted, a criticism of Rees et al. (1997)
is that their two perceptual loads used very different tasks, which may make different cognitive demands. On the other hand, Handy et al. (2001)
used physically different target stimuli, making it difficult to compare neural responses to these items. Our second goal was to present the irrelevant items at the center of the display, with target information more peripheral in order to avoid a possible confound in the work of Handy and colleagues. Both Rees et al. (1997) and Handy et al. (2001)
use foveal targets with irrelevant stimuli presented in the periphery. Many models of attention other than Lavie’s perceptual load model might predict their results in terms of foveal versus peripheral location. Thus, for example, during high load it is logically possible that we become less responsive to peripheral/parafoveal stimuli. Alternatively, in the previous studies the participants may have had a stronger incentive to maintain fixation during the hard task than the easy task (e.g., the low load task might not require foveal perception). Since our design positioned the irrelevant items centrally/foveally, while the target information was presented more peripherally/parafoveally, we can distinguish between these competing explanations. While it has been demonstrated that both central and peripheral distractors are modulated by perceptual load (Beck and Lavie, 2005
), it is still possible that the previous physiological measures may reflect different fixation strategies.
To achieve these goals, we used a gap judgment task, as illustrated in Figure 1
, inspired by behavioral task used by Mattingley et al. (2006)
. At the start of each block, the participant was instructed to either compare the top-left gaps with bottom-right gaps or to compare the top-right gaps with the bottom-left gaps. This was done by presenting a diagonal arrow, informing the participant which sides of the upcoming diamonds were to be monitored. This arrow was green prior to blocks of low load trials and red prior to blocks of difficult trials, allowing the participants to anticipate the difficulty of the block. During the subsequent target trials, the participant was presented with a diamond that had a notch cut into each side. The task was to decide whether the designated top or bottom gap was larger (responding by pressing either an upper or lower button). On a minority of trials, a large, salient distractor was presented at fixation, which the participant was asked to ignore. Crucially, throughout low load blocks, all of the gap judgments were relatively easy, while on other blocks (high load) the required gap judgments were difficult. As each diamond had two pairs of gaps (both an easy judgment pair and a difficult judgment pair), the visual stimuli were identical: the only difference was the instructions given at the start of the block regarding the pair of gaps that the participant needed to compare. The irrelevant gaps did not predict the correct answer for the relevant gaps, so the hard trials had to be solved by attending to the gaps of similar size. Note that previous studies have presented distractor stimuli in the periphery, with the task at the center of fixation. In contrast, with our task the distractor stimuli was centrally positioned with the target information in the periphery. Our aim was not to spatially influence attentional processing – previous ERP studies have indicated that participants can selectively attend to bilateral peripheral locations while relatively attenuating responses to central stimuli (Müller et al., 2003
). Rather, our design eliminates the potential confound that participants may be less likely to maintain strict fixation during relatively easy tasks than difficult tasks.
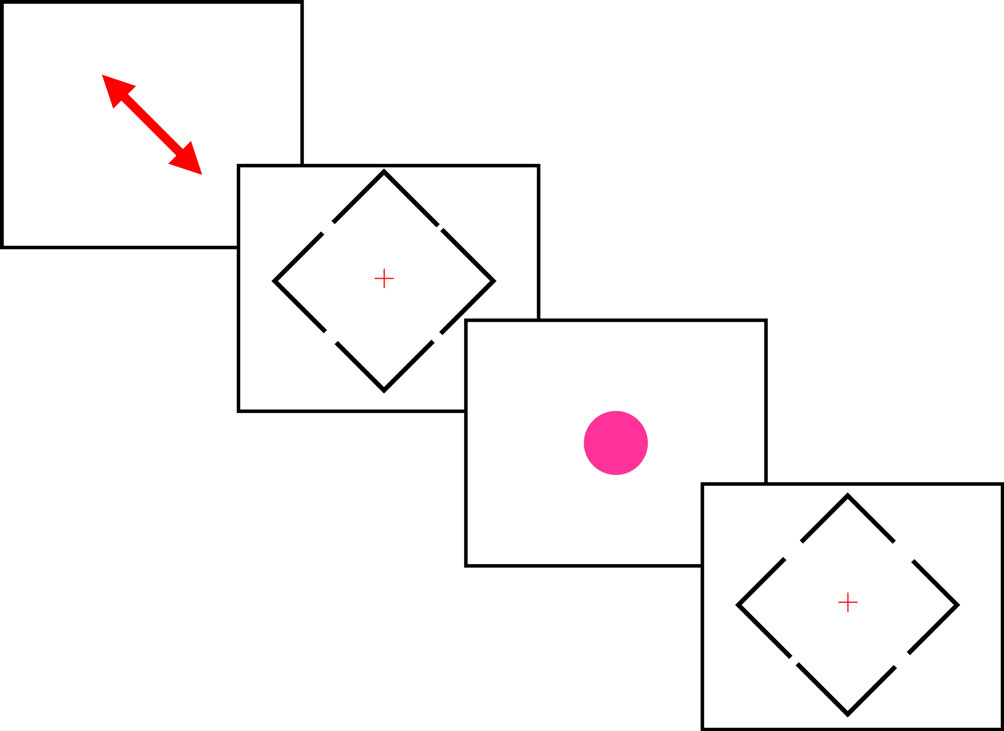
Figure 1. A schematic illustration of the sequence of events. Each block of trials began with a diagonal arrow that indicated the locations the participant was expected to attend. The color of this arrow was either green (indicating a block of easy judgments) or red (indicating a series of difficult judgments, as shown here). Subsequently, the participant observed a series of blue diamonds. The participant was requested to make a decision regarding whether the top or bottom gap was larger by pressing an upper or lower button. Note that each diamond included two pairs of gaps: an easy pair and a difficult pair, so the visual stimuli were identical on the easy and difficult blocks, with only the initial diagonal arrow indicating whether the participant was comparing the easy or difficult pair. Occasionally, a bright fuchsia-colored circle interrupted the stream of diamonds. The participant was asked to ignore these stimuli.
During the ERP recording we asked participants to completely ignore the irrelevant stimuli. This ensures that during the ERP recording these stimuli were truly irrelevant to the participants. If perceptual load modulates attentional selection, we expected an interaction between stimulus type (task relevant targets and irrelevant stimuli) and perceptual load (low during blocks of easy gap judgments and high during blocks of difficult discriminations). Specifically, we were looking for waveforms that showed stronger responses to targets with increasing perceptual load while showing weaker responses to irrelevant stimuli with increasing perceptual load.
As we did not collect behavioral responses to the central (irrelevant) stimuli during ERP recording, we collected pilot behavioral data from a separate group of 10 participants to ensure that our specific paradigm elicits the behavioral pattern reported by Lavie and colleagues. This pilot study was identical to the main experiment, except that we asked participants to press either button whenever they saw the central purple item (and did not ask participants to wear the ERP electrodes). Analysis of this data replicated the classic perceptual load findings: e.g., the low load versus high load contrast revealed faster responses to both peripheral gaps (596 ms versus 837 ms) and purple central items (589 ms versus 635 ms).
Thirty-three healthy individuals participated in this study. All participants had normal (or corrected to normal) vision. All subjects were undergraduate students at the University of South Carolina and gave informed consent to take part in the experiment.
Participants were seated 117 cm from a 29-inch cathode ray tube computer monitor (NEC Multisync XM29, 685 cm diagonal visible image) with stimuli presented at 640 horizontal and 480 vertical pixels. All stimuli were presented on a black background, for high definition in a darkened room. Throughout the experiment a small white cross (0.9° high and wide) was presented at the center of the screen, and the participants were asked to maintain fixation throughout the session. At the beginning of each block of stimuli, a large diagonal arrow appeared on the screen for 5000 ms as an indication of which sides of the stimuli subjects should be attending to (either top-left and bottom-right positions or top-right and bottom-left positions). The participants were informed that the color of this arrow indicated how hard the upcoming series of trials was going to be: a red arrow preceded blocks of difficult judgments (high perceptual load task) and a green arrow preceded blocks of easy gap judgments (low perceptual load task). After a short 2000 ms wait, a central fixation cross was presented on the screen for 1000 ms followed by the first target stimuli.
The target stimuli comprised thin blue (24-bit color 0x0000FF) lines, making up a diamond shape (8.2° wide and 8.2° high, see Figure 1
), with small gaps of varying size in each of the four sides. Participants were asked to judge which of the two gaps on opposite sides of the diamond shape was the larger and to respond as quickly and as accurately as possible. The gap sizes varied so that no same identical gap sizes were displayed in the same trial (i.e., a correct response was always possible). The mouse was positioned sideways so that pressing the upper-most button indicated that the participant judged the top gap on the diamond to be larger than the bottom gap. Similarly, pressing the lower key on the mouse indicated that the bottom gap was judged to be larger than the top gap. Target items remained visible until the participant made a response or 10,000 ms had elapsed. Note that every display included both an easy and a hard comparison, with the pair of gaps to be judged by the observers cued by the block instructions. In this way we were able to ensure that the stimuli in the two different load conditions were identical. On a few (20%) trials a large bright purple (2.4° 0xFF00FF) ‘blob’ (the irrelevant stimulus) appeared at the center of the screen instead of the target. Presence of a distractor was entirely unrelated to target conditions. Participants were asked to ignore these stimuli completely. These irrelevant stimuli were presented for 500 ms. The target and irrelevant stimuli were followed by a blank screen that lasted for 2000 ms, and then a fixation stimulus was displayed for 1000 ms prior to the next trial.
Trials were presented in four blocks of 100 trials, with the irrelevant stimulus appearing in 20 of those trials. Two of the blocks consisted of ‘easy’ stimuli and the other two blocks consisted of ‘hard’ stimuli. These four blocks each appeared in a random order. Prior to the experimental blocks, participants completed a practice phase of four blocks of 40 trials each, again with two ‘easy’ blocks and two ‘hard’ blocks appearing in a random order. The irrelevant stimulus did not appear in this practice phase.
Scalp potentials were recorded using a 128-channel geodesic net. Prior to beginning the behavioral task, impedances were checked and electrodes adjusted so that they were all below 50 KΩ. Individual channels that showed truncation or poor impedances during this calibration were removed from further analysis. The net was connected to a high input impedance amplifier and EEG’s were sampled at 250 Hz continuously throughout the session. Data was processed using NetStation 3.0 (www.egi.com), in the following stages. First, the recordings were smoothed using a 55-Hz low pass filter, attenuating the effects of the 60 Hz electrical line noise. The continuous recording was then segmented into individual trials, with each segment spanning 100 ms prior to the stimulus onset and continuing until 500 ms after stimulus onset (150 samples per segment). We next visually inspected the initial segments from each participant to ensure that data from the eye muscle channels appeared robust. This stage led us to reject four participants who showed poor recording from these critical electrodes. Next, segments were subjected to an artifact detection algorithm, rejecting trials and channels that were not accurate reflections of brain activity (most commonly due to eye blinks). This artifact rejection included the following criteria: channels rejected if amplitude exceeded 200 μV or if the amplitude changed by >200 μV within the segment or showed no variance at all during the segment. We rejected trials where eye blinks or eye movements occurred, using a detection threshold of 70 μV for the relevant channels. Channels were completely excluded from analysis if they consistently were rejected due to the above listed criteria (i.e., we did not analyze channels that were identified as bad in at least 25% of the trials). We excluded individuals where eye movements or other artifacts accounted for more than one third of the trials in any condition. This criterion led us to reject the data from 10 participants (all of these participants showed a high number of blinks in response to the rare and bright irrelevant blobs). The next stage of processing was data averaging, where individual segments from the same condition were collapsed, resulting in one mean for each condition at each channel. The resulting data files were then individually inspected, with channels with behavior that was clearly different than their neighbors excluded from further analysis. We then conducted bad channel replacement, using neighboring good channels to interpolate data for the bad channels. Next, we conducted signal averaging (so the summed voltage from all channels was 0 μV, eliminating artifacts caused by using a vertex reference: including signal variability in the reference channel and artifactual increases in signal difference with larger topographic distance from the vertex). The final preprocessing step was baseline correction: the voltage of all time-points at each channel was either increased or decreased by a constant amount so that the mean amplitude for the first 100 ms (i.e., the portion of the segment that occurred prior to stimulus onset) was 0 V.
For each subject, the P1 was identified as the most positive sample that occurred in the time window of 110–170 ms after stimulus onset, while the N1 was the most negative sample occurring between 180 and 240 ms post stimulus onset. To replicate Handy and Mangun’s analyses P1 values were estimated by computing the mean voltage at the neighboring electrode sites O1/O2. N1 was measured separately for each hemisphere based on the measured voltages at P7/PO7 (left) and P8/PO8 (right). Visually evoked potentials P1 and N1 tend to be maximal at these sites (Mangun and Hillyard, 1991
).
The behavioral analysis examined each participant’s median response time for each condition. Behavioral data was recorded for 18 of the 19 participants included in the ERP analysis. Repeated-measures t-tests confirmed that subjects were significantly slower at responding to the more difficult visual judgments [t(17) = 6.4, p < 0.001; group mean response time 990 ms versus 685 ms]. Arc-sin transformed accuracy data revealed significantly more errors in the difficult task [t(17) = 2.16, p < 0.045; mean accuracy 94.9% versus 97.9%]. This suggests that the effect found in response times does not reflect a simple speed-error trade-off.
The signals measured by electrodes that are particularly sensitive to the P1 are shown in Figure 2
. The P1 data were subjected to a two-factor 2 × 2 repeated measures ANOVA. The factors were perceptual load (low/high) and stimulus type (target/irrelevant). For the P1 component, a main effect of stimulus type was observed [F(1,18) = 40.4, p < 0.0001] with larger responses to the salient central irrelevant stimuli than the target stimuli (probably reflecting the more foveal location of the irrelevant stimuli). No significant differences were found in the main factor of perceptual load [F(1,18) = 2.11, p = 0.16] although numerically amplitudes were larger in the low load condition. The predicted interaction between perceptual load and stimulus type was not significant [F(1,18) = 0.09, p = 0.77].
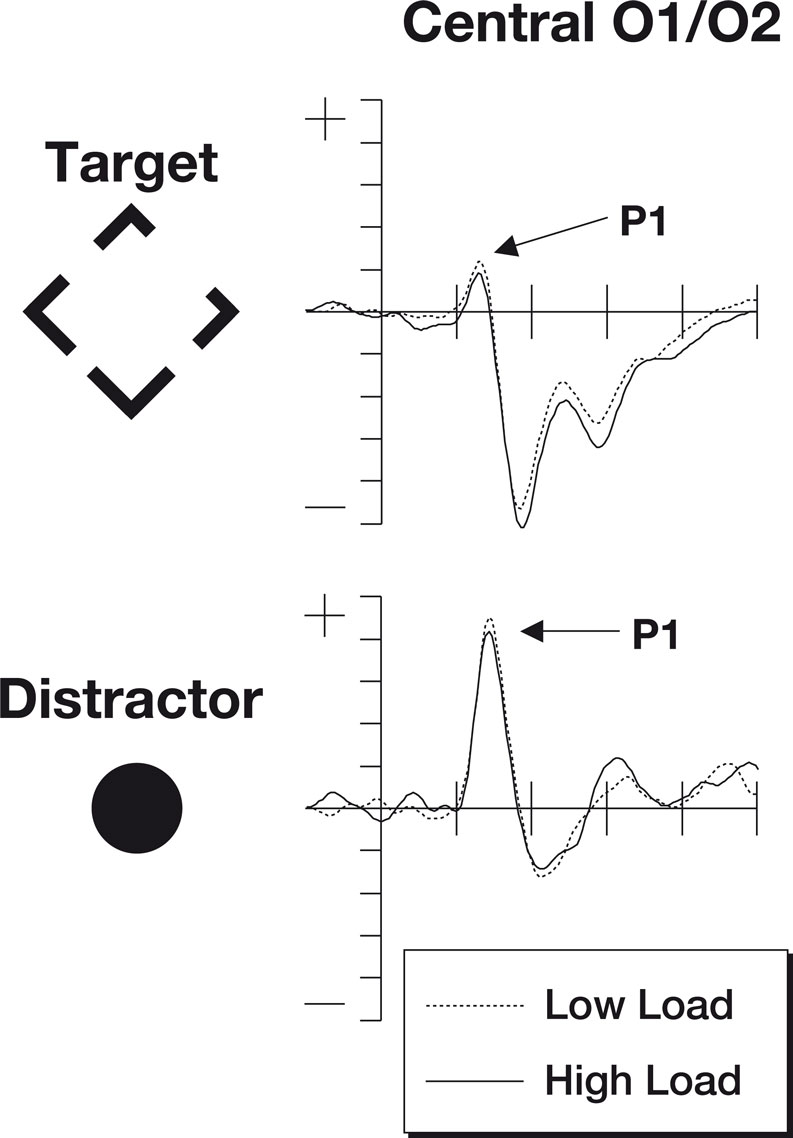
Figure 2. The P1 components from this study. Note that numerically the P1 is stronger during periods of low perceptual load (dotted line) than periods of high perceptual load (solid line). This effect is found both for targets as well as irrelevant distractor items. The top row of plots shows ERPs to the target stimuli where the participant was expected to make a gap judgment. The lower row shows ERPs to the irrelevant but salient central distractor stimuli. The horizontal axis shows time, beginning 100 ms prior to stimulus onset and continuing until 500 ms after onset, while the vertical axis shows the voltage (with a range from +5 to −5 μV). The solid line represents the ERP during periods of high perceptual load while the dotted line shows responses during sequences of low perceptual load.
The N1 data were subjected to a three-factor 2 × 2 × 2 repeated measures ANOVA, the waveforms at locations used to identify the N1 are shown in Figure 3
. The factors were hemisphere (left/right), perceptual load (low/high), stimulus type (target/irrelevant). Analysis of the N1 data revealed no difference between the main factors of hemisphere [F(1,18) = 2.12, p = 0.16] and perceptual load [F(1,18) = 0.22, p = 0.65]. However, there was a major effect of stimulus type [F(1,18) = 76.7, p < 0.0001], potentially due to the different salience and eccentricity of the target and irrelevant stimuli. However, the predicted interaction between perceptual load and stimulus type proved significant [F(1,18) = 5.99, p < 0.025], with effects in the predicted direction (See Figure 2
). No other interactions were significant.
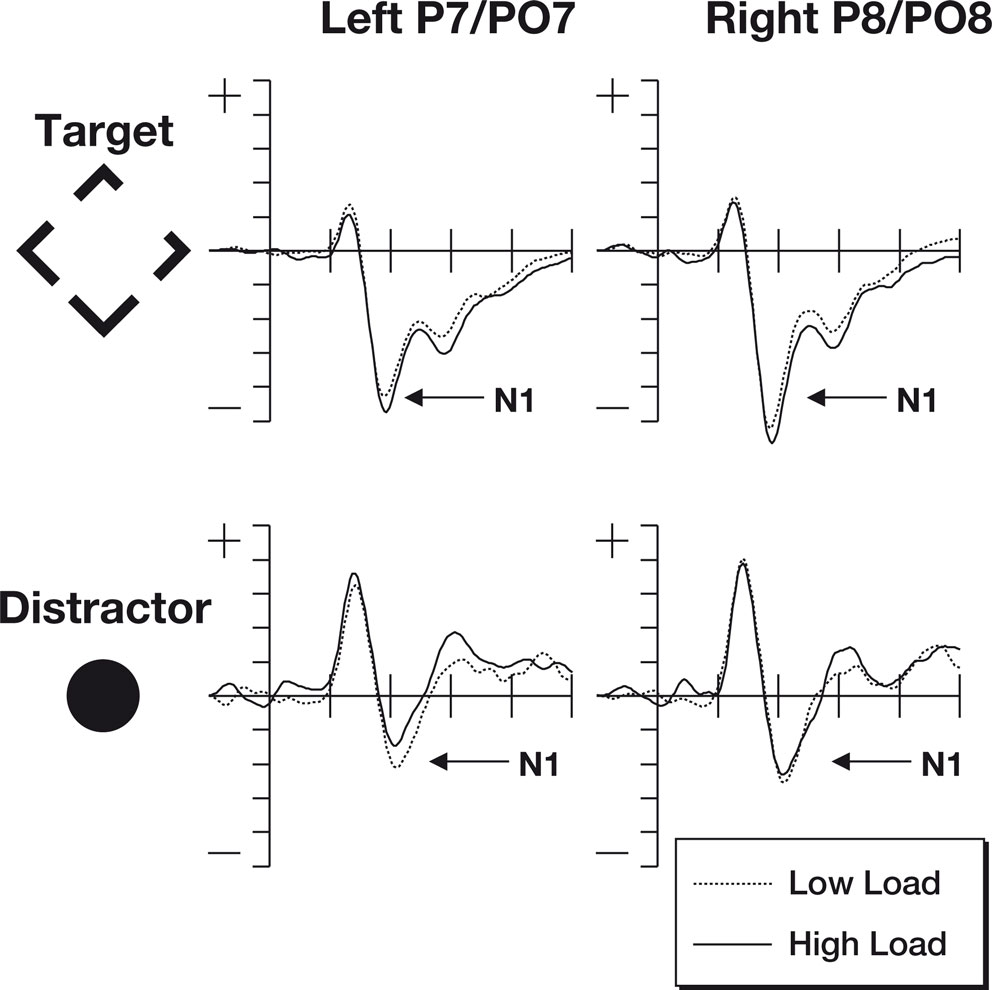
Figure 3. The N1 components from this study. Note that the increased perceptual load results in larger N1 responses to target stimuli, but that there is a decrease to distractor stimuli. The top row of plots shows ERPs to the target stimuli where the participant was expected to make a gap judgment. The lower row shows ERPs to the irrelevant but salient central distractor stimuli. The horizontal axis shows time, beginning 100 ms prior to stimulus onset and continuing until 500 ms after onset, while the vertical axis shows the voltage (with a range from +5 to −5 μV). The solid line represents the ERP during periods of high perceptual load while the dotted line shows responses during sequences of low perceptual load.
To understand the time-course and topography of the interaction, we plotted topographic t-test maps for this comparison (based on a contrast between relevant and irrelevant difference waves, where the difference wave was generated by subtracting each individual’s high load waveform from their low load waveform). Sample plots from representative time-points are shown in Figure 4
, with electrodes showing a statistically significant difference shown in bold (p < 0.05). This analysis revealed a relatively left lateralized response in the 180–224 ms time range followed by a bilateral and sustained difference in the 260–300 ms post-stimulus onset time range.
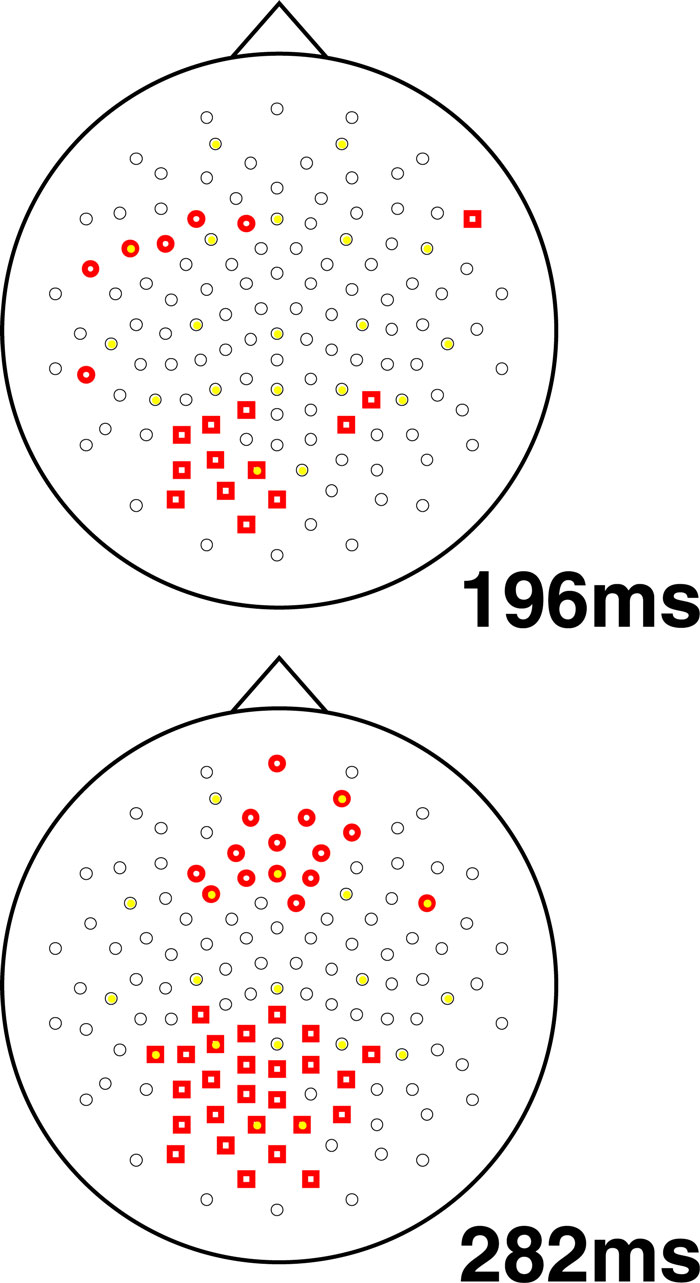
Figure 4. Topographic maps of statistically significant interaction effects observed in this study. Two difference waves were computed: one for irrelevant stimuli (high–low load) and one for target stimuli (again, high–low load). The resulting difference waves were compared using a t-test for each electrode at each time point, with a threshold of p < 0.05. The plots show all electrodes, with significant electrodes shown in bold: bold squares show regions with more negative deflection for this interaction while bold circles show positive deflections. In other words, the squares show regions where increasing load is related to stronger N1 amplitude for target versus irrelevant stimuli. Two representative time points are shown: one at 198 ms and one at 282 ms
.
In this study, we found that the N1 component and subsequent negativity is modulated as predicted by Lavie’s model of perceptual load (Lavie, 1995
; Lavie and Robertson, 2001
; Lavie and Tsal, 1994
): relevant information shows stronger responses with increasing perceptual load while irrelevant information shows weaker responses as perceptual load increases. Thus, to the extent that the N1 component can be characterized as a measure of perceptual processing, we have provided strong evidence in support of this perceptual load model of attention.
One important aspect of our study is that the irrelevant stimuli were always presented at different times from the target stimuli, and never simultaneously competed for attention with the target stimuli. This is in contrast with the work of Rees et al. (1997) and the first experiment of Handy et al. (2001)
, where the irrelevant information was presented at the same time as task relevant information. Therefore, in our design there was no direct need to actively inhibit processing of irrelevant information. This has important theoretical implications. Specifically, the previous results may encourage active inhibition of distractors, while our design reflects a purer measure of inattention due to limited capacity.
In the work by Handy and colleagues, the P1 component was taken as the key measure of processing. The pattern of our P1 components is similar to that reported by Handy et al. (2001)
, but our design allows additional comparisons that do not support their inferences. Specifically, Handy and colleagues found that irrelevant distractor items drove statistically stronger P1 responses during low load than high load. We found a numerical trend for this effect in our own data. However, Handy and colleagues did not directly test for the predicted interaction effect where target items also result in stronger P1 responses during high load compared to low load. Our design allows us to make this comparison, and our data show no evidence of this interaction effect: indeed numerically the P1 responses to targets are weaker during high load compared to low load. Therefore, in our design perceptual load does not appear to selectively filter relevant information at the time of the very early P1. Handy inferred that increasing attentional load results in stronger P1 waveforms based on their earlier work (Handy and Mangun, 2000
). However, it is worth noting that these earlier findings only found P1 enhancement in certain situations (e.g., only for ipsilateral P1, and in interaction with spatial cuing). While it is possible that the P1 modulation by load may occur when stimuli are processed at attended locations, our data suggests that this finding does not generalize to all situations.
An important difference between our study and those of Handy and colleagues is that our conclusions focus on the N1 component, rather than the P1 as they do. We have shown in this study that the N1 component and subsequent sustained negativity does show the interaction predicted by the perceptual load model. Specifically, we find more negative deflections for relevant information during high perceptual load relative to low load with irrelevant stimuli driving the opposite pattern (i.e., irrelevant stimuli result in more negativity during low load relative to high load). While the P1 and N1 modulations are typically seen during spatial selection, the later sustained negativity we observe is similar to the ‘selection negativity’ effects that are often seen when participants are asked to attend to non-spatial features such as color, shape and orientation (Eimer, 1997
). It is probable that the sustained activity we observe reflects differences of processing non-spatial features during different levels of perceptual load. Previous work (Hillyard et al., 1998
; Mangun and Hillyard, 1991
) suggest that P1 modulation is typically observed in spatial selection tasks where there is interference (e.g., where distractors at other locations compete for processing), while N1 modulation reflects a limited capacity discriminative process (e.g., N1 modulation is typically not observed when participants need to make simple detection responses to salient stimuli, but is observed when they are asked to make discrimination responses). Like previous physiological studies of the perceptual load model (Handy et al., 2001
; Rees et al., 1997
; Yi et al., 2004
), the relevant and irrelevant information occurred at predictably different locations (e.g., in our study, irrelevant information was always foveal, and irrelevant information was always peripheral).
Our results complement a recent study by Fu et al. (2008)
who report that conducted an ERP study of perceptual load. Each trial presented four large lines, one in each visual quadrant (one vertical, one diagonal, and two horizontal). The task was to simply report if a forward slanting diagonal line (‘/’) appeared in the attended hemifield, while ignoring stimuli in the unattended hemifield, with targets occurring in 10% of the trials. Half the trials presented the stimuli on background of x shaped distractors, while the other half was presented on a background of small horizontal and vertical lines. As the targets were diagonal lines, the x-shaped distractors lead to greater perceptual load than the small horizontal and vertical lines. The authors report an interaction between voluntary attention and perceptual load that was significant for the N1 but not the earlier P1 component, with dipole modeling localizing this interaction to the temporoparietal-occipital gyrus. Specifically, the N1 amplitude was greater in the attended than unattended hemifield in the high load condition but not the low load condition. Further, like our findings, this interaction of negativity is sustained well after the N1 component (see their Figure 6). While our conclusions replicate those of Fu et al. (2008)
, it is important to note that our paradigm helps address a number of possible concerns with their study. For example, their low load and high load stimuli are perceptually very different. Further, our finding is based on distractors that appear in the absence of potential targets, and therefore highlights the influence of anticipated load rather than actual stimulus-driven load. On the other hand, as discussed in their introduction, their design is much more faithful to the original concept of perceptual load, as well as the standard behavioral studies of behavioral load. Therefore, we believe that the present study both replicates and extends the work of Fu et al. (2008)
.
Therefore, the physiological evidence observed to date may show early spatial suppression effects, as measured by the early P1 and N1 components. For example, with increasing perceptual load, the participants may be selectively suppressing perception from the location of irrelevant information. We predict that future ERP studies that present irrelevant and relevant information at unpredictable or superimposed locations will not observe differences in the P1 (e.g., Handy et al., 2001
) or N1 (as we observe here), but will replicate our sustained negativity effects. In other words, based on work reviewed by Hillyard et al. (1998)
, we suggest that the early P1 and N1 effects are products of the predictable location of relevant and irrelevant information.
A consistent finding of ERP studies is that stimuli presented at attended locations show enhanced amplitude P1 and N1 components relative to unattended items (Mangun and Hillyard, 1995
). Typically, these studies have presented peripheral items in both the left and right hemifields while subjects are instructed to attend to one side. These studies have demonstrated that the earliest C1 components are not influenced by attention (i.e., the amplitude and latency of the C1 is identical in both conditions) while the amplitude of the P1 and N1 components are modulated by attention (Clark and Hillyard, 1996
; Gomez Gonzales et al., 1994
; Mangun et al., 1993
). These findings support a fairly early level of selection – with signals from attended versus unattended stimuli being differentiated within 80 ms of stimulus onset (Luck et al., 2000
; Mangun and Hillyard, 1995
).
It should be noted that none of the physiological studies of Lavie’s load model have directly tested the notion that under low load attention to distractor stimuli is obligatory. Previous behavioral studies have demonstrated that the effect of interfering distractors is actually reduced as perceptual load increases (Lavie, 2005
). In contrast, all of the physiological studies have used task irrelevant distractors. Therefore, there are two interpretations for the physiological data. First, it is possible that the load model is correct, and residual processing is required to be processed under low load. Second, it is conceivable that under low load the bored participants voluntarily choose to attend to the irrelevant material, potentially because they do not find the task challenging. To directly test this, future studies need to compare high and low load to situations blocks of trials where the distractors are either irrelevant (neutral) or interfering with the task. If the increased processing of distractors under low load is under voluntary control, this should not occur when one expects the distractors to interfere with the primary task.
Early selection models argue that attended items are processed differently from unattended items even at the earliest stages of perception. Indeed, both our research and previous studies show that the P1 and N1 are already showing significant modulation based on task demands. However, it should be noted that many cognitive psychologists consider late versus early selection a simplisitc dichotomy, arguing that task demands (Johnston and Heinz, 1978
), attenuation (Treisman, 1969
) and perceptual capacity (Kahneman, 1973
; Lavie, 1995
; Lavie and Tsal, 1994
) offer clearer models of attentional influences on perception. Previous studies have demonstrated that ERPs can give unambiguous evidence in favor of some form of early selection. In a similar fashion, we believe that our paradigm offers support for Lavie’s perceptual load model.
The authors declare that the research was conducted in the absence of any commercial or financial relationships that could be construed as a potential conflict of interest.
This work was supported by grants from the National Institutes of Health to Chris Rorden (R01-NS054266) and to Gordon C. Baylis (R01-NS0242047). We would like to thank Chris Gore and Kristen Greene who helped collect data.