Towards ultra-high resolution fibre tract mapping of the human brain – registration of polarised light images and reorientation of fibre vectors
1
Institute of Neuroscience and Medicine (INM-, INM-2, INM-4), Research Centre Jülich and Jülich-Aachen Research Alliance (JARA-Brain), Aachen, Germany
2
Department of Physics, University of Wuppertal, Wuppertal, Germany
3
C. and O. Vogt Institute for Brain Research, University of Düsseldorf, Düsseldorf, Germany
4
Department of Psychiatry and Psychotherapy, RWTH Aachen University, Aachen, Germany
Polarised light imaging (PLI) utilises the birefringence of the myelin sheaths in order to visualise the orientation of nerve fibres in microtome sections of adult human post-mortem brains at ultra-high spatial resolution. The preparation of post-mortem brains for PLI involves fixation, freezing and cutting into 100-μm-thick sections. Hence, geometrical distortions of histological sections are inevitable and have to be removed for 3D reconstruction and subsequent fibre tracking. We here present a processing pipeline for 3D reconstruction of these sections using PLI derived multimodal images of post-mortem brains. Blockface images of the brains were obtained during cutting; they serve as reference data for alignment and elimination of distortion artefacts. In addition to the spatial image transformation, fibre orientation vectors were reoriented using the transformation fields, which consider both affine and subsequent non-linear registration. The application of this registration and reorientation approach results in a smooth fibre vector field, which reflects brain morphology. PLI combined with 3D reconstruction and fibre tracking is a powerful tool for human brain mapping. It can also serve as an independent method for evaluating in vivo fibre tractography.
Polarised light imaging (PLI) has been shown to reveal the spatial orientation of nerve fibres at an ultra-high resolution (Axer et al., 2001
; Larsen et al., 2007
; Gräßel et al., 2009
). It utilises the birefringent properties of the myelin sheaths, which surround the nerve fibres. Due to birefringence their optical properties are not isotropic. PLI measures the light transmittance at systematically varied polarisation states and, thereby, estimates a three-dimensional (3D) fibre vector representation characterised by an in-plane angle (direction) and an out-of-section angle (inclination). Thus, rotating the polarisation plane of the incident light enables the measurement of the orientation of myelinated fibres in space.
Polarised light imaging is applied to microtome sections of post-mortem brains with an optimum thickness of about 100 μm (Axer et al., 2001
) to allow light transmittance as well as detection of the birefringence effect. Transmittance is detected by a charged-coupled device (CCD) camera yielding a series of 2D images in each brain section corresponding to the polarisation states. As a result, a spatial distribution of 3D vector information within each brain section is available at microscopic resolution. This resolution is necessary, if the diameter range of 1–20 μm of single fibres within the human brain is taken into account (Gasser, 1941
).
Geometrical distortions are inevitable during the preparation of microtome sections. Distortions include local shearing and tearing, which occur during sectioning (Ourselin et al., 2000
). Sections may further be distorted during mounting on glass slides (Schormann and Zilles, 1998
). Hence, the original geometry of the brain and fibre tracts has been lost. Thus, the image stack of 2D PLI vector data has to be corrected for distortions and 3D-reconstructed to study fibre tracts.
Tools for the 3D reconstruction of microtome sections have been developed for different data modalities. These include histological cytoarchitectonic (Schormann et al., 1995
; Schormann and Zilles, 1998
; Ourselin et al., 2000
; Amunts and Zilles, 2001
; Bettio et al., 2005
; Chakravarty et al., 2006
; Yushkevich et al., 2006
; Dauguet et al., 2007a
; Schmitt et al., 2007
; Palm et al., 2008
; Singh et al., 2008
) and autoradiographic images (Hibbard and Hawkins, 1988
; Andreasen et al., 1992
; Goldszal et al., 1995
; Kim et al., 1997
; Rangarajan et al., 1997
; Hess et al., 1998
; Nikou et al., 2003
; Malandain et al., 2004
; Lee et al., 2005
; Holschneider et al., 2006
; Dubois et al., 2007
, 2008
) as well as tracing fibre tracts (Dauguet et al., 2007b
), confocal laser scanning microscopy (Čapek et al., 2009
) and blockface imaging of the embedded brain during cutting (Annese et al., 2006
).
Some 3D reconstruction approaches were based on the alignment of consecutive sections, which is a well suitable approach for rather small data sets or brains without intense cortical folding like brains of rat (Hibbard and Hawkins, 1988
; Goldszal et al., 1995
; Nikou et al., 2003
; Lee et al., 2005
; Holschneider et al., 2006
; Dubois et al., 2007
, 2008
; Schmitt et al., 2007
), gerbil (Hess et al., 1998
) and rabbit (Andreasen et al., 1992
) as well as those from other non-human primates (Bettio et al., 2005
; Dauguet et al., 2007b
). Others have used reference data like blockface (Kim et al., 1997
; Čapek et al., 2009
) or magnetic resonance (MR) images obtained prior to histological processing of mouse (Yushkevich et al., 2006
), rat (Palm et al., 2008
) or monkey (Rangarajan et al., 1997
; Malandain et al., 2004
) brains to align section images. Especially for large human brains, reference data are necessary considering the complex shape of the surface. Commonly, blockface images as well as MR data were taken as reference modalities (Schormann et al., 1995
; Schormann and Zilles, 1998
; Amunts and Zilles, 2001
, 2005
; Dauguet et al., 2007a
,b
; Yelnik et al., 2007
; Singh et al., 2008
).
The 3D reconstruction of PLI vector data differs from the above mentioned methods with respect to two main aspects: First, PLI images consist of 3D vector data in contrast to scalar modalities like histological images and autoradiographs. Second, PLI is sensitive to small remaining distortions since they may cause discontinuities of the fibre tract resulting in erroneous tractography.
In the past, PLI data were 3D-reconstructed using a rigid transformation, which was applied to images of the human brain stem (Axer et al., 2002
). Here we introduce a method for 3D reconstruction of PLI images of human whole-brain sections, which inevitably show severe deformations. Different transformations with increasing degrees of freedom (rigid, affine and non-linear with affine pre-processing) were compared to determine the appropriate approach for subsequent fibre tracking. In addition to the spatial image transformation and considering the vector nature of PLI data, we propose a reorientation of fibre orientation vectors (FOVs) (Figure 1
). For this purpose, methods for spatial transformations of diffusion tensor images (DTI) (Alexander et al., 2001
) were modified and applied.
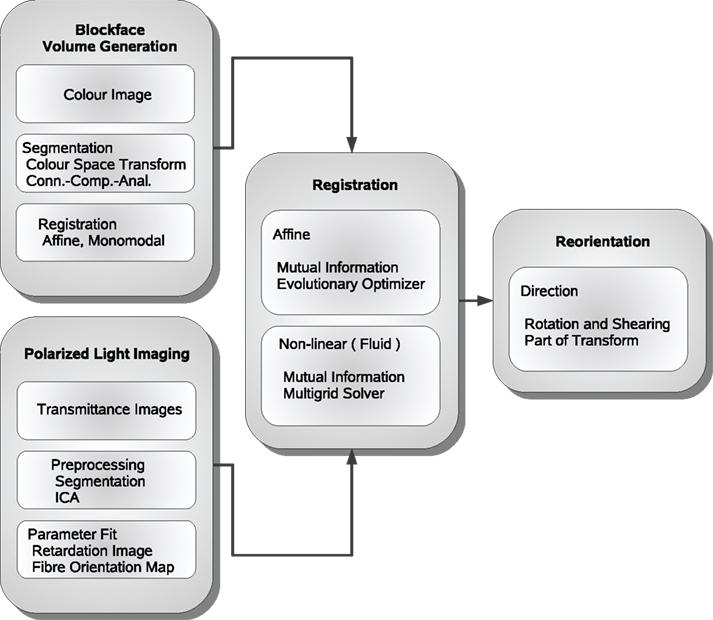
Figure 1. Schematic description of the image processing steps from polarised light imaging towards fibre tracking.
Image Material
The study is based on sections of a human post-mortem brain from the body donor program of the University Düsseldorf, Germany, in accordance with legal requirements. After brain removal and fixation in formalin, the brain was embedded in gelatine and frozen. Sectioning was performed on a cryostat microtome (coronal plane, 100 μm thickness). For each section a digital colour image of the frozen block was obtained before the block was cut. These blockface images (2050 × 1600 pixel) with an isotropic in-plane spatial sampling of 125 μm per pixel are the reference for subsequent registration of PLI images (see Section Rigid and Affine PLI Registration and Non-linear PLI Registration). For the development of registration tools and further analysis, we used a tissue block of 7 mm from the central region of the brain.
Polarised Light Imaging
The setup of PLI includes a light source which emits unpolarised (ideally monochromatic) light, two linear polarisers with a rotation offset of 90° between their transmission axes, one-quarter-wave retarder and a CCD camera system (Figure 2
). The light source consists of 1296 green light-emitting diodes with a centre wavelength of 520 nm arranged in a 2D array (iiM AG Measurement and Engineering, Meiningen, Germany). The two linear polarisers and the 140 nm quarter-wave retarder (ITOS, Mainz, Germany) have a diameter of 24 cm. The type of camera is AxioCam HRc (Carl Zeiss MicroImaging GmbH, Jena, Germany) equipped with an APO-Rodagon-N object lense (Rodenstock GmbH, Munich, Germany).
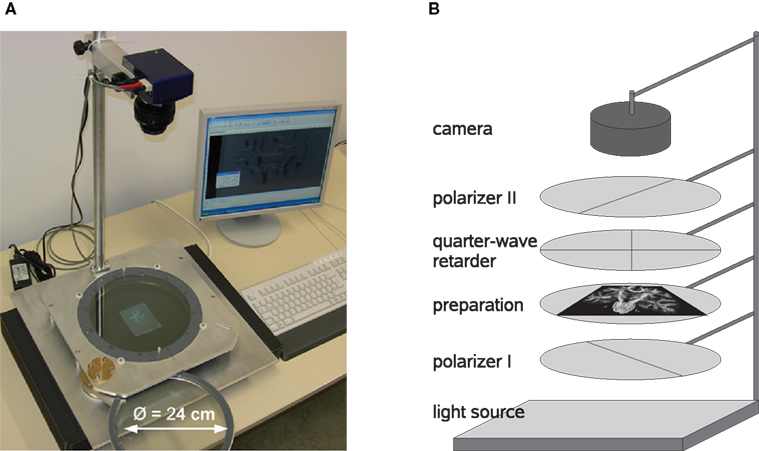
Figure 2. View of the PLI system (A) and scheme (B) with two polarisers, one-quarter-wave retarder, a light source as well as a CCD camera system.
Histological brain sections are positioned in-between the two crossed polarisers (“preparation”, Figure 2
B). The myelin sheaths surrounding the fibre bundles transform the linearly polarised light into elliptically polarised light depending on the spatial orientation of the fibres due to their birefringent properties. The component parallel to the transmission axis of the second polariser passes the system and is captured by the camera (Axer et al., 2001
; Larsen et al., 2007
). The transmission intensity depends on the orientation of the fibre in relation to the orientation of the optical axis of the quarter-wave retarder introduced into the system to solve a 90° ambiguity of the transmission.
Keeping the position of the histological section fixed, both the transmission axes of the polarisers and the quarter-wave retarder are simultaneously rotated. As a result, a sequence of PLI raw images of a single brain section at different rotation angles is obtained (Figure 3
). Images differ with respect to their grey value distribution. As a result of the rotation, the intensity measured in each pixel varies sinusoidally (intensity profile) with a phase shift dependent on the fibre orientation at this pixel position.
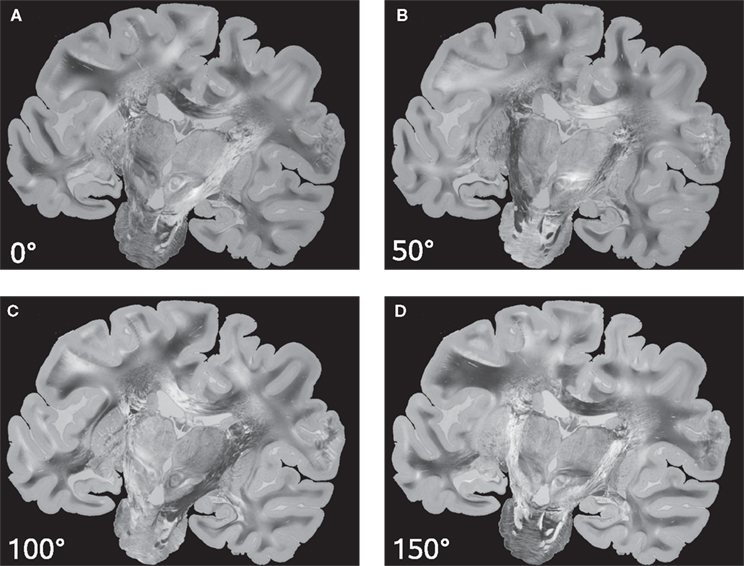
Figure 3. PLI raw images of a histological section corresponding to a set of four rotation angles (0° (A), 50° (B), 100° (C) and 150° (D)) of the optical system.
The angle of the minimal transmittance defines the in-plane direction of the fibre, whereas the inclination can be derived from the amplitude of the light variation depending on the thickness of the histological section (Larsen et al., 2007
; Axer et al., 2008
). The in-plane resolution of our custom-built PLI system (see Figure 2
A) was adjusted to the same value as the section thickness (100 μm) in order to generate a data set of isotropic voxel size with an image size of 1388 × 1040 pixels.
PLI yields a direction (Figure 4
A) and an inclination map (Figure 4
B). The maps determine the fibre orientations at each pixel position and can be transformed into a vector array with (X, Y, Z)-components normalised to length 1. The normalised vectors define the so-called fibre orientation map (FOM), which serves as an input for the registration-induced vector reorientation (see Section Reorientation of FOV Direction).
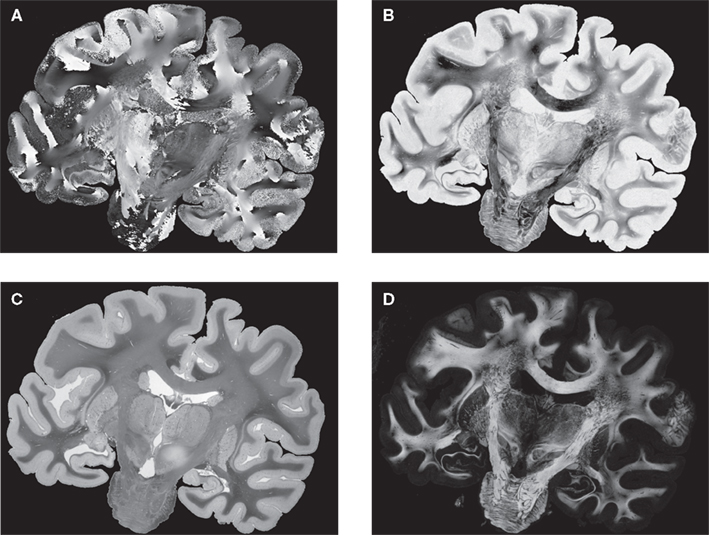
Figure 4. Example of PLI output images: direction φ (A) and inclination map (B), transmittance I0 (C) and retardation map. |sin δ|. (D). I0, φ and |sin δ|. are introduced in Section “Estimation of Fibre Orientation Vectors”.
Segmentation of PLI images
The segmentation of the PLI images, i.e., the separation of brain tissue from surrounding image components, consists of the following steps. In the first step, the background of the transmittance image was identified by histogram thresholding, and then set to zero. To be robust against contaminations on the slide, pixels with constant intensity profiles along the rotation angle of the optical system were discarded prior to histogram computation. Morphological opening and closing operations were applied subsequently to remove noise and remove holes of the object. Finally, a convex hull algorithm was used to distinguish inside and outside of the tissue object. The PLI segmentation procedure was based on in-house software written in IDL. The estimation of FOVs (see Section Estimation of Fibre Orientation Vectors) was restricted to the pixels of the PLI tissue segment.
Estimation of fibre orientation vectors
To estimate the estimation of FOVs at each pixel position, PLI raw images at equidistant rotation angles with a sampling of 10° were captured in a 180° half-circle. After automatic segmentation (see Section Segmentation of PLI Images) the images were calibrated using an independent component analysis (ICA) correcting the measured signal for noise and artefacts (Dammers et al., 2010
). In-house software was used to fit a sinusoidal curve through the measurements as well as to estimate the fibre direction and inclination (Axer et al., 2008
). In brief, the application of a discrete harmonic Fourier transform allows extracting the parameters I0, φ and |sin δ| from the intensity of transmission derived from the Jones calculus (Jones, 1941
):

where I denotes the intensity captured by the camera and ρ the azimuth of the transmission axis of the first polariser with respect to the frame coordinate system. I0 (Figure 4
C) is the intensity of incident light modified by absorption independent of the birefringence of the material. Therefore, for non-birefringent tissue I is equal to I0. I0 as well as the fibre direction φ with respect to the coordinate system of the frame can be extracted directly. However, the true fibre direction with respect to the tissue coordinates is only achievable by adequate reorientation (see Section Reorientation of FOV Direction). δ is called retardation and describes the maximum phase shift between the orthogonally polarised components of a light ray passing through birefringent material. Thus, images showing |sin δ| are called retardation maps (Figure 4
D). They serve as the basis for image registration (see Section Rigid and Affine PLI Registration). The fibre inclination α is related to the retardation via the tissue thickness (d), the birefringence (Δn) and the wavelength (λ) of the light (Larsen et al., 2007
):

The incident linearly polarised light interacts locally with the myelin imposing a characteristic phase shift δ (retardation) on the electromagnetic light wave. The independence of δ of the sign of α implicitly indicates that there is an ambiguity in inclination estimation. This ambiguity poses challenges for fibre tracking in 3D. First approaches to solve this issue were introduced by Larsen and Griffin (2004)
; they will be discussed in Section “Discussion”.
Generation of the Blockface Volume
As shown previously for microscopic images (Beare et al., 2008
; Palm et al., 2009
), section-based imaging modalities need a genuine 3D reference to avoid effects of bias in restacking. We used blockface images stacked to a 3D volume as reference modality assuming the imaging setup unchanged during cutting (Schormann and Zilles, 1998
; Amunts and Zilles, 2005
; Dauguet et al., 2007b
). The zero-position of the cryo-block varies slightly during the cutting due to vibrations of the cryostate. Thus, the blockface images had to be 3D reconstructed as well. The cryo-block of the brain was positioned in front of a regular checkerboard pattern in order to enable a bias-free alignment and 3D reconstruction of the blockface images (Figure 5
A). Tissue and non-tissue image parts are separated by a segmentation procedure (see Section Segmentation of Blockface Images). The non-tissue image parts, i.e., mainly the checkerboard pattern, were later used as a basis for a single-modality linear registration with normalised correlation (NC) similarity metric (see Section Registration of Blockface Images).
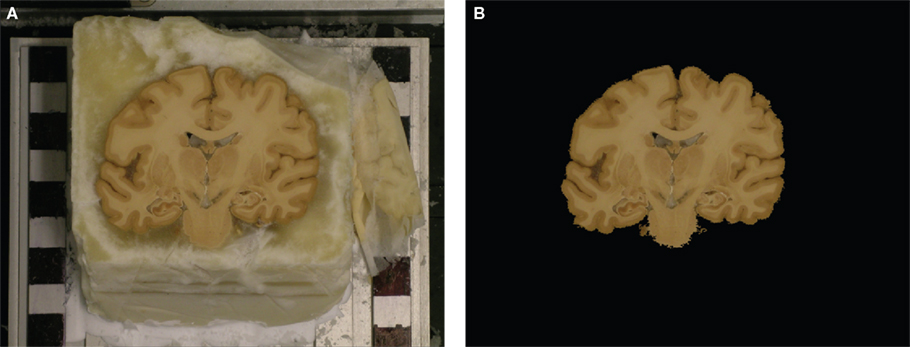
Figure 5. Example of a blockface image before (A) and after segmentation (B). The block was mounted in front of a regular checkerboard pattern. Non-tissue image components, i.e., mainly the checkerboard, were used to calculate the similarity metric in order to reduce the registration bias.
Segmentation of blockface images
The segmentation started with a KMeans clustering (Duda and Hart, 1973
) of the histogram of the a⋆ colour channel after transformation from the RGB into the La⋆b⋆ colour space (Wyszecki and Stiles, 1982
) where the brain tissue shows reasonable contrast with respect to the rest of the image. Eventually a pixel-wise classification of background and tissue followed by a fill-hole algorithm was performed. The registration of PLI images to pre-aligned blockfaces employed the masked intensities within the tissue segment (Figure 5
B).
Registration of blockface images
The following 2D affine transform without shearing was used for the registration of the blockface images:
where p = (px, py)T, px, py ∈ ℤdenotes the pixel position. s = (sx, sy), t = (tx, ty), and φ are the scaling factors, the translation vector and the rotation angle, respectively. Consequently,  is described by five parameters θ1.
is described by five parameters θ1.The blockface images were acquired as RGB images. They were transformed into greyscale images by computing the means of the red, green and blue colour channels. To tolerate slight illumination inhomogeneities, NC was chosen as single-modality similarity metric for two blockface images f and m instead of the Sum-of-Squared-Distances:
with d(fi) = f(pi) − μ(f) and d(mi) = m(pi) − μ(m), where f(p) = wf defines the value at p of f, m(p) = wm defines the value at p of m, and μ(f) and μ(m) represent the mean value for the overlapping region of f and m, respectively.
The exclusion of the brain tissue from registration is important to avoid a restacking bias. Therefore, NC(f, m) in Eq. 4 was restricted to those values f(pi) and m(pi) for which pi is outside of the brain tissue. Therefore, the blockface images were segmented prior to registration (see Section Segmentation of Blockface Images). The pixels, which contribute to NC, were restricted to the background segment, i.e. mainly the regular checkerboard pattern.
Registration is an optimisation approach to find the best parameters, which maximises NC:

f and m are called reference image and moving image, respectively. The registration was started from the middle image of the stack as reference; the registration of the whole stack proceeded then, up and down. The already registered previous image was hereby treated as the new reference image.
After the generation of a 3D blockface reference volume, affine registration (see Section Rigid and Affine PLI Registration) and non-linear registration (see Section Non-linear PLI Registration) were performed in order to correct for the loss of 3D consistency of the microtome sections, and to remove local deformation artefacts.
Rigid and Affine PLI Registration
The PLI analysis provides several maps of one and the same histological section representing the fitted parameters of Eq. 1, i.e. retardation and direction maps as well as 2D vector arrays coding the 3D fibre orientation at each pixel position. All maps of each histological section share the same reference space. As a consequence, it is sufficient to align one of them with the corresponding blockface image before applying the resulting transformation to the other maps. The retardation images were chosen for registration, because they show maximum contrast between grey and white matter. Retardation intensity is approximately inversely proportional to the inclination of a fibre (see Eq. 2). That is, fibres, which run mainly within the cutting plane show high retardation values, whereas the retardation intensity in the grey matter is rather faint due to low birefringence (Figure 4
D).
Normalised mutual information (NMI) was taken as a well established multi-modality similarity metric (Studholme et al., 1999
):

with f and m being the reference (blockface) and the moving (retardation map) image, respectively. The blockface colours are transformed to grey values calculating the mean value beforehand. H(f) and H(m) denote the single entropies,
whereas H(f, m) defines the joint entropy of the input images:

with intensities wf and wm ∈ {0,…,W − 1}, W ∈ ℕ.
The rigid transformation  of a pixel p:
of a pixel p:
with 3 degrees of freedom, (tx, ty) and φ. The affine transformation  :
:
:
is parameterised by θ3 = (a11, a12, a21, a22, tx, ty). Analogue to Eq. 5, θ2,3 are estimated according to:

Non-Linear PLI Registration
The affinely aligned retardation maps served as basis for subsequent non-linear registration. The non-linear transformation 𝒯u with a deformation field u:

is a necessary step in order to correct for inevitable, non-linear deformations introduced during the cutting and mounting of the section. Up to now, a physical model of section cutting considering the influence of the embedding material as well as freezing effects has not been established. Mathematical models like Free-Form-Deformation utilising B-Splines (Rückert et al., 1999
) and physics-related transformations such as elastic (Bajcsy and Kovacic, 1989
; Hömke, 2006
) and fluid deformation (Christensen et al., 1996
) are used to make the ill-posed non-linear registration problem feasible (Modersitzki, 2004
).
In this study, the fluid approach (D’Agostino et al., 2003
; Crum et al., 2005
) was applied. Advantages of this approach include the capability to model large deformations while ensuring the diffeomorphic property of the transformation. In brief, the Navier–Stokes equation of the fluid model relates the velocity field v and the body force field b(u) which depends on the current estimate of u:

where ∇2 denotes the Laplacian operator. The viscosity parameters μ and λ are here set to 1 and 0, respectively (D’Agostino et al., 2003
; Crum et al., 2005
). The iterative fluid registration solves Eq. 13 with respect to v and updates the current estimate of u, û, by integrating v over a small time step. The parameter b is defined by the gradient of NMI (Eq. 6) with respect to u (D’Agostino et al., 2003
). The registration of PLI images to blockface references is based on a multi-resolution approach with four hierarchic levels (Crum et al., 2005
).
Quality of Registration
Two quantitative metrics were defined in order to assess the quality of registration. The Dice coefficient (DC) measures the amount of overlap of regions. Comparing the tissue segments of PLI, a, and blockface, b, DC is given by
where N(a), N(b) are the number of region pixels of the tissue segments and N(|a − b|) defines the number of differing pixels, i.e., the number of non-overlapping region pixels. The segmentation procedures for PLI images and for blockfaces are described in Sections “Segmentation of PLI Images” and “Segmentation of Blockface Images”, respectively. For both modalities, tissue and background are separated. The overlapping of the tissue segments of a corresponding image pair of PLI and blockface is basis for the computation of DC in Eq. 14.
The second metric, NMI, is defined in Eq. 6. In contrast to DC, NMI reflects the correlation of the morphology within the tissue segment. High NMI values correspond to a high matching quality.
Anatomical correctness is a further independent criterion for the quality of registration. Anatomical correctness includes the smoothness of a structure orthogonal to the cutting direction of histological sections. That is, the shape of an anatomical structure and its surface should not depend on the sectioning plane. Smoothness was estimated as follows: A deep brain region was segmented manually in all histological sections before registration resulting in a sequence of label images. The label images were transformed according to the transformation parameters resulting from the registration optimisation yielding a 3D surface of the deep brain structure. The smoothness of the surface depends on the registration method and is characterised by the length Lm, m ∈ {rigid, affine, affine + fluid} of the contour in views orthogonal to the sectioning plane. To eliminate absolute length measures for comparison, each L is normalised by Lrigid.
Reorientation of FOV Direction
Registration of retardation maps yields transformations characterised by the parameters arising from the optimisation process. The registration results are propagated to the other PLI-related modalities, in particular to the FOMs, by application of these transformations. However, transformation of FOMs requires a reorientation of FOVs due to their vector nature. Otherwise, a FOV is located at a new image position but is with erroneous orientation.
In contrast to DTI, where a reorientation of vectors is also required (Alexander et al., 2001
), no information related to fractional anisotropy is available for PLI. Therefore, a FOV is represented by a single vector resembling an eigenvector of the greatest eigenvalue of a diffusion tensor lacking a proper reliability factor like anisotropy. It has been shown for affine transformations that reorientation should include shearing and non-uniform scaling depending on the vector orientation in addition to the rotation part (Alexander et al., 2001
). Therefore, the full affine transformation matrix A is used for the reorientation procedure.
The reorientation of FOVs is performed once after the transformation of the PLI images. We assume an affine transformation  defined in Eq. 10, with matrix A and an additional non-linear transformation 𝒯u defined by the deformation vector field u, defined in Eq. 12. Be v = (vx, vy, vz)T a FOV after transformation but before reorientation. Then, the reoriented FOVs
  and
and  account for the transformations
  and
and 
defined in Eq. 10, with matrix A and an additional non-linear transformation 𝒯u defined by the deformation vector field u, defined in Eq. 12. Be v = (vx, vy, vz)T a FOV after transformation but before reorientation. Then, the reoriented FOVs and account for the transformations and Be  a vector consisting of the planar components of v. Note, that the FOVs are 3D vectors, but the transformation is 2D. The z-component of the FOV remains unaffected. Adapting the preservation of principal direction strategy (Alexander et al., 2001
) w is reoriented to
a vector consisting of the planar components of v. Note, that the FOVs are 3D vectors, but the transformation is 2D. The z-component of the FOV remains unaffected. Adapting the preservation of principal direction strategy (Alexander et al., 2001
) w is reoriented to  using the estimated transformation parameters
a vector consisting of the planar components of v. Note, that the FOVs are 3D vectors, but the transformation is 2D. The z-component of the FOV remains unaffected. Adapting the preservation of principal direction strategy (Alexander et al., 2001
) w is reoriented to using the estimated transformation parameters 
The non-linear transform 𝒯u is approximated by a local affine transform 𝒯θ(p) = Ap + tp. Differentiation with respect to p yields Ap = I + J with the identity matrix I and the Jacobian J of u(p). Including the estimated fluid parameters û additionally to the affine parameters, the reoriented vector  is achieved by:
is achieved by:
The corresponding reoriented FOVs  and
and  are computed by normalisation with respect to the fraction length of the first two FOV elements:
and are computed by normalisation with respect to the fraction length of the first two FOV elements:
 and
and  are defined analogously. Thus, correcting the direction adjusting the FOVs to be consistent with the spatial transformation.
Analyses of Transformations
All experiments were performed on 36 sections using NMI as similarity metric. To preserve the high resolution of PLI during reconstruction, high resolution blockface images (Figure 6
A) were used as reference.
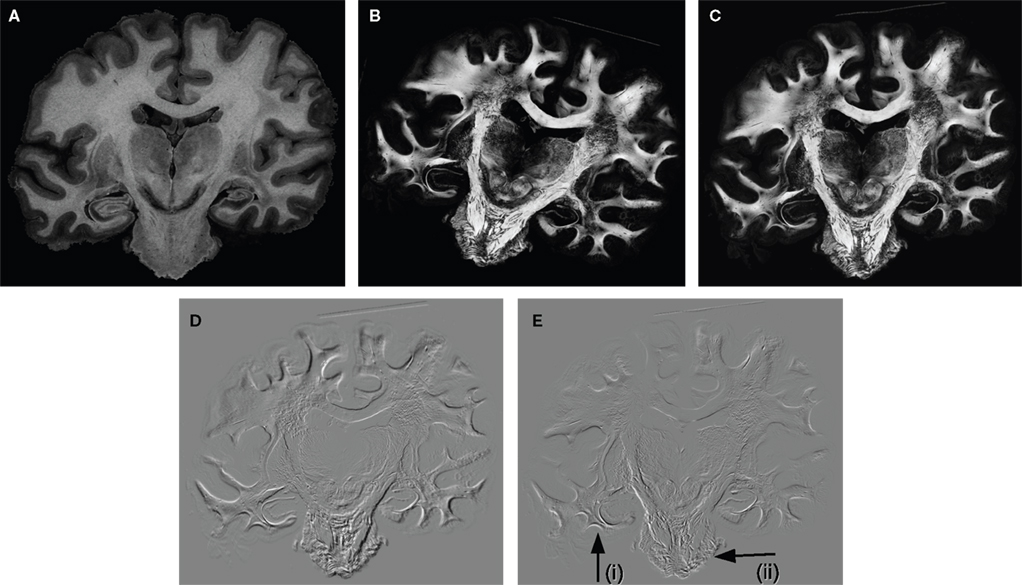
Figure 6. Example of a greyscale blockface image (A) used as a reference for the registration of the retardation map (B). Affine and subsequent fluid registration yielded the registered retardation map (C). Difference images were calculated of the rigidly and the affine registered retardation maps (D), and of the affine and the fluid registered retardation maps (E); hereby, zero differences are shown in grey tones, negative values (rigid < affine, affine < fluid) are shown in black, and positive values are shown in white tones. That is, black and white values indicate differences between the transformation approaches. The comparison of (D) and (E) illustrates that the affine transformation is a global image transformation and, hence, all tissue parts were affected, whereas the fluid transformation showed local effects, e.g., in the temporal lobe [arrow (i)] and the pons [arrow (ii)].
For optimisation of the rigid and affine registration, an (1 + 1)-evolutionary algorithm was applied instead of a gradient descent approach to enhance robustness (Styner et al., 2000
). Evolutionary optimisation is able to leave a local maximum by randomly selecting the next position within the search space controlled by a probability function. The fluid registration was performed hierarchically (Crum et al., 2005
) with four levels yielding grid sizes of (128 × 100), (256 × 200), (512 × 400) and (1024 × 800). Equation 13 was solved with a full multi-grid method (Crum et al., 2005
). The registration experiments were applied on basis of PLI retardation images (Figure 6
B).
We examined three different transformation types: rigid, affine and a combination of affine and fluid. Performing an affine transformation instead of a rigid transformation affected all tissue parts, which is illustrated by the difference image of both results (Figure 6
D). The application of a non-linear transformation subsequently to the affine transformation (result is shown in Figure 6
C) had local implications (Figure 6
E), in particular with respect to the pons and the temporal lobe.
As expected, the smoothness of brain structures improved considerably with increasing degrees of freedom of the transformations. Starting with rigid registration as baseline, smoothness increased but local deformations remained even after affine transformation. The application of a fluid registration subsequently resulted in high matching quality (Figure 7
).
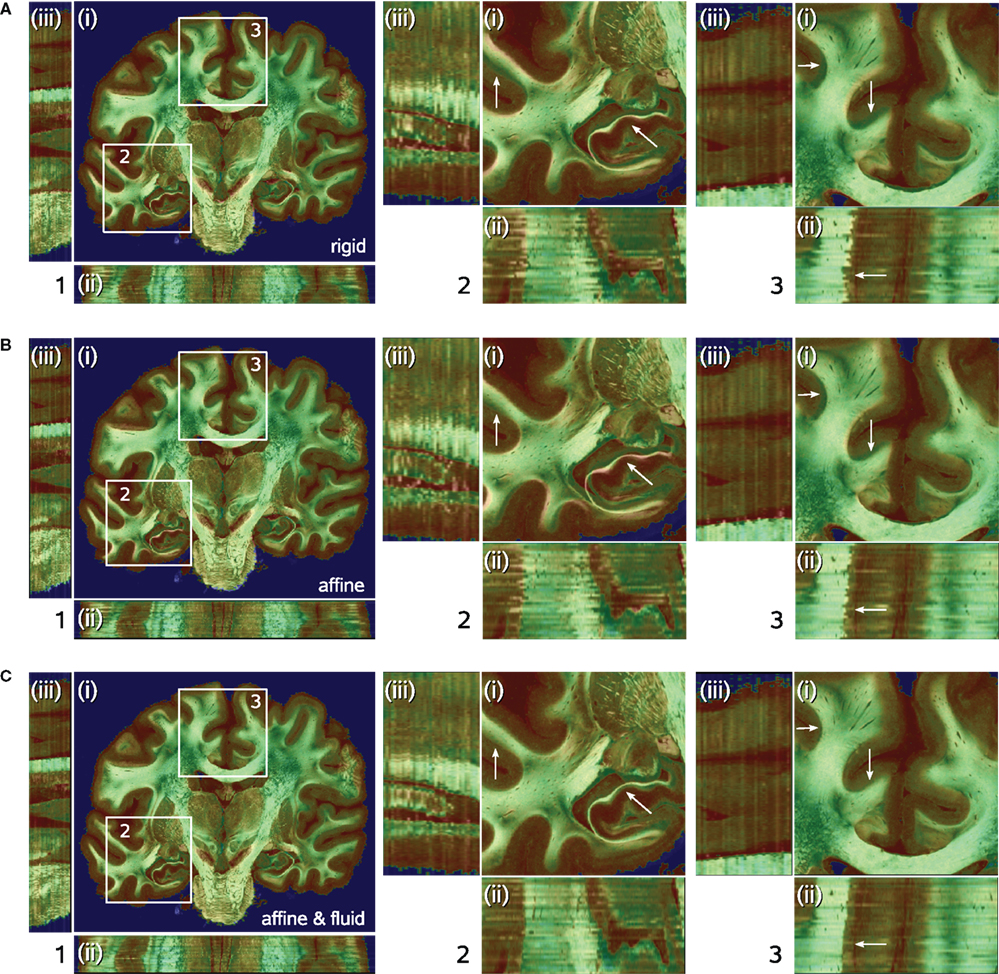
Figure 7. Results of transformations after rigid (A), affine (B), and affine followed by fluid registration (C). Each 3D data set is shown in coronal (i), horizontal (ii) and sagittal (iii) view. The pseudo-colour-coded blockface image volume is fused with the greyscale retardation map volume via α-blending. Grey matter shows mainly red tones in the blockface image and low grey values in the retardation map combining to a brown colour in the fused visualisation. White matter shows green tones and high grey values, respectively, combining to light green for high matching quality and dark green for low matching quality. Regions (2) and (3) within (i) correspond to the zoomed insets 2 and 3 of the total data set (1). Structures with significant improvement after fluid registration are indicated by arrows (white matter of cingulate gyrus, hippocampal region). The combination of affine and fluid registration yielded significant improvements of consistency.
The quality of registration was assessed by two quantitative measures (see Section Quality of Registration): the DC (Eq. 14) and the NMI (Eq. 6). The analysis of DC indicated, that affine registration already resulted in good matching (mean DC value of 0.962) (Table 1
). However, the analysis of NMI values revealed further improvement of the consistency after subsequent fluid registration raising the mean NMI value from 1.287 to 1.298 (Table 1
). Improvement was achieved in particular for deep brain structures (Figure 7
).
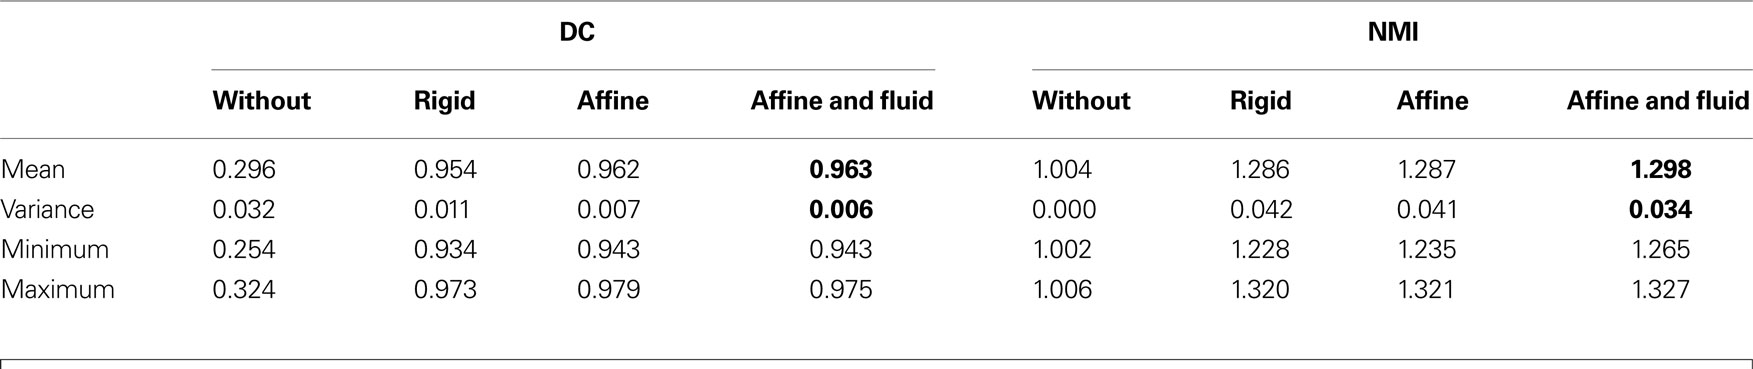
Table 1. The quality matching is measured by the Dice coefficient (DC) and by the normalised mutual information (NMI). DC ranges between 0 and 1 (1 indicates full overlap). Lowest NMI value indicates worst image alignment. The maximum NMI value depends on the marginal entropy of the image. Bold values correspond to highest mean together with lowest variance values for DC and NMI metric.
The decreasing variance (0.041 to 0.034) proved the robustness of the matching (Table 1
). The deformation vector field showed large deformations in the frontal and temporal lobes and small deformations in the internal capsule (Figure 8
).
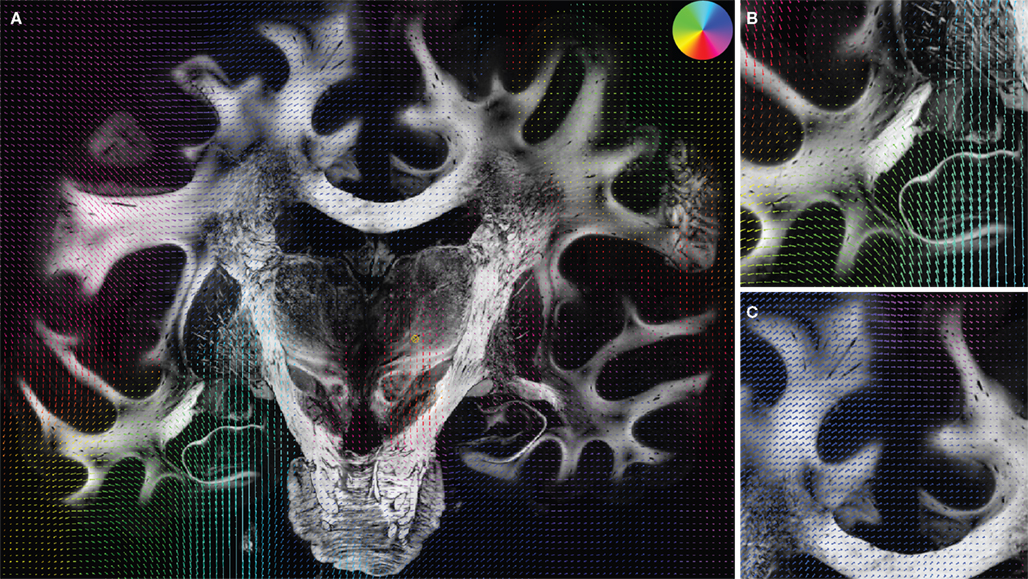
Figure 8. Superimposition of the deformation vector field u resulting from the fluid registration and the corresponding retardation map. |sin δ|. The vectors are pseudo-coloured (for direction see circular colour legend). Additionally to the entire section (A) the two regions specified in Figure 7
are shown in (B)–(C). Largest deformation occurred in the left hippocampal region.
The necessity of a non-linear transformation is further supported by the smoothness considerations regarding deep brain structures. The smoothness of the registration result was tested for the corpus callosum, a sharp delineated fiber tract connecting both hemispheres of the brain, using the smoothness metric introduced in Section “Quality of Registration” (Figure 9
). The contour length L along a para-sagittal cutting line (see Section Quality of Registration) characterises the smoothness of the region after registration. The rigid result (Figure 9
A) provides a basis for normalisation (L = 1). Whereas the decrease of L to L = 0.97 for the affine result (Figure 9
B) is low, the decrease to L = 0.61 for the subsequent fluid result (Figure 9
C) is significant. It indicates the increasing smoothness and, hence, increasing anatomical accuracy by non-linear registration.
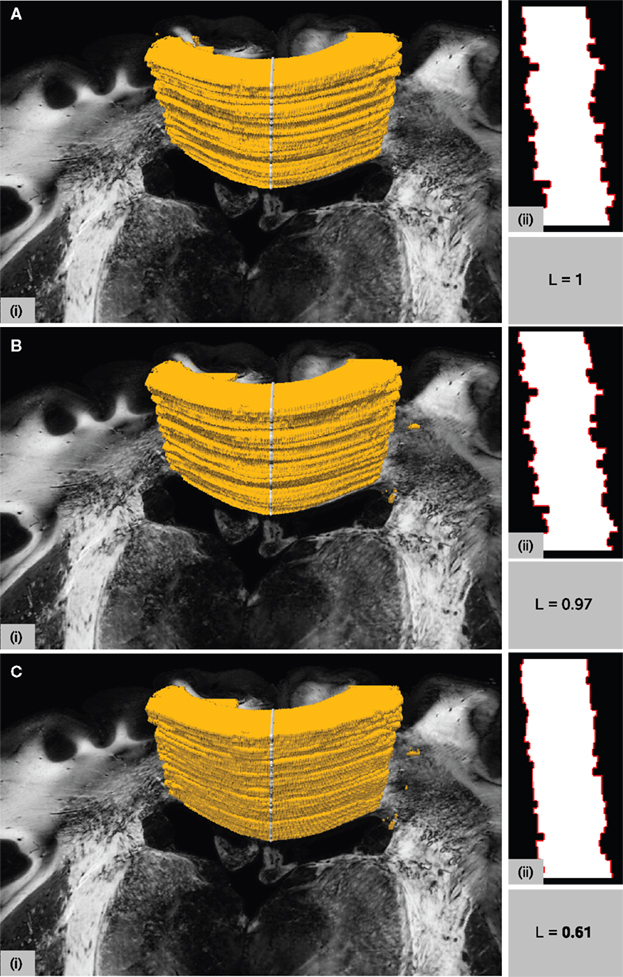
Figure 9. Surface rendering of the corpus callosum after manual segmentation together with one of the PLI retardation images in the background (i). The surface cut indicated by the grey line on top of the surface forms the shape in (ii) with contours highlighted in red. Different shapes result from different transformations after rigid (A), affine (B) and affine followed by fluid registration (C). The length L of the red lines is measured and normalised to L = 1 for the rigid transformation. Assuming a smooth shape for anatomical correct registration, decreasing L means increasing accuracy.
Analyses of Reorientation
Different ways of FOV reorientation were analysed using the corrected spatial positions after affine and subsequent fluid registration.
Before reorientation the field was smooth but did not reflect the morphology precisely enough (Figures 10
A–C). The reorientation enhanced the correlation between morphology and vector paths (Figures 10
D–F). This was recognisable, e.g. by the well known fibre orientations in the internal capsule and the corpus callosum. The reoriented FOMs after combining affine and fluid registration parameters,  did not considerably increase the amount of further reorientation in comparison to affine reorientation only.
did not considerably increase the amount of further reorientation in comparison to affine reorientation only.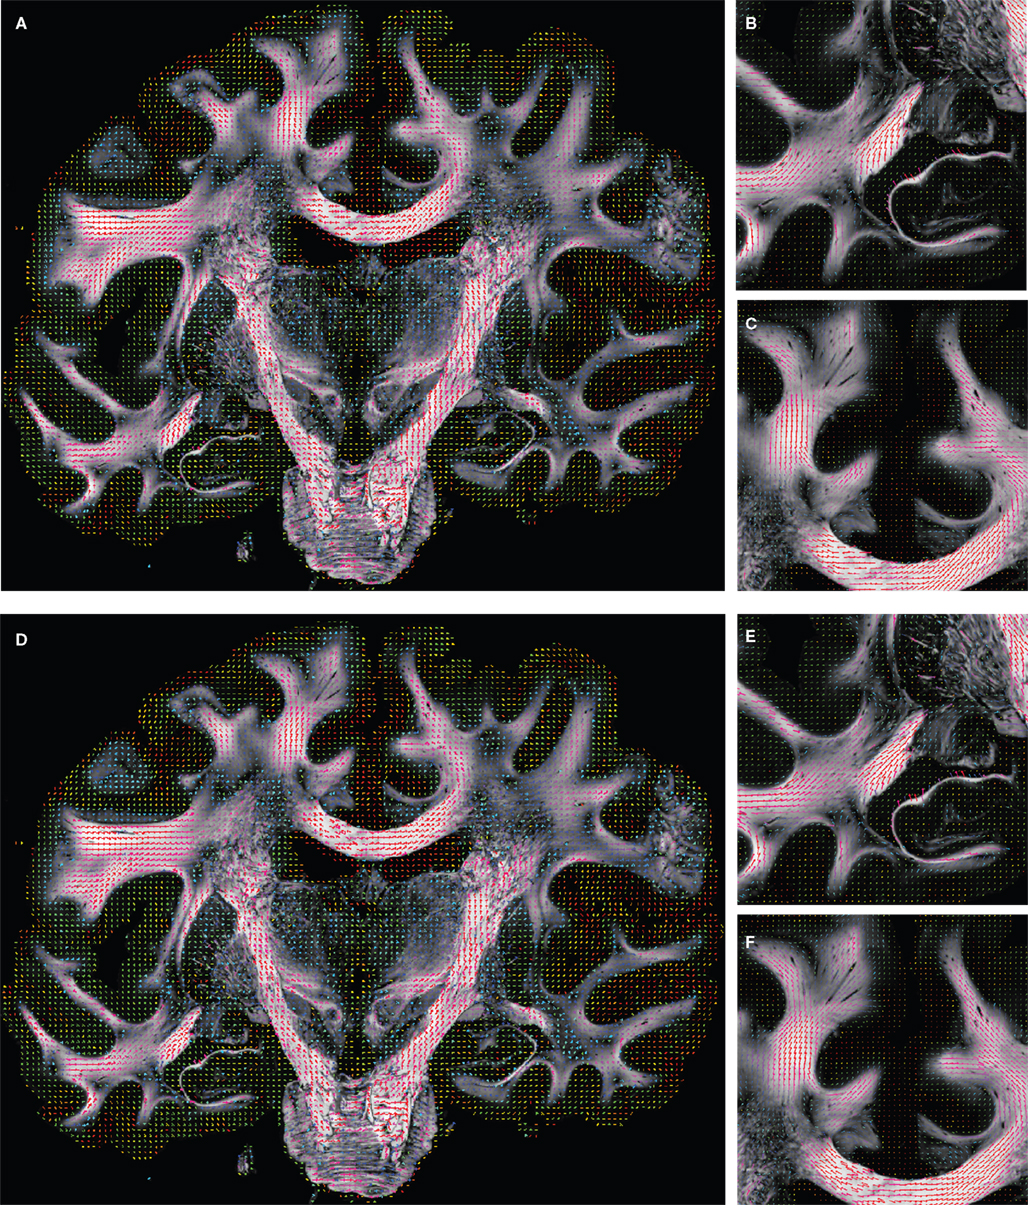
Figure 10. Registered FOM overlaid by the corresponding retardation map. The vectors are shown before (A–C) and after reorientation by affine parameters (D–F). For visualisation the vectors of the FOM are subsampled. The zoomed images (B, C) and (E, F) show the same regions as marked in Figure 7
with the temporal (B, E) and mesial frontal cortex including the corpus callosum (C, F). The colour, length and thickness of the vectors encode the length of the 2D-projection of the 3D-fibre vector. Red colours correspond to vectors within the imaging plane, blue ones to vectors orthogonal to the imaging plane, while green and yellow ones represent transitional inclinations.
To compare affine and fluid-based reorientation, 2D difference vectors d1 and d2 were computed:

d1 represents the local effect of affine reorientation in comparison with the original orientation whereas d2 represents the additional effect of fluid-based reorientation. The affine reorientation showed largest effects for those vectors with small z-component and, thus, small inclination (Figure 11
) especially within the corpus callosum and the internal capsule. The rotation was constant for all pixels and the shearing parameter was relatively small.
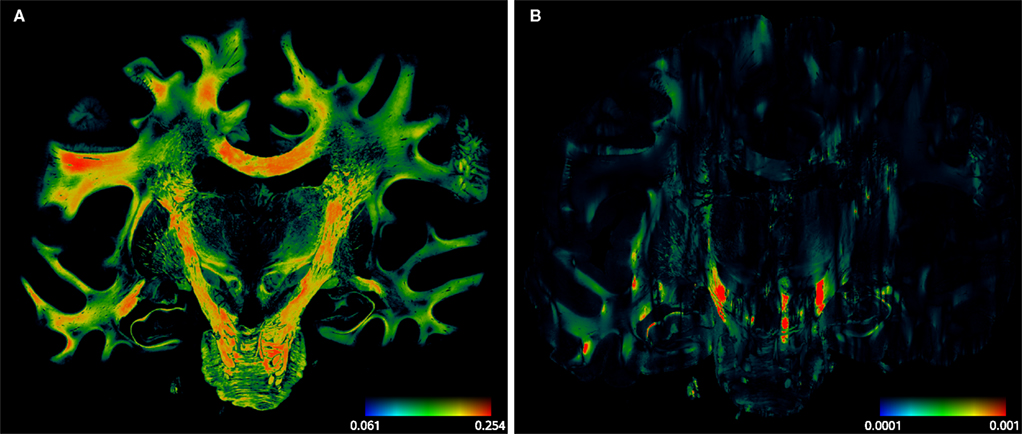
Figure 11. Absolute vector difference images |d1| for reorientation after affine (A) and |d2| additional fluid-induced transformation (B) with di defined in Eq. 18. The colour encodes the length of the difference vectors. The contrast is enhanced for both images individually. The amount of reorientation induced by affine transformation was significantly larger than the additional reorientation induced by non-linear transformation.
The absolute amount of the reorientation effect is presented in Table 2
. The mean effect of affine-based reorientation (Figure 11
A) was with 0.2007 significantly higher than the additional effect of 0.0022 by fluid-based reorientation (Figure 11
B). After registration and reorientation, the 3D volume of FOVs (Figure 12
) can serve as input for subsequent fibre tracking.
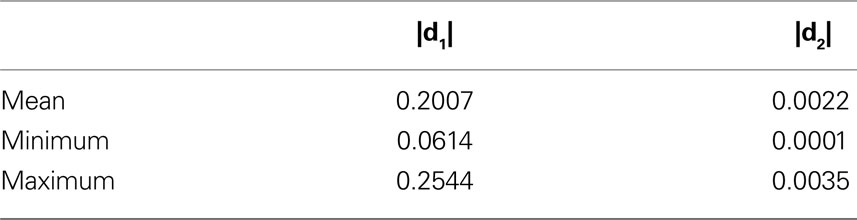
Table 2. Length of the difference vectors as defined in Eq. 18 for reorientation after affine (d1, Figure 11
A) and additional fluid transformation (d2, Figure 11
B). For each 2D image, the mean of |d1| and |d2| is computed for all pixels with a z-component of less than 0.3. |di| is a dimensionless quantity with 0 ≤ |di| ≤ 1. Mean, minimum and maximum correspond to 36 slices included into the present analysis.
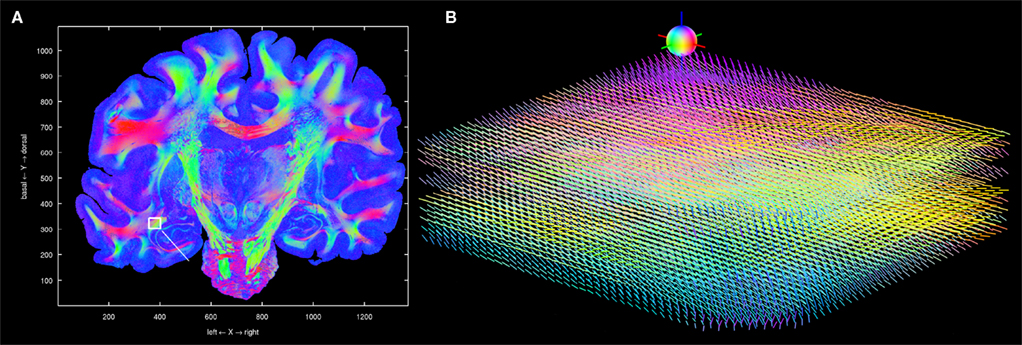
Figure 12. Visualisation of 3D fibre vectors for nine registered and reoriented sections (B) in the region of the temporal white matter. The viewing direction is marked by a white line in (A). The colour encodes the direction of the vectors: left-right (red), basal-dorsal (green) and rostral-occipital (blue).
Polarised light imaging shows myelinated fibres and fibre bundles with microscopic resolution. For our polarimeter the optimal section thickness was determined to be 100 μm (Axer et al., 2001
), i.e., the resolution in the z-direction is of the same size. In this study, the in-plane resolution was also set to 100 μm to ensure isotropic data although the present set-up allows a maximum in-plane resolution of 25 μm and a corresponding image size of 12 million pixels. Such superior spatial resolution as compared to in vivo methods, e.g. DTI, however, is a challenge to exploit in fibre tracking studies of the human brain based on histological sections. Fibre tracking becomes feasible only after high quality 3D reconstruction of the numerous serial sections through a whole human brain or regions of interest. We here present a processing pipeline for 3D reconstructions of series of cryosections. A further challenge of the setup is due to the vector nature of the PLI images. This implicates not only the multi-modality of the problem caused by different grey value distributions of blockface images and PLI parameter maps; it also implies that each spatial transformation entails a vector reorientation.
The high in-plane resolution was preserved using high-resolution blockface images as spatial reference during registration. Comparing spatial transformations with increasing degrees of freedom, i.e., from rigid to fluid transformations, best realignment was achieved by a combination of affine and fluid registration. In a first step, the geometrical distortions of the cryosections have been removed by image transformation. Sequentially, FOVs have been reoriented relying on the transformation fields calculated initially. The results of spatial transformation and of vector reorientation are respectively discussed in the following paragraphs.
Spatial Transformation
Global and local deformations of the brain tissue as well as artefacts like tears are unavoidable due to the cutting and preparation process. They have to be corrected for fibre tract mapping. Here we focus on the cutting distortions, which become apparent in the difference between blockface reference and PLI section. The registration of PLI sections onto the reference images yields a 3D volume, where affine deformations between the living human brain and the fixed post-mortem brain remain. The correction of such deformations was successfully applied by registration of the blockface volume onto the individual MRI volume (Schormann et al., 1995
).
We studied the quality of registration of PLI maps to blockface images, and compared transformations with increasing degrees of freedom (rigid, affine and non-linear with affine pre-processing) using the DC and NMI as quantitative metrics. DC relates on the shape of the whole-brain section after automatic segmentation of the tissue in blockface images as well as retardation (PLI) maps. DC represents the overlap of the tissue segments and focus on the alignment of the outer contours. NMI is derived from image intensities and characterises the image similarity. Hence, NMI considers in particular contingent structure of deep brain regions. It was already applied as similarity metric for optimisation during registration, and, thus, is accompanied by DC and a smoothness metric to assess the registration quality.
The difference between the rigid transformation and higher parametrical transformations is visually evident, although the differences between the overlap region of rigid and other transformations are numerically low. With a mean value of 0.954 in comparison to 0.963 all transformations show DC values near the maximum. This shows, that the outer shape of the brain tissue is recovered more or less by all three transformations. NMI reveals the need of a non-linear transformation with a mean value of 1.298 in comparison with a rigid or affine transformation showing a mean NMI value of 1.287. Taking deep brain structures into account, non-linear transformations increase the consistency of tissue imaging before and after cutting and mounting.
Additionally, a smoothness metric was calculated with respect to a deep brain structure, the corpus callosum. It revealed an increase of smoothness and, thus, an increase of registration quality of 37% for fluid registration as compared to affine registration only. Moreover, regions with large deformation due to histological processing like the temporal lobe, also showed a high correspondence between the PLI image and the reference after fluid transformation.
In general, the non-linear, fluid registration is able to correct large deformations. However, a path of corresponding intensities and structures must be available to steer the gradient-based optimisation. This precondition was fulfilled for the data included here. Data showed only marginal tearing effects, which resulted in a smooth deformation field. The fluid approach used a four level multi-resolution hierarchy and constant viscosity parameters (see Analyses of Transformations). The optimisation converged already at a grid size of (1024 × 800) due to the low contrast and low signal-to-noise ratio of the blockface reference. The choice of the viscosity parameters is quite robust and has in a wide range low effect on the registration results (Leporé et al., 2008
).
Our study has shown in conclusion, that high-parametrical spatial transformations are necessary to correct for distortions introduced during sectioning and further tissue processing.
Vector Reorientation
The reorientation of the FOVs is necessary to recover the undistorted orientation of fibre bundles after sectioning. The successful application of the here presented vector reorientation method demonstrated by the smoothness of the resulting FOV array, i.e. no abrupt jumps in the orientation of corresponding vectors occurred between neighbouring sections. The FOV arrays reflected also the original brain morphology. This was verified in regions where the orientation of fibres is well known such as the internal capsule and the corpus callosum.
The FOV is characterised by an ambiguity arising from the unknown sign of the inclination angle. The inclination again is independent of the vector direction and, therefore, independent of registration parameters. Solving the inclination ambiguity is crucial for subsequent fibre tracking. Assuming the continuity of adjacent 3D orientation vectors, smooth vector fields are likely to occur. Simulated annealing approaches were proposed for the smoothing of the vector fields (Larsen and Griffin, 2004
). Promising results were shown for small patches of simulated data. For fibre tracking on human whole-brain sections, however, such methods have to be modified and adapted.
The effects of the registration steps (affine, fluid) on vector reorientation differed from each other. To quantify the impact of a transformation on the FOV direction, the mean distance between original and reoriented vector was calculated. It showed, that the impact of the affine transformation on vector reorientation is up to a hundred times higher than the additional non-linear transformation. However, the non-linear approach is a crucial prerequisite for further analysis. This has been illustrated by the significantly increased smoothness of the contours of the corpus callosum. Subsequent tractography would result in wrong pathways, if the alignment of corresponding nerve fibres is less accurate than 1 mm, since this would create large parts of discontinuity of callosal fibres. It has to be differentiated between spatial transformation and vector reorientation induced by spatial transformation. The low effect of non-linear transformation on vector reorientation is not surprising, because the fluid registration was applied additionally to the affine transformation, and, thus, global rotations were already compensated by the affine registration.
A second reason for larger effects of the affine as compared to the non-linear transformation is in the nature of the high-resolution deformation field assigning one deformation vector to each pixel (see Figure 8
). The smoothness of the field is not only influenced by affine pre-alignment, but also by the mathematical regularisation term and the gradient of NMI. The temporal pole may serve as an example. Here, even large deformations were correctly removed. Rotation of small patches within the image, however, is only detectable within a narrow neighbourhood, in close proximity to the centre of rotation. With increasing distance to the centre of rotation, the direction of neighbouring displacement vectors is hardly distinguishable from a translation. In this respect, the approximation of the non-linear deformation field by a local affine transform would underestimate the reorientation angle for the fibre vectors. Improvements would be expected by estimating the parameters of piecewise or local affine transformations (Pitiot et al., 2006
; Commowick et al., 2008
), which take information of larger neighbourhoods of the deformation field into account.
Perspectives and Conclusions
Diffusion tensor imaging and diffusion spectrum imaging are currently the methods of choice for in vivo studies of the human fibre tracts (Basser et al., 1994
; Basser and Jones, 2002
; Schmahmann et al., 2007
). Diffusion-based tractography allows the detection of fibre pathways between distinct brain regions (Mori and van Zijl, 2002
). Presently, however, the results of DTI based fibre tracking (Koch et al., 2002
; Mori and van Zijl, 2002
) cannot be validated due to a missing independent method for verification. Additionally, DTI has a spatial resolution, which is considerably lower than would be necessary to resolve small fibre bundles and single axons, and to overcome problems caused by fibre crossing. False positive and false negative results make the interpretation of in vivo fiber tracking challenging (e.g., Pittsburgh Brain Competition 2009, http://pbc.lrdc.pitt.edu) Ultra-high resolution fibre tract mapping based on PLI can provide an independent and powerful alternative with a spatial resolution by an order of a magnitude higher than DTI. Thus, PLI combined with 3D reconstruction and fibre tracking has the potential to enhance human brain mapping at a microscopical level.
Our experiments proved the necessity of non-linear transformations for the 3D-reconstruction of PLI images. Together with vector reorientation, smooth and morphologically consistent FOV arrays were calculated. With artefact removal, parameter fitting, 3D reconstruction and vector reorientation the way is paved for fibre tracking and fibre tract mapping at ultra-high resolution.
The authors declare that the research was conducted in the absence of any commercial or financial relationships that could be construed as a potential conflict of interest.
The authors would like to thank M. Cremer, Research Centre Jülich, Germany, as well as U. Blohm and U. Opfermann, University Düsseldorf, Germany, for the brain preparation. We also thank J. Hipwell, Centre of Medical Image Computing (CMIC), University College London, GB, for providing the vector visualisation software. This work was partly supported by the Initiative and Network Fund of the Helmholtz Association within the Helmholtz Alliance on Systems Biology.
Andreasen, A., Drewes, A. M., Assentoft, J. E., and Larsen, N. E. (1992). Computer-assisted alignment of standard serial sections without use of artificial landmarks. A practical approach to the utilization of incomplete information in 3-D reconstruction of the hippocampal region. J. Neurosci. Methods 45, 199–207.
Dubois, A., Dauguet, J., Hérard, A.-S., Besret, L., Duchesnay, E., Frouin, V., Hantraye, P., Bonvento, G., and Delzescaux, T. (2007). Automated three-dimensional analysis of histological and autoradiographic rat brain sections: application to an activation study. J. Cereb. Blood Flow Metab. 27, 1742–1755.
Dubois, A., Hérard, A.-S., Flandin, G., Duchesnay, E., Besret, L., Frouin, V., Hantraye, P., Bonvento, G., and Delzescaux, T. (2008). Quantitative validation of voxel-wise statistical analyses of autoradiographic rat brain volumes: application to unilateral visual stimulation. Neuroimage 40, 482–494.
Lee, J. S., Ahn, S.-H., Lee, D. S., Oh, S. H., Kim, C. S., Jeong, J. M., Park, K. S., Chung, J.-K., and Lee, M. C. (2005). Volxel-based statistical analysis of cerebral glucose metabolism in the rat cortical deafness model by 3D reconstruction of brain from autoradiographic images. Eur. J. Nucl. Med. Mol. Imaging 32, 696–701.
Yelnik, J., Bardinet, E., Dormont, D., Malandain, G., Ourselin, S., Tandé, D., Karachi, C., Ayache, N., Cornu, P., and Agid, Y. (2007). A three-dimensional, histological and deformable atlas of the human basal ganglia. I. Atlas construction based on immunohistochemical and MRI data. Neuroimage 34, 618–638.