Effects of attention on what is known and what is not: MEG evidence for functionally discrete memory circuits
Medical Research Council, Cognition and Brain Sciences Unit, Cambridge, UK
Recent results obtained with a neural-network model of the language cortex suggest that the memory circuits developing for words are both distributed and functionally discrete. This model makes testable predictions about brain responses to words and pseudowords under variable availability of attentional resources. In particular, due to their strong internal connections, the action-perception circuits for words that the network spontaneously developed exhibit functionally discrete activation dynamics, which are only marginally affected by attentional variations. At the same time, network responses to unfamiliar items – pseudowords – that have not been previously learned (and, therefore, lack corresponding memory representations) exhibit (and predict) strong attention dependence, explained by the different amounts of attentional resources available and, therefore, different degrees of competition between multiple memory circuits partially activated by items lacking lexical traces. We tested these predictions in a novel magnetoencephalography experiment and presented subjects with familiar words and matched unfamiliar pseudowords during attention demanding tasks and under distraction. The magnetic mismatch negativity (MMN) response to words showed relative immunity to attention variations, whereas the MMN to pseudowords exhibited profound variability: when subjects attended the stimuli, the brain response to pseudowords was larger than that to words (as typically observed in the N400); when attention was withdrawn, the opposite pattern emerged, with the response to pseudowords reduced below the response to words. Main cortical sources of these activations were localized to superior-temporal cortex. These results confirm the model’s predictions and provide evidence in support of the hypothesis that words are represented in the brain as action-perception circuits that are both discrete and distributed.
The brain discriminates stimuli that are familiar and meaningful from unknown and senseless materials. This ability is well exemplified by the observed differential MEG/EEG (magneto- and electroencephalography) responses to familiar meaningful words and previously unknown, meaningless pseudowords. For example, a well-known and robust neurophysiological index of lexical-semantic processing elicited under conditions where subjects are attending to the input is the N400 (Kutas and Hillyard, 1980
), a negative-going event-related potential (ERP) peaking around 400 ms after stimulus onset. The N400 is larger for senseless materials (meaningless pseudowords) than for matched meaningful linguistic stimuli (common words). Figure 1
A shows an example of this type of ERP response (adapted from Friedrich et al., 2006
).
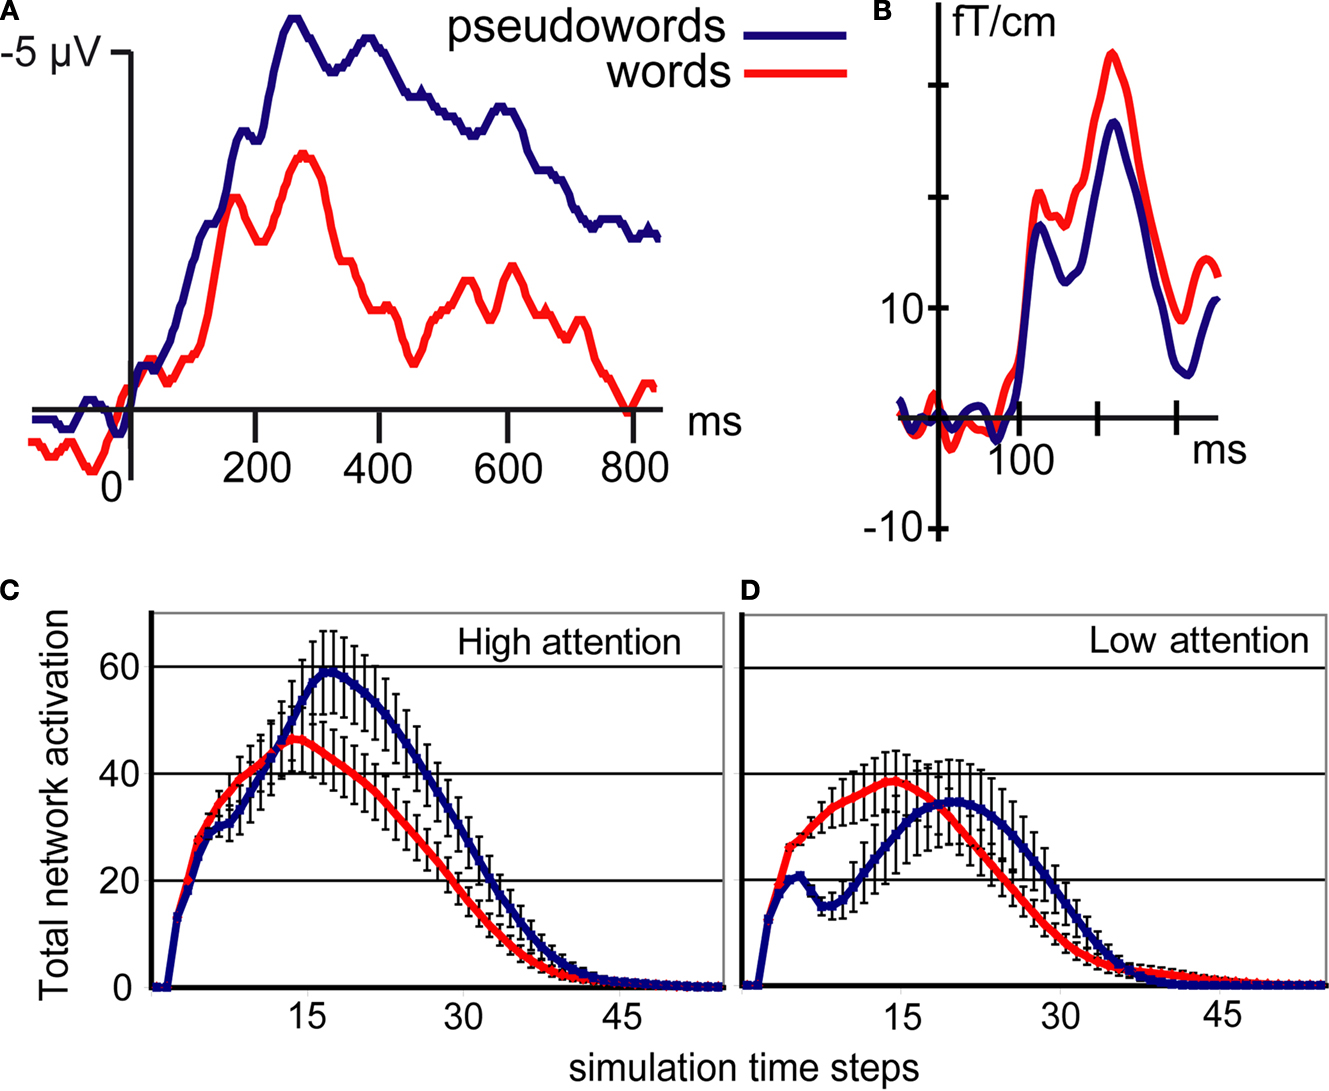
Figure 1. Real (top) and simulated (bottom) brain responses to word (red) and pseudoword (blue) stimuli. (A) Typical N400 response. Note the large N400 amplitude to pseudowords (modified from Friedrich et al., 2006
; their Figure 3C). (B) Magnetic Mismatch Negativity (MMN) response; note that the MMN in word context (red curve) is enhanced if compared with that in pseudoword context (adapted from Pulvermüller et al., 2001
). (C,D) Simulated brain responses to words and pseudowords under different amounts of attention. Note the significant modulation of the pseudoword (blue) curves (adapted from Garagnani et al., 2008
).
Differences in neurophysiological brain responses to words and pseudowords have been recorded also at short latencies (e.g., Hauk et al., 2006a
; Segalowitz and Zheng, 2009
; Sereno et al., 1998
), especially in the mismatch negativity response. The mismatch negativity (Näätänen et al., 1978
) is an early event-related response (latency 100–250 ms) elicited in oddball experiments by infrequent acoustic events (so-called “deviant stimuli”) presented occasionally among frequently repeated sounds (“standard stimuli”). In addition to its known role as an index of automatic change detection, the MMN has been reported to be sensitive also to phonological and lexical level processing (Näätänen et al., 1997
) (for reviews on mismatch negativity application to neuroscience of language, see Pulvermüller and Shtyrov, 2006
; Näätänen, 2007
; Shtyrov and Pulvermüller, 2007b
). In particular, under strict control of physical/acoustic stimulus properties, and keeping the variability of naturally spoken materials minimal, words were found to elicit greater mismatch negativity responses than pseudowords (Korpilahti et al., 2001
; Pettigrew et al., 2004
; Pulvermüller, 2001
; Pulvermüller et al., 2001
; Shtyrov and Pulvermüller, 2002
). Figure 1
B shows the magnetic correlate of the mismatch negativity (MMN) to spoken word and pseudoword stimuli. Unlike the N400, the MMN is larger to words than to pseudowords.
Typically, the MMN is elicited in the passive oddball task, where subjects are instructed to focus their attention on a silent film and ignore the auditory stimuli. The fact that stimuli are processed “outside the focus of attention” may thus lead to the opposite patterns of responses seen in the N400 (N400 larger for pseudowords, MMN larger for words). We have recently offered an explanation of this pattern of results on the basis of simulations carried out in a neuronal network model implementing the neuroanatomical structure of the human language cortex along with principles of neurophysiological function (Garagnani et al., 2008
). By means of sensorimotor correlation and Hebbian learning, we first trained the network to associate pairs of auditory and articulatory activation patterns: as a result, neuronal word representations distributed over the different “cortical areas” of the model emerged. The network was then stimulated – in its “auditory cortex” – with either previously learned word or new pseudoword patterns. Following the biased competition model of attention (Desimone and Duncan, 1995
; Duncan, 1996
, 1980
; Duncan and Humphreys, 1989
), attentional resources were modulated by changing the level of global cortical inhibition (thus allowing for more or less activation in the network)
1
. The simulated responses to words and pseudowords processed with high and low attentional resources are plotted in Figures 1
C,D.
Critically, the network model explains – at the cortical-circuit level and using neuroscientifically grounded principles – the opposite neurophysiological activation patterns to words and pseudowords seen in N400 and MMN experiments. The explanation rests on the fact that words activate discrete cell assemblies whose strong internal connections guarantee that activation is largely independent of external inhibition level (Hebb, 1949
; Pulvermüller, 1999
). Pseudoword stimuli, in contrast, activate several competing representations and global inhibition determines the degree to which their activations may co-exist. With attention to stimuli, the model response is therefore larger to pseudowords than to words, but under limited attentional resources (stronger inhibition) pseudoword responses are reduced below the level of word responses.
Although the model provides a tentative explanation of N400 and MMN results, it attributes the difference to a single factor (attention), and it is this statement that needs testing in new critical neurophysiological experiments. Comparing typical tasks used to record the N400 and the passive oddball paradigm, where the lexical MMN enhancement is seen, there are differences in memory requirements, lexico-semantic processing, context processing, variability and repetition of stimuli and, of course, attentional demands. These multiple differences make it impossible to attribute with certainty any neurophysiological differences to a single psychological variable. Here, we set out to test the neurophysiological validity of the model, namely, its specific prediction that, keeping all other features constant, focussed attention to speech is the critical variable leading to the reversal of the neurophysiological lexicality effect. A second prediction was that such inversion is mainly produced by the (strong) modulation of the pseudoword response, whereas the word response stays relatively stable (refer to Figures 1
C,D). In order to administer this critical experiment, we used variants of the oddball task. To precisely control for stimuli properties, we applied an orthogonal design where the same sounds were played in word and pseudoword contexts. In addition, attention was also varied orthogonally, so that, for each lexical context, the same sounds were processed while attention was either directed (1) to speech, or (2) away from speech.
Subjects
Twenty healthy right-handed (Oldfield, 1971
) monolingual native speakers of English (nine women) aged 20–41 years participated in all parts of the experiment. They had no record of neurological diseases, vision or hearing problems, and reported no history of drug abuse. All subjects gave their written informed consent to participate in the experiment and were paid for their participation. The experiments were performed in accordance with the Helsinki Declaration. Ethics approval had been issued by the Cambridge Psychology Research Ethics Committee (CPREC).
Design
The processing of spoken words and pseudowords was studied in two tasks carried out in two separate sessions, administered on separate days and referred below to as “Attend” and “Ignore” sessions. Attention was manipulated in the two sessions by instructing subjects to either focus completely on the auditory stimuli (Attend) or on a silent film (Ignore). The auditory stimuli were identical across the two sessions. Two films were used for the two sessions. Each session consisted of two blocks. Session order and block order were counter-balanced across subjects; the pairing of session with film was randomised. As Table 1
shows, we adopted an orthogonal design: across the two blocks, lexicality and acoustic-phonetic features of the auditory stimuli were varied independently of each other. This design provides for strict control of physical stimulus properties, enabling the detection of brain correlates of lexicality and attention without any acoustic/phonetic confounds (see details below).
Instructions
In both sessions, subjects were seated in front of a screen on which a silent film was projected; during the recording, auditory stimuli were delivered binaurally to them. In the Ignore session, subjects were asked to ignore the sounds and focus their attention on the film; they were told that at the end of the session they would be given a test on the film’s contents to verify whether they had paid attention to it. In the Attend session, subjects were instructed to ignore the film (but not close their eyes), focus their attention on the sounds and react to some of them by pressing a button (with their left index finger). In order to familiarize with the auditory target detection task, subjects were given a 15-min training prior to the beginning of the session.
Behavioural Tests
At the end of each session, subjects were asked to rate (on a scale from 1 to 7) the amount of attention that they had paid to the sounds and silent video during the session, and had to answer 10 multiple-choice questions (see Supplementary Material) on the contents of the film that had been shown on the screen. Subjects were also asked to rate (on a scale from 0 to 10) meaningfulness (10, 10, 0.2, 0.25), frequency of use (7.1, 6.3, 0.1, 0), comprehensibility (9.2, 9.4, 0, 0.1) and imageability (9.4, 9.8, 0, 0) of all stimuli (the values in brackets indicate the average ratings for the two words and two pseudowords of interest – see below). The pseudoword ratings never differed significantly from zero, and no significant differences emerged between words on any of the above measures, indicating that the psycholinguistic features of the stimulus words were well matched.
Stimulus Preparation and Delivery
Digital recordings (sampling rate 44.1 kHz) of a large sample of the items [baj], [paj], [hajp], *[hajt], [hajk] and *[hajg] spoken in random order by a female native English speaker were acquired in a soundproof room. From this set we chose a pair of CV syllables [baj] and [paj] and extracted the syllable-final phonemes [p], [t], [k] and [g]. The two chosen CV syllables had the same F0 frequency (272 Hz), and were carefully adjusted to have equal duration (330 ms) and average sound energy, or root-mean-square (RMS) power (−9.4 dB relative to the maximal amplitude allowed by the stimulus file format)
2
. The chosen samples of the critical phonemes [p], [t] had the same length (75 ms) and similar envelopes; their amplitudes were also normalized to match for averaged RMS power (−36.6 dB).
The full set of stimuli used in the experiment (including the two critical words [bajt] (bite) and [pajp] (pipe) and pseudowords *[bajp] and *[pajt]; refer to Table 1 and Figure 2
, Bottom) was obtained by cross-splicing the same recordings of the coda consonants [p], [t], [k], [g] onto both CV syllables [baj] and [paj]. This avoided differential coarticulation cues and minimized acoustic differences between the stimuli. The silent closure time between CV end and onset of the plosion of the final stop consonant was adjusted to a value typical for English unvoiced (80 ms) and voiced (30 ms) stops. The four stimuli to be used as “targets” in the Attend condition were built from those ending in [k] and [g] by lengthening the closure time by 150 ms (thus obtaining stimuli having 230 and 180 ms closure time, respectively), a phenomenon occurring naturally in the geminate stops of some languages (e.g., Finnish, Italian). This was intended to make the detection of targets more challenging for the monolingual native English speakers.
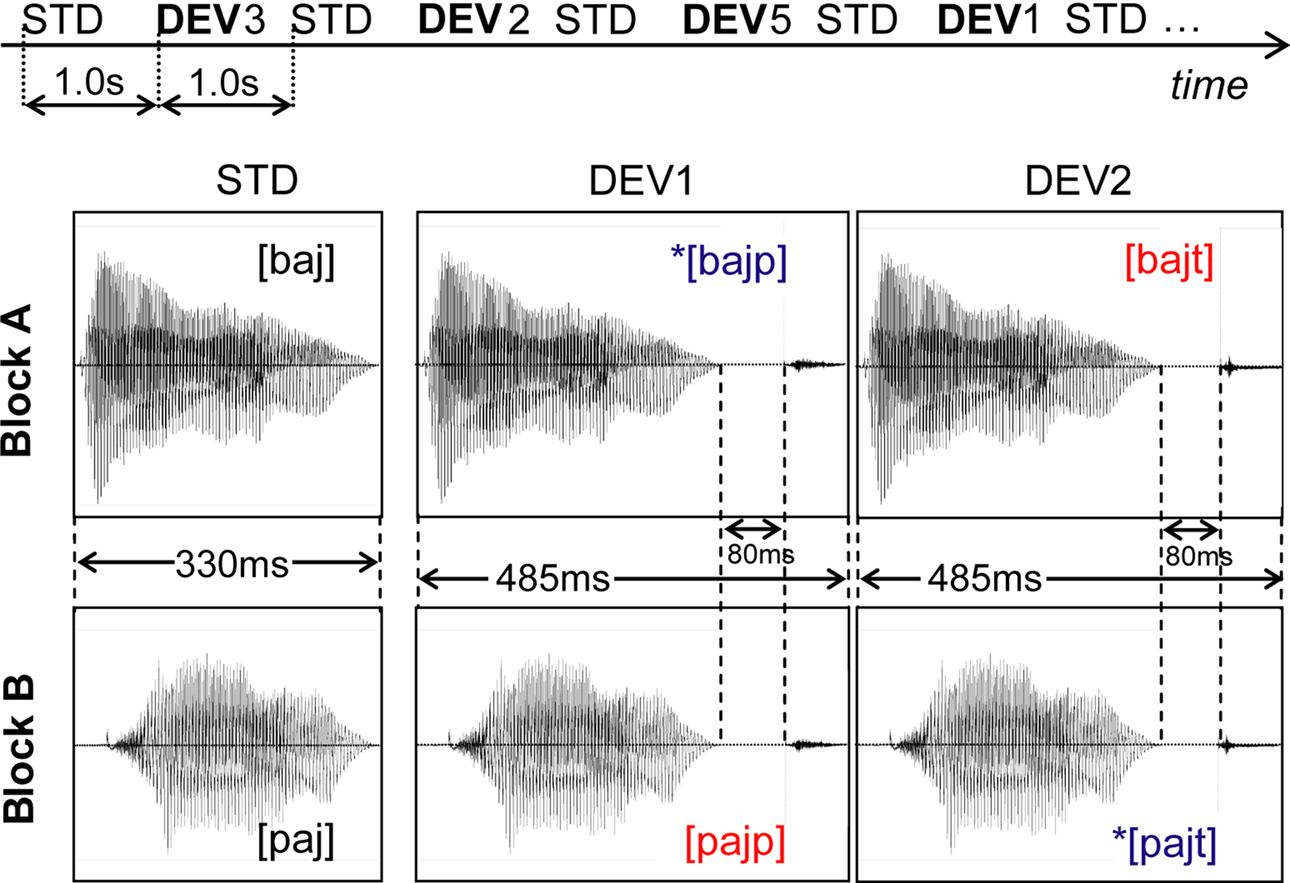
Figure 2. Stimulation paradigm and waveforms of stimuli of interest. Top: schematic illustration of the multi-feature design used for the presentation of the auditory stimuli (STD = standard, DEV = deviant stimulus; horizontal axis represents time). Bottom: waveforms of the standard and deviant stimuli of interest, with respective durations and phonetic representation. The additional deviant stimuli used (waveforms not shown) were: DEV3 = STD + 80 ms closure time + [k]; DEV4 = STD + 30 ms closure time + [g]; DEV5a = STD + 230 ms closure time + [k], DEV5b = STD + 180 ms closure time + [g], DEV5c = STD. See text for details.
For the analysis and generation of the acoustic stimuli, we used the CoolEdit 2000 program (Syntrillium Software Corp., AZ, USA). The stimuli were delivered at a comfortable hearing level through plastic tubing attached to foam earplugs using the MEG compatible sound-stimulation system based on ER·3A insert earphones (Etymotic Research, Inc., IL, USA). The delivery was controlled by a personal computer running E-prime software (Psychology Software Tools, Inc., Pittsburgh, PA, USA).
Procedures
The auditory stimuli were delivered using a multi-feature design (Kujala et al., 2007
; Näätänen et al., 2004
). Conforming to this paradigm, the standard stimulus (STD) – appearing in the odd positions of the sequence (i.e., 1, 3, 5, 7, …) – was alternated with five different deviant stimuli, DEV1–DEV5, randomly inserted in the even positions (Figure 2
, Top). DEV1–4 (10% frequency) were built by appending one of the consonants [p], [t], [k], [g] to the STD (refer to Stimulus Preparation and Delivery). The fifth deviant stimulus, DEV5, was either one of the two targets that the subjects had been instructed to respond to (DEV5a and DEV5b, each 2.5%) or a STD appearing in a deviant (even) position (DEV5c, 5%). In sum, this resulted in 10% each of DEV1–DEV4, 2.5% of DEV5a and DEV5b, 5% of DEV5c and 50% of standards. The stimulus onset asynchrony (SOA, delay between onsets of two consecutive stimuli) was 1000 ms. Each block contained a sequence of 1920 stimuli, providing 32 min of auditory stimulation.
During each session recorded in the Attend condition, subjects were provided online feedback on their performance (hit rate and number of false alarms) at four different times (in the middle and at the end of each of the two blocks) to ensure their attention to the stimuli; at these time points, auditory and visual stimulation was temporarily suspended. In the Ignore condition sessions, auditory and visual stimulation was also suspended briefly at the same time points (during which the condition of the subjects was assessed).
MEG Recording
Throughout the experiment, the brain’s magnetic activity was continuously recorded using a 306-channel Vectorview MEG system (Elekta Neuromag, Helsinki, FI, USA) with passband 0.10–330 Hz and 1 kHz sampling rate. To enable the removal of artifacts introduced by head movements, the position of the subject’s head with respect to the recording device was tracked throughout the session. In order to do so, magnetic coils were attached to the head and their position (with respect to a system of reference determined by three standard points: nasion, left and right pre-auricular) was digitized using the Polhemus Isotrak digital tracker system (Polhemus, Colchester, VT, USA). To allow the off-line reconstruction of the head model, an additional set of points randomly distributed over the scalp was also digitized. During the recording, the position of the magnetic coils was continuously tracked (continuous HPI, 5 Hz sampling rate), providing information on the exact position of the head in the dewar. Four EOG electrodes where placed laterally to each eye (horizontal EOG) and above and below the left eye (vertical EOG) to monitor eye movements during the recording.
MEG Data Processing
For each subject, MEG channel, block and condition, we applied the following preprocessing steps:
(a) The continuous raw data from the 306 channels were pre-processed off-line using MaxFilter™ software (Elekta Neuromag, Helsinki), which minimises possible effects of magnetic sources outside the head as well as sensor artifacts using a Signal Space Separation method (Taulu and Kajola, 2005
; Taulu et al., 2004
). MaxFilter was applied with spatio-temporal filtering and head-movement compensation, which corrected for within-block motion artifacts.
(b) Using the MNE Suite (Martinos Center for Biomedical Imaging, Charlestown, MA, USA), stimulus-triggered event-related fields (ERFs) starting at 100 ms before stimulus onset and ending 500 ms after offset were computed from the MaxFiltered data for each stimulus of interest ([baj], [paj], [bajt], *[bajp], *[pajt], [pajp]). Epochs containing gradiometer, magnetometer or EOG peak-to-peak amplitudes larger than 3000 fT/cm, 6500 fT or 150 μV, respectively, were rejected. Only ERFs with a minimum of 100 accepted trials were used. The responses to the (deviant) stimuli ending in [k] or [g] were excluded from the analysis because of their acoustic similarity to the target stimuli.
(c) In each block, the magnetic MMNs were obtained by subtracting the averaged response to the CV sound presented as standard stimulus from that to the CVC deviant stimuli; i.e., in each block, the ERF to the STD was subtracted from the ERFs to the deviants DEV1 and DEV2 (see Figure 2
). (Note that, thanks to the orthogonal design adopted, this subtraction cannot affect the statistical comparisons described below – see Statistical Analysis).
(d) The resulting magnetic MMN were detrended, filtered on 2–20 Hz and baseline-corrected. The baseline used was the 80-ms silent period preceding the point at which STD and DEV differed for the first time (see Figure 2
), the onset of the plosion of the syllable-final (coda) stop consonant. This interval (330–410 ms after standard stimulus onset) will be referred to below as “pre-coda baseline”. The responses to the standard CV stimuli (analysed separately) were also detrended, filtered on 2–20 Hz, and baseline-corrected using the 100-ms preceding stimulus onset (“pre-stimulus baseline”).
(e) The amplitude of the local magnetic gradient response was computed for each pair of orthogonal gradiometers as the square-root of the summed squares (SRSS) of their amplitudes (i.e.,  where x and y are the signals from the two gradiometers). The resulting SRSS data were used in the statistical analysis and for producing grand-average data. Matlab 6.5 programming environment (Matlab 6.5, MathWorks, Boston, MA, USA) was used for preprocessing steps (c)–(e).
where x and y are the signals from the two gradiometers). The resulting SRSS data were used in the statistical analysis and for producing grand-average data. Matlab 6.5 programming environment (Matlab 6.5, MathWorks, Boston, MA, USA) was used for preprocessing steps (c)–(e).Finally, in order to estimate the cortical sources underlying the magnetic MMN, we applied a minimum-norm current estimation (MCE) technique (Hämäläinen et al., 1993
; Ilmoniemi, 1993
), L1 MCE (Uutela et al., 1999
), which minimizes the sum of the rectified current amplitudes over the whole brain, and has been previously shown to produce a realistic and robust set of generators in experiments on spoken language processing (Pulvermüller et al., 2003
, 2005
). Cortical source estimates were computed using signals recorded from both gradiometers and magnetometers. Using the MCE Matlab toolbox (Elekta Neuromag, Helsinki), MCEs were calculated for the across-subject averaged MMN responses for each Stimulus type (word or pseudoword), Condition and time point (in 20-ms time-steps), and projected on a triangularized gray matter surface of an averaged brain (Uutela et al., 1999
).
Statistical Analysis
Statistical analyses were performed on local magnetic gradient responses. Using the maximal local SRSS of the standard responses in the Ignore condition, we computed signal-to-noise ratios (SNR) as the ratio between the peak in the 0–150-ms interval post stimulus onset and the peak in the pre-stimulus baseline. Only datasets with SNR > 5 were included in further analyses.
Loci with the largest MMN gradient vector amplitudes were entered in the analyses. These were located above the left hemisphere’s temporal and fronto-central areas (see Results). For each locus, the averages of the local SRSS of the magnetic MMN were computed for the 60-ms window around the peak of the maximal local SRSS response. To ascertain the effects of attention on the brain responses to lexical items, we also computed the average local SRSS of the ERFs to the standard stimuli in the two conditions during six different time windows: pre-stimulus baseline (−100 to 0 ms), pre-coda baseline (330–410 ms), the 80-ms window 500–580 ms centred around the MMN main peak, and three additional windows centred at the times at which the standard responses displayed three prominent peaks (see Results). Window widths were adjusted to the width of the half maximum of the respective peak (30, 40 and 60 ms).
The time-averaged SRSS values obtained from each of the critical recording locations, subjects, stimulus types and conditions were subjected to repeated-measures analyses of variance (ANOVAs). ANOVA tests with the factors Attention (Attend vs. Ignore), Lexicality (word vs. pseudoword), Stimulus (coda [p] vs. [t]) and Region-of-Interest (ROI, further split into “Anterior-Posterior” and “Lateral-Central” factors, with two and up to four levels, respectively) and a between-group variable, “Session Order” (Attend-first vs. Ignore-first) were computed on the data extracted from the MMN curves. Additional ANOVAs with the factors Attention, Stimulus ([baj] vs. [paj]) and ROI were calculated on the local SRSS extracted from the responses to the standard stimuli, one for each time window of interest. Significant interactions were investigated further using additional t tests for planned comparisons.
Behavioral Data
ANOVA tests on the attention ratings data (Figure 3
) revealed a significant 2-way interaction of the factors Condition (Attend vs. Ignore) and Modality-Attended (Sound vs. Video) (F(1,15) = 134.2, p < 0.00001). There was also a main effect of Modality (F(1,15) = 10.8, p < 0.01). During the Attend condition, average hit rate was 70.2% (SE = 4.3%). After the Ignore condition, on average subjects answered correctly 80.6% (SE = 3.0%) of the questions about the video; percent correct answers dropped to 47.5% (SE = 7.1%) after the Attend condition, confirming different levels (t(15) = 5.15, p < 0.0001) of attention to the stimulus input, as expected.
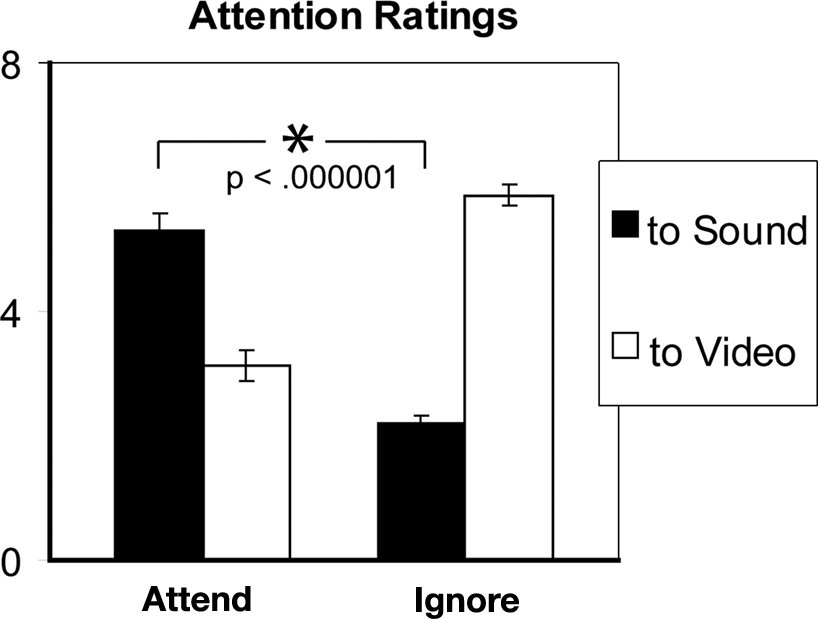
Figure 3. Average attention ratings (1 = “Absent”, 7 = “Complete”) collected from 16 subjects for the two conditions. Error bars indicate standard-error of the mean (SEM). Ratings confirm the relatively stronger attention to sounds in the attend-sounds task (Attend) compared to the ignore-sounds task (Ignore).
MEG Data
Figure 4
plots the local magnetic gradient response as SRSS of the magnetic MMN to pseudowords (blue) and words (red) in the Attend condition for all loci (averaged across 16 subjects)
3
, highlighting the left perisylvian locations exhibiting largest amplitudes that were used in the statistical analysis. Figure 5
plots the local magnetic gradient response as SRSS for standard stimuli and MMN data recorded from one of these loci. During the first 400 ms responses to the two standards differed (see top graph); differences tended to disappear at times greater than 400 ms. Due to the different acoustic-phonetic features of the stimuli, the MMNs to the coda [p] and [t] (see Figure 5
, top right) peaked, at the locus with largest amplitudes, at 137 and 115 ms post coda onset (on average), respectively. When grouped by condition (Figure 5
, bottom graph), the standard curves suggest a main effect of attention, which was investigated in the statistical analysis (see below).
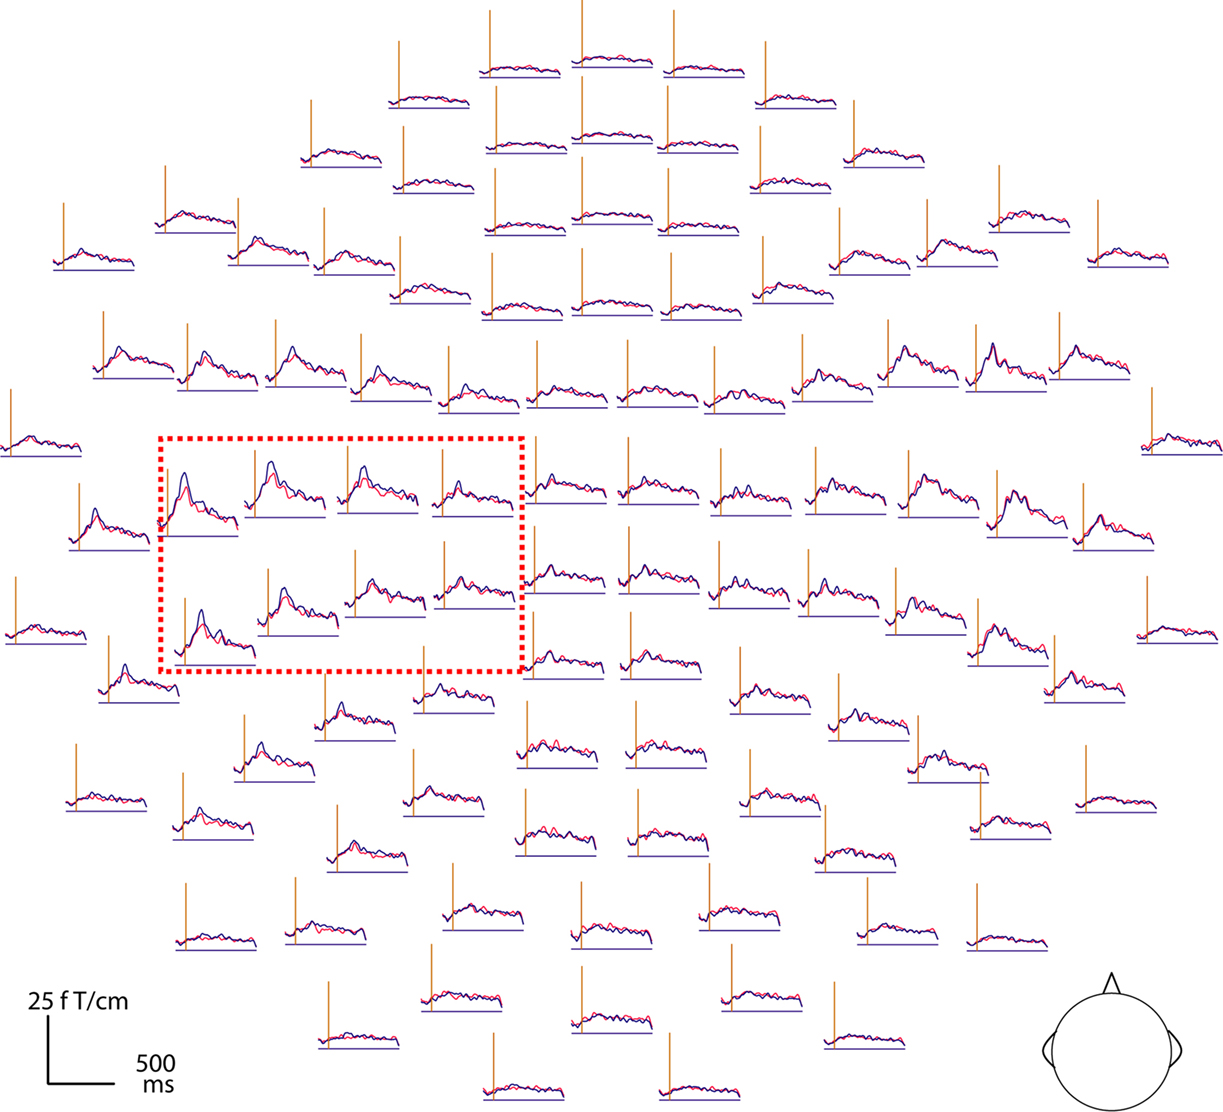
Figure 4. Magnetic brain responses to deviant words (in red) and deviant pseudowords (blue) in the Attend condition after subtraction of the respective standard response. The curves plot the local gradient vector amplitudes of the magnetic MMN (DEV minus STD responses) for 102 recording sites (top view of the MEG helmet: left is left, top is front) as a function of time. The vertical axis indicates the coda onset time (410 ms post stimulus-onset). Note that responses are larger on the left and especially pronounced at perisylvian loci (red box).
A three-way ANOVA with the factors Attention, Stimulus and ROI carried out on the SRSS of the responses to the standard stimuli revealed a main effect of Attention already in the pre-stimulus baseline (−100 to 0 ms), with the responses in the Attend condition larger than in the Ignore condition (Attention main effect; F(1,15) = 5.91, p < 0.03). An analogous effect (F(1,15) = 7.15, p < 0.02) was also present in the pre-coda baseline of the MMN curves (330–410 ms). As these effects emerged in the analysis of local magnetic gradient vector amplitudes after baseline correction had been performed on the data from each channel (SQUID) individually, they must be due to a stronger variability (fluctuation around the zero line) of the magnetic signals in the Attend condition. In order to test for effects of attention over and above the baseline fluctuation, we subtracted the (time-averaged) local SRSS value in the pre-stimulus baseline (−100 to 0) from the (time-averaged) local SRSS of the responses to the standards at time windows 58–88, 93–133, 156–216, 330–410 (pre-coda baseline) and 500–580 (MMN main peak) ms after stimulus onset. Three-way ANOVAs (Attention × Stimulus × ROI) on the corrected standard magnetic field gradients revealed a significant interaction of the factors Attention, Stimulus and ROI (Table 2
, top) in the 156–216 ms interval only (third peak of the standard responses in Figure 5
) with greater attention effects for [baj] than for [paj] (between conditions) at loci exhibiting larger signals. No significant effects of attention emerged in the other intervals considered. A similar correction was done on the MMN data by subtracting the pre-coda baseline from the MMN, which left all critical effects reported below unchanged.
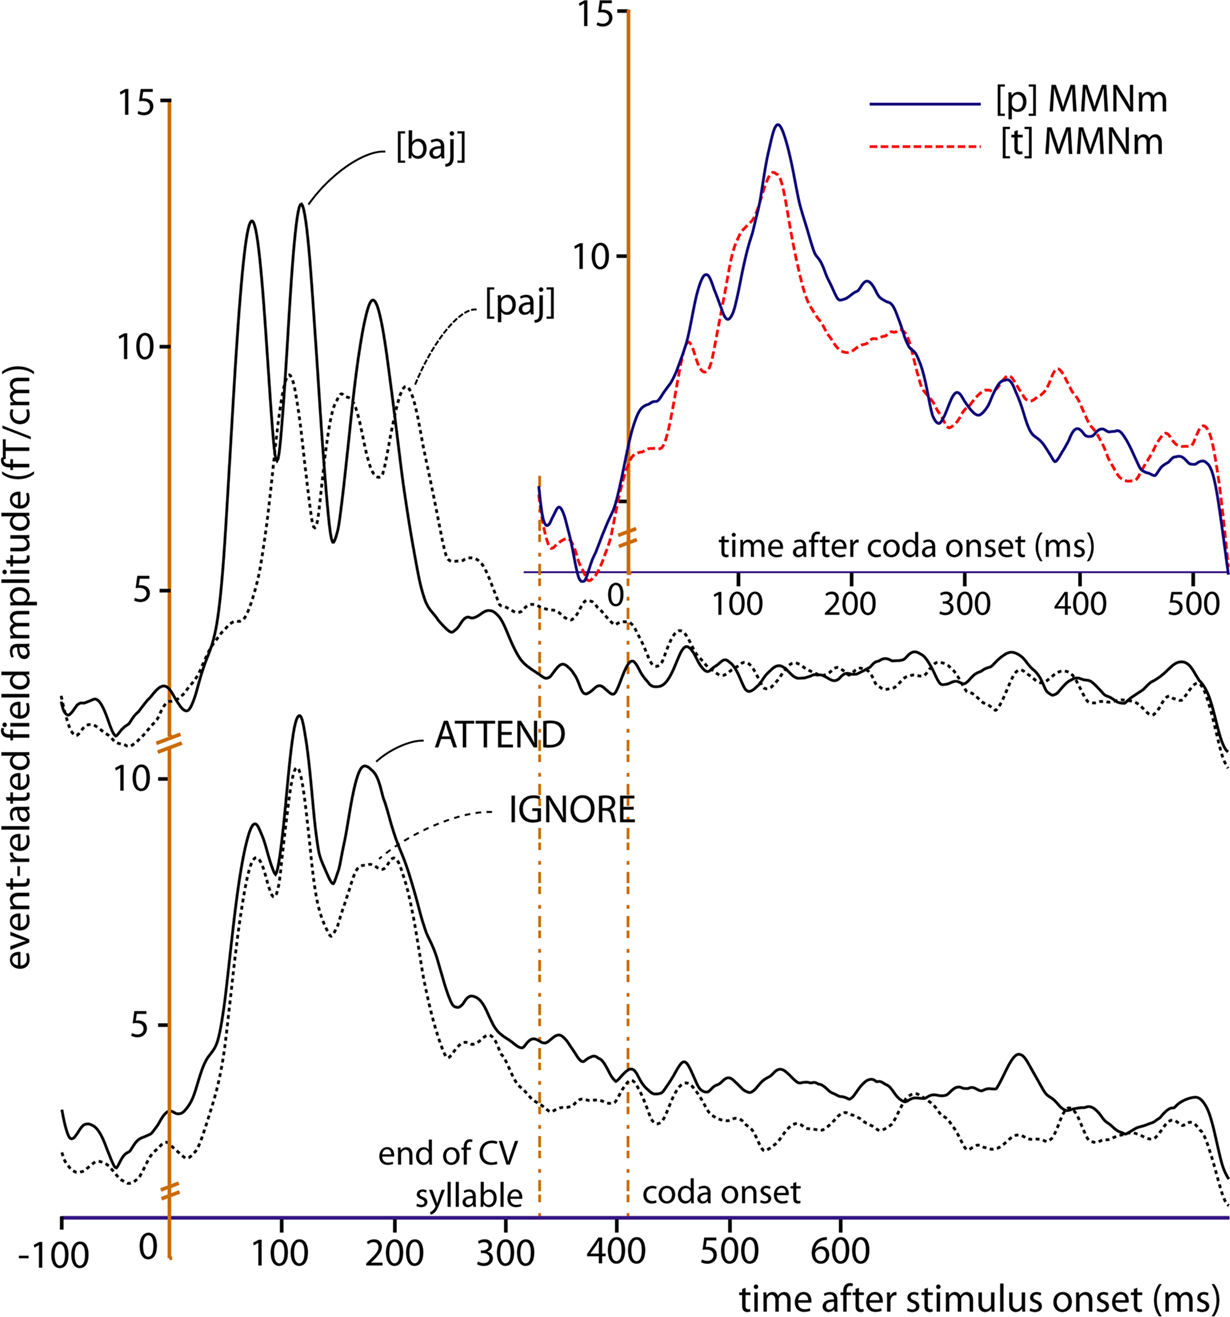
Figure 5. Magnetic brain responses to standard (in black) and deviant stimuli (in blue and red). The local gradient vector amplitudes are plotted. Top-left: responses to standard stimuli ([baj], [paj]) averaged across conditions; note the absence of differences during the MMN main-peak window (120–150 ms after coda-onset). Top-right: MMN responses to the four deviant stimuli ([*bajp], [bajt], [pajp], [*pajt]) grouped by coda stimulus ([p] or [t]). Bottom: responses to standard stimuli ([baj], [paj]) grouped by condition; note the divergence of the two curves, particularly evident at time ∼150–200 ms (third peak).
Statistical analysis of the magnetic MMN revealed a significant interaction between Lexicality and Attention. In particular, a four-way ANOVA (Attention × Lexicality × Stimulus × ROI) was performed on the data extracted from the MMN curves for the two quadruplets of high-amplitude loci (see Figure 4
) in the left hemisphere. The results are reported in Table 2
(lower half), and plotted in Figure 6
.
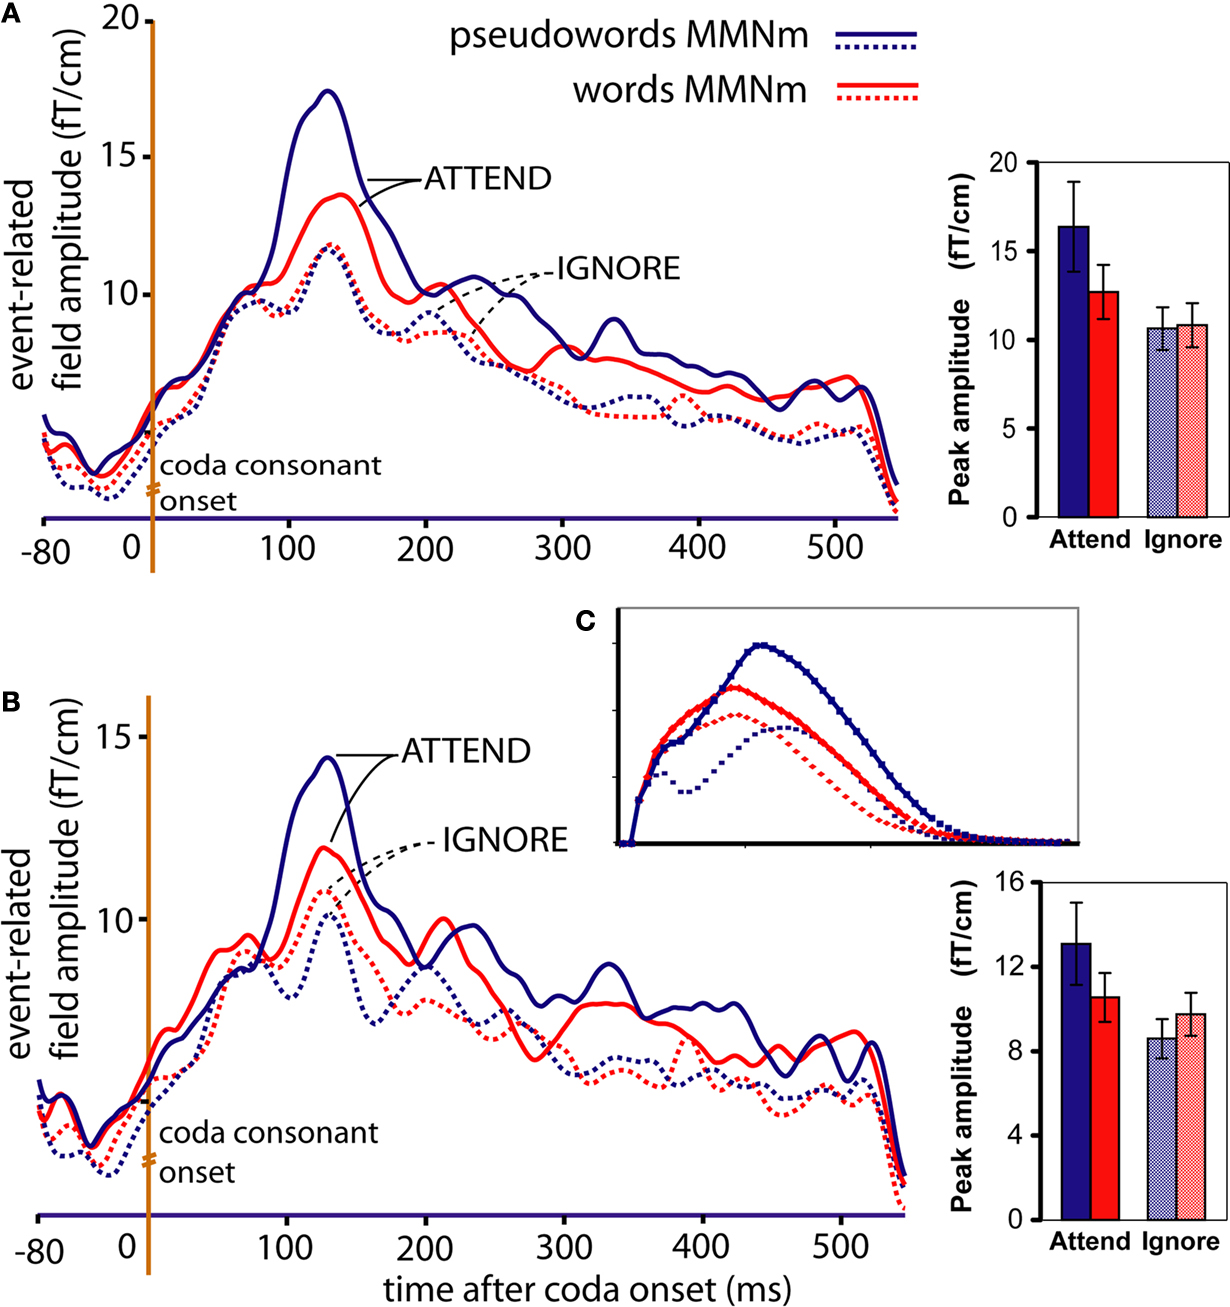
Figure 6. Magnetic brain responses to words ([bajt], [pajp], in red) and pseudowords (*[bajp], *[pajt], in blue) in the two conditions (Attend: solid lines; Ignore: dotted lines). The curves plot local gradient vector amplitudes of the MMN averaged over (A) the eight loci exhibiting largest responses (refer to Figure 4
), and (B) the subset of four superior (dorsal) high-amplitude locations. Bar plots on the right report respective average values (with SEM) during the 60-ms interval centred around the peak. As predicted by the network simulations [see panel (C)], in the Attend condition the peak of the MMN response is larger to pseudowords than to words, while the opposite pattern (words > pseudowords) emerges in the Ignore condition.
Figure 6
A plots the local SRSS of the magnetic MMN at the eight high-amplitude locations, illustrating the Attention-by-Lexicality interaction. Further comparisons (t-tests) confirmed that in the Attend condition, the peak of the magnetic MMN was larger to pseudowords than that to words (t(15) = 2.43, p < 0.02). Interestingly, these dynamics were largely due to a modulation of the pseudoword response (t(15) = 2.39, p < 0.02), whereas the magnetic MMN to words did not differ significantly between Attend and Ignore (t(15) = 1.02, p > 0.1; n.s.). When analysing the superior and inferior quadruplets of the eight critical loci separately, the interaction of Attention and Lexicality was confirmed (superior quadruplet: F(1,15) = 4.58, p < 0.05; inferior quadruplet: F(1,15) = 5.06, p < 0.04) with stronger MMN gradient responses to pseudowords than words in the attend condition and, in the superior quadruplet only, stronger word than pseudoword responses in the Ignore condition (t(15) = 1.91, p < 0.04) (Figure 6
B). The graphs plotted in Figure 6
C show the network simulation results (taken from Figures 1
C,D).
There was also (see Table 2
) an interaction of ROI (anterior-posterior), Stimulus, Attention, and Lexicality, indicating that the pseudoword-word differences in the Attend condition were most pronounced at anterior loci for the coda [t], whereas the differences for the [p] were equally large across anterior and posterior locations. Furthermore, an interaction between Session Order, Condition and ROI (anterior-posterior) suggests the presence of a trend (for Ignore-first subjects only) to exhibit larger responses in anterior loci in the Attend condition, although all post-hoc comparisons were not significant.
Later time intervals revealed a significant Attention-by-Lexicality interaction at 250–300 ms post coda onset (F(1,15) = 4.93, p < 0.05), with larger magnetic gradient to pseudowords than to words in the Attend condition (as for the earlier time window). At times 300–400 ms, a main effect of Attention (F(1,15) = 10.1, p < 0.01) was found.
Source strengths calculated for a Region of Interest centred at the left posterior-superior sylvian fissure (radii: x = 30 mm, y = 30 mm, z = 25 mm) once again confirmed stronger pseudoword sources than those underlying words when attention was directed to speech, and the opposite pattern when ignoring speech (see Figure 7
below).
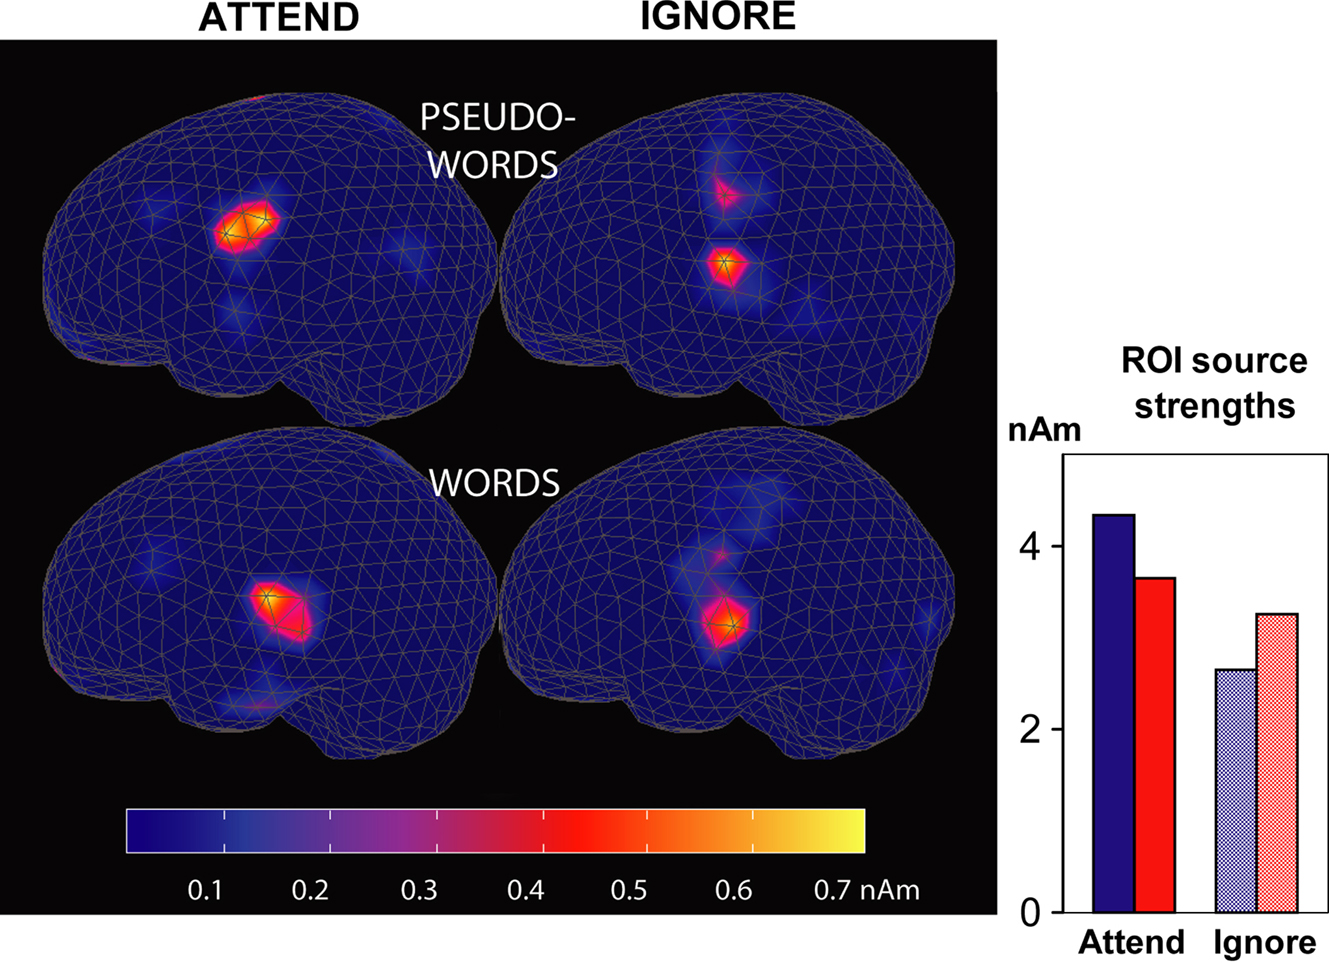
Figure 7. Cortical responses to words and pseudowords in the left hemisphere. Source estimates are based on magnetic MMN responses recorded from 306 channels. Left: source distribution and average intensity during the MMN peak (130–150 ms post coda onset). Right: sum of all source strengths at t = 140 ms within a Region of Interest (not depicted) which included posterior perisylvian cortical areas. Red: words; blue: pseudowords.
Attention changed the neurophysiological response to spoken words and pseudowords in different ways. Whereas neuromagnetic responses were larger to attended pseudowords than to unattended pseudowords, brain processes induced by spoken words only showed minimal changes with attention. This result confirms the predictions of the model (see Figures 1
C,D; see also Shtyrov et al., 2009
). Larger responses to words than to pseudowords in the Ignore condition, found in a selection of the loci exhibiting strongest signal, replicates previously documented dynamics of the MMN (Figure 1
B) in the passive oddball paradigm (Endrass et al., 2004
; Korpilahti et al., 2001
; Kujala et al., 2002
; Näätänen, 2001
; Pettigrew et al., 2004
; Pulvermüller, 2001
; Pulvermüller and Shtyrov, 2006
; Pulvermüller et al., 2004
; Shtyrov and Pulvermüller, 2002
; Shtyrov et al., 2005
). Cortical sources were localised in left-superior temporal cortex, which is also consistent with previous work (Pulvermüller et al., 2001
). The opposite effect in the Attend condition (larger responses to pseudowords than to words), a strong prediction of the model that could not follow from the above MMN studies, resembles the pattern seen in the N400 component (Figure 1
A) and its magnetic correlate (Halgren et al., 2002
; Holcomb and Neville, 1990
; Maess et al., 2006
; Pulvermüller et al., 1996
), which usually emerges when subjects attend to words. Thus, taken together, the above results demonstrate that the opposite patterns of N400 and MMN responses to familiar and unfamiliar stimuli can be explained by a single psychological variable, the locus of attention.
The explanation of the results that we propose is based on our previous model simulations obtained using a neuroanatomically grounded model of the language cortex (MLC) and resultant predictions (Garagnani et al., 2008
): consistent with the biased competition model of attention (Duncan, 2006
), the MLC implements attention to speech by reduced inhibition and therefore greater processing resources for lexical circuits, but attention away from speech by greater inhibition in the language cortex and thus reduced processing resources. The network simulated word processing by the activation of previously learned strongly connected circuits. Such distributed representations develop in the brain due to Hebbian learning when correlated activation of inferior-frontal articulatory circuits and superior-temporal speech perception circuits are active together during speech production (Fry, 1966
; Pulvermüller, 1999
). Pseudoword processing was simulated by providing the network with an input pattern that partially activated several lexical circuits. As the model processes words in learned distributed circuits, the strong connections within these circuits determine activation spreading that is largely independent of the level of attention/inhibition. As Hebb wrote, the cell assembly is “capable of acting briefly as a closed system” (Hebb, 1949
). This functional discreteness of strongly connected distributed circuits documented by our earlier simulations explains the relative stability of brain responses to words under variable attentional conditions. In contrast, when pseudowords activated several circuits partially, the reduced amount of activity was strongly dependent on inhibition level, extinguishing under low attention and more substantially activating several competing circuits when attentional resources were ample. The discreteness of processing in learned neuronal circuits and the absence of discrete processes for unfamiliar items therefore together explain the differential effects of attention on word and pseudoword brain responses observed in the present study (Garagnani et al., 2008
). We hypothesize that stability under variable attention is a general characteristic of brain activation to familiar and thus represented stimuli, and variability is a general feature of brain responses to unfamiliar and thus unrepresented ones.
We note that attention effects on standard stimuli were present only at times greater than 150 ms after stimulus onset. This is in line with reports on visual object processing that attention effects in MEG responses to faces and houses emerged at post stimulus-onset latencies longer than 170 ms (Furey et al., 2006
). However, significant effects of attention on the magnetic correlate of the Mismatch Negativity, MMN, to pseudowords – but not words – were seen already at ∼100–150 ms after the relevant acoustic change (onset of plosion of [p] or [t]) was present in the input. Earlier claims that the MMN is largely independent of attention have been confirmed, in this study, for words (for which a memory circuit has been set up in the brain; Näätänen, 2001
) but not for pseudowords. Our model predicts that a similar difference will emerge for spectrotemporally rich unfamiliar sounds and matched learned sounds for which a memory circuit exists. The explanation lies in the nature of the underlying neuronal memory trace activated, which appears to be both distributed and discrete. Previous research documenting a reduced MMN to unfamiliar language sounds, phonemes, and also non-linguistic sounds compared with familiar ones so far partly support this suggestion (Frangos et al., 2005
; Hauk et al., 2006b
; Näätänen et al., 1997
; Schröger et al., 1992
).
We found larger MMN responses to pseudowords than to words in the Attend condition at around ∼130 ms and in the 250–300 ms interval post coda onset. As the coda started 410 ms after word onset, these effects emerge between ∼540–710 ms post stimulus onset. This time range falls within that reported for the N400 component (Holcomb and Neville, 1990
), which is typically computed from word onset. Thus, these results suggest that the classic N400 response pattern (pseudoword N400 > word N400) can be reproduced in oddball paradigms (with many stimulus repetitions) if subjects attend to the input sounds. In this view, MMN and N400 may be seen as different reflections of analogous underlying cortical processes.
During oddball stimulation, if auditory stimuli are attended, the deviant sounds are known to elicit a further ERP component, the N2b (Näätänen, 1992
). The possibility that the MMN response observed in the Attend condition partly overlaps with an N2b cannot be completely excluded. However, the N2b component: (i) is typically elicited ∼200–300 ms after stimulus change, whereas the peak of the MMN responses that we report is ∼120–140 ms; and (ii) is usually difficult to detect using MEG, possibly due to the depth of its generators (Näätänen, 1992
; Shtyrov and Pulvermüller, 2007a
; Shtyrov et al., 2003
). In view of this, and considering the lateralised and focal cortical source distributions that we obtained, we do not think that the N2b would be a very plausible candidate to explain the present findings.
To direct attention towards speech processing, we here used a phonetic signal detection task, while a video watching task was administered to direct subjects’ attention away from speech. Behavioural results were used to confirm high attention levels and to ascertain specificity of attention to one modality. However, alternative paradigms to direct attention exist. Previous research has shown that depending on the task used to direct attention and kind of stimuli presented, attention effects may be different (Cristescu and Nobre, 2008
; Hohlfeld et al., 2004
; Pulvermüller et al., 2008
; Sabri et al., 2008
). The phonetic task that we used drew attention to fine acoustic detail of single spoken words and the visual task did so to aspects of the visual environment. In future studies, it will be worthwhile to examine the role of different tasks directing attention to different linguistic aspects (phonological, lexical, semantic) of the speech stimuli and observe any related neurophysiological changes.
Finally, the results of the present work provide further evidence in support of the hypothesis that words, similar to other units of cognitive processing (e.g., objects, faces), are represented in the human brain as discrete, distributed action-perception circuits behaving as closed, coherent functional units (Braitenberg, 1978
; Hebb, 1949
; Pulvermüller, 1999
). Typically, localist accounts of knowledge representations in the brain assume the existence of a separate node for each item (word) represented (Dell, 1986
; Levelt et al., 1999
; McClelland and Elman, 1986
; McClelland and Rumelhart, 1981
) and of “ad hoc” connections between them. This allows different item representations to be active at the same time while avoiding cross-talk. Parallel distributed processing (PDP) accounts, on the other hand (Gaskell et al., 1995
; Joanisse and Seidenberg, 1999
; Plaut et al., 1996
; Seidenberg and McClelland, 1989
) do not make such a-priori assumptions, but are unable to maintain different item representations separate if these are simultaneously activated. Overcoming the limitations and combining the advantages of both approaches, our model (Garagnani et al., 2007
, 2008
) predicted – without making a-priori assumptions – the formation (as a result of synaptic plasticity) of lexical representations in the cortex, consisting of strongly interconnected, distributed networks that behave as discrete, independent units. This study provides evidence in support of the existence of such networks in the brain.
The authors declare that the research was conducted in the absence of any commercial or financial relationships that could be construed as a potential conflict of interest.
We would like to thank Clare Dine, John Duncan, Luciano Fadiga, Angela Friederici, Olaf Hauk, Oleg Korzyukov, William Marslen-Wilson, Daniel Mitchell, Martin Monti, Risto Näätänen, Jason Taylor, Russell Thompson, Maarten van Casteren and Daniel Wakeman for the helpful discussions and contributions to different aspects of this work, and the two anonymous Reviewers for their valuable comments and suggestions on how to improve this manuscript. This research was supported by the Medical Research Council (MRC), UK (project U.1055.04.003.00001.01).
The Supplementary Material for this article can be found online at http://www.frontiersin.org/humanneuroscience/paper/10.3389/neuro.09/010.2009
.
- ^ Attentional resources and competition between cortical representations are intrinsically linked by the global cortical inhibition: the less inhibition, the more competing representations can be coactive (i.e., more attentional resources available).
- ^ The Soundblaster ZS soundcard that we used produced, for a 1-kHz pure tone with maximum amplitude, a peak amplitude of 88.25 dB SPL in the left earpiece.
- ^ Four subjects did not fulfil the SNR criterion (see Methods) and were therefore discarded from the analysis.