1
Health Sciences, Curtin University, Bentley, WA, Australia
2
Prince of Wales Medical Research Institute, Randwick, Australia
3
Tokyo Metropolitan Institute for Neuroscience, Tokyo, Japan
Brain mapping has relied on a small number of routine chemical stains for many decades. The advent of immunomarkers has had a major impact on the ability to define homologous nuclei from one species to another. The first atlas to present a panel of immunomarkers was that of Paxinos et al. (1999a
,b
) in the adult rat brain. The markers used were parvalbumin, calbindin, calretinin, SMI32, tyrosine hydroxylase, and NADPH diaphorase (plus nissl and acetylcholinesterase). The ‘signature’ of a nucleus of interest in a new species can be tested against the findings in the rat. Since the pattern of immunomarkers seems to be conserved in mammalian evolution, such extrapolations can be made with reasonable confidence. A marmoset brain stained with a comprehensive set of immunomarkers has recently been published on the internet (Tokuno et al., 2009
) and we are in the process of defining nuclear homologies in this brain by comparison with the same markers in the rat. In this article, we present an example (mapping the amygdala in the marmoset) which demonstrates the application of this immunomarker panel in defining homologies. The technique is particularly valuable in situations where little data on hodology or electrophysiology are available.
The creation of maps of the mammalian brain has been an important area of endeavour for over a century. In the latter half of the twentieth century, a number of landmark atlases were created (Olszewski, 1952
; Olszewski and Baxter, 1954
; Taber, 1962
; Emmers and Akert, 1963
; König and Klippel, 1963
; Berman, 1968
). These atlases provided reliable stereotaxic coordinates for the first time and ushered in a new era of neuroanatomical and neurophysiological studies. These atlases were based largely on the interpretation of Nissl stained sections, although in some cases myelin stained sections were used as well. However, even the best Nissl stained sections are hard to interpret without supplementary data, and it is surprising that none of these early atlases made routine use of histochemical stains. The acetlycholinesterase stain was developed in 1949 (Koelle and Friedenwald, 1949
), but the first major use of this stain in an atlas was in the 1982 rat brain atlas of Paxinos and Watson. The combination of Nissl and acetlycholinesterase enabled these authors to produce an atlas of the rat brain that was more accurate than previous works. Paxinos recognized the value of a range of different markers, and in 1999 published a two volume work showing serial sections stained in rotation with a number of immunomarkers (Paxinos et al., 1999a
,b
). While these two volumes have never been cited at a high rate, many researchers have found the rat marker atlas to be a vital tool in mammalian brain mapping. The markers used were parvalbumin, calbindin, calretinin, Nissl, SMI32, tyrosine hydroxylase (TH), and NADPH diaphorase (acetylcholinesterase sections were also prepared but were not pictured in these atlases).
This chemical marker atlas, now in its second edition (Paxinos et al., 2009b
), has opened up a new field of regional identification on the basis of the staining patterns of multiple markers. The ‘signature’ of a nucleus of interest in a new species can be tested against the findings in the rat. Since the pattern of chemical markers seems to be conserved in mammalian evolution, such extrapolations can be made with reasonable confidence. This technique has been used in the mapping of the mouse brain (Watson and Paxinos, 2010
), the rhesus monkey brain (Paxinos et al., 2009a
), and to a more limited extent in the human brain stem (Paxinos and Huang, 1995
). This method has even been successfully applied to the mapping of the chick brain (Puelles et al., 2007
).
A set of serial sections of the marmoset brain stained with comprehensive set of immunomarkers has recently been published on the internet (Tokuno et al., 2009
). We are in the process of defining nuclear homologies in this brain by comparison with the same markers in the rat. In this article, we present a series of examples which demonstrate the application of this immunomarker panel in defining homologies. The technique is particularly valuable in situations where few data on hodology or electrophysiology are available.
Subjects
Marmoset
The sections are from the brain of a male common marmoset (Callithrix jacchus) weighing 510 g. The age of the animal was 3 years 2 months. The marmoset came from a breeding colony at Tokyo Metropolitan Institute for Neuroscience. Under general anesthesia with ketamine hydrochloride (10-mg/kg body weight, intramuscular) and sodium pentobarbital (40-mg/kg body weight, intraperitoneal), the marmosets were perfused through the heart with 200 ml of physiological saline and subsequently 500 ml of 0.1 M phosphate buffer (PB, pH 7.3) containing 4.0% paraformaldehyde. The brains were then removed, saturated with PB containing 20% glycerol, and serial coronal sections were cut at 50-μm thickness on a freezing microtome. The sections were collected individually and placed in rotation in a series of 10 jars filled with cold PB for subsequent staining. The experimental protocol was approved by the Animal Experiment Committee at the Tokyo Metropolitan Institute for Neuroscience.
Rat
The sections are from the brain of a male Wistar rat weighing 274 g. The rat was deeply anesthetized (120 mg/kg of sodium pentobarbital, intraperitoneally) and perfused through the heart with 250 ml of physiological saline and subsequently 600 ml of 0.1 M phosphate buffer (PB, pH 7.4) containing 4.0% paraformaldehyde. The brain was removed at immersed in 3% sucrose in PB for 48 h in a refrigerator. Serial coronal sections were cut at 31-μm thickness in a cryostat microtome. The sections were collected individually and placed in rotation in a series of eight jars filled with cold PB for subsequent staining. The experimental protocol was approved by the animal ethics committee of University of New South Wales.
Histology
Details of the Nissl, acetylcholinesterase, and immuno staining for the marmoset are presented in the paper by Tokuno et al. (2009).
A comprehensive discussion of the histological methods used for the rat brain is to be found in the atlas of Paxinos et al. (2009b)
.
Nomenclature and abbreviations
The nomenclature and abbreviations used are those that have been employed in successive editions of the Paxinos/Watson rat brain atlas (Paxinos and Watson, 1982
, 1986
, 1997
, 1998
, 2005
, 2007
) (see Table 1
). These same abbreviations have been successfully used in atlases of a wide range of amniote vertebrates, including the mouse (Franklin and Paxinos, 2007
), developing rat (Ashwell and Paxinos, 2008
), rhesus monkey (Paxinos et al., 2009a
), human (Paxinos and Huang, 1995
; Mai et al., 2008
), and chick (Puelles et al., 2007
). The use of consistent abbreviations for homologous structures in different species means that readers are not burdened with the task of learning different abbreviations for the same nucleus or region.
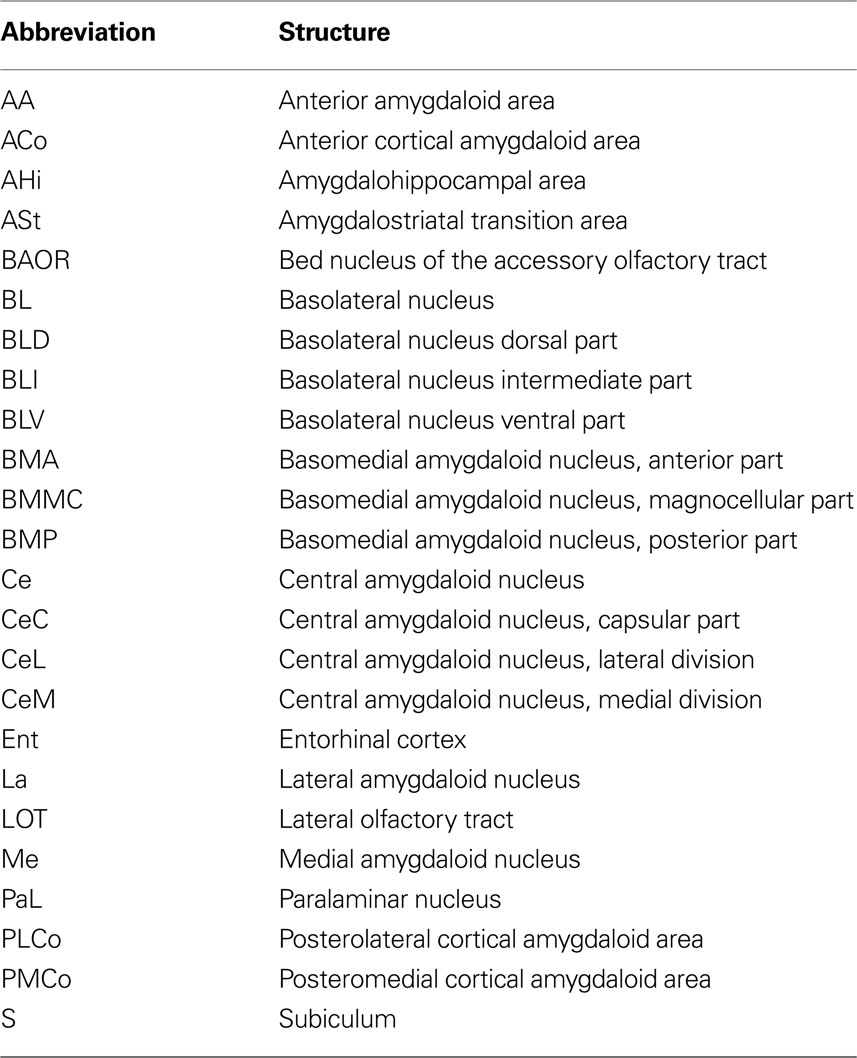
Table 1. List of abbreviations used to structures identifi ed in the figures and text.
Mapping the Marmoset Amygdala – An Example of the Use of a Panel of Markers
We have used the staining patterns revealed by markers in the rat amygdala (Paxinos et al., 2009b
) to define homologous nuclei in the amygdala of the marmoset (Callithrix jacchus). We have examined serial marmoset brain sections stained with the following markers in rotation – SMI32 (SMI), tyrosine hydroxylase (TH), NADPH diaphorase (NADPH), parvalbumin (Pv), calbindin (Cb), calretinin (Cr), and acetylcholinesterase (AChE), in addition to Nissl staining. We have compared the pattern of staining in the marmoset with that in the rat as presented in the chemoarchitectonic atlas of Paxinos et al. (2009b)
. As in our previous studies (Puelles et al., 2007
; Franklin and Paxinos, 2007
; Paxinos et al., 2009a)
, we have worked on the assumption that the pattern of protein markers is conserved in mammalian evolution, so that the rat marker series can be used as a kind of Rosetta stone for other species.
The amygdala in the marmoset is at first sight very different to that of the rat (Figure 1
). As in other primates, the temporal lobe is rotated so that ventrally placed structures assume a medial position compared with the rat. However, the markers quickly reveal the probable homologues of the main amygdaloid nuclei. The three major parts of basolateral nucleus (BL) in the marmoset (basolateral nucleus dorsal part (BLD), basolateral nucleus intermediate part (BLI), and basolateral nucleus ventral part (BLV) are clearly outlined in AChE and PV staining (Figure 1
).
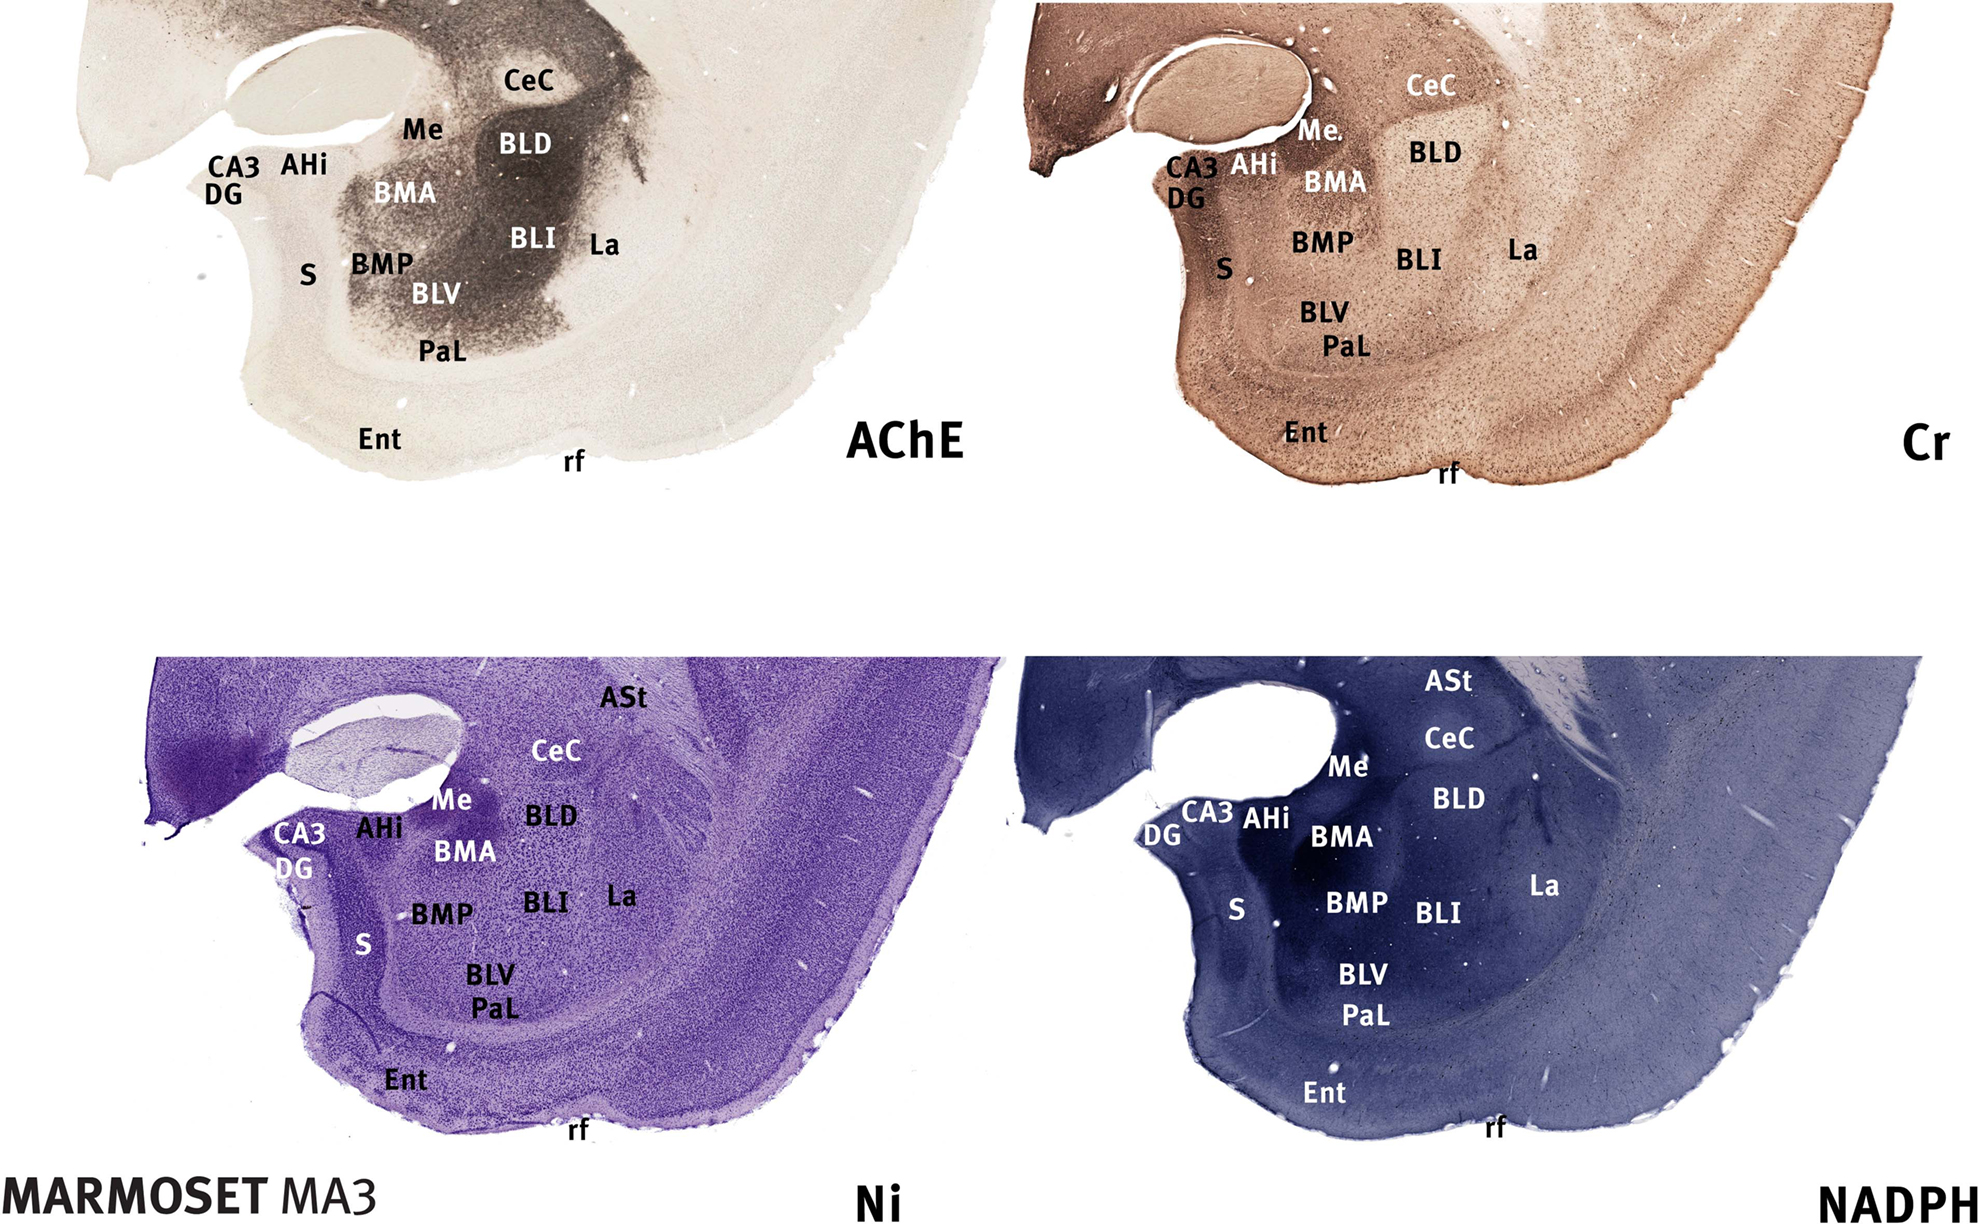
Figure 1. Marmoset amygdala. Four images of sections taken from the rostrocaudal center of the marmoset amygdala (between 8.0 and 8.5 mm rostral to the interaural plane), each stained with a different marker (Tokuno et al., 2009
; see also http://marmoset-brain.org:2008
). The dorsal and intermediate part of the basolateral nucleus (BLD, BLI) are clearly defined by intense AChE staining. The basomedial nucleus (BMA and BMP) and the amydalohippocampal area (AHi) are intensely stained with NADPH. The medial nucleus (Me) and the dorsal part of the basomedial nucleus (BMA) are notably stained with Cr. Scale – the field of view in each case is 10-mm wide.
As in the rat, the most dorsal part of BL in the marmoset is the most densely stained in AChE. In the marmoset and in the rhesus monkey (Stephan et al., 1980
; Paxinos et al., 2009a
) this area has been named the dorsal part of BL (BLD), but it is almost certainly homologous with the area named the anterior part of BL (BLA) in the rat. The intermediate part of BL in the marmoset (BLI) is less densely stained than the dorsal part, and because of this can be considered homologous with the posterior part of BL (BLP) in the rat (Figures 1 and 2
). The ventral part of BL (BLV) in the marmoset is in turn less densely stained than BLI, and can be considered to the homologue of a nucleus with the same name in the rat (Figures 1 and 2
). Identification of the main parts of BL leads to the presumptive identification of neighbouring nuclei, the basomedial and medial nuclei, on account of their relationship to BL (Figures 1 and 2
).
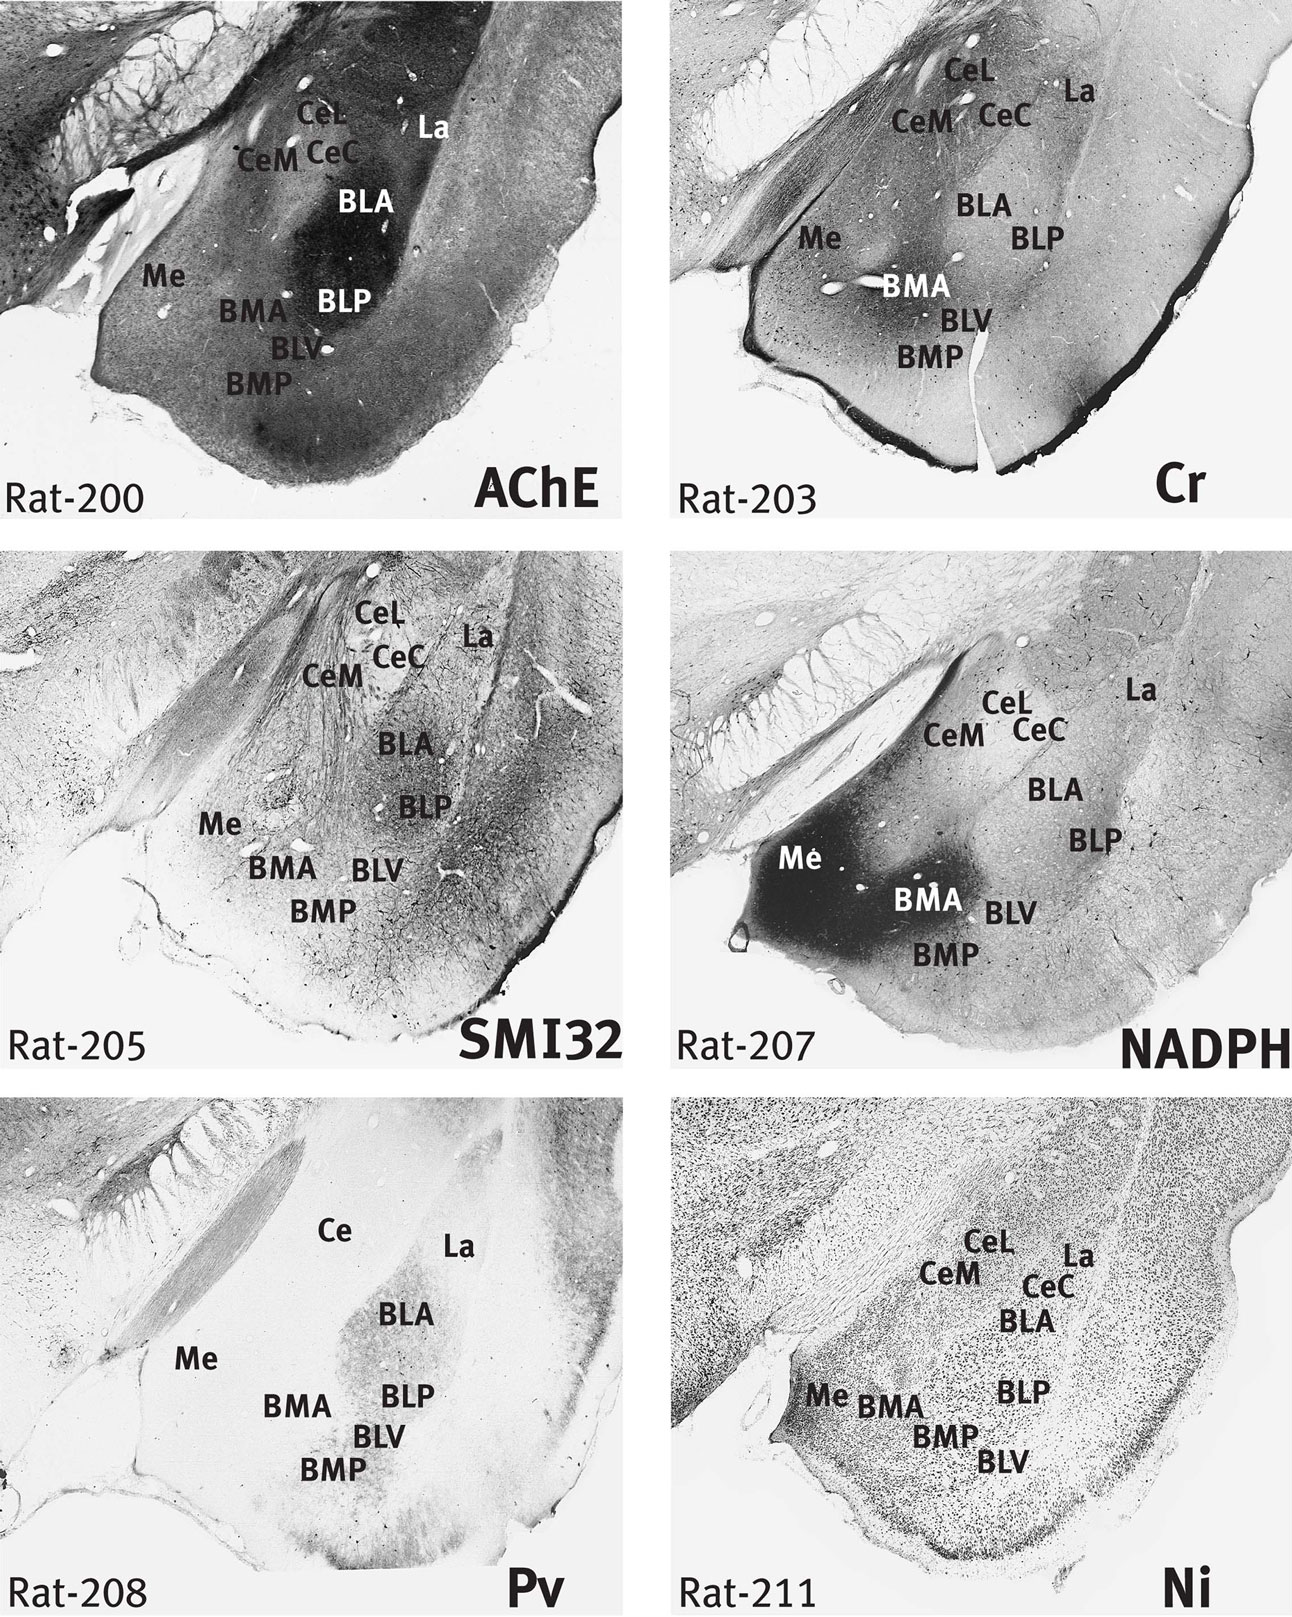
Figure 2. Rat amygdala. Six images of the rat brain taken from the stained sections used in the preparation of the atlas of Paxinos et al. (2009b)
, but note that the AChE section is not displayed in the atlas. The sections are numbered from rostral to caudal, and the section thickness is 0.04 mm. The section number is indicated at the lower left. The stain in each case is indicated at the lower right of the section. Scale – the field of view in each case is 4 mm wide. The BLA and BLP are strongly stained in AChE, and the CeC is very lightly stained. Cr staining highlights the BMA and the outer margin of the cortical amygdaloid areas. In NADPH, the Me and BMA are strongly stained, but the CeC is unstained. SMI staining is most marked in the BLA, BLP, and CeM. Pv staining is marked in all parts of BL.
Confirmation of the identity of the basomedial (BM) and medial nuclei (Me) is provided by NADPH staining. The basomedial and medial amygdaloid nuclei in the marmoset are densely stained with this marker, whereas most other neighbouring nuclei are lightly stained (Figure 1
). The part of BM that is most densely stained with NADPH in the rhesus monkey has been named the magnocellular part (BMMC) (Paxinos et al., 2009a
), but the equivalent area in the rat has been called the anterior part (BMA). We have concluded that BMMC is the simian homologue of BMA. NADPH staining is also useful in delineating the amygdalohippocampal area, which is strongly stained in both monkeys and rodents (Figures 1 and 2
).
The lateral nucleus of the amydala (La) is not heavily stained by any of the markers used in either the rat or the marmoset, but the staining patterns are similar when the two species are compared (Figures 1 and 2
). In both rat and marmoset, the neuropil is moderately stained with Cb, and there is patchy staining with Pv and NADPH (Figures 1 and 2
). In both species, the neuropil of La is only very lightly stained in AChE and SMI. Cr staining highlights the BLP and the outer margin of the cortical amygdaloid areas.
The identification of the parts of the central amygdaloid nucleus (Ce) in the marmoset is in part hindered by the nomenclature for the subnuclei that are used in primate atlases (Stephan et al., 1980
; Paxinos et al., 2009a
). In primates only two subnuclei are routinely identified, the medial (CeM) and the lateral (CeL), whereas in the rat three nuclei have been identified – medial, central, and lateral (Figure 2
). The marker stains offer a clue to the solution of this problem. In the rat, the central nucleus is characterised by negativity in AChE and NADPH staining (Figure 2
). There is a similarly negative area in the marmoset and in the rhesus monkey, but it has been named the lateral subnucleus in the rhesus monkey (Paxinos et al., 2009a
). The most likely explanation is that the homologue of the central nucleus has, at least in part, been misidentified as the lateral nucleus in primates. Examination of AChE sections in the rhesus monkey atlas of Paxinos et al. (2009a)
, reveals that the rostral part of the area named CeL is completely negative (and therefore resembles the CeC of the rat), whereas the caudal area named CeL consists of a moderately stained central patch surrounded by a thin unstained rim. It is possible that the stained area in the rhesus is in fact the homologue of the rat CeL, whereas the unstained area represents the rat CeC. In the marmoset, the unstained area in AChE sections appears to be present in both rostral and caudal levels, but there is a small stained area lateral to it, which could represent the rat CeL.
Overall, there is convincing evidence that the unstained area in AChE and NADPH-d preparations in the marmoset is the homologue of the rat CeC. The stained area medial to this unstained region in the marmoset can reasonably be named the homologue of the rat CeM.
The area named the ventral cortical nucleus of the amygdala in the marmoset and rhesus monkey seems likely, on the basis of its relationships, to represent the areas named the posteromedial (PMCo) and posterolateral (PLCo) cortical nuclei of the rat (not shown here). In the rat the PMCo is clearly marked by a thin band of AChE staining in layer 1 (Paxinos et al., 2009b
). There is a suggestion of such a band in the marmoset, but its appearance is not as striking as in the rat.
The major amygdaloid nuclei in the marmoset can be confidently identified on the basis of the panel of markers, but it is important to acknowledge that this does not solve all the questions of identity in the amygdaloid region. A number of these issues will be discussed in this section.
The Nucleus of the Lateral Olfactory Tract
The first of these issues is the question of the nucleus of the lateral olfactory tract (LOT). LOT is a prominent nucleus in rodents, but was not identified in the rhesus monkey atlas of Paxinos et al. (2009a)
. In rodents, LOT is a three-layered cortical area separating the anterior amygdaloid area (AA) and the medial nucleus (Me) medially from the anterior cortical amygdala (ACo) laterally. Layer 2 of LOT stains intensely with NADPH and AChE in the rat, making it very easy to identify (Paxinos et al., 2009b
). Examination of the marmoset sections reveals an area of AChE and NADPH positivity dorsal to ACo that may represent LOT, but the overall appearance is not very similar to the prominent LOT found in the rat. It is therefore not surprising that Stephan et al. (1980) and Paxinos et al. (2009a)
declined to identify a homologue of LOT in the marmoset and rhesus monkey respectively.
The caudal pole of LOT in the rat is succeeded by the bed nucleus of the lateral olfactory tract (BAOT). Given the apparent absence of an accessory olfactory bulb in simian primates, and the inconclusive status of LOT, it is not surprising that we have been unable to identify this nucleus in the marmoset. On the contrary, Paxinos et al. (2009a)
have marked out a large area, which they consider to represent the BAOT. This question clearly needs more data before it can be resolved.
The Paralaminar Amygdaloid Nucleus
In primates, a prominent nucleus named the paralaminar nucleus (PaL) consists of a sheet of cells applied to the ventral surface of the amygdala, and separating the basolateral nucleus from the white matter of the underlying entorhinal cortex. There is no obvious candidate for a homologue of this nucleus in the rat. The nucleus may be an extension of the lateral nucleus of the amygdala.
Differences in Staining Intensity Between Species
While this brief exercise has emphasised the consistency of staining when rat and marmoset are compared, the relative intensity of staining is not always the same in the two species. This is not surprising because similar differences in staining intensity using this panel of markers exist between the rat and the mouse.
Conclusion
These findings, combined with supplementary data from the remaining markers, make it possible to identify all of the major amygdaloid nuclei in the marmoset. The nuclear delineations using this technique will provide valuable guidelines for future hodological and electrophysiological studies. The use of a panel of markers is likely to be of most use in forebrain areas that are made up of a large number of cell groups, each with different characteristics, such as the thalamus, hypothalamus, bed nucleus of stria terminalis. However, we have also found this method to be of great value in identifying homologues among midbrain and hindbrain nuclei.
The authors declare that the research was conducted in the absence of any commercial or financial relationships that could be construed as a potential conflict of interest.
We thank Max Hobbs for assistance with the formatting of images. This research was supported by an Australia Fellowship (G Paxinos) and NIH grant 1R01AG029412 (D Davis).