1
The Mind Research Network, Albuquerque, NM, USA
2
Department of Electrical and Computer Engineering, University of New Mexico, Albuquerque, NM, USA
3
Olin Neuropsychiatry Research Center, Hartford, CT, USA
4
Department of Psychiatry, Yale University School of Medicine, New Haven, CT, USA
5
Department of Biological and Medical Psychology, University of Bergen, Bergen, Norway
Functional magnetic resonance imaging (fMRI) has become a major technique for studying cognitive function and its disruption in mental illness, including schizophrenia. The major proportion of imaging studies focused primarily upon identifying regions which hemodynamic response amplitudes covary with particular stimuli and differentiate between patient and control groups. In addition to such amplitude based comparisons, one can estimate temporal correlations and compute maps of functional connectivity between regions which include the variance associated with event-related responses as well as intrinsic fluctuations of hemodynamic activity. Functional connectivity maps can be computed by correlating all voxels with a seed region when a spatial prior is available. An alternative are multivariate decompositions such as independent component analysis (ICA) which extract multiple components, each of which is a spatially distinct map of voxels with a common time course. Recent work has shown that these networks are pervasive in relaxed resting and during task performance and hence provide robust measures of intact and disturbed brain activity. This in turn bears the prospect of yielding biomarkers for schizophrenia, which can be described both in terms of disrupted local processing as well as altered global connectivity between large-scale networks. In this review we will summarize functional connectivity measures with a focus upon work with ICA and discuss the meaning of intrinsic fluctuations. In addition, examples of how brain networks have been used for classification of disease will be shown. We present work with functional network connectivity, an approach that enables the evaluation of the interplay between multiple networks and how they are affected in disease. We conclude by discussing new variants of ICA for extracting maximally group discriminative networks from data. In summary, it is clear that identification of brain networks and their inter-relationships with fMRI has great potential to improve our understanding of schizophrenia.
Functional magnetic resonance imaging (fMRI) has been used for almost 20 years, primarily to extract signals from brain regions that show blood oxygen level dependent (BOLD) changes in response to a cognitive task. More recently there has been increased interest in temporally coherent, but not necessarily directly task-correlated activity, derived from fMRI data. Early studies were performed using correlation of a seed region in sensorimotor cortex in rapidly sampled echo planar imaging (EPI) fMRI data and revealed a significant degree of low-frequency correlations with homologous contralateral regions (Biswal et al., 1995
). These correlations, also present for visual and auditory cortices, appear to be related to both hemodynamic and neuronal activity (Biswal et al., 1997
) mostly at lower frequencies (Cordes et al., 2001
). Subsequently it was shown that whole brain data temporally sampled at a much lower rate also showed similar temporally coherent regions (Lowe et al., 1998
).
Beyond correlation, multivariate methods based upon independent component analysis (ICA) have also been applied to measure functional connectivity, and have the advantage of not requiring explicit spatial priors or temporal filtering (McKeown et al., 1998
). ICA was developed to solve problems similar to the “cocktail party” scenario in which individual voices must be resolved from microphone recordings of many people speaking at once (Bell and Sejnowski, 1995
). The algorithm, as applied to fMRI, assumes a set of sparse, spatially independent brain networks, each with associated time courses. The model identifies latent sources whose elements (voxels) have the same time course and thus each component can be considered a temporally coherent network (TCN). We use the general term TCN to avoid a notion of state-dependence that pertains to resting state networks (RSN) and their particular instances such as the default mode network (DMN), as well as task-related networks computed from ICA (Calhoun et al., 2008a
) and also embedded within maps of task-correlated activity (Sui et al., 2009b
). Default mode is name given to one particular network which is found to show a signal decrease when a task is performed. This network is thus present to differing degrees at rest and during a task. A functionally connected network, by definition, has voxels which exhibit temporally coherent signal. These networks appear to be largely robust and consistent, although they are also clearly modulated both spatially and temporally in the presence of a task (Calhoun et al., 2008a
; Fransson, 2006
; Sonuga-Barke and Castellanos, 2007
).
Since the original observations, multiple studies have examined manipulations of tasks versus a resting baseline or evaluated changes in the correlations in clinical groups. There is some evidence that spatial maps reflecting TCNs may be more robust than those estimated during a standard approach based upon the general linear model (Calhoun et al., 2008b
; Shehzad et al., 2009
). ICA has been used to identify several TCNs present in healthy subjects either at rest (Beckmann et al., 2005
; Damoiseaux and Greicius, 2009
; Kiviniemi et al., 2003
; Van de Ven et al., 2004
) or during the performance of a task (Calhoun et al., 2001b
, 2002
; McKeown et al., 1998
). There has also been interest in using TCNs as biological disease markers, e.g., TCNs have been used to distinguish mild cognitive impairment (Sorg et al., 2007
) and Alzheimer’s disease (Greicius et al., 2004
) from healthy aging, schizophrenia from bipolar disorder (Calhoun et al., 2008b
), or schizophrenia patients from unaffected first degree relatives and controls (Whitfield-Gabrieli et al., 2009
).
A particular TCN that has received great interest is the DMN, that is believed to participate in an organized, baseline “idling” state of brain function that diminishes both during specific goal-directed behaviors (Raichle et al., 2001
) and in inverse proportion to task difficulty (McKiernan et al., 2003
). It is hypothesized that the default mode is involved in attending to internal versus external stimuli and is associated with the stream of consciousness, comprising a free flow of thought while the brain is not engaged in other tasks (Gusnard et al., 2001
), however there are alternative explanations (Hampson et al., 2006
). We reported recently an approach utilizing both the temporal lobe and default mode TCNs to differentiate schizophrenia, bipolar disorder, and healthy controls (Calhoun et al., 2008b
). Other than these two TCNs, multiple others have been consistently identified (Beckmann et al., 2005
; Kiviniemi et al., 2009
) but have not been studied in detail for their relevance in schizophrenia so far. For clinical studies, the extraction of TCNs during task performance has been suggested as a way to constrain a participant’s behavior beyond just “resting” while also stimulating the brain with a task that both patients and controls can perform accurately and which elicits robust brain function differences between the two groups (Calhoun et al., 2008b
).
Collection of data during rest in subjects with neuropsychiatric disorders is a useful approach in several regards. First, ill participants are often unable or unwilling to perform tasks consistently in the scanner or to fully understand complex instructions – At rest, there are no such task demands. Second, abnormal task performance often occurs in schizophrenia, due to the cognitive disability associated with the disorder. This is often inevitably confounded with concomitant abnormal brain activation in a “chicken and egg” manner. This problem can be circumvented during resting state, thus potentially offering a clearer view of the underlying endophenotype (see accompanying article by Pearlson et al., in this issue). Finally, the occurrence of symptoms in the scanner, for example auditory hallucinations in schizophrenia, is usually thought of as undesirable “noise” during performance of a cognitive task but at rest may actually be contributing useful diagnostic information.
Recall that the BOLD signal is a surrogate for neuronal activity. It is an indirect measure of neuronal activity after neurovascular transformation, and as such is not solely an index of localized electrophysiological processing in the brain volume but also mixed with global effects that affect blood oxygenation and flow, including variability of heart rate and respiration (Logothetis and Wandell, 2004
; Raichle and Mintun, 2006
). These physiological nuisance signals can yield oscillations in the low-frequency range (Wise et al., 2004
), either due to aliased measurements and/or due to harmonics of their center frequencies in the range between 0.1 and 1 Hz, respectively. Since the initial observation of functional connectivity between regional fMRI time-series (Biswal et al., 1995
) researchers have been aware of these confounds (Cordes et al., 2000
). One way to estimate these effects is to acquire fMRI time-series at high sampling rates (∼200 ms per volume) which avoids aliasing but which typically does not permit whole brain coverage. Where whole brain coverage is desired, heart rate and respiration can be measured inside the MR scanner and be used as nuisance covariates (Glover et al., 2000
). Under the assumption that physiological nuisance affects the fMRI signal across the entire volume, global mean scaling has been a widely used processing step in functional connectivity analysis for denoising (Zarahn et al., 1997
). Although this procedure effectively removes nuisance effects, one should be aware that it also alters functional connectivity patterns, and can yield artificially increased anti-correlations when seed-based correlation methods are used for analysis (Murphy et al., 2009
). However, the observed anti-correlated networks are most likely not solely a consequence of preprocessing using global signal correction, since the global signal is not preferentially localized to these networks and the spatial distribution of negative correlations is not mandated by global scaling (Fox et al., 2009
).
Note also that blind decompositions with ICA are less susceptible to this type of ambiguity (Birn et al., 2008
; Fox et al., 2009
) and show largely the same networks and anti-correlations between them (Damoiseaux et al., 2006
; Kiviniemi et al., 2009
). Additionally, several lines of evidence illustrate the neuronal nature of large-scale networks observable in the resting state and during task fMRI data. Although direct observations remain scarce and not necessarily yield consistent and stationary observations in electrophysiology and hemodynamics (Popa et al., 2009
; Sirotin and Das, 2009
), low-frequency neuronal activity patterns can account for slow fMRI fluctuations (Leopold et al., 2003
; Shmuel and Leopold, 2008
), and a network model of weakly coupled 40 Hz oscillators also shows low-frequency activity (Deco et al., 2009
). For the DMN in particular, concurrent EEG-fMRI studies in humans show correlations between DMN and resting and event-related EEG features (Eichele et al., 2005
; Laufs et al., 2003
; Mantini et al., 2007
; Scheeringa et al., 2008
). There is also evidence that these resting networks may be coordinated by subcortical mechanisms (Uddin et al., 2008
). In addition, structural and functional connectivity of the DMN appear tightly coupled (Hagmann et al., 2008
; Skudlarski et al., 2008
). These findings corroborate the multimodal description of the DMN in non-human primates (Vincent et al., 2007
). One should also be aware of related psychophysiologic observations: heart rate and respiration are directly affected by cognitive and affective states, which in turn are mediated by large-scale networks (Cacioppo et al., 2000
; Critchley, 2005
), such that excessive control for putative confounds might yield reduced sensitivity to detect plausible biological effects.
Schizophrenia is a chronic, disabling mental disorder diagnosed on the basis of a constellation of psychiatric symptoms and longitudinal course. The disease impairs multiple cognitive domains including memory, attention and executive function (Heinrichs and Zakzanis, 1998
). Although the causes and mechanisms of schizophrenia are still unclear, a hypothesis of neural network “disconnection” has been proposed (Friston and Frith, 1995
). This hypothesis proposes that schizophrenia arises from dysfunctional integration of a distributed network of brain regions or a misconnection syndrome of neural circuitry leading to an impairment in the smooth coordination of mental processes, sometimes described as “cognitive dysmetria” (Andreasen et al., 1999
).
Many researchers have examined the possibility of “disconnection” in psychiatric groups by analyzing brain function with functional connectivity methods (Bokde et al., 2006
; Friston, 1995
; Friston and Frith, 1995
; Frith et al., 1995
; Herbster et al., 1996
; Josin and Liddle, 2001
; Liang et al., 2006
; Liddle et al., 1992
; Mikula and Niebur, 2006
). For example, in a sample of patients with schizophrenia, Liang et al. (2006)
, found disrupted functional integration of widespread brain areas, including a decreased connectivity among insula, temporal lobe, prefrontal cortex and basal ganglia and an increased connectivity between the cerebellum and other brain areas, during resting-state by analyzing correlations between brain regions. Similarly, Meyer-Lindenberg et al. (2001)
, reported pronounced disruptions of distributed cooperative activity in frontotemporal interactions in schizophrenia in selected regions of interest in positron emission tomography (PET) brain scans on working memory task. Other task-related studies reported a lack of interaction between right anterior cingulate and other brain regions (Boksman et al., 2005
), disrupted integration between medial superior frontal gyrus and both the anterior cingulate and the cerebellum (Honey et al., 2005
), as well as reduced functional connectivity in frontotemporal regions of subjects with schizophrenia (Lawrie et al., 2002
). Disruptions in networks identified with ICA in large multisite studies have been shown for multiple tasks such as auditory oddball (Kim et al., 2009
) and working memory tasks (Kim et al., In Press
).
Because of their reliability, TCNs also appear to be ideally suited for use in diagnostic classification or prediction using machine learning techniques. Two TCNs have been of particular interest in schizophrenia (Bluhm et al., 2007
; Calhoun et al., 2004
; Garrity et al., 2007
); one of which includes bilateral temporal lobe regions, which have previously been used to discriminate healthy controls from schizophrenia patients (Calhoun et al., 2004
). A second TCN, one of the most studied, is the DMN (McKiernan et al., 2003
; Raichle et al., 2001
) discussed earlier.
Classification has been performed using fMRI data collected during an auditory oddball task for two patient groups as well as healthy controls. Component maps estimated using a group ICA approach (Calhoun et al., 2001a
) were entered into two sample t-tests to evaluate pair-wise differences among the three groups. Results are presented for each group for two components, one in temporal lobe and also the default mode (Figure 1
; left). We performed a multiple regression including the target, novel, and standard stimuli and the mean of the estimated beta parameters is shown in Figure 1
(right). We were also able to utilize these results to accurately differentiate healthy controls, schizophrenia patients, and patients with bipolar disorder. This example illustrates the ability of group ICA to differentiate groups and also shows both a comparison of the spatial maps and the time courses.
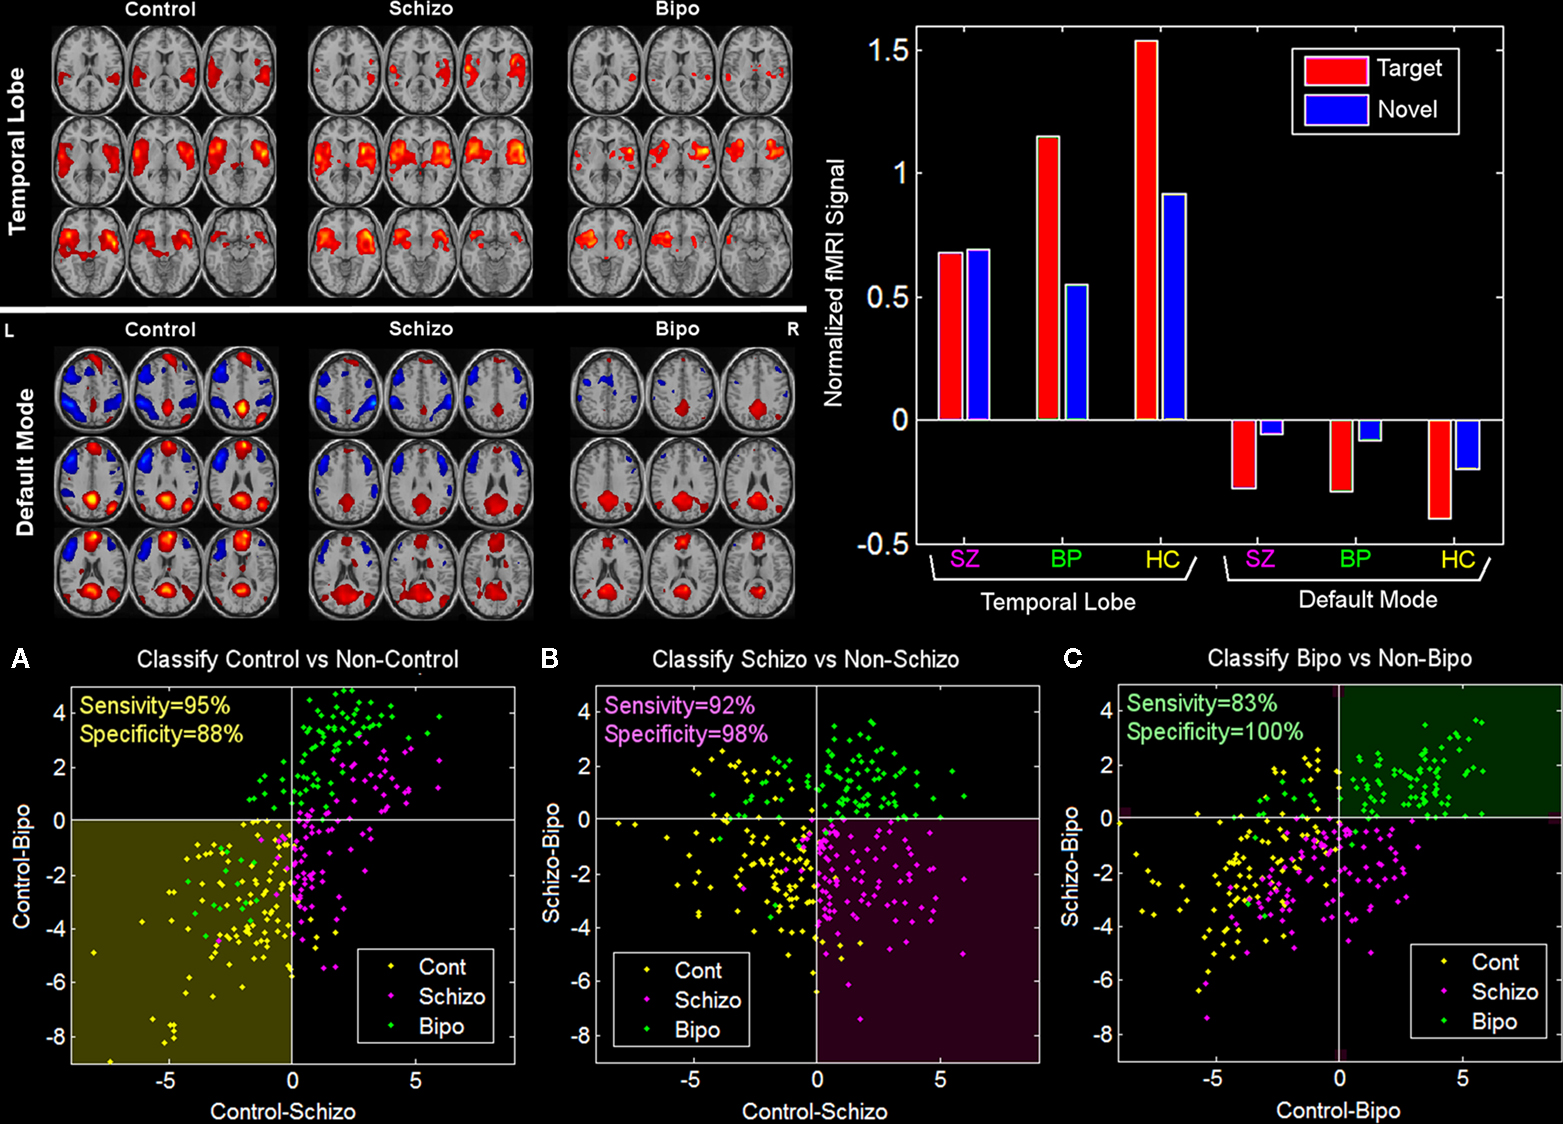
Figure 1. Pair-wise comparisons of the control, schizophrenia, and bipolar groups (from Calhoun et al., 2008b
). Two-sample t-tests were performed to illustrate most significant differences for each pair-wise comparison (top left). Note that these maps are generated from all subjects and actual classification regions will be slightly different due to the leave-1-out approach. On the top right is plotted the average beta weights for the stimuli broken out by group. On the bottom is shown a priori decision regions for three-way classification for (A) control (dark yellow) versus non-control (black), (B) schizophrenia (dark pink) versus non-schizophrenia (black), and (C) bipolar (dark green) versus non-bipolar (black). The actual diagnosis of a given individual is indicated by the color of the dot where controls are yellow, schizophrenia patients are pink, and bipolar patients are green. The classification was done on an independent data set each time using a leave-one-out approach. Sensitivity and specificity values were quite encouraging, with an average sensitivity (true positive) of 90% and an average specificity (true negative) of 95%.
Although studies identifying networks of regions through seed-based approaches or ICA help identify problems with typical functional integration among important brain regions, they do not typically examine patients to see if there is disruption in the relationship of activity between one large network of brain regions and another. However, schizophrenia patients may not only have deficits within networks, but also dysfunction between networks, in that their cognitive and behavioral deficits might be related to entire networks of regions failing to properly communicate with one another.
Related work on TCNs has discussed regions showing task-related increases and other regions showing task decreases, described as anticorrelated networks (Fox et al., 2005
; Uddin et al., 2009
). Kelly et al. (2008)
presented evidence that competition between such task negative and task positive networks mediates behavioral variability during a flanker task while Popa et al. (2009)
showed network differences in attentional modulation. Such networks have also been studied in schizophrenia subjects (Williamson, 2007
) as well as their first degree relatives (Whitfield-Gabrieli et al., 2009
).
The above approaches indicate growing interest in evaluating changes in the interactions between networks and how related changes in disease but, to date these have focused only on two, specific negatively correlated networks. However, we can study the interrelationship between multiple networks using an ICA approach, by examining group differences in the temporal relationship among components (Assaf et al., 2009
; Jafri et al., 2008
). Within a given component, the regions are by definition fully temporally coherent due to the ICA assumption of linear mixing (Calhoun et al., 2004
). But as discussed earlier, one can focus not only on these time courses, but rather also on the weaker dependencies among components. The determination of functional temporal connectivity among components and the evaluation of group differences in these relatively weaker connections is defined as functional network connectivity (FNC) since the approach evaluates changes in the interrelationship between different brain networks (including multiple regions as opposed to correlating a single seed region of interest with other brain regions).
Jafri et al. (2008)
evaluated differences in FNC of resting state TCNs in schizophrenia versus healthy controls by computing a constrained maximal lagged correlation. First ICA was performed on the fMRI data and seven networks were selected. The maximal lagged correlation (between −5 and +5 s) was then examined between all pair-wise combinations. The maximal correlation value and corresponding lag was saved. Correlation and lag values were calculated for all subjects and were later averaged for control and patient group separately, where correlation values represented the dependency of two (out of seven) RSN on each other.
Five statistically significant differences in correlations values for patients versus controls were identified using a two sample t-test thresholded at p < 0.01, corrected for multiple comparisons using the false discovery rate (Genovese et al., 2002
). Interestingly, patients showed considerably higher FNC than controls. Figure 2
represents the significant correlation found among group differences. In the figure, a dotted line represents connectivity values for which patients had higher mean correlation than controls, while a solid line represents connectivity with higher correlation for controls. For example, components A and F, which show significant correlation difference, are connected with a dotted line to indicate that patients had greater mean correlation values than controls for this connection.
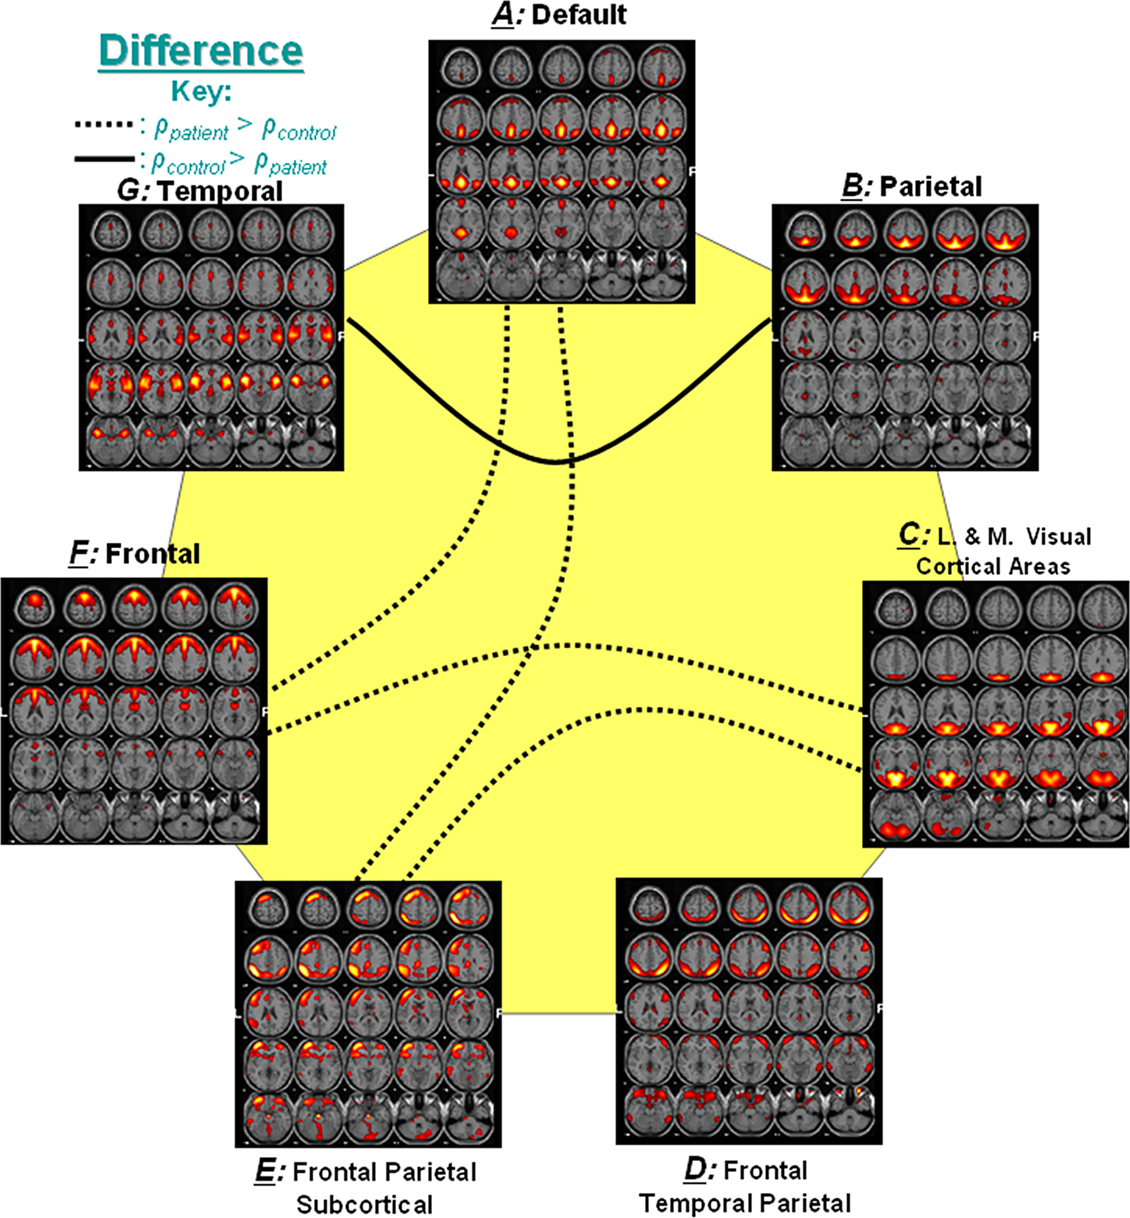
Figure 2. Significant correlation between group differences (from Jafri et al., 2008)
. Out of 21 possible correlation combinations between seven components, only five combinations passed the two sample t-test (p < 0.01). The solid line represents the significant connectivity where controls have higher mean correlation than patients, while dotted line represents connectivity where patients have higher mean correlation. Presence of dotted lines rejects the hypothesis that controls should have more correlation between two components than patients.
Using a slightly different approach, where Granger causality was computed between networks, enables us to evaluate both the inter-network relationships and to identify which frequencies drive these relationships. Demirci et al. (2009)
studied this for two different tasks, an auditory oddball task and a Sternberg working memory task. Different network structures showed aberrant FNC for the two tasks (see Figure 3
).
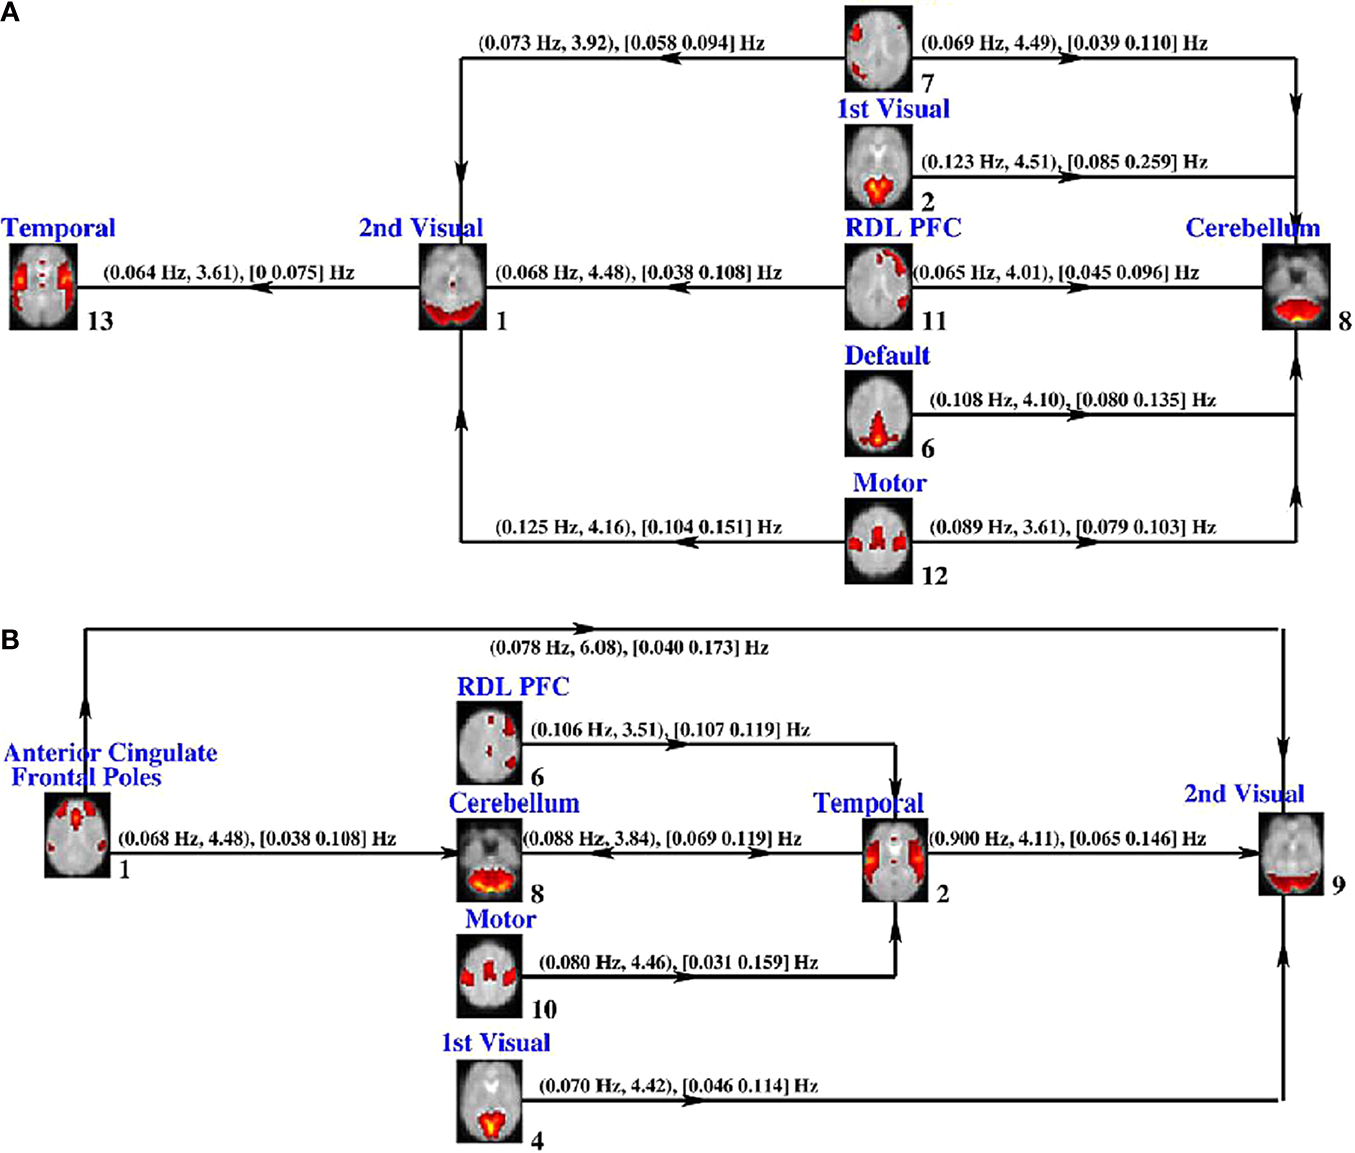
Figure 3. Granger causality FNC results (from Demirci et al., 2009
). Granger causality test results for SIRP data (A) and auditory oddball data (B). The connections and their directions between brain networks are depicted along with (ftmax; tmax) frequency where maximum t-value is obtained and maximum t-value, [fmin fmax], frequency interval where the causal response is higher than 2, are given.
In summary, the application of FNC to study schizophrenia appears to be a very powerful approach since it provides a way to study aberrant connectivity between sets of regions (networks), which is thought to be a core feature of schizophrenia.
In this last section we discuss methods which work at a group level to identify and combine multitask and multimodal networks. One promising approach is joint ICA, a second-level fMRI analysis method that has been used for capturing group-differences in two ways. These are (1) The contribution of one component to each group is dissimilar, which is reflected by the mean of mixing coefficients (quantified via p value of two sample t-test). (2) The back-reconstructed sources for each group are uncommon; namely, the component can vary spatially between two classes of populations as reflected by the joint histogram (quantified via J-divergence) (Calhoun et al., 2006a
). We show three examples of this approach applied to schizophrenia.
Multitask fMRI
We performed a joint analysis of fMRI data collected from a Sternberg (SB) and an auditory oddball discrimination (AOD) task. Data in each task were collected from 15 controls and 15 schizophrenic patients. Additional details of the tasks and subjects are provided in (Calhoun et al., 2006b
). A single joint component including regions in temporal lobe (for the AOD task) and dorsolateral prefrontal cortex (for the SB task) discriminated schizophrenia patients from healthy controls. A joint histogram was computed by ranking voxels surviving the threshold for the AOD and SB parts of the joint source in descending order and pairing these two voxel sets. Single subject and group-averaged joint histograms are presented in Figures 4
A,B and the marginal histograms for the AOD and SB tasks are presented in Figures 4
C,D.
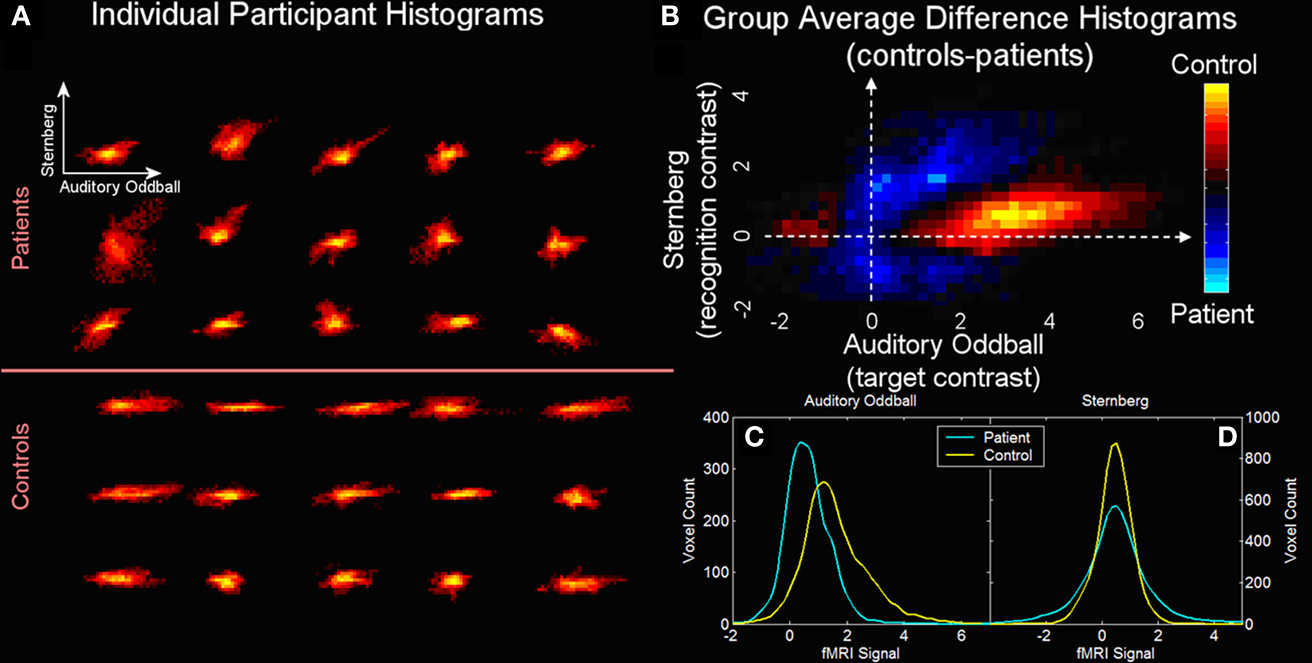
Figure 4. Cross-task 2D histograms for AOD versus SB fMRI activation (from Calhoun et al., 2006b
). Joint 2D histograms for voxels identified in the analysis. Individual (A) and group average difference (B) histograms (with orange areas larger in controls and blue areas larger in patients) are provided along with the marginal histograms for the auditory oddball (SPM contrast image for “targets”) (C) and Sternberg (SPM contrast image for “recall”) (D) data.
In general, more AOD task voxels were active in the controls and the SB task showed a slight increase in standard deviation for the patients. Results also revealed significantly more correlation between the two tasks in the patients (p < 0.0001). A possible synthesis of the findings is that patients are activating less, but also activating with a less unique set of regions for these very different tasks, consistent with a generalized cognitive deficit. Essentially this suggests that schizophrenia patients demonstrate less modularity than healthy controls in the brain patterns induced in response to different tasks.
fMRI-sMRI
It is also feasible to use jICA to combine structural and functional features. Our approach requires acceptance of the likelihood of gray matter changes being related to functional activation. This is not an unreasonable premise when considering the same set of voxels (Thomsen et al., 2004
), or even adjacent voxels (Meyer-Lindenberg et al., 2004
) but also requires the acceptance of related gray matter regions and functional regions which are spatially remote. Given the functional interconnectedness of widespread neural networks, we suggest that this, also, is a reasonable explanation for the relationship between structural and functional changes.
The next example is from a joint-ICA analysis of fMRI data of auditory oddball task and gray matter segmentation data (Calhoun et al., 2006a
). Auditory oddball target activation maps and segmented gray matter maps were normalized to a study specific template in order to control for intensity differences in MR images based on scanner, template and population variations (Clark et al., 2001
).
Results are presented in Figure 5
. The AOD part of the joint source is shown in Figure 5
A, the GM part of the joint source is shown in Figure 5
B, and the ICA loading parameters separated by group and shown in Figure 5
C. Only one component demonstrated significantly different loadings (p < 0.002) in patients and controls (loading for controls was higher than that for patients). The main finding was that the jICA results identified group differences in bilateral parietal and frontal as well as right temporal regions in gray matter associated with bilateral temporal regions activated by the AOD target stimulus. This finding suggests gray matter regions, in a different location than the functional changes, which may serve as a morphological substrate for changes in functional connectivity (Hagmann et al., 2008
; Skudlarski et al., 2008
).
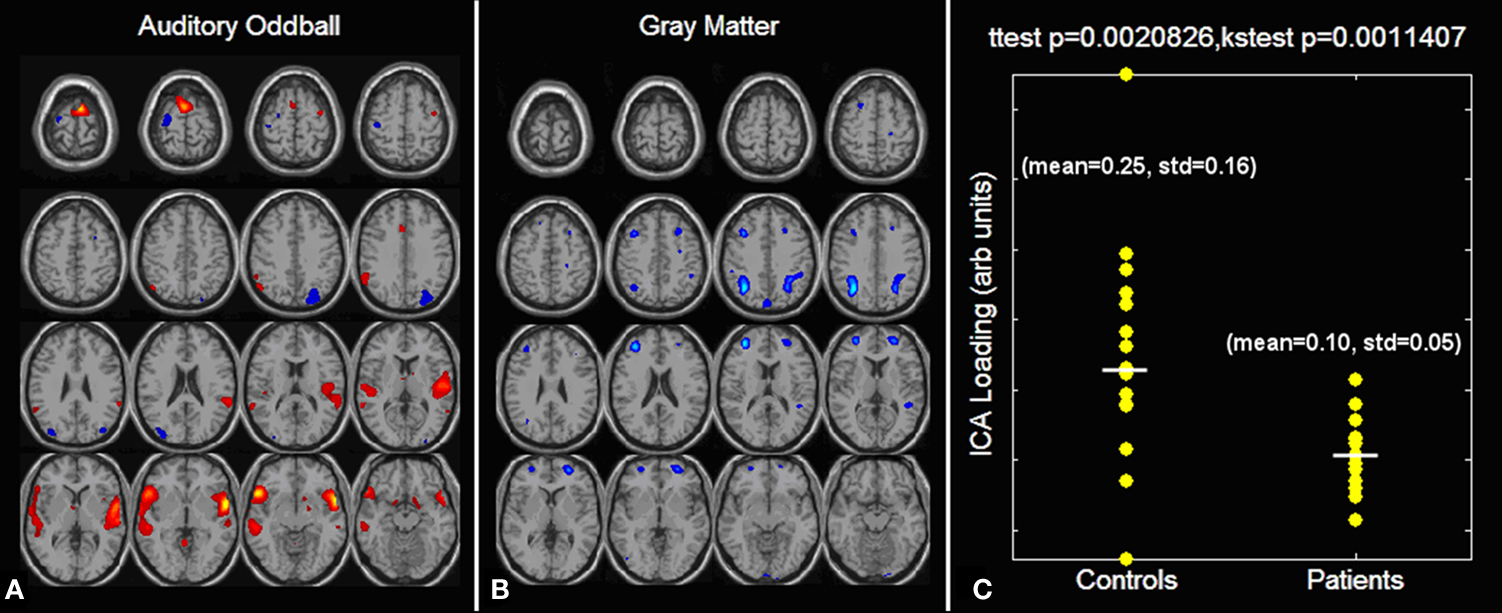
Figure 5. Auditory oddball/gray matter jICA analysis (from Calhoun et al., 2006a
). Only one component demonstrated a significant difference between patients and controls. The joint source map for the auditory oddball (A) and gray matter (B) data is presented along with the loading parameters for patients and controls (C).
fMRI-ERP
The feature-based jICA framework was used for fusion of event-related potential (ERP) and fMRI data collected from 23 healthy controls and 18 chronic schizophrenia patients, during the performance of an AOD task. Fifteen joint components were estimated from the target-related ERP time courses and fMRI activation maps via the jICA. One joint component was found to distinguish patients and controls using a two-sample t-test (p < 0.0001) on patient and control loading parameters. This identified component showed a clear difference in fMRI at bilateral frontotemporal regions (Figure 6
B) and in the ERP during the N2-P3 latency range (Figure 6
A). Both the hemodynamic and electrophysiologic phenomena that were jointly expressed in this source have been previously implicated in schizophrenia.
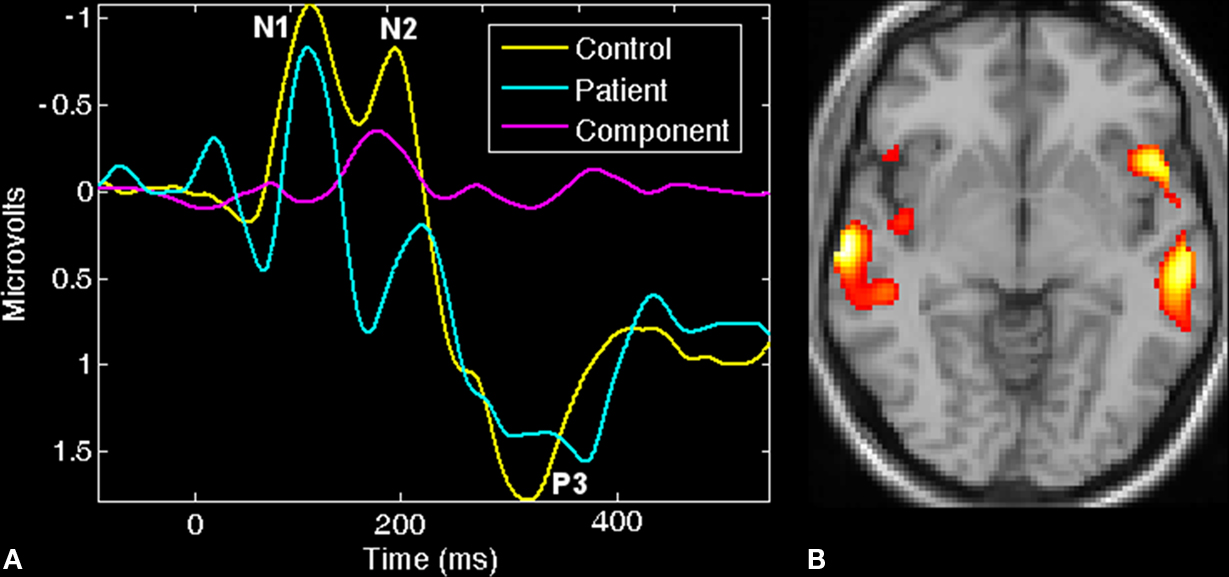
Figure 6. ERP/fMRI jICA (from Calhoun and Adali, In Press
). Joint component which showed significantly different loading parameters (p < 0.0001) for patients versus controls: (A) control (yellow) and patient (blue) average ERP plots along with the ERP part of the identified joint component (pink). (B) Thresholded fMRI part of the joint component showing bilateral temporal and frontal lobe regions.
In the same way as for Figure 4
significant voxels/time points were used to generate an ERP vs fMRI histogram for controls (orange) and patients (blue), shown in Figure 7
. The patients are clearly showing decreased activity in both fMRI and ERP data.
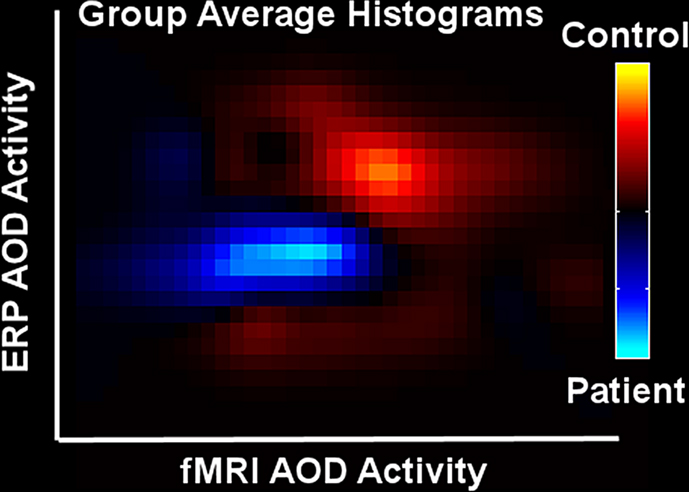
Figure 7. ERP/fMRI histograms (from Calhoun and Adali, In Press
). Joint histograms for patients (blue) and controls (orange).
Note that jICA is a blind method that does not incorporate prior diagnostic information and is as such not optimized for detecting group differences. If the goal is to optimally identify potential biomarkers of disease, we can incorporate prior membership information and thus enhance the sensitivity of the method to detect relevant group differences. Towards this end, we have proposed a new framework combining coefficient-constrained ICA (CC-ICA) (Sui et al., 2009a
) and principal component analysis with reference (PCA-R) (Caprihan et al., 2008
; Liu et al., 2008
). This enhances the components’ extraction sensitivity to group differences as well as their estimation accuracy. Secondly, a strength of the method is that it provides a unitary, and concise representation of a particular group discriminative feature from multimodal data in a single component. That is for each participant it summarizes many spatio-temporal features in a single loading parameter that can be associated with the probability of belonging to one or the other group. An analysis flow chart explaining how one proceeds from the raw data all the way to the final optimal components is given in Figure 8
.
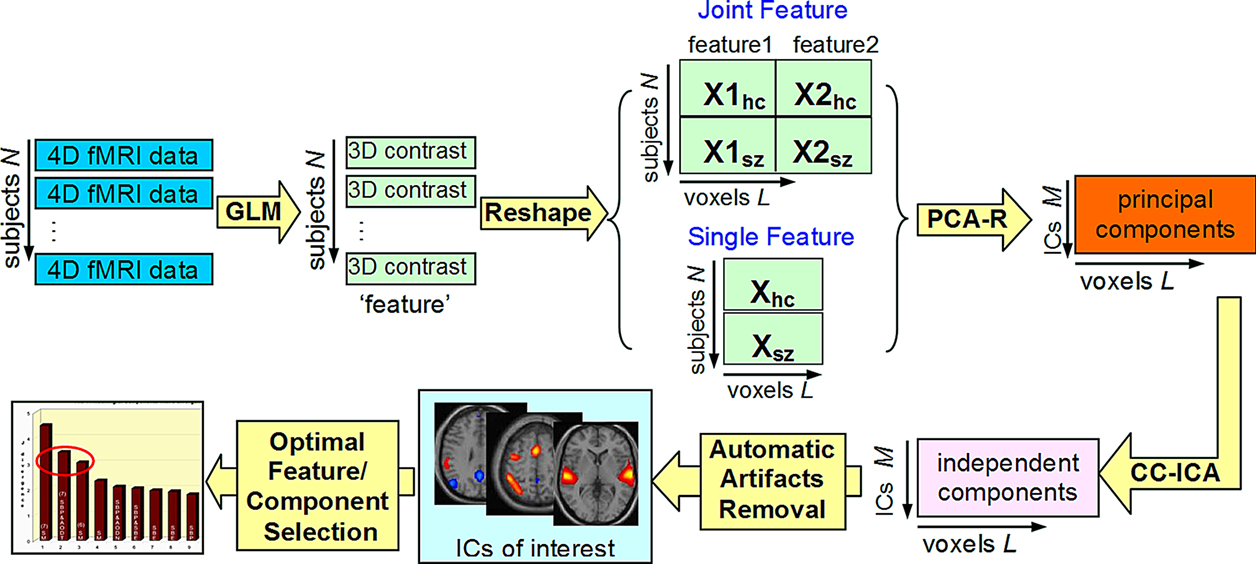
Figure 8. An analysis flow chart showing the process of obtaining optimal group discriminative components (from Sui et al., 2009b
). Flowchart of the optimal features/components selection, explaining how to determine the final optimal components from the raw data.
Coefficient-constrained ICA is formulated by incorporating a group difference criterion directly into the traditional ICA cost function to adaptively constrain the mixing coefficients of certain components to enhance group differences. CC-ICA aims to improve the components’ extraction sensitivity to group differences as well as their estimation accuracy. The cost function is constructed as shown in Eq. 1, in addition to the traditional ICA objective function H for achieving independence; the sum of the squared T statistic of the constrained component(s) is added.

where λ is the constraint strength associated with the T2 term, the suffix i represents index of the constrained ICs. The calculation of Ti and how to determine the constrained components including maximization of cost function C is based on the gradient algorithm are given in the original paper (Sui et al., 2009a
).
The approach is applied to fMRI data from a sensorimotor (SM), auditory oddball (AOD) and Sternberg working memory (SBP) tasks collected in patients with schizophrenia and healthy controls. Three optimal components belong to two optimal feature combinations: two components extracted from the SM task alone, and one joint component from the SBP & AOD tasks. For display, the spatial maps of the three components were converted to Z-scores and thresholded at | Z | > 2.5 as shown in Figures 9
A,B. Figure 9
C gives a distinct view of the combined spatial maps in Figures 9
A,B; these activated regions can best separate the two groups. A significant group difference is indicated in Figure 9
D by subtracting the spatial maps of patients and controls. Orange indicates regions where controls have greater activity, blue regions indicate larger activity in patients.
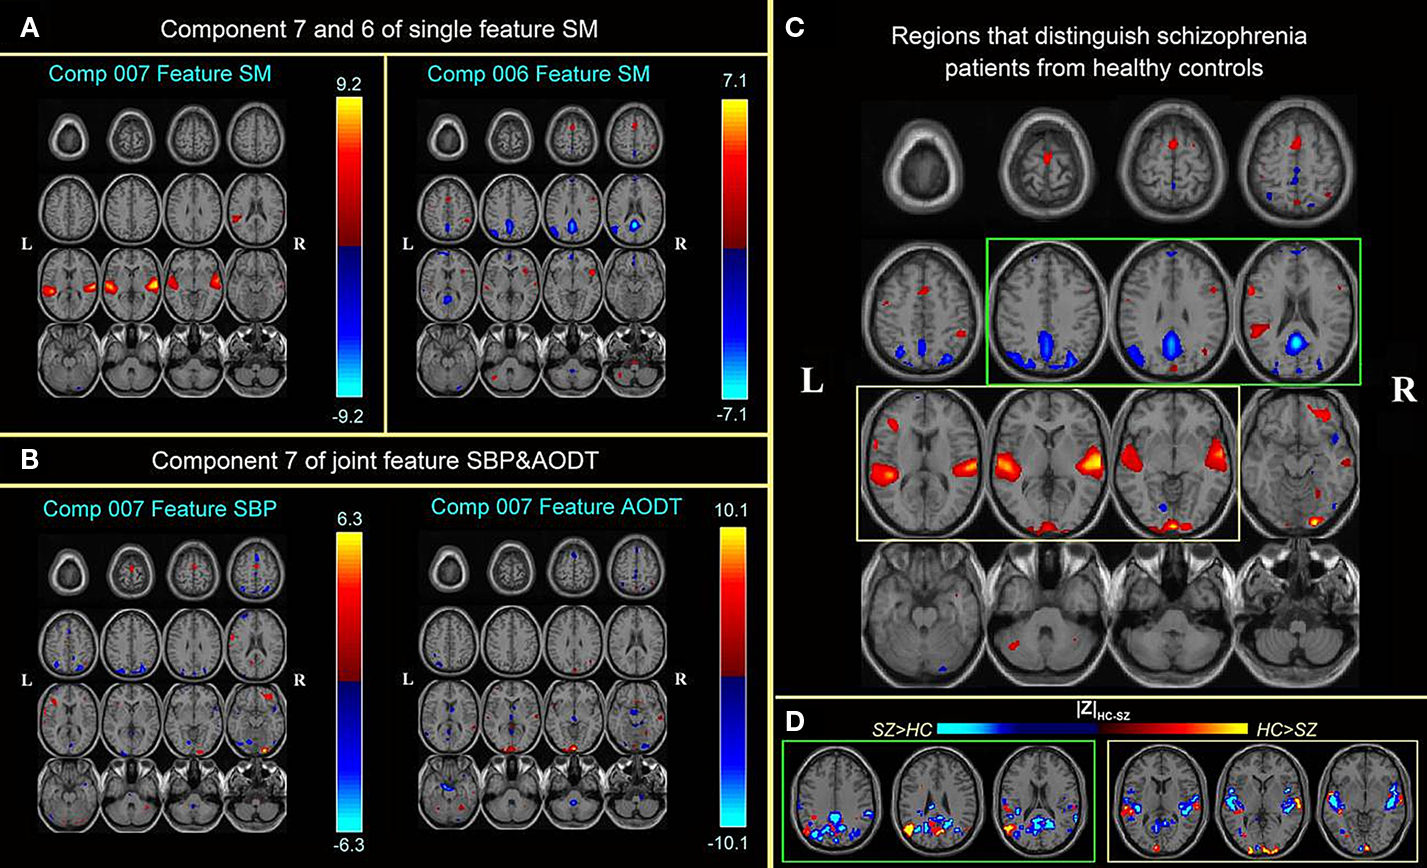
Figure 9. Top three optimal components and the combined most group-discriminative regions (from Sui et al., 2009b
). (A,B) are the spatial maps of the top three optimal components, which are converted to Z-scores and thresholded at | Z | > 2.5; (C) shows the overlapping regions of the four features with their original spatial map values, these activated regions are important for group discrimination and may serve as potential biomarkers of schizophrenia patients; (D) displays the difference between the back-reconstructed sources (HC-SZ) on the combined highlighted regions of the top three optimal ICs in (C), the regions where HC > SZ in | Z | score are shown in orange, otherwise are shown in blue.
The three optimal components predominantly describe aberrant patterns of activity in the superior temporal gyri, precuneus and angular gyri (DMN). Note also that each of these brain networks was identified separately in previous neuroimaging studies (Garrity et al., 2007
; Kiehl et al., 2005
; Tregellas et al., 2004
). Our approach grouped them together in a framework that specifically identifies group discriminative features. Such a result cannot be obtained using traditional mass-univariate approaches which focus upon detection of activity differences in single voxels in single tasks, which is generally associated with lower sensitivity (Pereira et al., 2009
). Moreover, the optimal components may only be “identifiable” through stimulation and comparison by different tasks, which further motivates a data fusion approach.
In summary, the study of large-scale brain networks is becoming increasingly important, especially when studying complex mental illnesses like schizophrenia which impact many brain circuits. We have reviewed a number of approaches, mostly based upon ICA, which emphasize different aspects of the data. The brain is highly interconnected and many studies have focused upon aberrant connectivity as important in schizophrenia. However the brain is organized as networks involving multiple regions thus studying only how one region is connected to another is not going to provide a full picture of how this aberrant connectivity manifests. For example, two networks may be “intact” in that all the correct regions are present in both but interactions between these networks are aberrant. It is clear that utilizing methods which can capture information about brain networks as well as the interrelationship between networks is important. It is also clear that there is important information available for studies which contain a task as well as those that involve only rest.
There is still much work to be done, but it is encouraging to see the richness of network based analyses.
The authors declare that the research was conducted in the absence of any commercial or financial relationships that could be construed as a potential conflict of interest.
This research was supported in part by the National Institutes of Health (NIH), under grants 1 R01 EB 000840, 1 R01 EB 005846, and 1 R01 EB 006841 to VDC and grants R01MH077945, R37 MH43775 (MERIT Award) and MH074797 to GDP. TE was supported by a grant from the L. Meltzer university fund (801616).
Demirci, O., Stevens, M. C., Andreasen, N. C., Michael, A., Liu, J., White, T., Pearlson, G. D., Clark, V. P., and Calhoun, V. D. (2009). Investigation of relationships between fMRI brain networks in the spectral domain using ICA and Granger causality reveals distinct differences between schizophrenia patients and healthy controls. Neuroimage 46, 419–431.
Kim, D., Manoach, D. S., Mathalon, D., Turner, J., Brown, G., Ford, J. M., Gollub, R. L., White, T., Wible, C. G., Belger, A., Bockholt, H. J., Clark, V. P., Lauriello, J., O’Leary, D., McCarthy, G., Mueller, B., Lim, K., Andreasen, N. C., Potkin, S., and Calhoun, V. D. (In Press). Dysregulation of working memory and default-mode networks in schizophrenia during a Sternberg item recognition paradigm: an independent component analysis of the multisite Mind and fBIRN studies. Hum. Brain Mapp. (in press).
Kim, D., Mathalon, D., Ford, J. M., Mannell, M., Turner, J., Brown, G., Belger, A., Gollub, R. L., Lauriello, J., Wible, C. G., O’Leary, D., Lim, K., Potkin, S., and Calhoun, V. D. (2009). Auditory oddball deficits in schizophrenia: an independent component analysis of the fMRI multisite function BIRN study. Schizophr. Bull. 35, 67–81.
Sorg, C., Riedl, V., Muhlau, M., Calhoun, V. D., L. L., Drzezga, A., Forstl, H., Kurz, A., Zimmer, C., and Wohlschlager, A. (2007). Selective changes of resting-state networks in patients at high risk for Alzheimer’s disease – an example for profiling functional brain disorders. Proc. Natl. Acad. Sci. U.S.A. 104, 18760–18765.
Whitfield-Gabrieli, S., Thermenos, H. W., Milanovic, S., Tsuang, M. T., Faraone, S. V., McCarley, R. W., Shenton, M. E., Green, A. I., Nieto-Castanon, A., LaViolette, P., Wojcik, J., Gabrieli, J. D., and Seidman, L. J. (2009). Hyperactivity and hyperconnectivity of the default network in schizophrenia and in first-degree relatives of persons with schizophrenia. Proc. Natl. Acad. Sci. U.S.A. 106, 1279–1284.