Applications of multivariate pattern classification analyses in developmental neuroimaging of healthy and clinical populations
1
Center for Interdisciplinary Brain Sciences Research, Stanford University School of Medicine, Palo Alto, CA, USA
2
Department of Electrical Engineering, Stanford University, Palo Alto, CA, USA
3
Department of Radiology, Stanford University School of Medicine, Palo Alto, CA, USA
Analyses of functional and structural imaging data typically involve testing hypotheses at each voxel in the brain. However, it is often the case that distributed spatial patterns may be a more appropriate metric for discriminating between conditions or groups. Multivariate pattern analysis has been gaining traction in neuroimaging of adult healthy and clinical populations; studies have shown that information present in neuroimaging data can be used to decode intentions and perceptual states, as well as discriminate between healthy and diseased brains. While few studies to date have applied these methods in pediatric populations, in this review we discuss exciting potential applications for studying both healthy, and aberrant, brain development. We include an overview of methods and discussion of challenges and limitations.
The human brain is a distributed processing machine, with even the most basic tasks requiring the cooperation of neurons in multiple brain regions. It has long been recognized that important information about brain function is encoded in distributed patterns of brain activity (Mesulam, 1981
; Vaadia et al., 1995
; McIntosh et al., 1996
; Fox et al., 2005
). Nonetheless, univariate analysis methods, which treat each spatial location in the brain independently, have predominated in both functional and structural magnetic resonance imaging (fMRI and sMRI) research (Cox, 1996
; Worsley et al., 1996
; Ashburner and Friston, 2000
; Smith et al., 2004
).
In recent years, multivariate pattern analysis (MVPA) approaches to studying the brain have been gaining momentum (e.g., Kay et al., 2008
; Mitchell et al., 2008
). These methods are designed to identify spatial and/or temporal patterns in the data that differentiate between cognitive tasks or subject groups. The excitement about these methods has been borne out by several studies showing that patterns of brain activity carry information that reliably predicts what the subject is seeing (Eger et al., 2008
), attending to (Kamitani and Tong, 2005
), or planning to do (Bode and Haynes, 2009
). In addition, by quantifying distributed neural representations for specific components of visual images or semantic concepts, it is possible to construct a general visual decoder (Kay et al., 2008
), reconstruct a subjects’ perceptual experience, even for novel stimuli (Miyawaki et al., 2008
), and make quantitative predictions about how the brain will respond to new stimuli (Mitchell et al., 2008
).
Neuroimaging studies of the developing brain have found that activity in specific regions differs between children and adults (Casey et al., 1997
; Thomas et al., 2001
; Bunge et al., 2002
). However, as the brain matures, many regions undergo structural changes (Reiss et al., 1996
; Gogtay et al., 2004
), and cognitive maturation likely occurs as a result of distributed changes in the brain. Indeed, recent studies employing network analysis methods have found that the configuration of brain networks also changes over the course of development (Fair et al., 2009
; Supekar et al., 2009
), suggesting that studying development in terms of changing distributed patterns of structure or activity could be more sensitive than studying changes in individual regions.
Furthermore, an important challenge in pediatric clinical neuroimaging is identifying patterns of brain activity or structure that reliably predict disease onset (Koutsouleris et al., 2009
), or can distinguish treatment responders from non-responders. Multivariate methods have particular relevance for research problems related to prediction of clinical outcomes from neuroimaging data, as they may afford greater sensitivity to widespread changes in the brain (Davatzikos et al., 2008
; Koutsouleris et al., 2009
; Misra et al., 2009
), or differences in local information coding (Kriegeskorte et al., 2006
).
Several excellent reviews have discussed the application of multivariate pattern classification to fMRI data, with a focus on decoding of subjective states (Haynes and Rees, 2006
; O’Toole et al., 2007
; Pereira et al., 2009
). There is also a growing literature on classifying group differences, which is of particular interest for clinical investigations. While few studies to date have applied MVPA in pediatric neuroimaging (Hoeft et al., 2007
; Hoeft et al., 2008
; Zhu et al., 2008
), there are many promising applications in this field. Here we review relevant literature on studies in adult healthy and clinical populations, including functional, structural, and multimodal studies, and provide an outlook for future studies in pediatric neuroimaging. We will begin with a brief overview and motivation for using MVPA, followed by an introduction to methods and choices to be made when implementing MVPA. Next, we will discuss applications in the literature with an emphasis on those relevant to pediatric neuroimaging in healthy and clinical populations. Finally, we discuss some specific challenges and limitations of MVPA methods.
fMRI studies generate on the order of 100,000 time series from voxel locations throughout the brain. These time series, especially from proximal locations, are not independent, and yet mass univariate analysis methods, which treat each voxel independently, are the most widely used in the neuroimaging literature [general linear model (GLM); Friston et al., 1995a
; Worsley et al., 2002
. These methods allow the researcher to specifically model the expected neural response over time, and are useful for testing detailed hypotheses about the involvement of specific regions in task performance. However, brain activity, i.e., neuronal firing, is in itself just a means of communicating with other neurons, and it is clear that even the simplest cognitive tasks are not accomplished solely by the neurons contained in individual voxels. This suggests that analysis techniques designed to learn distributed spatial patterns that best distinguish one condition from another (Kriegeskorte et al., 2006
; De Martino et al., 2008
; Pereira et al., 2009
) may be more sensitive than univariate techniques. MVPA can be applied to any multivariate data, including fMRI and sMRI.
MVPA methods are sensitive to spatially covarying patterns of activity, and are therefore intrinsically linked to functional connectivity analyses (McIntosh et al., 1994
; McIntosh et al., 1996
; Friston et al., 1997
; Calhoun et al., 2001
; Friston et al., 2003
), which seek to uncover functional networks in the brain. As such, depending on the spatial scale on which a particular analysis is performed, one might interpret a pattern of activity as representing a spatially distributed network of brain regions. MVPA techniques are also frequently used at a finer spatial scale to uncover how information is encoded within a particular region (Kamitani and Tong, 2005
; Kriegeskorte et al., 2006
; Kay et al., 2008
). By far, the most popular application in the functional imaging literature has been to study object representation and visual consciousness (Haxby et al., 2001
; Carlson et al., 2003
; Cox and Savoy, 2003
; Hanson et al., 2004
; Polyn et al., 2005
; De Martino et al., 2008
; Eger et al., 2008
; Kay et al., 2008
).
Demonstrating that fMRI data contains enough information to distinguish between a restricted set of stimulus conditions may seem like merely a validation that fMRI is robust and repeatable (Bandettini, 2009
). However, with the right experimental design, MVPA studies can provide detailed insight into information representation and functional organization in the brain. For example, studies which map neural responses to the building blocks of visual objects or semantic concepts (Kay et al., 2008
; Mitchell et al., 2008
; Miyawaki et al., 2008
) lead us to a better understanding of the brain’s responses to more complex stimuli. In the clinical domain, mapping gross differences in structure or brain activity may be relatively straightforward, but developing tasks that elucidate how these differences in distributed processing affect behavior will be a greater challenge.
Developmental and Clinical Neuroimaging
Widespread structural changes in the brain occur as a function of development in childhood (Reiss et al., 1996
). While many studies have successfully identified local changes in brain activity (Casey et al., 1997
; Bunge et al., 2002
), a complementary approach is to study how networks of regions change as the brain develops (e.g., Fair et al., 2009
; Supekar et al., 2009
); see Stevens (2009)
for a review. For studying the evolution of distributed activity patterns, MVPA may be more sensitive than univariate methods and could be applied to distinguish individuals at different stages of cognitive development, as they have similarly been applied to distinguish different stages of cognitive decline (Fan et al., 2008a
).
In clinical populations, MVPA techniques are of particular interest for studying the development of brain disorders, as studies in adults have shown that these disorders rarely affect single brain structures (e.g., Harrison, 1999
; Lee et al., 2007
), and may be better understood using an approach designed to capture network behavior (Greicius and Menon, 2004
; Celone et al., 2006
; Garrity et al., 2007
). As many psychiatric diagnoses are based on behavioral symptoms that overlap between disorders and have poorly understood etiology, the promise of MVPA methods for uncovering biomarkers (endophenotypes) is extremely attractive [e.g., in psychosis or Alzheimer’s (AZ), Koutsouleris et al., 2009
; Misra et al., 2009
. An important challenge in pediatric clinical neuroimaging is identifying patterns of brain activity or structure that reliably precede disease onset (Koutsouleris et al., 2009
), or can distinguish treatment responders from non-responders.
Univariate Versus Multivariate
Analysis of both fMRI and sMRI data has traditionally been performed in a univariate sense. That is, the time series of each voxel in the brain is separately modeled and statistically tested for a condition of interest, usually in the framework of the GLM (Friston et al., 1995b
; Worsley et al., 2002
). Thus, questions regarding how blood oxygen level dependent (BOLD) signal activity relates to a continuous outcome measure (e.g., developmental stage), or differs across populations (e.g., in patients with distinct neurological diseases), are addressed using information from each region of the brain separately.
In contrast, MVPA of neuroimaging data simultaneously considers the BOLD signal measured across a number of spatial locations. Rather than asking to what degree each voxel responds to one experimental condition versus another, MVPA turns the question around, asking instead whether – and which – patterns of brain activity across many voxels are characteristic of the brain during one experimental condition versus another, or of one clinical population versus another. In addition, many MVPA approaches do not require the specification of a hemodynamic model, which may differ considerably across subject populations (Handwerker et al., 2004
; Thomason et al., 2005
; Handwerker et al., 2007
). Combining information from multiple spatial locations yields a descriptive power beyond that of single voxels, potentially allowing for greater sensitivity in differentiating between individuals and conditions.
Problem Specification
For neuroimaging studies, MVPA has been employed primarily in two ways. The first aims to infer the mental state of a subject (i.e., what the subject is perceiving, feeling, or thinking) or the stimulus or experimental condition presented at a particular time, based on information from the BOLD fMRI volumes acquired at that time (see Haynes and Rees, 2006
for a review, and “‘Brain reading’ with fMRI” below for further discussion).
The second major application, which is perhaps more relevant to clinical studies, is to predict the state of an individual given his/her functional or structural imaging data. For example, Zhang et al. (2005)
were able to differentiate between the brains of subjects with and without drug addictions; Zhu et al. (2008)
applied classification to discriminate between children with attention-deficit/hyperactivity disorder and normal controls. Applying MVPA in such contexts can yield insight into the neural signatures or determinants of various diseases, as well as guide the identification of biomarkers and courses of treatment or intervention. A general pipeline for applying MVPA is shown in Figure 1
.
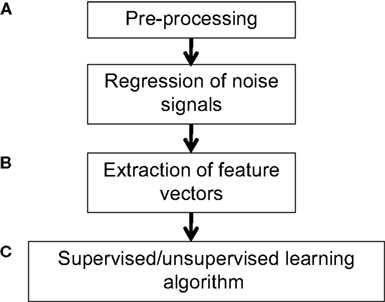
Figure 1. Example workflow for pattern classification analysis. (A) Preprocessing of fMRI data can follow that used for conventional GLM analyses, consisting of slice-timing correction, realignment, and optional spatial normalization and smoothing steps. However, while the GLM can reduce potential noise sources by including signals such as motion parameters and physiological noise models as covariates in the GLM design matrix, MVPA does not typically have a framework for modeling confounds. Thus, when applying MVPA to the raw time-series, expected confounds should be removed from the data prior to performing MVPA, such as by obtaining the residuals from a regression over the nuisance variables. In addition, if the features are activation patterns (parameter estimates for a particular model), one may wish to first run a GLM analysis on the fMRI data and extract the relevant contrast estimates. (B) Next, the pre-processed data should be transformed into “feature vectors”. This involves creating, for each data point (e.g., subject) a vector in which the ith entry corresponds to the value of the ith feature for that data point. Feature selection may be applied to reduce the number of entries in the feature vectors. (C) At this stage, one may choose to run an unsupervised learning algorithm to characterize patterns in the data, or to run a supervised learning algorithm in conjunction with cross-validation. The parameters of the trained model can be examined for further insight, and the model may also be applied to make predictions on additional datasets so as to further explore its generalization ability.
Approaches
Supervised learning
Supervised learning is based on determining a mapping between particular attributes, or features, of the data (e.g., the BOLD signal activation levels from multiple voxels observed in a subject) and the associated value of a target label of interest (e.g., the subject’s cognitive or developmental state, or class of psychiatric disorder). A set of data points (the training set) is used to estimate (learn) the parameters of a model relating the features to the target labels. Once the parameters are learned, the model can be applied to predict the target label of a previously unseen data point. The supervised learning problem is referred to as classification when the target labels comprise a set of discrete classes (e.g., different clinical populations), and as regression when the target labels assume continuous values (e.g., behavioral performance or the severity of a disorder).
Classification. There are a number of different classification methods, each of which makes a different set of assumptions about the data and posits a particular type of model relating the features to the target labels, as well as a means of learning its parameters. Linear classifiers (Figure 2
) predict the target label of an example based on a linear combination of its features, and are widely used in fMRI studies due to their simplicity, interpretability, and generally good performance.
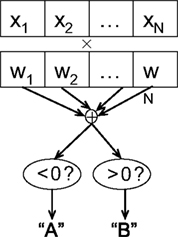
Figure 2. Schematic of linear classification. Each feature (xi) of the data point (x1,…,xN) is multiplied by its respective weight (wi), and the summation of the resulting terms ( ) is evaluated. The classifier predicts that the data point is in “class A” if
  , and “class B” if
  .
.
) is evaluated. The classifier predicts that the data point is in “class A” if , and “class B” if .As an example of linear classification, suppose the features (x1,…,xN) of an fMRI dataset are defined to be the average BOLD signal percent change in each of N regions during a task performed by subjects from two different clinical populations (“A” an “B”). Given the values of (x1,…,xN) from a subject, the linear classifier might predict that he/she belonged to group “A” if the linear combination w0 + w1x1 + … + wNxN is <0, and “B” if the linear combination is >0 (see Figure 2
). The weights (w0,…,wN) are the parameters of the model, which are learned during training. After the training process, the weights can be examined for the specific patterns of brain activity related to each clinical condition. For instance, the relative magnitudes of the individual weights can reveal the relative importance of each of the features in the classification process (a higher magnitude of wi, compared to wj, indicates that feature xi is weighted more heavily in determining the output than is xj), and the relative signs of the weights wi and wj can reveal whether features xi and xj are indicative of the same class (which would be the case if the signs of wi and wj were the same) or different classes.
Several commonly used linear classifiers in neuroimaging include the linear support vector machine (SVM) (e.g., Kamitani and Tong, 2005
; LaConte et al., 2005
; Mourao-Miranda et al., 2005
), linear discriminant analysis (LDA) (e.g., Haynes and Rees, 2005
; O’Toole et al., 2005
), and logistic regression (LR) (e.g., Knutson et al., 2007
; Yamashita et al., 2008
). There is no clearly “correct” choice of classifier for a given problem. Studies comparing different classifiers for fMRI data have shown that SVM outperforms LDA for particular fMRI data sets and feature selection methods (Cox and Savoy, 2003
; Mourao-Miranda et al., 2005
; Bergstrand et al., 2009
). LR and SVM are reported to have comparable performance (Pereira et al., 2009
), though SVMs can more efficiently handle high-dimensional feature spaces (Vapnik, 1996
). Classifiers that use nonlinear functions of the features (nonlinear classifiers) also exist, though they do not always outperform linear classifiers in practice (Cox and Savoy, 2003
), and the parameters of a nonlinear model are more difficult to interpret than the weights of a linear classifier.
Regression. For problems in which the target labels assume continuous values, linear regression models the target label as a linear combination of the features: the prediction ( ) of the actual target label (y) is given by
  . There are a variety of linear regression algorithms, differing from one another primarily according to the criterion for selecting the parameters [weights (w0,…,wN)]. In standard least-squares regression, the weights are chosen to minimize the squared error between the prediction and the actual target label, summed over each of the M data points in the training set. This function (
 ) is known as the cost function.
) of the actual target label (y) is given by . There are a variety of linear regression algorithms, differing from one another primarily according to the criterion for selecting the parameters [weights (w0,…,wN)]. In standard least-squares regression, the weights are chosen to minimize the squared error between the prediction and the actual target label, summed over each of the M data points in the training set. This function () is known as the cost function.In ridge regression, the weights are chosen to minimize a slightly different cost function, which contains both the squared error and the amplitude of the weights:  , where λ is an additional parameter that controls their relative importance. Including the amplitude term tends to improve the performance of the regression algorithm on data that were not used in the training process, as it reduces the likelihood that the solution (w) overfits to the training set (Hastie et al., 2001
). Other types of objective functions may produce solutions in which many of the wi are equal to 0, effectively reducing the number of features used in the model; this will be described further in Dimensionality reduction and feature selection. For clinical studies, regression may be applied toward mapping patterns of brain activity onto continuous outcome measures, such as the progression or severity of a disorder. For example, Hoeft et al. (2007)
combined behavioral, functional, and structural neuroimaging data in a regression analysis to predict phonological processing abilities of 8- to 11-year-old poor readers one school-year later.
, where λ is an additional parameter that controls their relative importance. Including the amplitude term tends to improve the performance of the regression algorithm on data that were not used in the training process, as it reduces the likelihood that the solution (w) overfits to the training set (Hastie et al., 2001
). Other types of objective functions may produce solutions in which many of the wi are equal to 0, effectively reducing the number of features used in the model; this will be described further in Dimensionality reduction and feature selection. For clinical studies, regression may be applied toward mapping patterns of brain activity onto continuous outcome measures, such as the progression or severity of a disorder. For example, Hoeft et al. (2007)
combined behavioral, functional, and structural neuroimaging data in a regression analysis to predict phonological processing abilities of 8- to 11-year-old poor readers one school-year later.Partial least squares (PLS) is a regression approach that can identify multivariate patterns within neuroimaging data that covary with experimental condition (McIntosh et al., 1994
; McIntosh et al., 1996
). Here, the target labels (as well as the features) are multi-dimensional, comprising for instance a variety of clinical outcome measures or fMRI task design parameters. PLS will return a set of spatiotemporal components in the imaging data that explain joint variation between the imaging data and target labels. Clinical applications of PLS have included identifying large-scale brain networks that mediate genetic risk for obsessive–compulsive disorder (Menzies et al., 2007
) and predicting the behavioral effects of nicotine use (Giessing et al., 2007
).
Unsupervised Learning
Supervised learning requires the user to specify both the features and target label of each example in the training set. In contrast, unsupervised learning requires only the features (no labels), and attempts to learn patterns and structure in the data.
Clustering is one form of unsupervised learning, which identifies groups within the data based on the similarity of their features. K-means clustering assigns each data point to one of k groups, and has been applied to discover relationships among the time series of voxels in fMRI data (Golland et al., 2008
; Mezer et al., 2009
). Hierarchical clustering methods build a succession of clusters: data-points are first grouped into clusters, and the clusters themselves are merged into groups at a second level according to their similarity, and so forth, building a tree depicting the hierarchical dependence structure across data points (Cordes et al., 2002
; Liao et al., 2008
). Thus, while k-means clustering is informative of major subdivisions in the data, hierarchical clustering provides a more complete characterization of relationships between data points and may be used to identify more subtle patterns. However, some of the relationships discovered by hierarchical clustering may be driven by attributes specific to the dataset to which it is applied, and may not generalize across other datasets. Thus, one must take care not to “overfit” to a given dataset, and may wish to employ methods such as those used in Talavera (1999)
.
Independent component analysis (ICA) is another popular form of unsupervised learning. ICA can be applied to decompose a set of fMRI time courses into a set of spatially distinct “networks”. ICA has provided insight into the functional organization of the brain (McKeown et al., 1998
; Beckmann et al., 2005
) and suggested key functional differences across clinical populations (Greicius et al., 2004
; Calhoun et al., 2008
; Rombouts et al., 2009
). In addition to exploring the spatiotemporal structure of brain activity within individuals and groups, the spatial networks and time courses derived using ICA can also be used to derive features within the framework of supervised learning (De Martino et al., 2007
; Calhoun et al., 2008
). For example, Calhoun et al. (2008)
applied ICA to the data of bipolar and schizophrenic patients, extracting two networks from each subject (“default-mode” and “temporal lobe”). The networks were then used as input to a classification algorithm, which demonstrated high accuracy in classifying between the patient groups.
Validation
As described above, an MVPA model can yield useful information about the properties and structure of the dataset it is trained on. However, for MVPA to be applicable for drawing general conclusions relating brain activity patterns and clinical variables, it is important to know how well the model applies to subjects and scans beyond those in the training set. One method for estimating the generalization ability of a supervised learning model is via cross-validation. In hold-out cross-validation, a subset of the data (training set) is used for learning the model parameters, and the remainder (test set) is used for validation. In validation, the trained model is applied to predict the target label of each data point, and the prediction accuracy across the test set is summarized using metrics such as the percentage of correctly classified data points (for classification) or mean-squared error (for regression). A cross-validation method that makes more efficient use of the data is known as k-fold cross-validation. Here, the N data points comprising the entire dataset are randomly partitioned into k subsets; k iterations are then performed, whereupon one of the subsets is designated as the test set, and the remaining N–k data points are designated as the training set. The prediction accuracy is finally summarized as the average of the error over each of the k iterations. When the number of available data points is small, as is often the case with fMRI subject populations, one might choose to set k = 1 (leave-one-out cross-validation), though the computational expense will increase since (N − 1) iterations of training are then required. Permutation testing can be used to determine whether the classification accuracy is statistically significant (significantly better than chance) (e.g., see Golland and Fischl, 2003
; Pereira et al., 2009
).
In addition to accuracy (the fraction of correctly classified data points in the test set), the performance of a classifier can be quantified using sensitivity [TP/(TP + TN)] and specificity [TN/(TN + FP)], where TP is the number of true positives, TN is the number of true negatives, and FP is the number of false positives.
Dimensionality Reduction and Feature Selection
Suppose, as in the example in the “Unsupervised learning” section, that one wishes to apply a classifier to differentiate between two clinical populations on the basis of BOLD signal activity across many voxels during a task. How many voxels should be used as features? If every voxel in the brain is used, computation time may increase prohibitively. In addition, when the number of features greatly exceeds the number of data points in the training set, the performance of classification and regression algorithms will suffer and the model will become less interpretable (Hastie et al., 2001
).
It is usually the case that only a subset of voxels will actually provide useful information for classifying between populations. Reducing the set of all possible features to those of likely importance is a problem known as feature selection (Figure 1
B). Feature selection can be performed manually – for example, we may know based on previous studies or complementary functional and structural analyses that only a few particular anatomic regions are hypothesized to differ between the two clinical populations, and can therefore choose to include only voxels contained within those structures. There are also methods for automatic feature selection. Examples include (1) recursive feature elimination, which is based on iteratively eliminating features having smallest SVM weights (De Martino et al., 2008
); and (2) “sparse” methods, which are classification and regression algorithms that implicitly select a subset of all input features to use in the model (Grosenick et al., 2008
; Yamashita et al., 2008
; Carroll et al., 2009
). Automatic feature selection methods are also useful in revealing which aspects of the data are critical for a given classification problem.
Another approach for reducing the dimensionality of a dataset is to apply principal component analysis either in lieu of, or in conjunction with, feature selection methods. A data point in a high-dimensional feature space (e.g., the set of all voxels in a subject’s brain) is reduced to a smaller number of features, resulting from the projection of that data point onto a set of axes (principal components) that express the greatest directions of variability in the dataset.
“Brain Reading” with fMRI
Typical functional imaging studies compare brain activity during different experimental conditions to discover what brain regions are activated by particular tasks. In contrast, the classic application of MVPA to functional imaging data is for so-called “brain reading”, that is, using patterns of brain activity to perform a reverse inference and decide what subjects are looking at or thinking about (Cox and Savoy, 2003
).
This technique has grown in popularity, and has successfully been applied to a variety of paradigms, including discriminating between object categories (Haxby et al., 2001
; Carlson et al., 2003
; Hanson et al., 2004
), visually presented and attended stimuli (Kamitani and Tong, 2005
), remembered stimuli (Polyn et al., 2005
), intention to engage in a task (Haynes et al., 2007
), and deception (Davatzikos et al., 2005
).
As the field progresses, experimenters are designing tasks for which classifiers can shed new light on how information is represented in the brain. In the domain of object/concept representation, three recent studies have shown that by training classifiers to represent meaningful aspects of the stimuli (e.g., visual properties or semantic content), one can decode from a large set of novel images (Kay et al., 2008
), accurately reconstruct novel stimuli that subjects have never seen (Miyawaki et al., 2008
), and make quantitative predictions about what responses to novel stimuli should look like (Mitchell et al., 2008
).
By interrogating the patterns of activity that classifiers rely on to make inferences, we can gain information about which voxels in the brain are the most informative. Also, by applying classifiers trained in one domain to stimuli in a different domain, we can test hypotheses regarding the functional overlap of neural circuitry. For example, in a recent study Knops et al. (2009)
trained a classifier to discriminate between left and right saccades, based on posterior parietal activity during a spatial attention task. In order to test the hypothesis that mental arithmetic uses circuitry involved in spatial coding, the same classifier was used to decode addition or subtraction operations. Interestingly the classifier identified significantly more addition operations as rightward saccades, compared to subtraction, indicating that mental arithmetic engages spatial coding circuitry in the parietal cortex.
Several groups have applied MVPA to detect neural representations related to behavioral variability, taking advantage of the fact that MVPA can be sensitive to information coded by different sub-populations within a specific region. Li et al. (2009)
demonstrated that as subjects learn to categorize identical stimuli using different rules, patterns of neural activity in specific brain regions reflect the categorical decision, rather than the stimulus features. Raizada et al. (2009)
have also shown that in individuals with differential ability to discriminate/ra/and/la/phonemes (e.g., native English and Japanese speakers), the amount to which a subject distinguishes between two stimuli behaviorally is related to the statistical separability of activity patterns in auditory cortex. This approach may be useful for understanding behavioral differences in a wide range of paradigms, including understanding how behavioral impairments in children relate to differential stimulus coding in the brain.
Decoding subjective experience can also contribute to our understanding of functional differences in brain disorders. Yoon et al. (2008)
demonstrated that multivariate techniques may be more sensitive to differences between patients and controls by qualitatively comparing the performance of a neural-network classifier to a GLM-based analysis. They trained a classifier to distinguish between categories of visually presented objects during a 1-back memory task. Classification was significantly more accurate in controls compared to patients; however, the GLM did not show any significant differences between the groups. Note that in this study the classifier did not explicitly distinguish between patients and controls, but rather showed that spatial response patterns were less consistent in the patient group relative to controls.
Classifying Brain Disorders
Applying pattern classification to study clinical disorders is attractive for several reasons. One reason is that many brain disorders affect networks of brain regions, and therefore analysis techniques designed to extract distributed spatial patterns may be more sensitive than more traditional mass univariate techniques. Following similar reasoning, MVPA techniques applied to longitudinal data may be useful for extracting patterns of activity or structural abnormalities that are predictive of abnormal cognitive development. Finally, as many psychiatric disorders are diagnosed based on behavioral criteria, MVPA techniques may be useful for identifying endophenotypes associated with disease, and ultimately could be used for biologically based diagnoses.
Functional imaging
Clinical populations often show deficits on specific cognitive tasks, which may provide clues about the underlying etiology of the disease. For example, schizophrenia patients often show a significant difference in the amplitude of the event-related potential related to target detection (P300). Functional tasks, such as auditory target detection, may serve as good starting points for examining how distributed patterns of brain activity are different in patient populations. Studies using univariate analyses of this task have shown that schizophrenia patients show hypoactivition in several cortical and subcortical regions during target detection, relative to healthy controls (Kiehl et al., 2005
). Multivariate techniques have extended this work by identifying networks of regions that vary together, suggesting abnormal auditory and executive function networks in schizophrenia (Kim et al., 2009
).
MVPA techniques are proving useful for studying the neuropathology of AZ disease. Celone et al. (2006
) performed ICA on memory related fMRI activity in AZ and mild cognitive impairment (MCI) patients, as well as age-matched healthy controls. They found distributed networks involved in memory activity, including hippocampal activation accompanied by parietal deactivation, and moreover found a nonlinear trajectory in fMRI network activation across the continuum of impairment.
As in the above examples, functional data used for pattern classification may come from tasks in which different subject populations show known behavioral differences. Another approach is to use fMRI collected while subjects are at rest, not performing any explicit task. Resting state BOLD signal fluctuations are thought to reflect internalized thought processes, and have been shown to exhibit consistent patterns across individuals (Damoiseaux et al., 2006
). Multivariate techniques have been applied to resting state data to identify regions whose activity varies together over time. Many studies have examined differences in resting state data between patient populations and controls. Differences in the default mode have been identified in AZ (Greicius et al., 2004
; Wang et al., 2006
), depression (Greicius et al., 2007
), schizophrenia (Garrity et al., 2007
), and ADHD (Zhu et al., 2005
).
In pattern classification analyses, one can also combine data from more than one source. Calhoun et al. (2008)
trained a classifier to discriminate between schizophrenic and bipolar patients using both task-related and resting-state (default mode) activity. Bipolar and schizophrenic patients share overlapping symptoms, motivating the need for reliable brain-based classifiers for assisting in diagnosis. Given that the subjects identified as bipolar or schizophrenic in the study by Calhoun et al. (2008)
were triaged based on behavioral criteria, it would be interesting to see how unsupervised approaches would group the subjects, and whether the resulting patterns would resemble those resulting from the supervised classification of behaviorally labeled patient data. Unsupervised methods are designed to uncover structure present in the data without any user-provided labels, and in the future could be used to inform diagnostic criteria for disease (Hrdlicka et al., 2005
).
Structural imaging
Brain structure has been found to reflect life experience (Bengtsson et al., 2005
), correlate with personality traits (Cohen et al., 2009
), and relate to psychiatric diagnosis (Lawrie and Abukmeil, 1998
). Multivariate techniques are also relevant for analyses of structural data, as they may be more sensitive to distributed patterns of structural change.
Multivariate methods have identified supra-regional fronto-temporal abnormalities in schizophrenia (Wright et al., 1999
), in addition to global changes. MVPA has also shown high accuracy at diagnosing AZ disease, and in fact the spatial patterns were robust enough that a classifier trained on one scanner could accurately diagnose based on scans collected at another center (Kloppel et al., 2008
).
MVPA techniques may be a useful for predicting disease susceptibility and progression. Studies using pattern classification on AZ patients and MCI patients have found that some MCI patients show greater structural similarities to the AZ patients, while others were more similar to healthy controls (Fan et al., 2008a
; Misra et al., 2009
). Interestingly, similarities to the AZ group patterns were predictive of subsequent cognitive decline (Misra et al., 2009
), indicating that structural brain scans could play a role in treatment decisions.
The onset of psychosis is often preceded by what is referred to as an at risk mental state (ARMS), during which patients show the first symptoms of disorder. However, as symptoms are heterogeneous and not 100% predictive of future psychosis, the discovery of biological markers for disease onset would greatly help with early intervention. To this end, Koutsouleris et al. (2009)
trained a classifier to recognize structural scans belonging to healthy controls compared to ARMS patients. They then followed up with these patients 4 years later, and trained a second classifier on the original scan data, labeling the scans based on whether the patient did or did not transition to disease. They were able to distinguish with 82% accuracy those who would transition to disease based on abnormal structural patterns present before the onset of psychosis. This study could have important implications for deciding treatment course in individuals who present with ARMS, and suggests that other disorders may also benefit from similar research into functional or structural patterns in individuals at risk. In general, the ability to correlate patterns with future outcomes is very interesting, and can be facilitated by the assembly of longitudinal databases [e.g., ADNI
1
and the NIH Study of Normal Brain Development
2
].
Unsupervised learning techniques may also be a powerful method for defining subtypes within heterogeneous spectrum disorders such as autism. For example, Hrdlicka et al. (2005)
used a clustering algorithm on MRIs from 64 subjects with autism. In this study, experienced neuroradiologists manually traced brain structures on the MRI scans, such as the corpus callosum, amygdala, hippocampus and caudate. Surface areas for these structures, along with a measure of gray matter thickness, were entered into a hierarchical clustering algorithm. On the basis of this fairly course spatial information, they identified several clusters within the subjects that correlated with factors such as age of pregnancy and scores on the Childhood Autism Rating Scale (CARS) autism diagnostic tool. While all individuals in the study were diagnosed as “autistic” based on the CARS, individual symptoms and brain structure were nonetheless heterogeneous. This study provides hope that with finer spatial measures, and a larger sample size, some biologically based subtypes of autism may be identified.
Multimodal
MVPA does not require a model of the expected response, making it easy to combine data across modalities. For instance, Fan et al. (2008b)
combined functional PET data and anatomical MRI data from patients with MCI and healthy aging, demonstrating that very high classification rates can be achieved by combining information from different sources.
There is growing interest in using biomarkers from brain imaging to identify disease-relevant genes or patterns of genes. One method for interrogating genetic effects on functional brain activity is to group subjects based on a specific genetic polymorphism of interest. Tura et al. (2008)
examined schizophrenic patients with different genotypes for the dopamine receptor DRD1. They found that thought behavior did not differ between the groups, multivariate patterns of activity on a working memory task significantly differentiated between the genotypes.
Another method involves detecting covarying patterns across modalities. Liu et al. (2009)
used parallel ICA to uncover covarying patterns of activity in fMRI and genetic data. The authors identified a genetic component – an array of single nucleotide polymorphisms – that significantly correlated with a pattern of brain activity in schizophrenics. Hardoon et al. (2009)
applied a conceptually similar method, kernel correlation analysis, to show genetic influence on gray matter structure in healthy controls. This type of study may help the search for disease relevant genes, but results will need to be validated in larger populations.
Pediatric Populations
While most neuroimaging MVPA studies have involved young and older adults, MVPA techniques have several potential applications in pediatric developmental and clinical studies. Here we discuss possibilities and challenges for studies in pediatric populations.
Healthy development
An interesting application of MVPA for developmental studies is identifying functional and structural patterns that are predictive of development of cognitive skills, such as reading and mathematics. Hoeft et al. (2007)
used multiple regression to show that sMRI, fMRI and behavioral measures taken at the beginning of the school year could be combined to predict reading ability at the end of the school year, in 8- to 11-year-old poor readers, with greater accuracy than brain or behavioral data alone. Information from this type of study could be useful to inform educational practice (Meltzoff et al., 2009
).
There are many challenges specific to neuroimaging in pediatric populations (Berl et al., 2006
; Kotsoni et al., 2006
; O’Shaughnessy et al., 2008
). Children, compared to adults, are likely to exhibit more variability in both brain structure and activity. Individuals mature at different rates, and therefore a sample of children in a given age range will likely be more heterogeneous than a sample of healthy adults.
One model of brain development suggests that regional activations are more diffuse in childhood and become more focal with development (Durston et al., 2006
). However, there is increasing evidence suggesting that functional maturation may proceed differently in different brain regions, and a model of focalization with development is likely not sufficient to explain the full range of developmental changes (Blakemore and Choudhury, 2006
; Brown et al., 2006
; Durston and Casey, 2006
; Durston et al., 2006
). In fact, some evidence suggests that brain networks come to rely less on spatial proximity and more on functional importance, becoming less “local” and more “distributed” with development (Fair et al., 2009
). MVPA is agnostic with regard to models of development, and may be more sensitive to distributed patterns that differentiate adults and children.
Developmental disorders
A major focus in the study of developmental brain disorders is the early identification of individuals at risk (Koutsouleris et al., 2009
). Indeed, one of the NIMH strategic objectives is to “Chart mental illness trajectories to determine when, where, and how to intervene”
3
. Longitudinal studies, in which outcomes can be related to patterns of activation or structure, are one very promising application of this technique. As mentioned above, this technique is already beginning to be applied for predicting transition to disease in adult populations (Fan et al., 2008a
; Koutsouleris et al., 2009
).
While there are few studies using this technique in pediatric populations to date, Hoeft et al. (2008)
showed that fine structural features of the brain can be used to distinguish healthy children from patients with genetic disorders such as fragile X syndrome (FXS) with greater than 90% accuracy, even in children aged 1–3 years (Figure 3
). It is well known that individuals with FXS have enlarged caudates relative to the general population (Reiss et al., 1995
), suggesting that classifier performance could hinge on caudate volume alone. However, even when the caudate was removed from the training data, the classifier was still able to significantly distinguish FXS from both typically developing and developmentally delayed controls with an accuracy of ∼89%, implying that information about abnormal brain structure in this disorder is distributed in voxels throughout the brain.
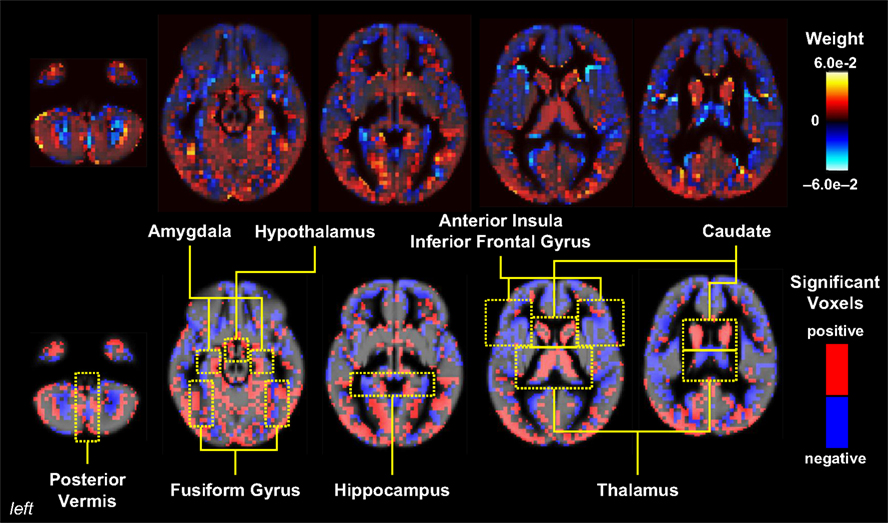
Figure 3. Pattern classification results for FXS versus TD/DD; classification rates above 90% were achieved in this analysis. Whole-brain representation of pattern classification results from FXS versus TD or DD using all gray matter voxels. Axial brain images of weight vectors from leave-one-out support vector machine analysis for all voxels (top) and spatial patterns of the most significant voxels when thresholded at P = 0.05 (according to 2000 permutations) (bottom) are shown. Reprinted with permission from Hoeft et al. (2008
). Copyright © 2008 American Medical Association. All rights reserved.
FXS is a genetically defined clinical group with a well characterized influence on brain development, which is strong enough to be uncovered using voxelwise analyses (Reiss et al., 1995
; Lee et al., 2007
; Hoeft et al., 2008
). However, MVPA methods may be most fruitful for studying patient groups with more subtle distributed pathology (Zhu et al., 2008
). In particular, we foresee interesting applications in (1) predicting the onset of brain disorders based on structural or functional patterns, (2) predicting individual response to treatment, and (3) identification of disease-relevant endophenotypes/biomarkers.
The challenges of neuroimaging in pediatric populations are well known (Berl et al., 2006
; Kotsoni et al., 2006
; O’Shaughnessy et al., 2008
). In this section we will discuss some of the challenges in applying MVPA to pediatric populations.
Motion
Subject motion makes brain imaging studies in pediatric clinical populations very difficult. Preprocessing can be used to mitigate this problem; however since motion affects the signal globally, task-correlated motion may have a strong impact on pattern classification techniques that draw power from integrating over many voxels. Therefore, special care should be taken to ensure that patterns are representative of neural, rather than motion-induced, changes in BOLD signal.
Registration with Standard Templates
Standard templates used to align MR images into a common space are built using adult brains (Talairach and Tournoux, 1988
). It has been found that the normalization procedure can cause significant distortions in brains of children 6 and under (Muzik et al., 2000
), while for older children this is less of an issue (Muzik et al., 2000
; Burgund et al., 2002
; Wilke et al., 2002
; Kang et al., 2003
). However, if similar distortions are applied to one group of subjects in a classifier, it may affect MVPA results. It is therefore worth taking precautions to ensure that classifiers are not relying on image distortion.
Other Limitations
With the relatively small sample sizes that are the norm in neuroimaging studies, overfitting is a concern, and results must be interpreted with caution. Before these methods can be deployed in a clinical setting, studies with larger cohorts must be undertaken (Koutsouleris et al., 2009
).
In addition, MVPA methods are not ideal for testing hypotheses regarding the involvement of a specific brain region in a given task. The results of an MVPA analysis can tell you only the relative amount of information given by a particular voxel. Moreover, patterns of weights are likely to be more difficult to interpret than a significant result at a specified region of interest.
MVPA is useful for answering questions about functional and structural organization in the brain, and can have greater sensitivity and descriptive power than mass univariate methods. While MVPA techniques have yet to be widely adopted in pediatric neuroimaging, we expect to see applications in several domains in coming years. These include both predicting normal cognitive development and detecting patterns related to brain disorders that may be used for diagnosis or treatment.
While MVPA methods are attractive in a variety of situations, they are likely not appropriate to answer any and all questions about brain function. In particular, because MVPA does not explicitly model the shape of the neural response, univariate GLM models may be more appropriate for testing whether fMRI time courses correlate with specific signals of interest, (e.g., prediction error signals in reward learning or other model derived phasic signals O’Doherty et al., 2003
), or for testing for responses within a particular region that vary in a graded manner with task parameters.
It is also worth noting that pattern classification is a research field in and of itself, and methods are continually being improved. Therefore, not every tool should be expected to provide great results “straight out of the box”, and a good understanding of analysis methods is always important for interpreting the results.
MVPA is a promising tool for neuroimaging of brain development, with potential to yield novel insights into both healthy brain development and the pathology of developmental brain disorders. While these methods are still relatively new, the rapid acceleration of applications in both structural and functional neuroimaging indicates that MVPA is poised to become a standard analysis tool that can complement GLM-based analyses (e.g., Dux et al., 2009
).
The authors declare that the research was conducted in the absence of any commercial or financial relationships that could be construed as a potential conflict of interest.
We would like to acknowledge the helpful advice from two reviewers. This work was funded by a NARSAD Young Investigator Award. FH is funded by a NARSAD Young Investigator Award, the Child Health Research Program from the Stanford University School of Medicine and NICHD HD054720.
Bergstrand, S., Bjornsdotter Aberg, M., Niiniskorpi, T., and Wessberg, J. (2009). Towards unified analysis of EEG and fMRI: a comparison of classifiers for single-trial pattern recognition. In Proceedings of the Second International Conference on Bio-inspired Systems and Signal Processing, P. Encarnação and A. Veloso, eds (Porto, Institute for Systems and Technologies of Information, Control and Communication), pp. 273–278.
Casey, B. J., Trainor, R. J., Orendi, J. L., Schubert, A. B., Nystrom, L. E., Giedd, J. N., Castellanos, F. X., Haxby, J. V., Noll, D. C., Cohen, J. D., Forman, S. D., Dahl, R. E., and Rapoport, J. L. (1997). A developmental functional MRI study of prefrontal activation during performance of a Go–No-Go task. J. Cogn. Neurosci. 9, 835–847.
Celone, K. A., Calhoun, V. D., Dickerson, B. C., Atri, A., Chua, E. F., Miller, S. L., DePeau, K., Rentz, D. M., Selkoe, D.J., Blacker, D., Albert, M. S., and Sperling, R. A. (2006). Alterations in memory networks in mild cognitive impairment and Alzheimer’s disease: an independent component analysis. J. Neurosci. 26, 10222–10231.
Gogtay, N., Giedd, J. N., Lusk, L., Hayashi, K. M., Greenstein, D., Vaituzis, A. C., Nugent, T. F., Herman, D. H., Clasen, L. S., Toga, A. W., Rapoport, J. L., and Thompson, P. M. (2004). Dynamic mapping of human cortical development during childhood through early adulthood. Proc. Natl. Acad. Sci. U.S.A. 101, 8174–8179.
Hoeft, F., Ueno, T., Reiss, A. L., Meyler, A., Whitfield-Gabrieli, S., Glover, G. H., Keller, T. A., Kobayashi, N., Mazaika, P., Jo, B., Just, M. A., and Gabrieli, J. D. E. (2007). Prediction of children’s reading skills using behavioral, functional, and structural neuroimaging measures. Behav. Neurosci. 121, 602–613.
Kim, D. I., Mathalon, D. H., Ford, J. M., Mannell, M., Turner, J. A., Brown, G. G., Belger, A., Gollub, R., Lauriello, J., Wible, C., O’Leary, D., Lim, K., Toga, A., Potkin, S. G., Birn, F., and Calhoun, V. D. (2009). Auditory oddball deficits in schizophrenia: an inde pendent component analysis of the fMRI multisite function BIRN study. Schizophr. Bull. 35, 67–81.
Kloppel, S., Stonnington, C. M., Barnes, J., Chen, F., Chu, C., Good, C. D., Mader, I., Mitchell, L. A., Patel, A. C., Roberts, C. C., Fox, N. C., Jack, C. R., Ashburner, J., and Frackowiak, R. S. J. (2008). Accuracy of dementia diagnosis – a direct comparison between radiologists and a computerized method. Brain 131, 2969–2974.
Koutsouleris, N., Meisenzahl, E. M., Davatzikos, C., Bottlender, R., Frodl, T., Scheuerecker, J., Schmitt, G., Zetzsche, T., Decker, P., Reiser, M., Moller, H.-J., and Gaser, C. (2009). Use of neuroanatomical pattern classification to identify subjects in at-risk mental states of psychosis and predict disease transition. Arch. Gen. Psychiatry 66, 700–712.
Smith, S. M., Jenkinson, M., Woolrich, M. W., Beckmann, C. F., Behrens, T. E., Johansen-Berg, H., Bannister, P. R., De Luca, M., Drobnjak, I., Flitney, D. E., Niazy, R. K., Saunders, J., Vickers, J., Zhang, Y., De Stefano, N., Brady, J. M., and Matthews, P. M. (2004). Advances in functional and structural MR image analysis and implementation as FSL. Neuroimage 23(Suppl. 1), S208–S219.
Wang, K., Jiang, T. Z., Liang, M., Wang, L., Tian, L. X., Zhang, X. Q., Li, K. C., and Liu, Z. N. (2006). Discriminative analysis of early Alzheimer’s disease based on two intrinsically anti-correlated networks with resting-state fMRI. In Medical Image Computing and Computer-Assisted Intervention – MICCAI 2006. R. Larsen, M. Nielsen and J. Sporring, eds (Berlin, Springer-Verlag), pp. 340–347.
Zhang, L., Samaras, D., Tomasi, D., Alia-Klein, N., Cottone, L., Leskovjan, A., Volkow, N., and Goldstein, R. (2005). Exploiting temporal information in functional magnetic resonance imaging brain data. Med. Image Comput. Comput. Assist. Interv. Int. Conf. Med. Image Comput. Comput. Assist. Interv. 8, 679–687.
Zhu, C. Z., Zang, Y. F., Liang, M., Tian, L. X., He, Y., Li, X. B., Sui, M. Q., Wang, Y. F., and Jiang, T. Z. (2005). Discriminative analysis of brain function at resting-state for attention-deficit/hyperactivity disorder. Med. Image Comput. Comput. Assist. Interv. Int. Conf. Med. Image Comput. Comput. Assist. Interv. 8, 468–475.