1
Bernstein Center for Computational Neuroscience Göttingen, University of Göttingen, Göttingen, Germany
2
Department for Integrative Neurophysiology, Neuroscience Campus Amsterdam, VU Universiteit Amsterdam, Amsterdam, Netherlands
It is still unclear to what extent structural plasticity in terms of synaptic rewiring is the cause for cortical remapping after a lesion. Recent two-photon laser imaging studies demonstrate that synaptic rewiring is persistent in the adult brain and is dramatically increased following brain lesions or after a loss of sensory input (cortical deafferentation). We use a recurrent neural network model to study the time course of synaptic rewiring following a peripheral lesion. For this, we represent axonal and dendritic elements of cortical neurons to model synapse formation, pruning and synaptic rewiring. Neurons increase and decrease the number of axonal and dendritic elements in an activity-dependent fashion in order to maintain their activity in a homeostatic equilibrium. In this study we demonstrate that synaptic rewiring contributes to neuronal homeostasis during normal development as well as following lesions. We show that networks in homeostasis, which can therefore be considered as adult networks, are much less able to compensate for a loss of input. Interestingly, we found that paused stimulation of the networks are much more effective promoting reorganization than continuous stimulation. This can be explained as neurons quickly adapt to this stimulation whereas pauses prevents a saturation of the positive stimulation effect. These findings may suggest strategies for improving therapies in neurologic rehabilitation.
The theoretical standard model for developing cortical representations are self-organizing maps (SOMs, Kohonen, 1982
). SOMs were also used to model lesion-induced remapping of the visual cortex after circumscribed retinal lesions (Kohonen, 2006
; Xing and Gerstein, 1996a
,b
,c
; Young et al., 2007
). Recently, Kaiser simulated large cortico-cortical networks and analysed their robustness against lesions (Kaiser et al., 2007
). Still, it is necessary to model the biological mechanisms that change connectivity after a lesion. These mechanisms are the formation of synapses due to axonal sprouting and spinogenesis as well as the loss of synapses by remodelling axonal terminals, varicosities and dendritic spines. An important driving force for network rewiring – as a main principle – is the need of every neuron to keep its firing rate within a functional, homeostatic range (Turrigiano, 1999
; Wolff and Wagner, 1983
; Wolff et al., 1989
). The first models for a homeostatic structural network formation were independently proposed by Dammasch et al. (1986
, 1988) and van Ooyen (van Ooyen and van Pelt, 1994
; van Ooyen et al., 1995
). We joined the concepts of these two models to create a novel neural network model for activity-dependent structural plasticity. Early versions of this model used continuous representations of pre- and postsynaptic densities (Butz and Teuchert-Noodt, 2006
; Butz et al., 2006
). The novelty of the present model is the discrete representation of individual axonal and dendritic elements that develop in an activity-dependent fashion. Synapses form by merging axonal and dendritic elements. Moreover, splitting and recombining synaptic elements is possible and allows for modelling synaptic rewiring. By forming, deleting and reorganizing synaptic elements, neurons reach a homeostatic level of activity. We applied our modelling approach to lesion-induced plasticity in the prefrontal cortex after juvenile trauma in gerbils (Butz and Teuchert-Noodt, 2006
) and more recently to synaptic rewiring associated with adult hippocampal neurogenesis (Butz et al., 2008
). In the present study, we model synaptic rewiring in the cortical lesion projection zone (LPZ) after peripheral somatosensory (Merzenich et al., 1983
, 1984
) or focal retinal lesion (Keck et al., 2008
). As we show here, the model is capable of reproducing the experimental data namely axonal sprouting from neurons bordering the LPZ (Darian-Smith and Gilbert, 1994, 1995
) and re-innervating deafferented neurons. In addition, the LPZ in experiment as well as the model shows an increased amount of instable spines (Trachtenberg et al., 2002
). Using this model, we analysed different time courses of network reorganization. To this end, we define different starting conditions, such as homeostatically equilibrated networks representing mature cortical networks and non-equilibrated networks for a juvenile situation. Furthermore, we apply different external stimulation patterns onto reorganizing networks to predict the impact of stimulations, i.e. by physical training or pharmacological treatment during rehabilitation of neurological patients.
Structural plasticity beyond mere synaptic plasticity (LTP/LTD) is present not only during development but also in the mature brain (reviewed in Butz et al., 2009
). Axonal terminals (Darian-Smith and Gilbert, 1994
; DePaola et al., 2006
) and dendritic spines (Fischer et al., 2000
; Nägerl et al., 2004
; Trachtenberg et al., 2002
) are highly motile structures that respond to long-term shifts in neuronal activity, causing them to grow out or to retract. Individual spines and axons can merge to form functioning synapses (Knott et al., 2006
; Toni et al., 2007
) that, in turn, are stabilized by LTP and weakened by LTD (Engert and Bonhoeffer 1999
; Yuste and Bonhoeffer, 2001
). Weakened synapses can split apart again, whereby axonal and dendritic elements may undergo turnover (DePaola et al., 2006
; Trachtenberg et al., 2002
). Especially within cortical columns with densely packed axonal and dendritic branches, synaptic turnover among close-by axonal and dendritic specializations – so called ‘potential synapses’ (Stepanyants et al., 2002
) – adds a high degree of freedom to reorganizing neural networks (Chklovskii et al., 2004
) and likely affect neural information processing and memory formation (Mel, 2002
; Poirazi and Mel, 2001
). Whereas activity promotes axonal outgrowth, the postsynaptic interface is adapted in a homeostatic manner (Turrigiano, 2007
; Turrigiano and Nelson, 2000
; Turrigiano et al., 1994
) to balance postsynaptic firing rates. Structural changes not only affect the cellular level but they also contribute to reorganizations on the cortical network level (Kilgard et al., 2002
; Kind et al., 2002
). However, as there remains a gap between experimental methods observing plastic connectivity of cell assemblies on the one side and anatomical maps and circuits on the other, it is still unclear to what extent structural plasticity affects anatomical map reorganization (Calford, 2002
; Smirnakis et al., 2005
). Nevertheless, there is ample evidence that cortical maps are shaped in an activity-dependent fashion during development (Hensch, 2005
; Mrsic-Flogel et al., 2007
), following a lesion (Darian-Smith and Gilbert, 1995
; Giannikopoulos and Eysel, 2006
; Merzenich et al., 1984
) and due to extensive training (Bangert and Altenmüller, 2003
; Kleim et al., 2002
, 2004
, 2007
).
We use a recurrent one-dimensional neural network with a ring topology. The network contains a total number of N simple spiking neurons (Butz et al., 2008
). NE of them are excitatory and N – NE are inhibitory. For all simulations of this study, we used N = 100 neurons. According to the cortical situation, the ratio of excitatory and inhibitory neurons is 80 to 20%. By indexing each neuron, we obtain a spatially linear ordering. Every NE/(N – NE) position we put one inhibitory neuron in between groups of excitatory neurons. For reasons of a better assessment and visualization, however, we subsequently sort excitatory and inhibitory neurons without changing the synaptic topology arising from the previously described spatial arrangement so that after sorting, the first NE neurons are all excitatory and the last N – NE neurons are all inhibitory. As neurons are interconnected by unidirectional binary synapses, we obtain a connectivity matrix C with positive discrete values C(i,j) = cij, (see Eq. 5 for the definition of inhibition) that can be subdivided in four clusters for the four possible synaptic combinations of excitatory and in inhibitory neurons:
A synapse consists of two parts, namely an axonal element (which can be an axonal terminal or varicosity), and a dendritic element (which can be a dendritic spine or any postsynaptic receptor plate on dendrites or soma) (Arellano et al., 2007
; Fiala et al., 1998
; Knott et al., 2006
; Petrak et al., 2005
; Wolff and Wagner, 1983
; Ziv and Smith, 1996
). In general, we refer to axonal and dendritic elements as synaptic elements. Depending on the type of the hosting neuron, all (axonal) presynaptic elements Ai of any neuron i are either excitatory for 1 ≤ i ≤ NE or inhibitory for NE + 1 ≤ i ≤ N. However, on the dendritic site, each neuron i with 1 ≤ i ≤ N can have a number of excitatory  and inhibitory postsynaptic dendritic elements
  . Synaptic elements can be bound in a synapse or vacant (i.e. available for synapse formation). A new excitatory synapse forms when a vacant excitatory axonal element merges with a vacant excitatory dendritic element. Accordingly, a new inhibitory synapse forms when a vacant inhibitory axonal and a vacant inhibitory dendritic element merge. Depending on the spatial distance between two neurons, the probability for synapse formation Pform follows a Gaussian distribution:
and inhibitory postsynaptic dendritic elements . Synaptic elements can be bound in a synapse or vacant (i.e. available for synapse formation). A new excitatory synapse forms when a vacant excitatory axonal element merges with a vacant excitatory dendritic element. Accordingly, a new inhibitory synapse forms when a vacant inhibitory axonal and a vacant inhibitory dendritic element merge. Depending on the spatial distance between two neurons, the probability for synapse formation Pform follows a Gaussian distribution:
We set  for j = i which prevents direct recurrent synapses indicated by zero entries along the main diagonal of the connectivity matrix C. A distant-dependent declining probability for synapse formation implicitly models a growth process as synapses between neighbouring neurons are more likely to be formed then between distant neurons. As cortical excitatory neurons in general have more extended axonal trees than local inhibitory interneurons, we chose σi = 100 for excitatory neurons (1 ≤ i ≤ NE) and σi = 25 for inhibitory neurons (NE + 1 ≤ i ≤ N). This kernel gives rise to an initial connectivity as shown in Figure 2
A. In total, on average each neuron receives up to 2000 synapses. This initial connectivity models a transient state during network development where the gross morphology of the network is present already; the single neuron, however, has not balanced its activity to a homeostatic level yet. Independent of starting conditions though, the amounts of excitatory and inhibitory synapses equilibrate when the network reaches homeostasis.
for j = i which prevents direct recurrent synapses indicated by zero entries along the main diagonal of the connectivity matrix C. A distant-dependent declining probability for synapse formation implicitly models a growth process as synapses between neighbouring neurons are more likely to be formed then between distant neurons. As cortical excitatory neurons in general have more extended axonal trees than local inhibitory interneurons, we chose σi = 100 for excitatory neurons (1 ≤ i ≤ NE) and σi = 25 for inhibitory neurons (NE + 1 ≤ i ≤ N). This kernel gives rise to an initial connectivity as shown in Figure 2
A. In total, on average each neuron receives up to 2000 synapses. This initial connectivity models a transient state during network development where the gross morphology of the network is present already; the single neuron, however, has not balanced its activity to a homeostatic level yet. Independent of starting conditions though, the amounts of excitatory and inhibitory synapses equilibrate when the network reaches homeostasis.In order to model changes in network connectivity depending on the bioelectrical activity of neurons, we introduce two time scales: On a short, functional time scale (referred to by t) we regard connectivity constant and neuronal activity changes. On a larger, morphogenetic time scale (referred to by T), changes in mean activity drive changes in connectivity until all neurons have reached a homeostatic equilibrium. Therefore, the algorithm proceeds in three steps:
1. Update in neuronal activity
The firing probability of a neuron i depending on the neuron’s synaptic input Xi is updated in each functional time step t by using a standard sigmoidal function:
where θ defines the firing threshold and β the steepness of the sigmoid and thereby the noise level of the neuronal firing. The neuron fires in one time step t if its firing probability Fi is greater than a uniformly distributed random number ri:
The firing of an excitatory presynaptic neuron j (1 ≤ j ≤ NE) increases the postsynaptic input Xi and the firing probability Fi of all postsynaptic neurons i (1 ≤ i ≤ N), respectively, and an inhibitory presynaptic neuron j (NE + 1 ≤ j ≤ N) decreases them.
Each neuron receives intrinsic and external input  The intrinsic input is generated within the network as the sum over all active presynaptic neurons j (1 ≤ j ≤ N) times the total number of (binary) synapses ci,j from neuron j to i. It turns out that a condition for neuronal activity homeostasis is that each neuron is going to receive as many excitatory as inhibitory synapses. With a physiological ratio of 80% excitatory to 20% inhibitory neurons, this finding implicates that at equilibrium each neuron will receive NE/(N – NE) = 4 times more outgoing inhibitory synapses per inhibitory neuron than outgoing synapses per excitatory neuron. Interestingly, such a ratio is found in cortical connectivity, too (compare Stepanyants et al., 2009
). Therefore, we define ϕ = NE/(N – NE). Consequently, networks used here initially have an equilibrated network activity on average but the individual neuron may still deviate considerably from a homeostatic level of activity.
The intrinsic input is generated within the network as the sum over all active presynaptic neurons j (1 ≤ j ≤ N) times the total number of (binary) synapses ci,j from neuron j to i. It turns out that a condition for neuronal activity homeostasis is that each neuron is going to receive as many excitatory as inhibitory synapses. With a physiological ratio of 80% excitatory to 20% inhibitory neurons, this finding implicates that at equilibrium each neuron will receive NE/(N – NE) = 4 times more outgoing inhibitory synapses per inhibitory neuron than outgoing synapses per excitatory neuron. Interestingly, such a ratio is found in cortical connectivity, too (compare Stepanyants et al., 2009
). Therefore, we define ϕ = NE/(N – NE). Consequently, networks used here initially have an equilibrated network activity on average but the individual neuron may still deviate considerably from a homeostatic level of activity.Extrinsic input  models thalamic (or other subcortical) afferences carrying sensory input to cortical neurons. Normal input is provided to each neuron in the form of a random Poisson-generated spike train.
models thalamic (or other subcortical) afferences carrying sensory input to cortical neurons. Normal input is provided to each neuron in the form of a random Poisson-generated spike train.2. Updating the number of axonal and dendritic elements and synapse deletion
As we extensively reviewed in Butz et al. (2009)
, neuronal activity by changing intra-cellular calcium concentration has considerable impact on neuronal morphology (Mattson et al., 1988
; Wolff and Wagner, 1983
; reviewed in Lipton and Kater, 1989
; Mattson, 1988
): On the postsynaptic side, neurons adapt their input connectivity in a homeostatic manner – not only with respect to changes in synaptic weight (Turrigiano et al., 1998
) but they also increase and decrease the number of excitatory (Kirov et al., 2004
) and inhibitory spines (Knott et al., 2002
). In our model, changes in mean activity drive changes in the number of synaptic elements. We therefore use a sliding average of the firing probability  over the last 1000 functional time steps. The actual value of the desired moderate firing probability is not critical as networks also converge against different values. As we are not modelling the specific bioelectrical properties of cortical neurons and specific cell types, 0.5 is the most general assumption for a moderate firing rate that a model neuron would strive towards. Every 100 functional time steps we do an update in connectivity (morphogenetic time step). In each morphogenetic time step T, the deviation from the desired value
  induces changes in the number of excitatory and inhibitory dendritic elements denoted by
  and
and  , respectively, for all neurons i (1 ≤ i ≤ N). If
  is too high, neurons will decrease the number of excitatory postsynaptic elements
  in order to loose excitatory synapses and, at the same time, will increase the number of inhibitory postsynaptic elements
  to have a higher chance to obtain more inhibition. Neurons with a low
  will instead increase
  and decrease
  according to Eqs. 6 and 7:
over the last 1000 functional time steps. The actual value of the desired moderate firing probability is not critical as networks also converge against different values. As we are not modelling the specific bioelectrical properties of cortical neurons and specific cell types, 0.5 is the most general assumption for a moderate firing rate that a model neuron would strive towards. Every 100 functional time steps we do an update in connectivity (morphogenetic time step). In each morphogenetic time step T, the deviation from the desired value induces changes in the number of excitatory and inhibitory dendritic elements denoted by and , respectively, for all neurons i (1 ≤ i ≤ N). If is too high, neurons will decrease the number of excitatory postsynaptic elements in order to loose excitatory synapses and, at the same time, will increase the number of inhibitory postsynaptic elements to have a higher chance to obtain more inhibition. Neurons with a low will instead increase and decrease according to Eqs. 6 and 7:
On the presynaptic side, activity promotes axonal outgrowth (reviewed in Rekart et al., 2007
; Wolff and Missler, 1992
). In our model, changes in the number of axonal elements ΔAi for excitatory and inhibitory neurons (1 ≤ i ≤ N) are thus activity-dependent by the following rule:

In Eqs. 6–8, the speed of morphogenesis is determined by a parameter ν that defines the sensitivity of a neuron to respond with morphogenetic changes to alterations in its average activity.
In each morphogenetic step T, we change  ,
,  and Ai by
  ,
,  and ΔAi for all neurons i (1 ≤ i ≤ N), respectively. If a certain number of synaptic elements, for example
  , the dendritic excitatory elements from neuron i, are to be deleted, we select them randomly from the total number of dendritic excitatory elements
  of this neuron. Vacant synaptic elements are immediately lost if chosen for deletion. However, we define that bound synapses have gained stability (i.e. by long-term potentiation) and, therefore, deletion of synapses has a lower probability than synapse formation. We define for all neurons:
, and Ai by , and ΔAi for all neurons i (1 ≤ i ≤ N), respectively. If a certain number of synaptic elements, for example , the dendritic excitatory elements from neuron i, are to be deleted, we select them randomly from the total number of dendritic excitatory elements of this neuron. Vacant synaptic elements are immediately lost if chosen for deletion. However, we define that bound synapses have gained stability (i.e. by long-term potentiation) and, therefore, deletion of synapses has a lower probability than synapse formation. We define for all neurons:
If a random number from a uniform distribution is lower or equal to  the synapse is unstable. In this case, the synaptic junction of axonal and dendritic element breaks apart and the axonal or dendritic element to be deleted is eliminated. The vacant synaptic element, however, remains and becomes available for synapse formation again (see below). The number of synapses ci,j ≥ 0 between neuron j and i is reduced by one for each synapse that gets deleted. After changing the number of axonal and dendritic elements, the total number of bound as well as vacant synaptic elements is updated.
the synapse is unstable. In this case, the synaptic junction of axonal and dendritic element breaks apart and the axonal or dendritic element to be deleted is eliminated. The vacant synaptic element, however, remains and becomes available for synapse formation again (see below). The number of synapses ci,j ≥ 0 between neuron j and i is reduced by one for each synapse that gets deleted. After changing the number of axonal and dendritic elements, the total number of bound as well as vacant synaptic elements is updated.3. Synapse formation
In order to form new synapses, vacant axonal elements randomly select a vacant dendritic element. For this, we firstly distribute all axonal elements of the excitatory neurons j with 1 ≤ j ≤ NE onto the excitatory dendritic elements of all neurons i with 1 ≤ i ≤ N. Those synaptic elements which do not fit a target are left over. Depending on the distance between the presynaptic neuron j and the postsynaptic neuron i, a new excitatory synapse is formed with probability  . As
. As  is defined to be 0 for i = j, axonal and dendritic elements of the same neuron will not form synapses. If a random number is smaller or equal
  the synapse is formed which increases the connectivity ci,j (1 ≤ i ≤ N and 1 ≤ j ≤ NE) by 1. Multiple synapses can co-exist between two neurons. In case a potential synapse is not formed, both synaptic elements remain vacant and potentially undergo synapse formation later. Secondly, inhibitory synapses are formed among vacant axonal elements of inhibitory neurons j with 1 + NE ≤ j ≤ N and inhibitory dendritic elements of all neurons i with 1 ≤ i ≤ N, accordingly. After synapse formation, we update the number of vacant synaptic elements. The total number of synaptic elements, however, does not change by synapse formation.
. As is defined to be 0 for i = j, axonal and dendritic elements of the same neuron will not form synapses. If a random number is smaller or equal the synapse is formed which increases the connectivity ci,j (1 ≤ i ≤ N and 1 ≤ j ≤ NE) by 1. Multiple synapses can co-exist between two neurons. In case a potential synapse is not formed, both synaptic elements remain vacant and potentially undergo synapse formation later. Secondly, inhibitory synapses are formed among vacant axonal elements of inhibitory neurons j with 1 + NE ≤ j ≤ N and inhibitory dendritic elements of all neurons i with 1 ≤ i ≤ N, accordingly. After synapse formation, we update the number of vacant synaptic elements. The total number of synaptic elements, however, does not change by synapse formation.For the next morphogenetic step, the algorithm continues with step 1 (update in neuronal activity).
Deafferentation and stimulation
We assume that the thalamic input is the main excitatory drive for neurons in primary sensory cortices. Due to a peripheral somatic or retinal lesion, a somatotopic subset of cortical neurons loose their inputs – we refer to these neurons as LPZ. In the model, we reduced the activity of the neurons inside the LPZ to resting levels and subsequently observed how these neurons regain homeostasis by forming additional synapses with neurons outside the LPZ. It turned out that the time to recover depends on the size of the lesion but also on the age of the network (Figure 1
). Whereas juvenile networks spontaneously reorganize and fully compensate for the loss of input, adult networks (T > 1000) are less plastic and not able to compensate for lesion sizes larger than 15 neurons. Thus, we set lesions of a larger size (21 neurons, 16 excitatory and 5 inhibitory) in adult networks (T = 1000) and investigate how to enhance their plastic capacities in order to make them compensate for the lesion though. For this, we applied external stimulations to those neurons with intact input. The stimulation was summed to the external input  and used to be much stronger than random input. Here we use It = 100 which is less than 1% of the synaptic input of the neuron. We used different protocols for stimulating lesioned networks. That is, stimulation was either provided continuously after the lesion or interrupted by pauses during which the neuron only receives the random external input. As continuous stimulation is less effective for synapse formation and network reorganization, we tested different combinations of stimulation and pause times for their effectiveness.
and used to be much stronger than random input. Here we use It = 100 which is less than 1% of the synaptic input of the neuron. We used different protocols for stimulating lesioned networks. That is, stimulation was either provided continuously after the lesion or interrupted by pauses during which the neuron only receives the random external input. As continuous stimulation is less effective for synapse formation and network reorganization, we tested different combinations of stimulation and pause times for their effectiveness.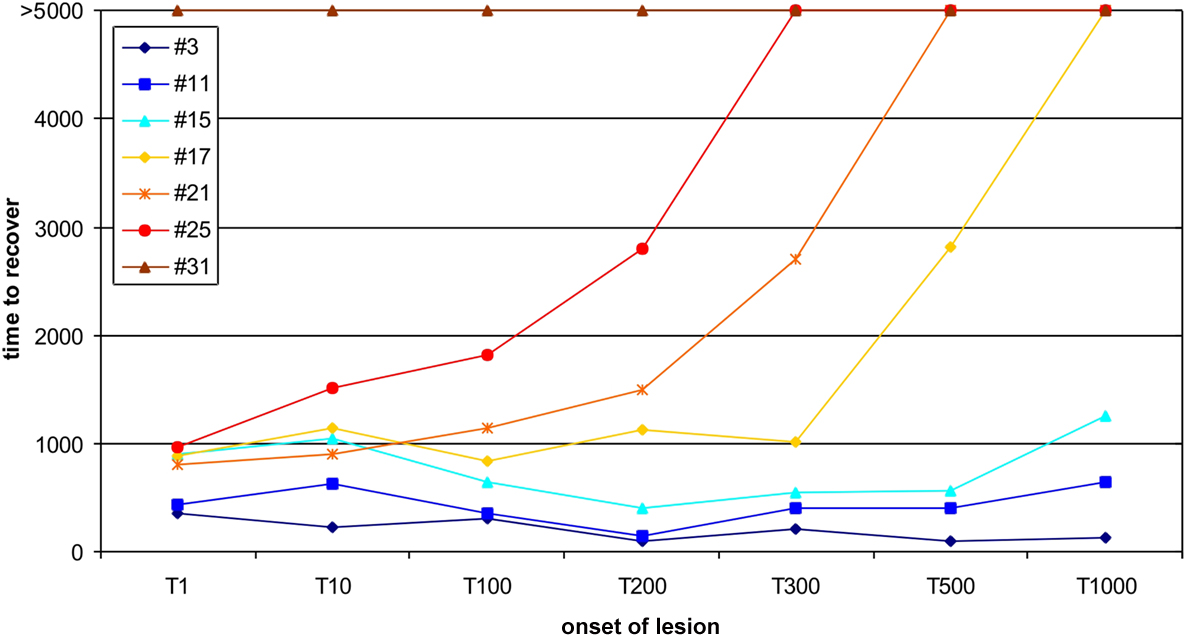
Figure 1. Age-dependent recovery. Here, the ‘recovery’ time, until all neurons are in a homeostatic regime again, is shown for different onsets of the lesion from 1 (1T) to 1000 morphogenetic time steps (1000T). Different sizes of the lesion (3, 11, 15, 17, 21, 25 and 31 neurons) were tested for the impact of the lesion size on the recovery time. Lesions larger than 15 neurons show an exponential increase in recovery time for later onsets. Stable networks do not completely compensate for lesions of that size within the maximum simulation time of 5000 morphogenetic time steps. Lesions equal or larger than 31 neurons are not fully compensated spontaneously independent of when the lesion sets in.
Small Changes for Homeostatic Equilibrium
To achieve homeostasis during normal development – which means that the average firing rate  converges to a homeostatic equilibrium for all neurons i (1 ≤ i ≤ N) – relatively small changes in connectivity are sufficient. We start with an initial connectivity (Figure 2
A) that may arise from an early activity-independent growth process (not shown). We find that a predefined columnized connectivity is essentially maintained (Figures 2
B,C) because changes in connectivity are rather local (Figure 2
C) which is an important physiological precondition of the model. The course of synapse numbers per neuron over time shows that there is only little change in synapse numbers compared with the initial and homeostatic connectivity (Figure 2
D). Therefore, the network development towards activity homeostasis is predominantly a rewiring of connections. Following the course of activity in the network (Figure 2
E) existing synapses are either pruned or new synapses are formed. Synapses can only be formed if both vacant axonal and dendritic synaptic elements are available. Although there is always a surplus of axonal synaptic elements (Figure 2
F), vacant dendritic elements are available only in a limited time window during development (‘critical period’) indicating the neurons’ demand for input in order to achieve homeostasis. When all dendritic elements become bound to axonal elements the network turns into homeostasis.
converges to a homeostatic equilibrium for all neurons i (1 ≤ i ≤ N) – relatively small changes in connectivity are sufficient. We start with an initial connectivity (Figure 2
A) that may arise from an early activity-independent growth process (not shown). We find that a predefined columnized connectivity is essentially maintained (Figures 2
B,C) because changes in connectivity are rather local (Figure 2
C) which is an important physiological precondition of the model. The course of synapse numbers per neuron over time shows that there is only little change in synapse numbers compared with the initial and homeostatic connectivity (Figure 2
D). Therefore, the network development towards activity homeostasis is predominantly a rewiring of connections. Following the course of activity in the network (Figure 2
E) existing synapses are either pruned or new synapses are formed. Synapses can only be formed if both vacant axonal and dendritic synaptic elements are available. Although there is always a surplus of axonal synaptic elements (Figure 2
F), vacant dendritic elements are available only in a limited time window during development (‘critical period’) indicating the neurons’ demand for input in order to achieve homeostasis. When all dendritic elements become bound to axonal elements the network turns into homeostasis.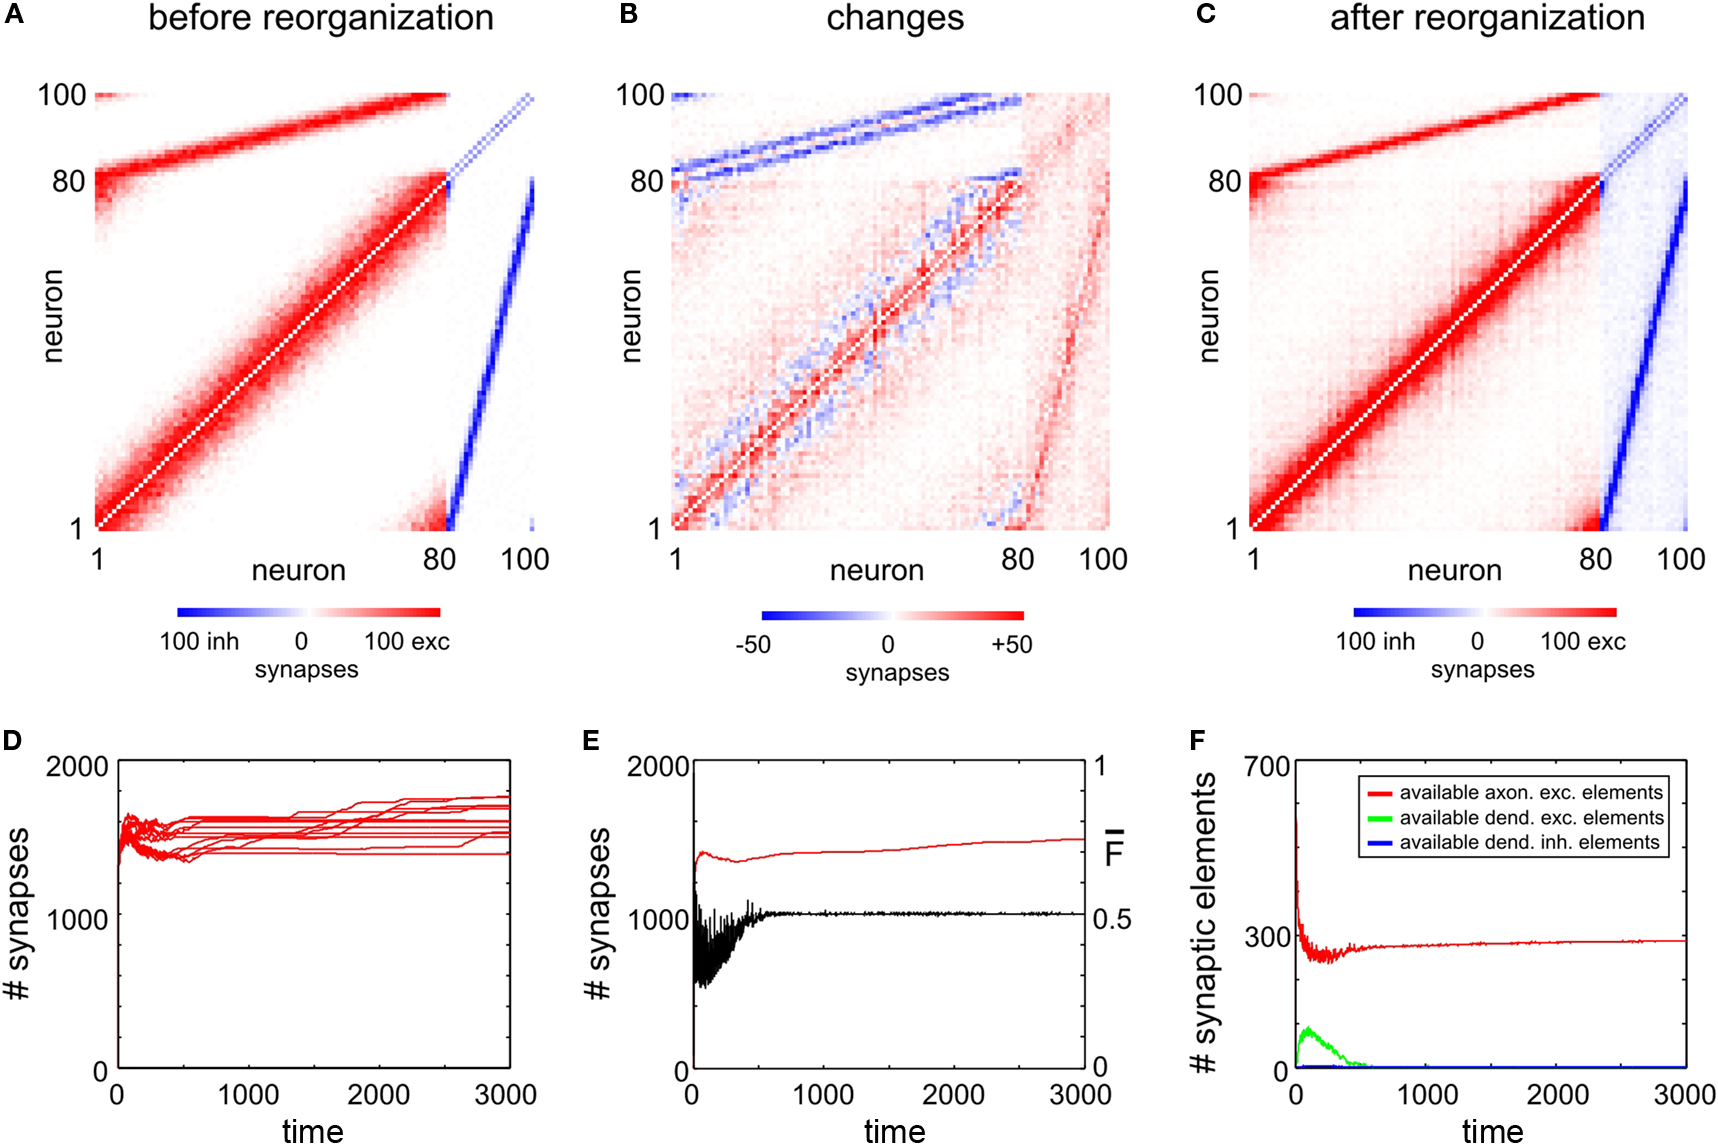
Figure 2. Juvenile development. The three panels (A–C) show the network connectivity before (A) and after reorganization (C) as well as the absolute change in connectivity (B). The colour coding of each square (see colour bars below panels) indicates the number of binary synapses from neuron j (column) to neuron i (row) (A,C) or the change in synapses numbers (B), respectively. (D) Shows the time course of excitatory synapse numbers per neuron for 12 individual simulations. (E) Shows the course of mean firing probability (black curve) and mean (excitatory) synapse numbers (red curve) averaged over the simulations in (D). (F) Shows the mean amount of vacant synaptic elements over time averaged over the simulations in (D).
Juvenile Networks Show Spontaneous Compensation for Lesions
Neurons that lost their external input rely on the formation of additional input synapses with neurons outside the LPZ to rebalance their activity levels again. Therefore, we have assessed how many synapses on neurons inside and outside the LPZ were formed. It turned out that there is a substantial increase in synapses onto neurons within the LPZ in response to the lesion (Figure 3
A). Outside the LPZ, neurons overall got fewer synapses and do not show a considerable increase in synapse numbers after the lesion (Figure 3
B). As expected, the mean activity of the neurons in the LPZ drops down dramatically after the lesion but neuronal activities turn back into a homeostatic regime as additional synapses are formed (Figure 3
C). By contrast, neurons outside the LPZ show a course of mean activity and mean synapse numbers (Figure 3
D) that is comparable to the normal juvenile development. Thus, the deafferentation predominantly affects the homeostasis of neurons inside the LPZ but not so much outside the LPZ. There are strong fluctuation in mean activity and synapse numbers inside the LPZ until neurons regain homeostasis. We further wanted to know which neurons (inside or outside the LPZ) contribute to the formation of synapses onto those neurons that lost their inputs. Neurons inside the LPZ have vacant excitatory dendritic elements indicating their demand for additional synaptic input (Figure 3
E) but they do not offer vacant axonal elements as activities are too low. Instead, neurons outside the LPZ generate high numbers of vacant axonal elements (Figure 3
F) that can be used for synapse formation. Consequently, vacant dendritic elements on neurons in the LPZ form additional synapses by binding to available axonal elements from neurons outside the LPZ. Here again, the presence of vacant dendritic elements constitutes a kind of critical period in which neurons can form synapses which ends when neurons turn into homeostasis – meaning that afterwards further synapse formation is hardly possible. A sufficient surplus of axonal offers from neurons outside the LPZ and a large critical period with vacant dendritic elements inside the LPZ are the hallmarks of an optimal spontaneous reorganization in juvenile networks.
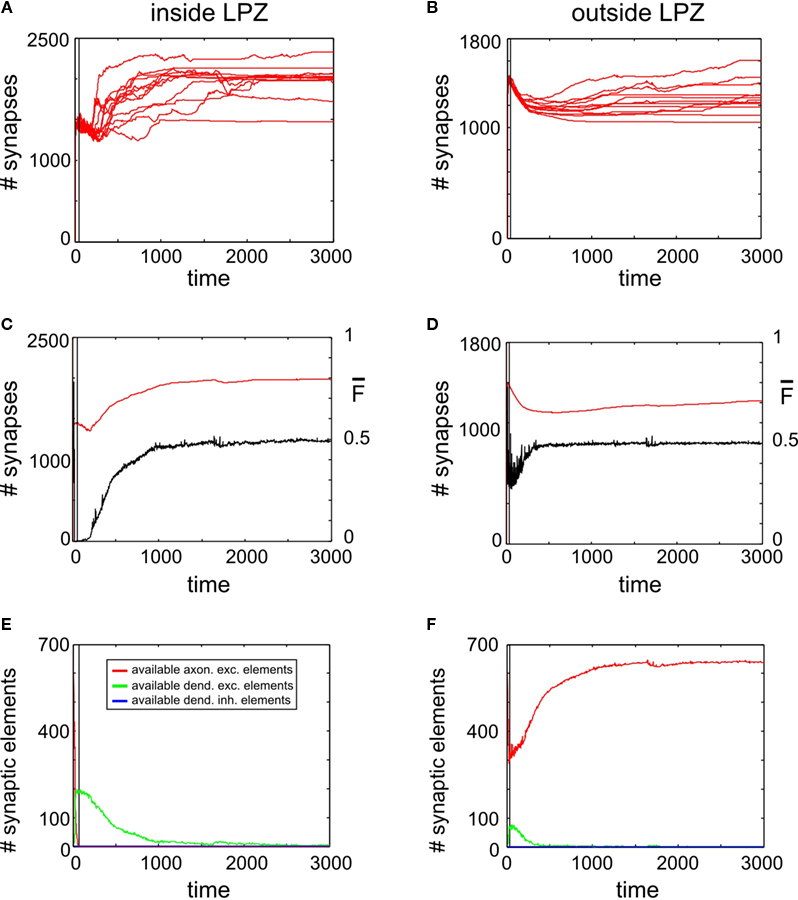
Figure 3. Juvenile lesion. A subset of 21 neurons (16 excitatory and 5 inhibitory) lost their input at time step 20 (vertical line). Left column summarizes changes for subsets of the excitatory neurons that lost input (neurons within the LPZ) whereas the right column shows the same for excitatory neurons outside the LPZ. (A,B) Course of excitatory synapse numbers per neuron over time from 12 individual simulations. (C,D) Course of mean firing probability (black curve) and mean excitatory synapse numbers (red curve) averaged over simulations in (A,B). In all simulations, neurons reach homeostasis after the lesion again spontaneously. (E,F) Gives the development of synaptic elements over time averaged over the simulations in (A,B).
Adult Networks Show Insufficient Spontaneous Compensation After a Lesion
The development of synapse numbers in adult networks after a lesion, by contrast, is dominated by an overall loss of synapses inside as well as outside the LPZ (Figures 4
A,B). Consequently, neurons inside the LPZ are not able to rebalance their activity again to homeostasis (Figure 4
C). Neurons outside the LPZ remain in a homeostatic regime although they loose excitatory synapses, too (Figure 4
D). The development of large amounts of vacant excitatory dendritic elements indicates a strong demand for excitatory input for neurons within the LPZ (Figure 4
E). Accordingly, no vacant axonal elements are offered by neurons within the LPZ as neuronal activities are low. Neurons outside the LPZ form vacant axonal elements which are though not sufficient in order to supply the demand of neurons inside the LPZ. This raises the question of how to optimize reorganization in adult networks after a lesion. The most obvious approach is therefore to enhance activity of neurons outside the LPZ by increasing their (intact) external input  in order to promote axonal sprouting and compensatory synapse formation.
in order to promote axonal sprouting and compensatory synapse formation.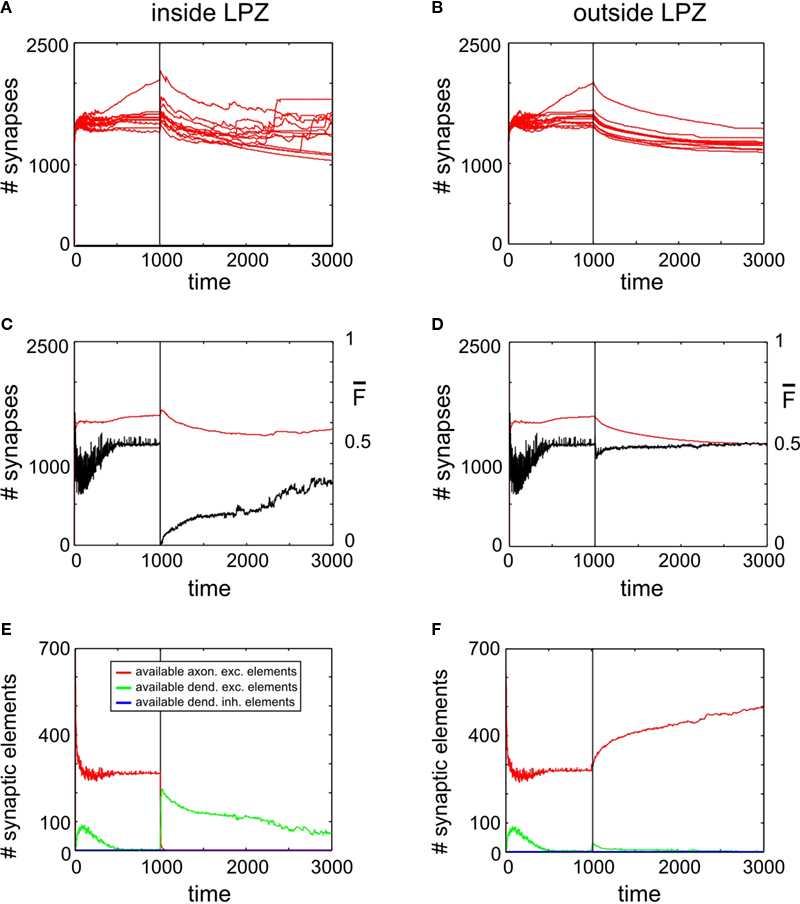
Figure 4. Adult lesion. A subset of 16 excitatory (and 5 inhibitory) neurons lost their input at time step 1000 (vertical line) when network connectivity is stable (‘adult networks’). Left column again summarizes changes within the LPZ whereas the right column shows the same for neurons outside the LPZ. (A,B) Course of excitatory synapse numbers per neuron over time from 12 individual simulations. (C,D) Course of mean firing probability (black curve) and mean excitatory synapse numbers (red curve) averaged over simulations in (A,B). There is an overall loss in synapses numbers in the LPZ as well as in intact regions. Thus, neurons which lost their input will not reach homeostasis after the lesion again. However, neurons that kept their input are able to regain homeostasis. (E,F) Gives the development of synaptic elements over time averaged over the simulations in (A,B). Within the lesion projection zone there is a lack of vacant axonal elements but a high demand of synaptic input expressed by an increased number of vacant excitatory dendritic elements. Neurons outside the lesion projection zone respond with moderate axonal sprouting.
Activity Stimulation Promotes Axonal Outgrowth but no Lasting Gain in Synapse Numbers
Figure 5
A reveals a transient (∼500 morphogenetic time steps) increase in synapse numbers per neuron inside the LPZ coinciding with the onset of a continuous stimulation. Outside the LPZ synapse numbers slightly decrease (Figure 5
B) but significantly less than for simulations without stimulation. At first sight, the stimulation might be, therefore, considered as beneficial for promoting compensatory network reorganization. However, when switching off stimulation at T = 2700 (second vertical line in the panels of Figures 5 and 6
), synapse numbers drop down dramatically to almost as low values as before the lesion. Coinciding with the loss of synapses there are two major decreases in mean activity which is at T = 1000 (due to loss of input activity) and at T = 2700 (which is caused by the turn off of stimulation). While the stimulation lasts, mean activities of the neurons inside the LPZ (Figure 5
C) turn into homeostasis. However, when stimulation is turned off the network is not able to maintain this state. For the time observed, mean firing probabilities also remain far below the homeostatic value and as there is obviously no spontaneous synapse formation going on, it is likely that activities remain low. Unlike neurons inside the LPZ, neurons outside the LPZ (Figure 5
D) develop well towards homeostasis after turning off the stimulation. Therefore, one may conclude that there remains a significant deficit in the synaptic input pattern of neurons inside the LPZ. Thus, a continuous stimulation does not produce a lasting compensation for the lesion. This is due to the development of synaptic elements during stimulation:
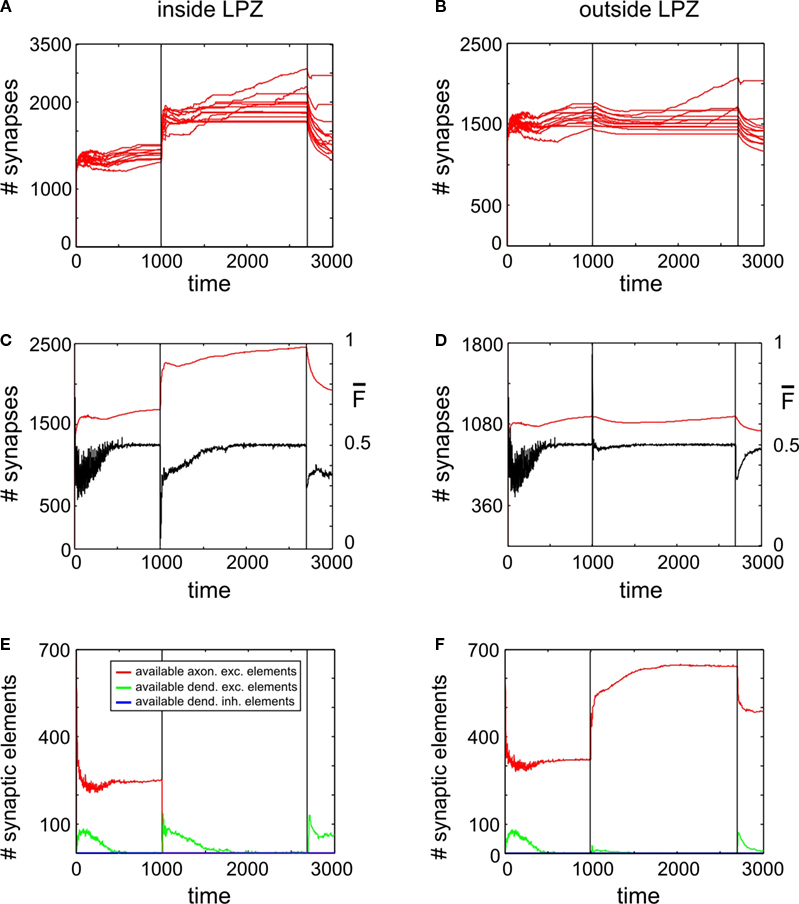
Figure 5. Adult lesion with continuous stimulation. Simulations in this figure use the same settings as in Figure 4
. In addition, neurons outside the LPZ are continuously stimulated with a strong excitatory input beginning with the onset of the lesion at T = 1000 and lasting until T = 2700. Thereafter, neurons only receive the standard random input. Onset of lesion and stimulation as well as the turn off of stimulation is indicated by vertical lines. (A,B) Course of excitatory synapse numbers per neuron over time from 12 individual simulations. (C,D) Course of mean firing probability (black curve) and mean excitatory synapse numbers (red curve) averaged over simulations in (A,B). (E,F) Gives the development of synaptic elements over time averaged over the simulations in (A,B).
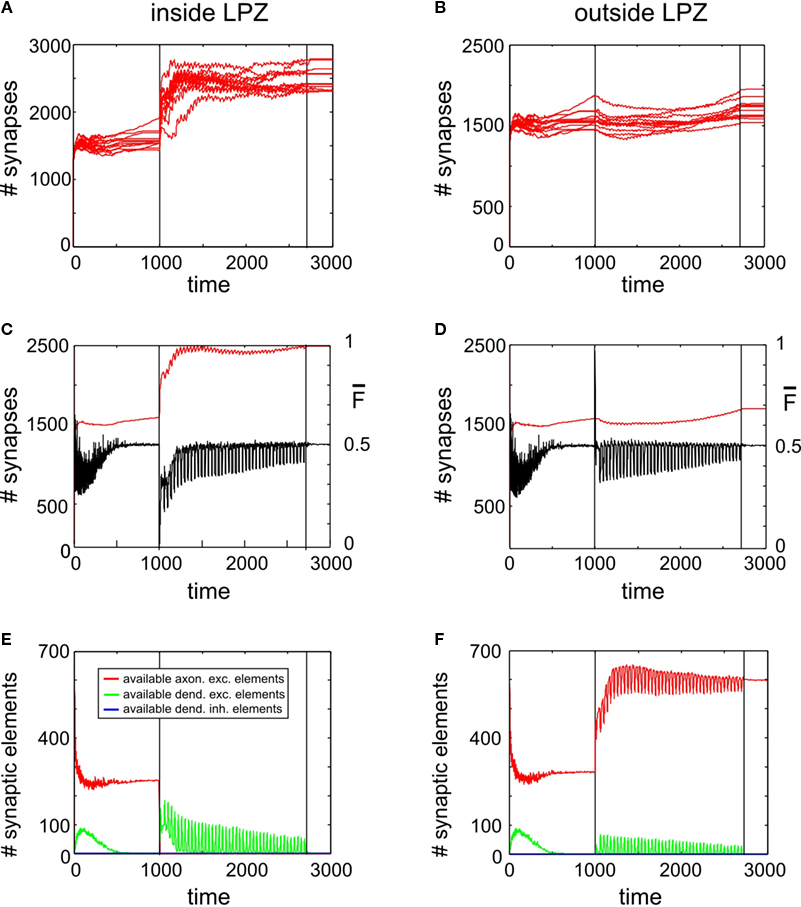
Figure 6. Adult lesion with paused stimulation. Simulations in this figure use the same settings as in Figure 5
but here stimulations are interrupted by short pauses. (A,B) Course of excitatory synapse numbers per neuron over time from 12 individual simulations. (C,D) Course of mean firing probability (black curve) and mean synapse numbers (red curve) averaged over simulations in (A,B). (E,F) Gives the development of synaptic elements over time averaged over the simulations in (A,B). Vertical lines in all panels indicate the onset of the lesion at the same time with the beginning of the paused stimulation at T = 1000 and the final turn off of the stimulation at T = 2700.
We find again that the presence of vacant dendritic elements inside the LPZ (Figure 5
E) indicates the time window (‘critical period’) in which their hosting neurons can form new synapses. This phase is shorter than in networks without stimulations and also shorter than for lesions in juvenile networks. Consequently, a fast decay in available excitatory dendritic elements is the very limiting factor for synapse formation that causes an insufficient network reorganization.
Moreover, the expected benefit of the stimulation promoting axonal outgrowth is also limited. This is because stimulation does not rise mean activities of neurons without the LPZ substantially as neurons quickly adapt to the extra activity (Figure 5
D). Therefore, axonal outgrowth saturates when neurons outside the LPZ return to homeostasis (Figure 5
F). Thereafter, further stimulation has no beneficial effect on network development any longer.
However, it turns out that the turn off in stimulation coincides with a spontaneous rise in vacant excitatory dendritic elements. This finding led us to the idea that interrupting the stimulation by pauses may prevent an early saturation in synapse formation. We would therefore expect that a certain relaxation time is needed by the network to produce vacant dendritic targets again that can be used for further synapse formation.
Paused Stimulation Enhances Compensatory Network Rewiring
As further simulations reveal, adaptation to external stimulation and early saturation in synapse formation can be prevented (Figure 6
A) by interrupting stimulations by short breaks in stimulation. Remarkably, synapse numbers neither inside nor outside the LPZ (Figures 6
A,B) decrease after turning off stimulation completely but remain on a stable high level. Moreover, mean activity of neurons inside (Figure 6
C) and outside the LPZ (Figure 6
D) stay within a homeostatic equilibrium. Fluctuations in mean activity during stimulation and pause phases cause a prolonged formation of synaptic elements. That is, inside the LPZ there are vacant dendritic elements available over the whole simulation time (Figure 6
D). This is because the network passes a ‘relaxation phase’ when neuronal activities are low during pauses. During relaxation phases, postsynaptic neurons again increase their demands for excitatory input and form additional dendritic elements (Figure 6
E). Instead of adapting to stimulation, the network is able to form additional synapses during paused stimulation. Moreover, neurons outside the LPZ respond with an enhanced production of axonal elements (Figure 6
F) compared with the continuous stimulation. Regarding the resulting connectivity, networks under paused stimulation form a strong surplus of synapses from neurons bordering the LPZ onto neurons inside the LPZ (Figure 7
) that would not arise during normal development. Comparing connectivity in networks with paused stimulation to continuous stimulation 1000 morphogenetic time steps after the lesion reveals that synapse formation under paused stimulation is slightly but significantly enhanced onto neurons inside the LPZ (Figure 8
A); 3000 morphogenetic time steps after the lesion, when stimulation was already turned off before, we found a substantial difference between networks with permanent and paused stimulation (Figure 8
C). Although synapse numbers outside the LPZ after adult lesions actually decrease in the previous set of simulations, paused stimulation causes stability or even a marginal increase in synapse numbers (Figures 8
B,D).
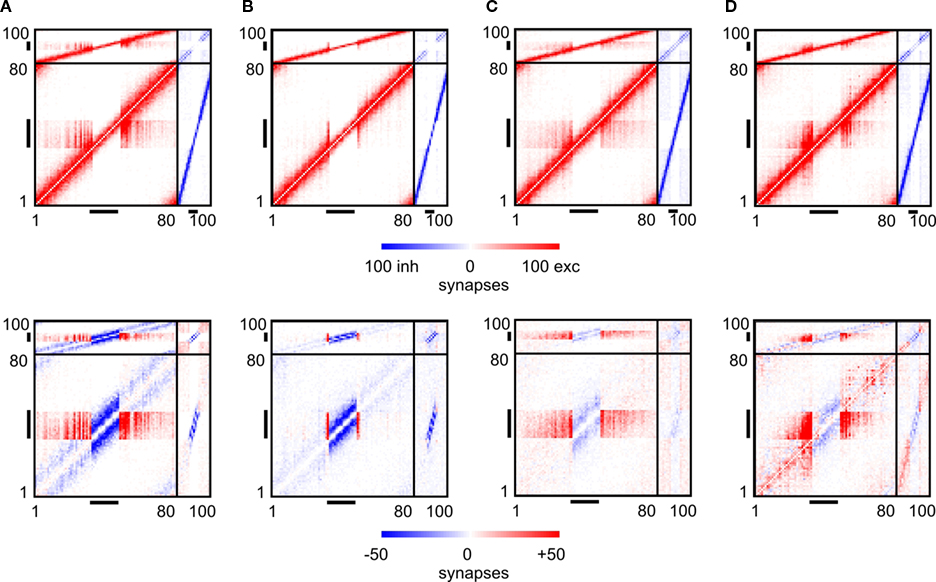
Figure 7. Changes in connectivity. The first row of panels shows the final connectivity at the end of each simulation (T = 3000). The second row shows the differences between connectivity before the lesion and at T = 3000. In accordance to Figure 1
, red colours indicate numbers of excitatory synapses (first row) or an increase in synapses (second row), respectively. Blue colours specify inhibitory synapses or a decrease in synapses, respectively. Black horizontal bars indicate output synapses arising from neurons inside the LPZ. Black vertical bars indicate input synapses hosted by neurons inside the LPZ. (A) Final connectivity and change in connectivity after a juvenile lesion. (B) Final connectivity and change in connectivity after an adult lesion. (C) Final connectivity and change in connectivity after an adult lesion with a continuous stimulation. (D) Final connectivity and change in connectivity after an adult lesion with a paused stimulation.
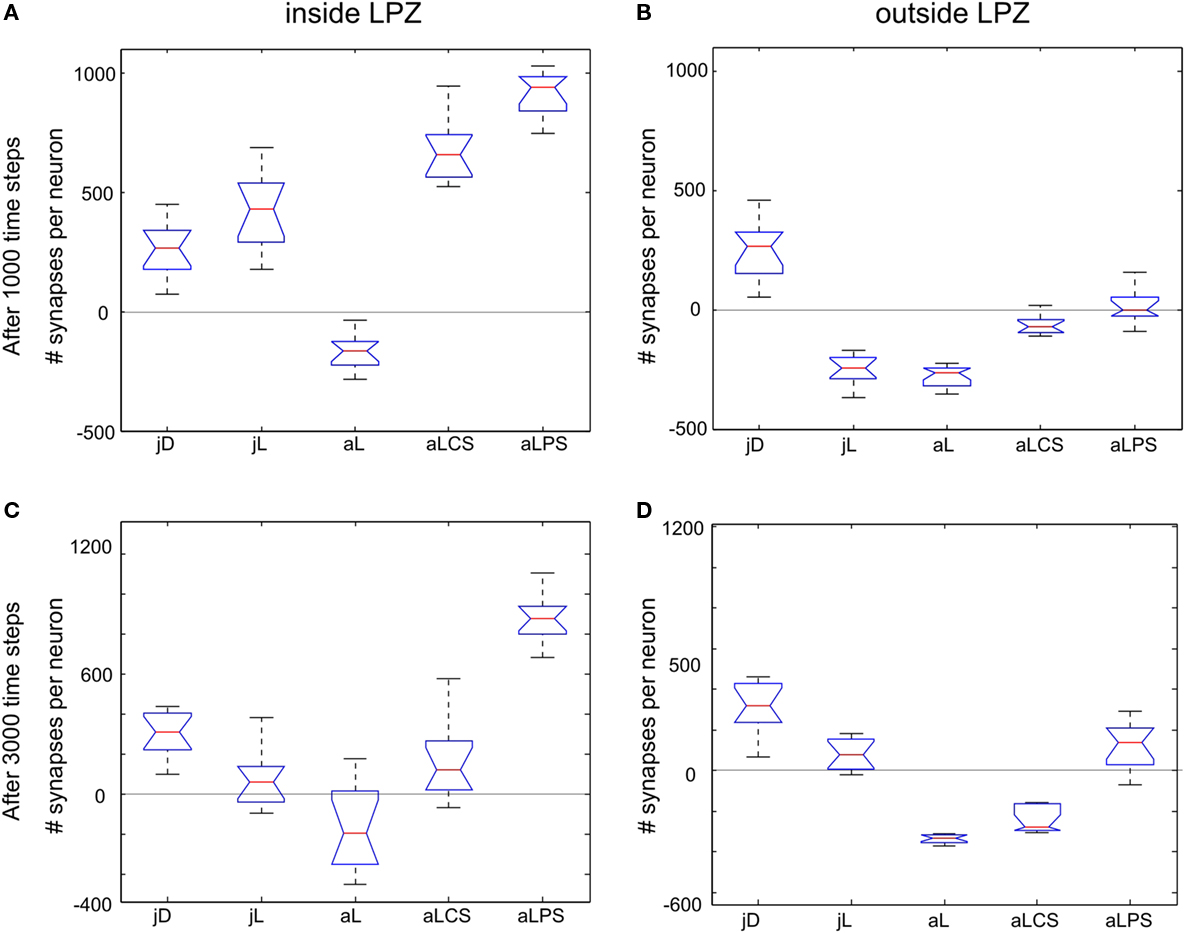
Figure 8. Group differences. Changes in excitatory synapse numbers per neuron between different stimulation protocols at 1000 (first row; A,B) and 3000 morphogenetic time steps after the lesion (second row; C,D). The figure shows the changes in excitatory synapses inside (left column; A,C) and outside the lesion projection zone (right column; B,D) and its distribution over the 12 data sets used (as shown in Figures 2
A,B to 6
A,B) as well as the 95 percentile for each group (jD, juvenile development; jL, juvenile lesion; aL, adult lesion; aLCS, adult lesion with continuous stimulation; aLPS, adult lesion with paused stimulation).
Trade-off Between Stimulation and Pause Times
We further examined which combinations of stimulation and pause times generate the strongest increase in synapse numbers. The reorganization enhancing effect of a stimulation saturates after about 500 morphogenetic time steps. As saturation due to a stimulation is to be avoided, stimulation times were chosen shorter than this saturation time. Therefore, stimulation times up to 300 morphogenetic time steps were tested. Pause times were, in turn, tested in 10% increments up to 100% of the stimulation time. That means, with 100%, pause time is as long as the stimulation time. We found that stimulation times not longer than 200 time steps (which equals about 50% of the saturation time) combined with pauses not longer than 20% of the stimulation time used, produce a substantial increase in synapses inside the LPZ. Longer stimulation and pauses either result in no gain or even in a loss of synapses (Figure 9
A). Outside the LPZ, neurons optimally keep their synapse numbers or even show a small increase. Non-optimal combinations of stimulation and pause times lead to a severe loss in synapses (Figure 9
B). However, there are still fluctuations in the final outcome of the reorganization; so one may suppose that the reorganization is to some extent dependent on the inherent structural network development after the lesion.
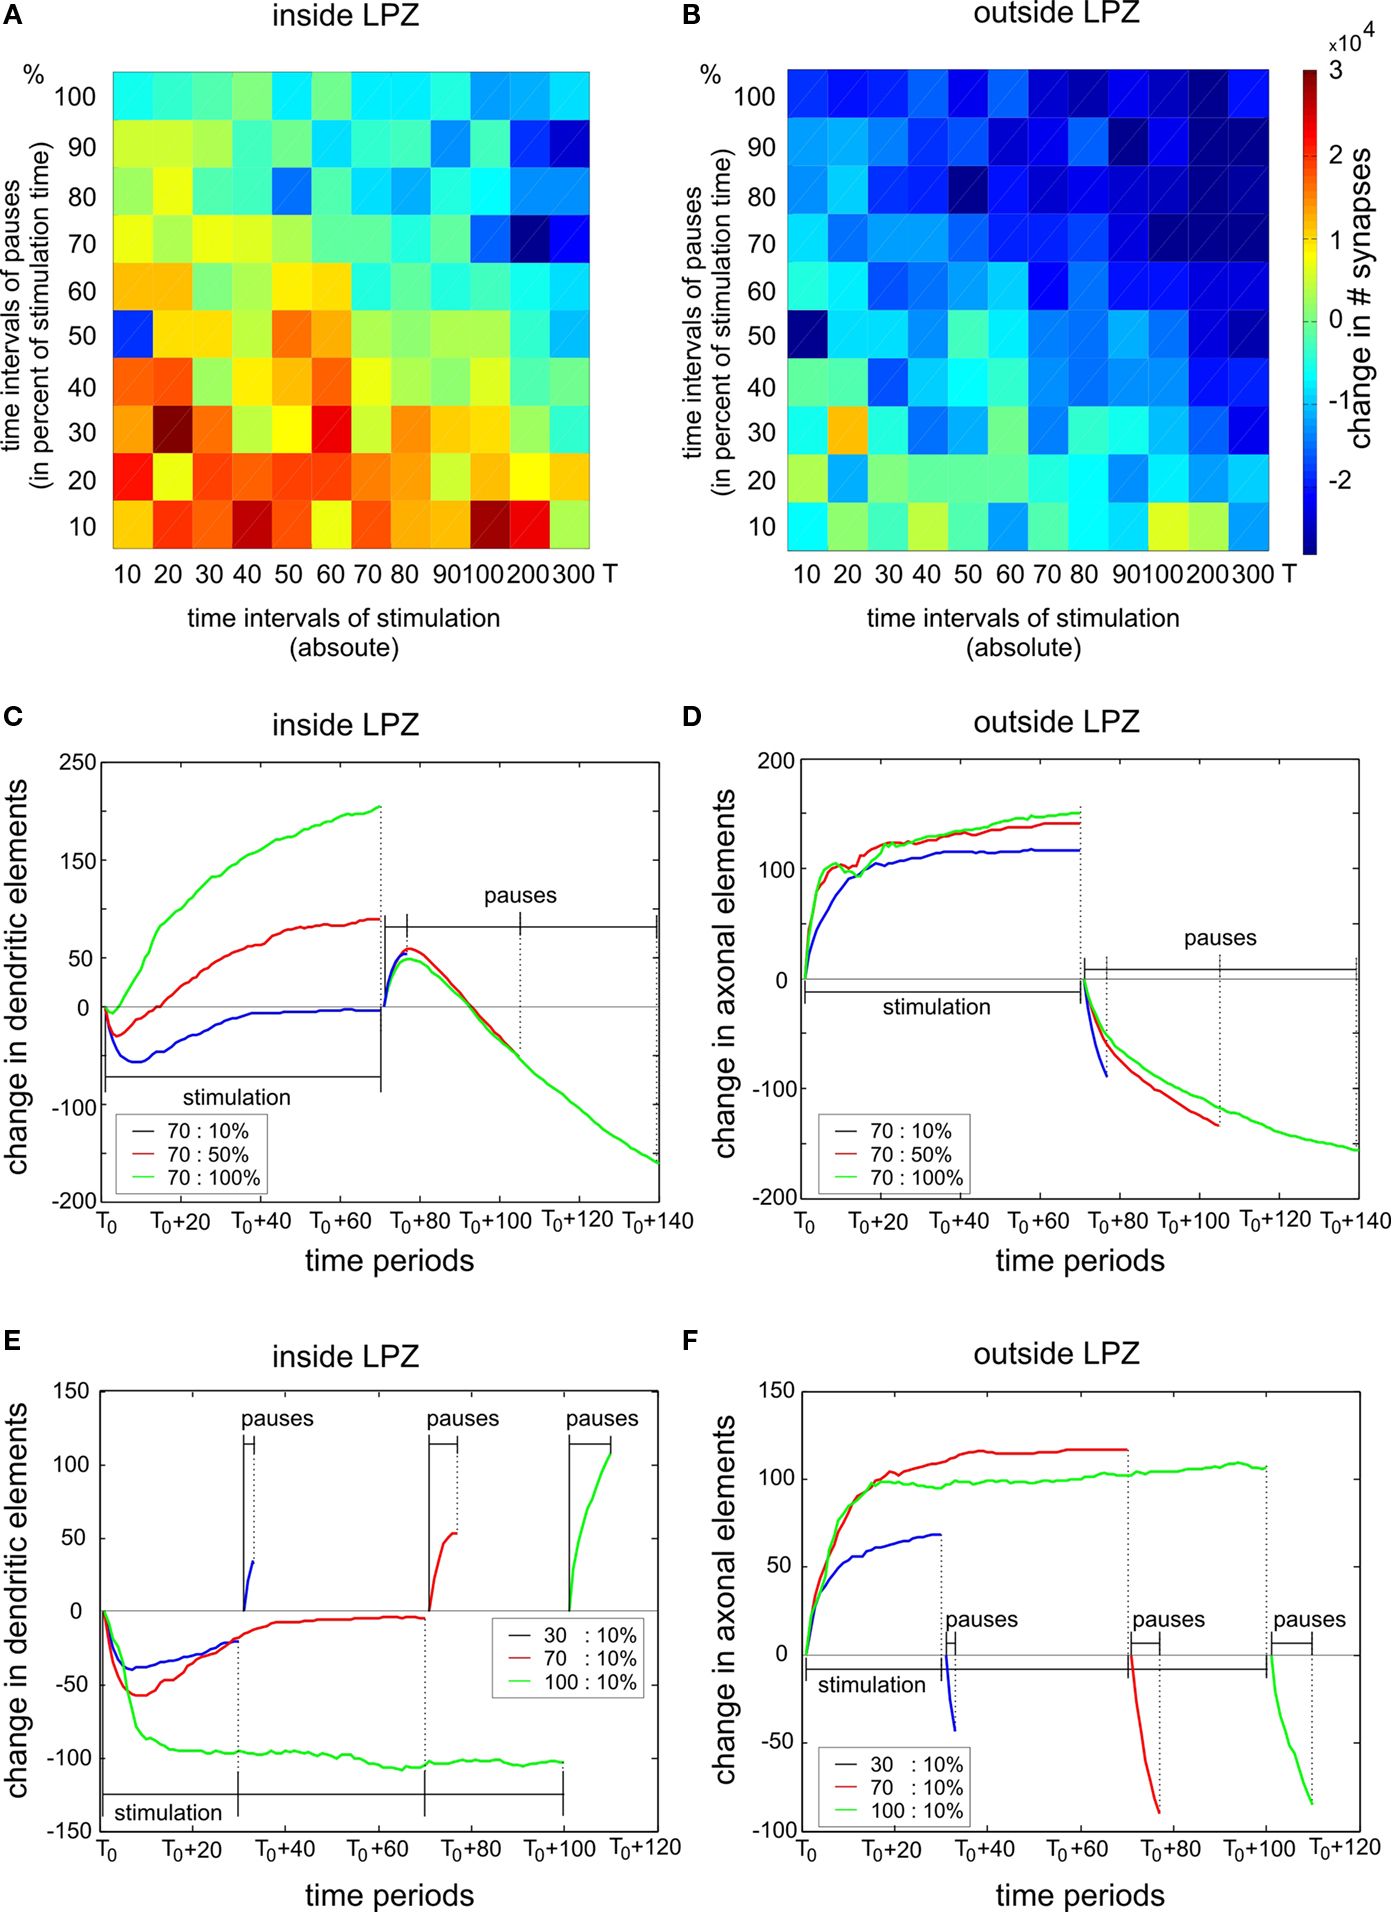
Figure 9. Trade-off between stimulation and pause times. The left column shows changes inside the LPZ whereas the right column shows changes outside the LPZ. (A, B) Total difference in excitatory synapses between onset of lesion and final connectivity state for different stimulation and pause times. The chosen stimulation times are specified as morphogenetic time steps (x-axis) whereas the chosen pause times are given as percentage values of the stimulation time in 10% increments (y-axis). For example, 100% of pause time means that the pause phase is as long as the stimulation phase. In (C–F) the x-axis gives the time period of each stimulation and pause phase starting at T0. Each curve indicates the mean changes in dendritic and axonal elements during stimulations and pauses for different exemplary combinations of stimulation and pause times. In (C) and (D) we show the impact of varying pause lengths (blue: 10%, red: 50% and green: 100% of stimulation time) whereas in (E) and (F) we show the impact of different stimulation times (blue: 30, red: 70 and green: 100 morphogenetic time steps). Dashed vertical lines mark the ending of the stimulation and pause phases, respectively.
In order to understand what is causing the trade-off between stimulations and pauses, we further studied how stimulations and pauses influence the formation and the loss of synaptic elements. Necessary for synapse formation onto neurons inside the LPZ is their formation of dendritic elements and the formation of axonal elements by neurons outside the LPZ. Therefore, we quantified the changes in excitatory dendritic elements within the LPZ (Figures 9
C,E) and the change in excitatory axonal elements outside the LPZ (Figures 9
D,F), respectively. As we are essentially interested in the total increase of synapses, we averaged over all stimulation phases beginning at T0 and the respective following pause phase. This gives a gross estimation how synaptic elements develop during stimulation and pause phase which is sufficient to explain the different results depending on varying stimulation and pause lengths. In Figures 9
C, D, the impact of pause lengths is shown. Longer pause lengths lead to an increasing regression of excitatory dendritic elements whereas short pauses produce an increase of these elements during the pause phase (Figure 9
C). At the same time, different pause length have little effect on axonal outgrowth during stimulation phase but cause loss of axons during the pause phase (Figure 9
D). Therefore, pause lengths need to be short not to ruin the surplus of axonal elements formed during stimulation phases before. On the other hand, increasing the stimulation time leads to a reduction in dendritic elements inside the LPZ (Figure 9
E) but does not produce a further increase in axonal elements because axon formation quickly saturates (Figure 9
F).
We were able to show that the model for structural plasticity in a developing ‘juvenile’ network equilibrates neuronal activities by rewiring excitatory and inhibitory connectivity. The same mechanism may also contribute to compensatory network rewiring after a deafferentation. Remarkably, the plastic capacities of these simulated networks highly depend on their developmental history: Juvenile networks possess a pronounced intrinsic plastic capacity while neuronal activities are not yet balanced (‘Critical phases’). Juvenile networks are therefore able to completely compensate for a lesion. In contrast, ‘adult’ networks show a very limited capacity for compensatory reorganizations. Nevertheless, it is possible to promote reorganization by external stimulations. Comparing the reorganization outcome of both the permanent with the paused stimulation scenario revealed a sufficient reorganization for the paused stimulation only. On the one hand, paused stimulation produces the highest increase in synapse numbers of all stimulation protocols, and on the other hand, reorganized connectivity remains stable even when stimulation is finally turned off.
Implications of the Model
The main contribution of our model is to predict reorganization in network connectivity from local activity-dependent changes in the neurons’ morphology (review in Butz et al., 2009
) for different network constraints such as juvenile or adult networks or following a lesion. The model postulates that neurons form axonal and dendritic elements which they offer to the neuropil in order to increase their chance for synapse formation. In fact, spine growth precedes synaptogenesis in biological networks (Knott et al., 2006
; Wolff et al., 1989
), and new spines attract axonal terminals or varicosities by morphogenetic factors in order to form synapses (shown in earlier cell culture studies: reviewed in Rao and Jacobson, 2005
; and recently in slice preparations of the adult hippocampus: Toni et al., 2007
). One main finding of the model are cooperative effects for synapse formation between neurons of different activity levels in order to achieve homeostasis for neuronal activity. That is, the probability for synapse formation is highest among neurons expressing many dendritic spines and those performing axonal sprouting. At the same time, this means that ‘critical phases’ in which neurons can form new synapses and reorganize network connectivity is limited and crucially depending on the neurons’ supply and demand for synaptic input.
We hypothesize that any neuronal lesion like a deafferentation, unbalancing the excitation–inhibition equilibrium of the affected neural network, is compensated by different cellular strategies. Molecular mechanisms and classical synaptic plasticity mechanisms like habituation and long-term depression certainly contribute to homeostasis but may not be sufficient if the activity imbalance is either too strong or lasting too long. Then, a neuron adapts its synaptic spectrum by morphological dendritic and axonal changes and, therefore, essentially relies on cooperation with adjacent or projecting neurons to obtain additional input (or, if it fails, even undergoes apoptosis). Substantial synaptic rewiring was for instance found after lesioning thalamic input to visual cortex in rats (Holzgrefe et al., 1981
). Experimental data from focal retinal lesions further shows increasing spine remodelling (Keck et al., 2008
) as well as axonal sprouting from neurons bordering the lesion (Darian-Smith and Gilbert, 1994
, 1995
). Moreover, increasing amounts of instable dendritic spines were reported after selective whisker clipping in the barrel fields of rodents (Trachtenberg et al., 2002
).
According to our model, we suggest that the limited plastic capacities in adult networks to compensate for a lesion are due to a low offer in vacant particularly axonal elements that are used for a compensatory formation of additional synapses. Interestingly, promoting axonal sprouting by activity stimulation may increase the offer of vacant axonal elements. However, at the same time neurons counterbalance the extra activity by reducing dendritic elements. This, in turn, limits the ‘critical phase’ for synapse formation. In the model, neurons gained homeostasis during stimulation but an insufficient synapse formation allowed them not to maintain homeostasis when stimulation is turned off. Pauses in stimulation create further demand of the neurons for additional synaptic input and, therefore, can prolong the ‘critical phase’ after a lesion in which networks can reorganize. By contrast, juvenile model networks show spontaneous phases of increased remodelling and, remarkably, phases of increased synaptic rewiring also periodically re-occurs in the rodent visual cortex after lesions of the thalamic input (Holzgrefe et al., 1981
; Holzgraefe and Wolff, 1986
). We therefore conclude that pauses in stimulation are essential to allow for a spontaneous network reorganization that is required for a lasting compensation for a lesion.
This homeostatic reorganization of biological neuronal networks causes dramatic rearrangements of cortical circuitry and topic representations in the brain after lesions. To our knowledge, our model is the first approach that bridges between morphological changes on a cellular level and changes on an anatomical neural network level. Our theoretical model, thus, offers an integrative explanation for axonal sprouting and synaptic rewiring after a cortical deafferentation as seen in a variety of experimental studies (Darian-Smith and Gilbert, 1994
, 1995
; Keck et al., 2008
; Merzenich et al., 1983
, 1984
). However, for modelling the interaction between different cortical areas, larger networks might be more appropriate. At this point, it, of course, becomes also necessary to transfer the modelled mechanism to an, at least, two-dimensional network. This would allow for modelling map reorganizations explicitly and to make predictions for the change in receptive field properties of each neuron. For this, the model should incorporate realistic anatomical data on cortical connectivity. In this context it must be discussed that distant connections are often underestimated in models for cortical circuitry (Stepanyants et al., 2009
). This implies that axonal arbours may be available for reoccupying vacant dendritic targets that are not hosted by neighbouring neurons but originate from far distant neurons. Especially, for lesions in higher cortical areas this might be relevant as axonal sprouting of distant neurons may give rise to a cross-modal reorganization. Nevertheless, the model describes a general mechanism for activity-dependent structural plasticity that is not necessarily restricted to lesion-induced plasticity (Wolff et al., 1989
). One may conclude that structural plasticity ubiquitously contribute to changes in network connectivity wherever lasting changes in neuronal activity occur; for instance, motor skill learning, not only in a pathological but also in a functional context, is well known to raise cortical activities in the brain (Bangert and Altenmüller, 2003
) and, therefore, possibly eliciting phases of enhanced structural network reorganization. First experimental evidence for experience-dependent structural plasticity exists that neurons in the rat barrel cortex increase their incoming inhibitory synapses after whisker stimulation in a compensatory manner (Knott et al., 2002
). Assuming a common mechanism for reactive as well as experience-dependent plasticity have consequences for motor skill learning and re-learning particular in neurological rehabilitation.
Consequences for Neurological Rehabilitation
For neurological rehabilitation, we conclude from our model that long-term excitatory stimulation by, for example, extensive training has a limited effect on rehabilitation (compare Liepert et al., 2001
) as plasticity saturates when neuronal circuits adapt to the stimulation. The first 3 months are most important in rehabilitation; thereafter therapy aims maintaining the patient’s chronic state but further improvements are much harder to achieve. Remarkably, our model is able to reproduce this saturation effect as a consequence of neuronal homeostasis and, moreover, generates hypotheses about how to prevent this saturation in therapy. In the model, stimulation times up to about 50% of the saturation time were most effective for enhancing network reorganization when combined with pauses of 10 to 20% of the respective stimulation time following each stimulation phase. This leads to the testable hypothesis that an intensive rehabilitation should be interrupted after 6 weeks by a week of no therapy. During this relaxation phase, neuronal circuits may rewire and will, according to our postulate, form new demand for further input.
We used cortical deafferentation as a paradigm for our modelling approach because cortical reorganization is directly observable on behavioural level in humans, too, for instance in patients suffering from facialis paresis when synaptic rewiring causes an altered innervation pattern of muscles in face and neck (Yildiz et al., 2007
). Moreover, a comparable situation of synaptic rewiring also appears after focal stroke as the apoptotic loss of neurons is accompanied by phases of high structural reorganization (Carmichael et al., 2001
; Stroemer et al., 1995
). Increased (synchronous) activity, as recently shown experimentally, is the main trigger for inducing structural reorganization (Carmichael and Chesselet, 2002
) that expresses distinct periodicity in time (Carmichael, 2006
). Adjacent areas respond to the infarct with changed functional properties and even distant projections are involved in synaptic rewiring forming completely novel connections (reviewed in Nudo, 2007
). However, the penumbra (the area surrounding the infarct) as being hyperexcitable acutely after the lesion (Hagemann et al., 1998
; Liepert et al., 2000
; Luhmann et al., 1995
; Neumann-Haefelin et al., 1995
; Schiene et al., 1996
) bears on the risk for progressive cell loss due to excitotoxic activity levels. Future studies may address the problem of how to maximize reorganization and preventing progressive cell loss. Therefore, our novel computational approach has clinical relevance.
The authors declare that the research was conducted in the absence of any commercial or financial relationships that could be construed as a potential conflict of interest.
We thank Prof. Dr. med. Wolff, Department for Developmental Neurobiology, University of Göttingen, for many helpful discussions on reactive plasticity and Mrs Dr. med. habil. Müller, Clinic for Rehabilitation, St. Mauritius Meerbusch, Germany, for insights in the time courses of neurological rehabilitation. The project was supported by BCCN grants from the German Ministry for Research and Education (BMBF) via the Bernstein Center for Computational Neuroscience (BCCN) Göttingen under grant no. 01GQ0432 and funding from the European PACO-Plus project as well as from the Computational Life Sciences programme grant (635.100.017) of the Netherlands Organization for Research (NWO).