Capturing dopaminergic modulation and bimodal membrane behaviour of striatal medium spiny neurons in accurate, reduced models
1
Adaptive Behaviour Research Group, Department of Psychology, University of Sheffield, Sheffield, UK
2
Group for Neural Theory, Department d’Etudies Cognitives, Ecole Normale Superieure, Paris, France
Loss of dopamine from the striatum can cause both profound motor deficits, as in Parkinson’s disease, and disrupt learning. Yet the effect of dopamine on striatal neurons remains a complex and controversial topic, and is in need of a comprehensive framework. We extend a reduced model of the striatal medium spiny neuron (MSN) to account for dopaminergic modulation of its intrinsic ion channels and synaptic inputs. We tune our D1 and D2 receptor MSN models using data from a recent large-scale compartmental model. The new models capture the input–output relationships for both current injection and spiking input with remarkable accuracy, despite the order of magnitude decrease in system size. They also capture the paired pulse facilitation shown by MSNs. Our dopamine models predict that synaptic effects dominate intrinsic effects for all levels of D1 and D2 receptor activation. We analytically derive a full set of equilibrium points and their stability for the original and dopamine modulated forms of the MSN model. We find that the stability types are not changed by dopamine activation, and our models predict that the MSN is never bistable. Nonetheless, the MSN models can produce a spontaneously bimodal membrane potential similar to that recently observed in vitro following application of NMDA agonists. We demonstrate that this bimodality is created by modelling the agonist effects as slow, irregular and massive jumps in NMDA conductance and, rather than a form of bistability, is due to the voltage-dependent blockade of NMDA receptors. Our models also predict a more pronounced membrane potential bimodality following D1 receptor activation. This work thus establishes reduced yet accurate dopamine-modulated models of MSNs, suitable for use in large-scale models of the striatum. More importantly, these provide a tractable framework for further study of dopamine’s effects on computation by individual neurons.
Loss of dopamine cells in Parkinson’s disease and its animal models leads to profound motor deficits (Schwarting and Huston, 1996
; Kirik et al., 1998
; Ferro et al., 2005
). An intact dopamine system also seems to be critical for many forms of learning (Whishaw and Dunnett, 1985
; Ferro et al., 2005
), consistent with reported correlations between dopaminergic neuron firing and the prediction error required by reinforcement learning theories (Redgrave and Gurney, 2006
; Schultz, 2007
). Much work on understanding these roles of dopamine has focussed on the striatum, the main input nucleus of the basal ganglia. The striatum is the main locus of dopamine’s action, as it contains by far the highest density of dopamine receptors in the vertebrate brain (Dawson et al., 1986
; Richtand et al., 1995
; Hurd et al., 2001
). Further, the striatum receives massive convergent input from the neocortex, thalamus, hippocampal formation, and amygdala (McGeorge and Faull, 1989
; Groenewegen et al., 1999
; Glynn and Ahmad, 2002
; Smith et al., 2004
), and dopamine modulates striatal neurons’ responses to them. Thus, the twin problems of understanding the computational roles of dopamine and the striatum are inseparably intertwined.
Within the striatum lies a complex, predominantly GABAergic, microcircuit (Bolam et al., 2006
). Medium spiny projection neurons (MSNs) are the only output neurons and comprise up to 95% of the neuron population in the rat, with GABAergic and cholinergic interneurons forming most of the remaining population. Dopamine has multiple different effects on these neuron types, and by multiple receptors: indeed, the precise effects of activating dopamine receptors on the MSN have been much debated (Surmeier et al., 2007
). Understanding the contribution of all these elements to striatal function ideally requires large-scale models (Djurfeldt et al., 2008
) that replicate the neuron types, numbers, and connectivity at one-to-one scale. Building at such scales requires individual neuron models simple enough to be computationally tractable, but sufficiently complex to capture the characteristic behaviour of a neuron species.
Previous one- (Mahon et al., 2000b
; Gruber et al., 2003
), two- (Kitano et al., 2002
), and multi-compartment (Wilson, 1992
; Wolf et al., 2005
; Moyer et al., 2007
) MSN models have explored one or more of the key properties supported by its range of ion channels. Three properties have received most attention. First, the characteristic long-delayed first spike following current injection (Nisenbaum et al., 1994
). Second, paired-pulse facilitation, the comparatively enhanced response to a second current pulse delayed by hundreds of milliseconds (Mahon et al., 2000a
). Third, that the MSN shows membrane potential bistablity or, more weakly, bimodality in response to unpatterned inputs. Certainly in vivo under anaesthetic the membrane potential fluctuates between a hyperpolarised “down-state” and depolarised “up-state” plateau (Wilson and Kawaguchi, 1996
), seemingly driven by similar fluctuations in cortical firing (Mahon et al., 2001
; Kasanetz et al., 2002
). However, recent in vitro studies have reported apparent bistability due to NMDA receptor activation (Vergara et al., 2003
; Carrillo-Reid et al., 2008
). Models exploring the dual-state membrane behaviour have shown that bistability or bimodality can only be induced under extreme parameterisations of, respectively, somatic ion channels (Gruber et al., 2003
) or NMDA receptor density (Wolf et al., 2005
; Moyer et al., 2007
). We required a neuron model that could address all these neurocomputational properties, yet was radically reduced in computational complexity for use in large-scale striatum models.
Our neuron model of choice is the recent canonical spiking model of (Izhikevich, 2007
), which has been employed in some notably large-scale models (Izhikevich et al., 2004
). We extend here this class of neuron models to account for dopaminergic modulation. Though disarmingly simple, our models replicate the input–output responses of the most detailed existing multi-compartmental MSN model (Moyer et al., 2007
) with impressive accuracy. Moreover, our model captures both the long-delayed first spike and paired-pulse facilitation behaviour of the MSN. We show analytically that our MSN models are not bistable, with or without dopamine. Yet we show that our models can reproduce the spontaneously bimodal membrane potential recently observed in vitro after NMDA agonist application (Carrillo-Reid et al., 2008
), and predict that the bimodality would be enhanced by D1 receptor activation. We explain how the bimodality can arise from a model of the agonist as a slow, irregular, jump in NMDA synaptic conductance, and is crucially dependent on the voltage-dependent blockade of NMDA receptors.
We thus achieve two things. First, a set of reduced MSN models, suitable for use in large-scale models (Humphries et al., 2009
), which accurately capture the neurocomputational properties of the MSN and the known effects of dopamine. Second, a simplified, tractable framework for understanding dopamine’s influence on the computations performed by the MSN.
We introduce the reduced neuron model and then set out our extensions to it, including the models of dopaminergic modulation. Key to our work was overcoming the problem of tuning the new reduced models using some meaningful target data. Fortunately, Moyer et al. (2007)
have extended a recent 189 compartment MSN model (Wolf et al., 2005
) to incorporate the effects of D1 and D2 receptor activation on its various ion channels and synaptic receptors. In the process, they produced a thorough review quantifying the effects of dopamine receptor activation (see the summary tables of effect magnitude in Moyer et al. (2007)
for more information). Hence, we use the results they derived from their model as the benchmark for tuning the parameters for our reduced models. If we can get our reduced models to approximately replicate the behaviour of such a model, then we will be more confident that the dynamics displayed in a network of the reduced models are giving some genuine insight into the neural system (Humphries et al., 2009
).
The Reduced Neuron Model
Izhikevich (2003
, 2004
, 2007
) has recently introduced a canonical model for spike generation. Given that v is the membrane potential, and u is the contribution of the neuron class’s dominant ion channel, its biophysical form is (Izhikevich, 2007
):
with reset condition

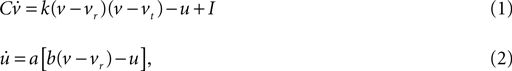
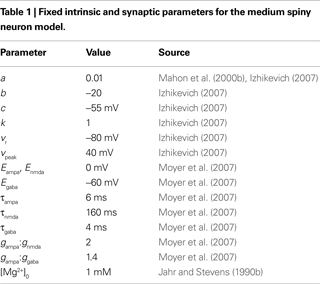
In the membrane potential equation, C is capacitance, vr and vt are the nominal resting and threshold potentials, I is a current source, and c is the reset potential (i.e. the value of the membrane potential immediately after an action potential is fired). Parameter a is the time constant – typically of inactivation – of the dominant ion channel. Parameters k and b are derived from the I–V curve of the neuron and d is tuned to achieve the desired rate of spiking output.
Izhikevich (2007)
estimated preliminary parameter values for a striatal MSN version of this model; for the record, these were C = 50 pF, vr = −80 mV, vt = −20 mV, k = 1, a = 0.01, b = −20, c = −55 mV, d = 150, and vpeak = 40 mV. In addition to the dopaminergic modulation extensions, we updated and extended this model. We use only a handful of these parameter values here (see Table 1
); the others we re-tune below. We also replace I with synaptic current models for GABA, AMPA, and NMDA receptors, including the NMDA receptor blockade by Mg2+ ions.
The MSN and Dopamine Model Framework
Two roughly equal-sized populations of MSNs can be defined by their dominant expression of either D1 or D2 dopamine receptor types (Surmeier et al., 2007
). Hence we have separate models for D1-dominant MSNs and D2-dominant MSNs. We express the proportion of active dopamine receptors by the parameters ϕ1 (for D1) and ϕ2 (for D2), in the interval [0, 1]. Activation is here assumed roughly constant in both space and time as the experimental data are all derived from in vitro studies with bath applied drugs.
We deal with effects on intrinsic ion channels first. The u current for the MSN model is simulating the slow inactivation of the A-type potassium current (Nisenbaum et al., 1994
). As we will be replicating the behaviour of their model, we follow Moyer et al. (2007)
in modelling no D1 receptor activation effect on this current (Hopf et al., 2003
), and so we do not modify u for the D1 MSN model (there is nonetheless evidence for a small attenuation of this current by D1 activation; see Nisenbaum et al., 1998
). We simplify D1 activation to just two opposing effects. First, it enhances the inward-rectifying potassium current (KIR) that hyperpolarises the membrane potential, bringing it closer to the reversal potential for K+ ions (Nisenbaum and Wilson, 1995
; Hernandez-Lopez et al., 1997
). Second, it lowers the activation threshold of the L-type Ca2+ current, effectively increasing the depolarisation of the MSN at a given membrane potential (Hernandez-Lopez et al., 1997
). To achieve these opposing effects in the reduced MSN model, we make two of the parameters dependent on D1 activation:
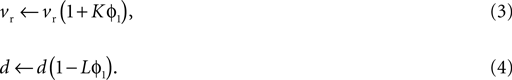
The first models the extra hyperpolarising influence of increasing KIR; the second models an enhanced response to depolarising input. Parameters K, L ∈ [0, 1] set the magnitude of these respective effects as a function of D1 receptor activation. By comparison, Moyer et al. (2007)
include many more effects than this: small changes in the fast sodium (Naf) current’s conductance and inactivation gate, and conductance changes for two other Ca2+ channels.
D2 receptor activation has a minor, inhibitory effect on the slow A-type potassium current (Moyer et al., 2007
). But it will turn out that this effect can be subsumed by altering k in Eq. 1 instead, so we also do not modify u for the D2 MSN model. As we will see below, Moyer et al.’s model predicts that D2 activation reduces the neuron’s rheobase current, translating the neuron’s f–I curve to lower current values (demonstrated in Figure 2
A). Though not immediately obvious from the form of Eq. 1, this effect can be nicely modelled by lowering k: we analytically show below that the neuron’s rheobase is dependent on k (see Eq. 17). Therefore, for D2-dominant MSNs we have the simple re-mapping:

where α parameterises the size of the appropriate reduction in k to get the required f–I curve. Again, we note that Moyer et al.’s model includes multiple effects of D2 activation: small increases in Naf and the slow A-type potassium conductances, and reduction of the L type Ca2+ current.
The left-shifted f–I curve prediction of Moyer et al.’s model is not consistent with results of Hernandez-Lopez et al. (2000)
. They showed that D2 agonists applied in vitro reduce MSN excitability and right-shift the f–I curve, arguing that the reduced L-type Ca2+ current was dominant. We can of course model this by reversing the sign of the effect to k(1 + αϕ2), which right-shifts the f–I curve. However, as our present goal is to replicate the Moyer et al. (2007)
model output for validation, we proceed with the model in Eq. 5.
The synaptic effects reported by Moyer et al. (2007)
follow the same form as the standard models of basal ganglia function (Gurney et al., 2001
): D1 activation enhances excitatory post-synaptic potentials (EPSPs), D2 activation attenuates EPSPs. To this basic story, Moyer et al. (2007)
add a subtle refinement: their review led them to propose that D1 activation affects only NMDA-induced EPSPs, and D2 activation affects only AMPA-induced EPSPs. Note that less is known about, and Moyer et al. do not address, the effects of dopamine receptor activation on GABA receptor induced PSPs.
We model synaptic input to the MSNs as:

Each synaptic input type z (where z is one of ampa, nmda, gaba) is modelled by:

where  is the maximum conductance and Ez is the reversal potential. We use the standard single exponential model of post-synaptic currents:
is the maximum conductance and Ez is the reversal potential. We use the standard single exponential model of post-synaptic currents:
where τz is the appropriate synaptic time constant, and Sz(t) is the number of pre-synaptic spikes arriving at all the neuron’s receptors of type z at time t. Finally, we have the term B(v) that models the voltage-dependent magnesium plug in the NMDA receptors (Jahr and Stevens, 1990b
):

where [Mg2+]0 is the equilibrium concentration of magnesium ions.
We add D1 receptor modulation of NMDA receptor evoked EPSPs by:

and we add D2 receptor modulation of AMPA receptor evoked EPSPs by:

where β1 and β2 are scaling coefficients determining the relationship between dopamine receptor occupancy and the effect magnitude.
Tuning the Models
We now have a set of free parameters to tune for our dopamine models. For the tuning stages, we suppose that the receptor activations are near-maximal and equal ϕ1 = ϕ2 = 0.8. We do this because all the detailed current and synaptic effect data were gathered from in vitro studies that used very high concentrations of either dopamine or a dopamine receptor agonist, and presumably resulted in near maximum receptor activation (we do not assume maximum receptor activation, as it is not clear how easily such chemicals can diffuse into the synaptic cleft once introduced into the artificial cerebro-spinal fluid of the preparation).
We set out four stages for tuning the MSN dopamine models against the benchmark data from the multi-compartmental model of Moyer et al. (2007)
. This breaks down the problem of fitting model parameters to the target data in the simplest fashion, allowing the minimal number of free parameters at each stage. The whole fitting process is detailed in Figure 1
. Good results were easily achieved using hand-tuning. We refined these using non-linear minimisation (Nelder-Mead simplex method as implemented by fminsearch in MATLAB, Mathworks); the hand tuned parameters served as initial values at each stage. We report here results of using summed relative error as the cost function – using summed squared error gave qualitatively similar results. We provide all code for tuning and studying the models in the Supplementary Material.
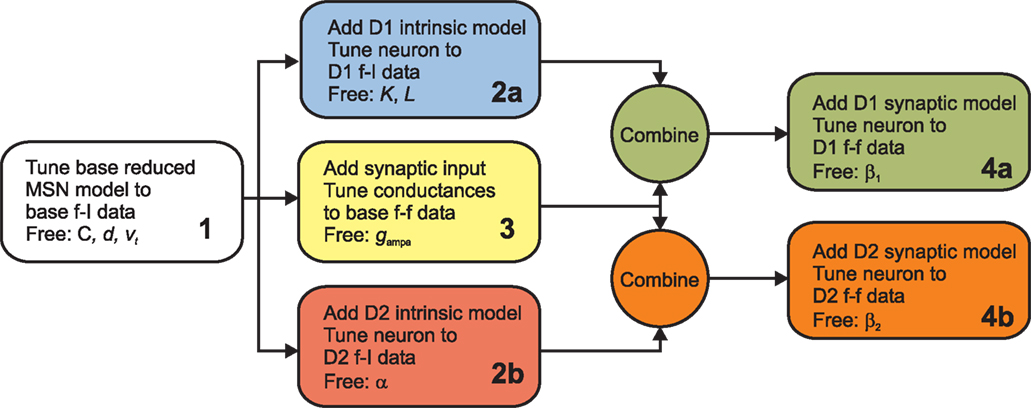
Figure 1. Flow chart of the parameter fitting process. We follow this series of steps to tune the basic reduced MSN model parameters and our dopamine model parameters to fit data from Moyer et al.’s (2007
) current-frequency (f–I) and frequency–frequency (f–f) curves, derived from their corresponding multi-compartment models.
Stage 1: re-tuning the basic MSN model parameters
We began by re-tuning the basic MSN model parameters to fit the f–I curve of the unmodified Moyer et al. model. This was necessary as Izhikevich’s original parameterisation of the basic MSN model (Izhikevich, 2007
) produced an f–I curve in a far higher range of input current. By re-tuning the basic MSN model, we would then be able to directly compare all the effects of our dopamine models with the results of Moyer et al. from their corresponding dopamine models.
We selected only the parameters C, d, and vt to tune, as each has a unique contribution to the dynamics of the MSN model. Current injections were tested in the interval I ∈ [200, 300] pA, each simulation run for 5 s using Eqs 1 and 2, solved using forward Euler with a time-step of 0.1 ms see Humphries and Gurney, 2007
for details on solution methods and time-step choice), and the firing rate computed over the last 4 s.
Stage 2: tuning the D1 and D2 intrinsic model parameters
We took this tuned basic MSN model, added the D1 (Eqs 3 and 4) and D2 (Eq. 5) intrinsic models to make two new MSN models, and tuned their parameters to fit the corresponding f–I curves from the Moyer et al. (2007)
D1 and D2 intrinsic models (respectively, Stages 2a and 2b from Figure 1
). We used the same simulation protocol as for the first stage.
Stage 3: tuning synaptic input to the basic model
We took the tuned basic MSN model, added synaptic input to generate equivalent input frequency–output frequency (f–f) plots to those given by Moyer et al., and tuned the synaptic conductances to fit these plots. To do this, we had to emulate how they generated their synaptic input as closely as possible, while respecting the intention to produce reduced models suitable for large-scale networks. Moyer et al. (2007)
used 168 synapses, 84 GABA and 84 glutamate, with each glutamate synapse containing both an AMPA and an NMDA receptor, and distributed them across the dendritic tree following anatomical data (glutamate mostly on distal dendrites, GABA synapses on soma and proximal dendrites). Each synapse received an independent spike train that was irregular and uncorrelated with the others. They reported the total number of synaptic events per second, summed across all these trains. The post-synaptic potential elicited by each spike was modelled as double-exponential function, with rise and decay times. Finally, blockade of NMDA receptors by magnesium ions was also modelled.
We adapt this as follows. Our post-synaptic potential model uses only a single exponential function (Eq. 8), a constraint imposed by the need to maintain computational efficiency in large-scale striatal models: single exponential synapses allow all synaptic currents of the same type (e.g. AMPA) to be summed and stored as a single variable. We add the voltage-dependent blockade of NMDA receptors (Eq. 9), setting [Mg2+]0 = 1 mM following ranges of concentration discussed in Jahr and Stevens (1990a)
. All reversal potentials and decay time constants were the same as Moyer et al. (2007)
(see Table 1
).
We model the synaptic input using a spike-event generator. Each generator directly produces the spike-events that occur across N afferents to the neuron. At each time-step Δt (seconds), and given a mean spike rate r (spikes/s), we compute the probability of a spike per afferent as p(s) = rΔt. The total number of spike-events S at each time-step is then just drawn from a binomial distribution S = B(N, p(s)). The resulting time-series of spike-events is equivalent to the pooling of N spike trains modelled as independent renewal processes.
As we have a point neuron, we lump all input to AMPA, NMDA, and GABA receptors into single current sources, as in Eq. 7. We generate two spike-event counts S+ and S−, for glutamate and GABA synapses respectively, each having N = 84 implied spike trains. As all spike-events are treated as independent events, there was no implied correlation between the underlying spike trains. Finally, we varied the mean rate r of each of the N underlying spike trains between 4 and 8 spikes/s, with the same r always applied to both S+ and S−. Hence, the expected total number of synaptic events per second S* = S+ + S− = 2 × N × r varied over the same approximate range of 800–1350 events/s that Moyer et al. (2007)
used.
Having done this, we are left with the three conductances gampa, gnmda, and ggaba as the only free parameters. We cannot directly use the maximal conductance values from the Moyer et al. model, as they are dendritic conductance values, and we have to re-scale ours as they are effectively somatic conductance values. However, we chose to maintain the relative ratios of the conductance sizes, which are approximately gampa:gnmda = 2:1 and gampa:ggaba = 1.4:1. Hence we tune only gampa, calculating the other two from the ratios. We emphasise that this fitting is highly non-trivial: the Moyer et al. (2007)
model contains 189 compartments, a full complement of active ion channel dynamics, internal calcium buffers and spiking, and distributed synaptic receptors: the effects acting on a single dendritic compartment are non-linear and complex. We are attempting to tune only a point model neuron’s synaptic conductance to replicate the relation between input and output firing rates for the dopamine-free conditions of the Moyer et al. (2007)
model.
We used a best-fit line through the f–f data of the base model from Moyer et al. (2007)
as our target. A linear regression of their data was an excellent fit (r2 = 0.98, p = 1.4 × 10⁻⁹, n = 11), confirming the remarkable linearity of their base MSN model’s response to spike train input. We assess our model’s fit to this best-fit line rather than the specific data-points because the input spikes were generated by stochastic processes both here and in Moyer et al. (2007)
, and so we could not guarantee exactly the same number of spike-events or the same ratio of negative and positive events. Each simulation was run for 5 s using Eqs 1, 2, 7 and 9, and the firing rate of the neuron computed from the last 4 s.
Stage 4: tuning the synaptic dopamine models
We took this complete, tuned, base MSN model and added the D1 and D2 intrinsic and synaptic models (respectively Eqs 3, 4 and 10, and Eqs 5 and 11) to make two further new MSN models – note that the parameters for intrinsic dopamine models were taken from the results in Stage 2. We tuned only the synaptic dopamine parameters (β1 and β2) to fit the corresponding f–f curves from the Moyer et al. D1 and D2 synaptic models (respectively, Stages 4a and 4b from Figure 1
). We used the same simulation protocol as for the third stage. Again, the output from our complete D1 and D2 neuron models was compared to the best-fit line through the f–f data from the equivalent multi-compartment model from Moyer et al. (2007)
. A linear regression produced an excellent fit to their data in both cases – D1 version (r2 = 0.99, p = 5 × 10⁻¹⁰, n = 11), D2 version (r2 = 0.93, p = 2 × 10⁻⁶, n = 11) – confirming that the dopamine-modulated versions of the multi-compartment MSN model retained the remarkable linearity of response to spike-train input.
Validation of model tuning
As a final validation, we also produce f–f curves for the intrinsic-only D1 and D2 models (those without the synaptic models) and compare to the corresponding curves from Moyer et al.’s model. As these have no free parameters, they are a strong test of the reduced models’ ability to reproduce the input–output characteristics of the multi-compartment models.
Probing the Models
Paired-pulse facilitation
We assessed paired-pulse facilitation (Mahon et al., 2000a
) using current pulses of 200 ms length, and 400 pA amplitude, at a range of inter-pulse intervals from [200, 1000] ms in 100 ms steps. Following Mahon et al. (2000a)
, we recorded time from onset of pulse to first spike peak for both first (t1) and second (t2) pulses. Paired-pulse facilitation was then quantified as Δt = t1 − t2: positive Δt thus indicated that the neuron spiked faster in response to the second pulse.
Spontaneously bimodal MSN membrane potential
Medium spiny neuron membrane potential bimodality can be reliably induced in vitro by the application of NMDA agonists to the slice’s bath (Vergara et al., 2003
; Carrillo-Reid et al., 2008
). We hypothesised that such a bimodality could arise for a particular model of NMDA agonist’s actions on the reduced MSN model. Our agonist model proposes that bath solution of NMDA agonist results in slow, irregular, activation of large groups of NMDA receptors, causing large conductance changes. The transmitter molecule remains locked into the NMDA receptor for the duration of the long-tail of an NMDA-receptor dependent post-synaptic current (Lester et al., 1990
; Lester and Jahr, 1992
), hence placing an upper limit of about 4 Hz per NMDA receptor (hence slow). We assume that the arrival of transmitter molecules at the receptors follows a Poisson process, and so can be modelled identically to the spike-trains above (hence irregular). We neglect in this model potential NMDA receptor desensitisation arising through the prolonged exposure to the NMDA agonist in the bath (Lester and Jahr, 1992
). Assuming at least one NMDA receptor per glutamate synapse, then there are between 5000 and 10,000 NMDA receptors on a single MSN (Zheng and Wilson, 2002
; Humphries et al., 2009
). Hence, each event at one of the 84 modelled NMDA synapses we interpret as the roughly simultaneous activation of large subsets of these in the bath of NMDA agonist. Thus we simulated NMDA agonist effects by providing a low frequency input of r ∈ {1, 2, 3, 4} Hz to the NMDA receptors and massively multiplying the NMDA conductance by m ∈ {50, 100, 150} to account for the number of receptors activated (giving an implied upper limit of 150 × 84 = 12,600 NMDA receptors). Beyond this upper limit of realistic m, the reduced MSN model showed an action potential trajectory inconsistent with normal neuron behaviour – an example is shown in Figure 8
. Background unpatterned input for GABA and AMPA receptors was provided exactly as detailed above (Stage 3) at mean rates of r = 4 spikes/s. Each simulation for a given NMDA receptor rate and multiplier was run for 5 s, and a membrane potential histogram of 1 mV bins constructed from the last 4 s.
We tested our further hypothesis that the bimodality arising from this agonist-effect model was due to the nonlinear gating of the NMDA current by the function B(v), which models the receptor blockade by magnesium ions. We ran two further sets of control simulations to show this. First, a set with the AMPA conductance multiplied instead, to show that the bimodality was not just due to massive irregular increases in excitatory synaptic current. Second, a set with the NMDA receptor blockade removed (and the multiplier scaled down), to show that the bimodality was not just due to the long time-course of the NMDA current. Each set consisted of 12 simulations, corresponding to the 12 combinations of (m, r) for the NMDA agonist model. In each control simulation, the multiplier m and input rate r were set so that the MSN model’s output matched the number of spikes output in the corresponding NMDA agonist simulation. Both m and r required adjusting to correctly match the changes in the number of spikes. For the AMPA-multiplier simulations, these were r ∈ {1.1, 1.7, 2.4, 3} Hz and m ∈ {3, 5, 7} (applied to the AMPA synapses; NMDA synapses received 4 Hz input); for the unblocked NMDA receptor simulations, these were r ∈ {0.6, 1, 1.4, 2} Hz and m ∈ {6.5, 12.5, 18}.
We also assessed the changes in bimodality with changes in dopamine receptor activation. A sum of two Gaussians was fitted to the histogram using MATLAB function
lsqcurvefit. As a measure of bimodality change, we computed the distance between the two peaks Dv = |μ1 − μ2|: for a single Gaussian distribution of membrane potential Dv→0.Simple MSN Models Accurately Capture Input/Output Properties of Complex Models
The reduced MSN model was tuned to fit the f–I and f–f curves from the corresponding multi-compartment models of Moyer et al. (2007)
, following the tuning procedure in Figure 1
. All final found parameters are summarised in Table 2
. First, we re-tuned the basic MSN model parameters to fit the f–I curve of the unmodified Moyer et al. model, using only the parameters C, d, and vt (Stage 1). We obtained a good fit to the f–I curve from the unmodified Moyer et al. model, shown in Figure 2
A (red lines and symbols). An example of the tuned neuron’s firing behaviour is shown in Figure 2
B. It has the MSN’s characteristic long delay to first spike after onset of current injection (Nisenbaum et al., 1994
).
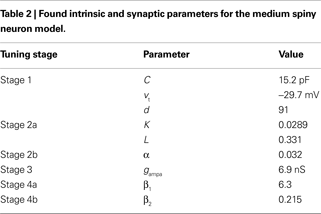
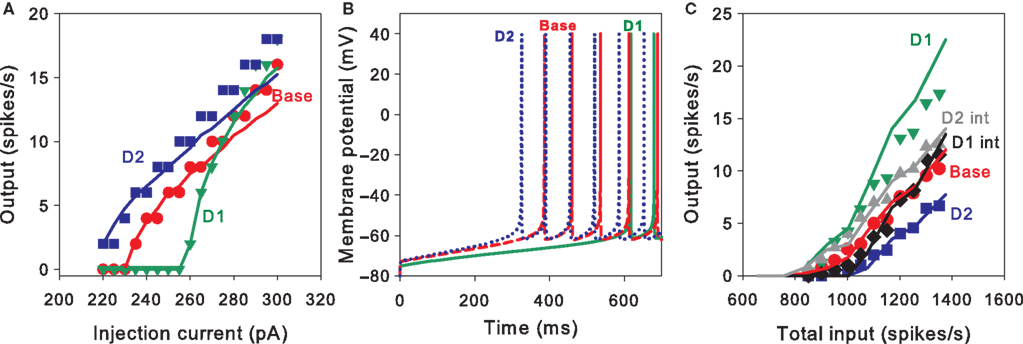
Figure 2. Tuning the MSN models. (A) Current–frequency (f–I) curves. Mean firing rate responses of no dopamine (red), D1-type (green) and D2-type (blue) striatal MSN models to current injection. Symbols are the f–I curves from the Moyer et al. (2007)
model. Solid lines are the corresponding f–I curves of our tuned neuron models (Stages 1, 2a and 2b): parameters C, d, and vt were tuned to fit the no dopamine f–I curve only; D1 model parameters K and L only were tuned to fit the D1-type f–I curve; D2 model parameter α only was tuned to fit the D2-type f–I curve. (B) Single neuron response to 270 pA current injection for the tuned basic MSN model (red, dashed), the addition of the D1 intrinsic model (green, solid), and the addition of the D2 intrinsic model (blue, dotted). Each shows the characteristic delay to first spike of the MSN, and are correctly ordered so that the activation of D2 receptors produces a spike faster than the dopamine-free model, which in turn is faster than the D1-receptor model. (C) Input frequency–output frequency (f–f) responses: no dopamine (red), D1-complete (green), and D2-complete (blue) striatal MSN models. Symbols are the f–f curves from the Moyer et al. model. Solid lines give the corresponding f–f curves of our tuned neuron models (Stages 3, 4a and 4b), again showing good matches to the responses from the multi-compartment model. Our intrinsic D1 (black) and D2 (grey) models also fit the f–f curves of their corresponding Moyer et al. models: the extent of these fits is surprisingly good, given that no tuning could be done for these fits.
Second, we took this tuned basic MSN model, added the D1 and D2 intrinsic models, and tuned their parameters to fit the corresponding f–I curves from the Moyer et al. (2007)
D1 and D2 intrinsic models (respectively, Stages 2a and 2b from Figure 1
). Figure 2
A shows that the fits achieved by the reduced MSN model are very good. The time-to-first-spike relationships were also well preserved by our model. Experimental data shows that D2 activation reduces the time to first spike, and D1 activation lengthens it (Moyer et al., 2007
). The single neuron responses to 270 pA injection in Figure 2
B show just this pattern.
Third, we took the baseline synaptic input model, and tuned the AMPA conductance to fit the f–f curve from the baseline (Moyer et al., 2007
) model (Stage 3). Figure 2
C shows that the fit with the Moyer et al. data was again very good (red line and symbols), using gampa = 6.9 nS (implying gnmda = 3.5 nS and ggaba = 4.9 nS given the above fixed ratios). We note that our baseline reduced neuron model also showed a clearly linear response to spiking input. We emphasise that the excellence of this fit is highly non-trivial: the Moyer et al. (2007)
model contains 189 compartments, a full complement of complex active ion channel dynamics, internal calcium buffers and spiking, and distributed synaptic receptors. We tuned only a point model neuron’s synaptic conductance to replicate the relation between input and output firing rates for the dopamine-free (Moyer et al., 2007
) model.
Fourth, we took this tuned base complete MSN model and added the complete D1 and D2 intrinsic and synaptic models (Stages 4a and 4b, respectively). The parameters for the synaptic models only (β1 and β2) were tuned to fit their respective f–f curves from the equivalent Moyer et al. models. Figure 2
C shows that the fits achieved by the reduced MSN models are again very good. For the D1 complete model, we found β1 = 6.3; for the D2 complete model, we found β2 = 0.22. Note that the synaptic effect of D1 activation requires a large enhancement of the NMDA conductance, whereas the synaptic effect of D2 activation requires a comparatively small reduction of the AMPA conductance. Again, both the dopamine-modulated versions of the reduced MSN model also showed a clearly linear response to spiking input.
Finally, we validated the tuned models by finding the f–f curves for the D1 and D2 intrinsic-only models. Despite having no parameters to tune – as these were already tuned to the f–I data – these both fitted the f–f curves of the equivalent (Moyer et al., 2007
) models very well (Figure 2
C).
All the fits are qualitatively excellent but the quantitative fits vary, some showing deviations for high input currents or rates. The quality of the fits is partially dependent on the choice of error metric. Using squared error, rather than relative error, can result in better fits at high input ranges, but equally to poorer fits at low input ranges, as this metric favours reducing error for larger magnitude data-points. The quality of the fits can also be improved by a different choice of starting parameter set at Stage 1. We found that if we include the slow current time-constant a, instead of the nominal capacitance C, then better fits occur, particularly for the f–I curves. However, these fits relied upon a considerable increase in the value of a, which equates to a much faster inactivation of the slow A-type potassium current. As a result, this tuned model was unable to show paired-pulse facilitation at all, similar to the result in Figure 4
B. Hence, even though the input–output fits were better, this model could not capture some basic properties of MSN behaviour.
The Reduced MSN Models Predict Smooth Interpolations of Dopamine’s Effects
Moyer et al. (2007)
only tested their multi-compartment models with and without dopamine receptor activation. We took advantage of our framework to predict the effects of different dopamine receptor activation levels on the response to current injection and to synaptic input. Thus, we determined the f–I curves and f–f curves for D1 and D2 receptor activation levels ranging between 0 and 0.8. The f–I curves used only the intrinsic D1 and D2 models; the f–f curves used the complete D1 and D2 models; all simulations used the parameter values in Tables 1 and 2
.
For the intrinsic D1 model, Figure 3
A shows consistent increases in both rheobase and f–I curve slope with increasing D1 activation. However, Figure 3
D shows that increasing D1 activation increases the output rate for a given synaptic input rate, with a simple interpolation between ϕ1 = 0 and ϕ1 = 0.8 responses. That is, only the slope of the output curve is increased, and not the effective rheobase. It seems the hyperpolarising effect of intrinsic ion channel activation by D1 receptors (Eq. 3) is obscured by the larger increase in NMDA conductance (Eq. 10). Thus, the complete D1 MSN model predicts that synaptic effects of D1 activation always dominate effects on the intrinsic ion channels.
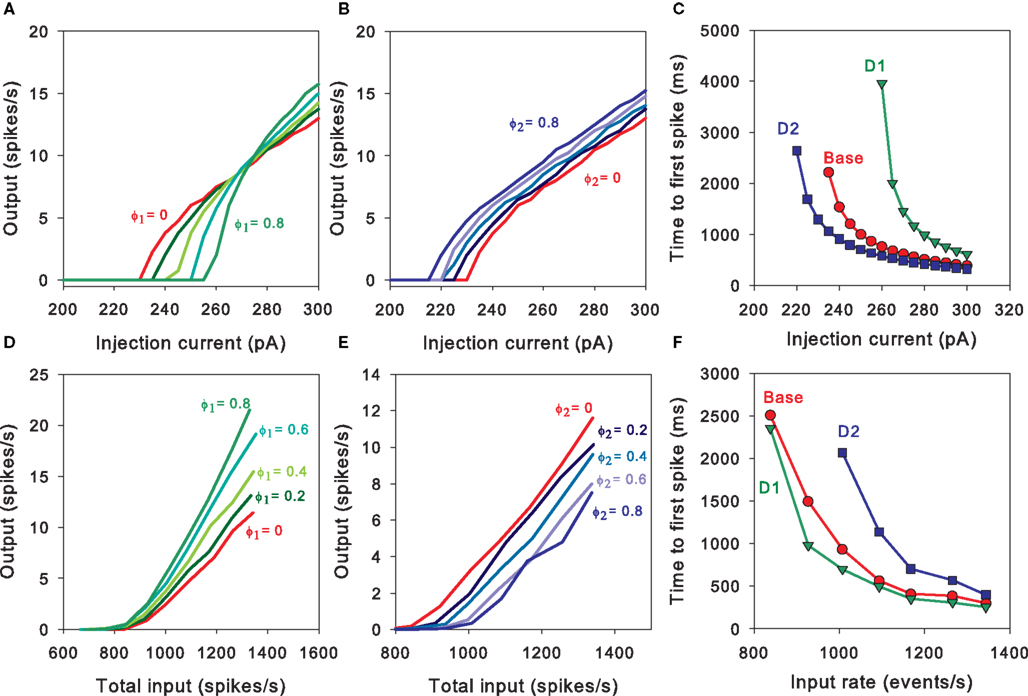
Figure 3. Predictions of the MSN models. (A) The D1 intrinsic model predicts a D1-activation dependent increase in effective signal-to-noise ratio of the MSN’s output. The f–I curves increase in slope, but the rheobase current is higher than baseline, hence the MSN’s output shows a higher signal-to-noise ratio than baseline. (B) The D2 intrinsic model predicts an orderly set of f–I curves that left-shift (decreasing rheobase, same slope) with increasing D2 activation. D2 activation of intrinsic ion channels is thus always facilitatory. (C) Time-to-first-spike across a range of injection currents for our tuned basic, D1-intrinsic, and D2-intrinsic MSN models. The models predict that the temporal order relationship D2 activation < basic model < D1 activation is maintained across a wide range of current injections, and converges at moderately large currents (shown for ϕ1 = ϕ2 = 0.8). (D) The D1 complete model predicts that increasing D1 activation from baseline consistently increases the sensitivity of the MSN to synaptic input. (E) The D2 complete model predicts that increasing D2 activation from baseline consistently decreases the MSN’s sensitivity to synaptic input. (F) Our complete models predict that the time-to-first-spike relationships are inverted for synaptic input compared to current injection (C), but similarly converge (shown for ϕ1 = ϕ2 = 0.8; points are averaged over 5 runs).
For the intrinsic and complete D2 models we found that the resultant f–I and f–f curves were simple interpolations between the ϕ2 = 0 and ϕ2 = 0.8 cases. Figure 3
B shows that increasing D2 activation simply translates the f–I curve to the left, lowering the rheobase current (as proved below). Figure 3
E shows that increasing D2 activation increased the synaptic input rate required to achieve a specific output rate. Thus, our models also predict that the synaptic effects of D2 activation always dominate the intrinsic effects.
These input–output differences between intrinsic and complete models are also reflected in the time-to-first-spike behaviour. Figure 3
C shows that the D2 < baseline < D1 timing relationship is maintained for the tuned intrinsic models across a wide range of injection currents. It also shows that the models predict a convergence of the time-to-first-spike for dopamine free, D1 activated, and D2 activated MSNs, at injection currents that are moderately larger than the rheobase. Conversely, Figure 3
F shows that the complete models predict the time-to-first-spike relationship is inverted for synaptic input: D1 < baseline < D2 for a given input rate.
Paired-Pulse Facilitation in the Reduced Models
A striking property of MSNs is their enhanced response to the second current pulse of a pair, even when delivered hundreds of milliseconds apart (Mahon et al., 2000a
). As this property may strongly affect the MSNs’ response to cortical input (Nisenbaum et al., 1992
; Mahon et al., 2000a
), we deemed it critical for our reduced models to show paired-pulse facilitation. Figure 4
A shows that the tuned baseline MSN model does indeed have clear paired-pulse facilitation in response to a pair of current pulses delivered 200 ms apart. Strikingly, this facilitation has the same dependence on pulse interval, and the same maximum interval of detectable response, as the in vivo data of Mahon et al. (2000a)
(see Figure 4
B).
Figure 4. Paired-pulse facilitation in the reduced MSN models. (A) The basic tuned MSN model shows paired-pulse facilitation to current pulses delivered 200 ms apart. The facilitation is quantified as the difference in time from onset of the pulse to the peak of the first spike: Δt = t1 − t2. (B) The amount of paired-pulse facilitation fell off exponentially with increasing inter-pulse interval, returning to baseline after 1000 ms. This replicates the fall-off and baseline-return time recorded in vivo by Mahon et al. (2000a)
– their data is replotted inset in grey. Increasing the effective inactivation time-constant of the A-type potassium channel (setting a = 0.02) strongly attenuates the paired-pulse facilitation (black line).
It is thought that the slowly inactivating A-type potassium current is mainly responsible for the paired-pulse facilitation effect, as well as the long time to first spike (Nisenbaum et al., 1994
; Mahon et al., 2000b
). In our reduced model, the u variable is putatively modelling the action of this current. If we double the effective time-constant of inactivation (setting a = 0.02), we indeed see that paired-pulse facilitation is drastically reduced (Figure 4
B).
The MSN Models are not Bistable
Our models of dopamine-modulated currents and synaptic inputs have produced excellent fits to data from a much more complex multi-compartment model, and are in turn consistent with a wide array of known effects of dopamine on real striatal MSNs. However, it is possible that, as the new intrinsic-effect models alter parameters of the basic Izhikevich neuron model, we have fundamentally changed its neurocomputational properties. In particular, Gruber et al. (2003)
have proposed that the emergence of dopamine-induced bistability in the MSN membrane potential can explain the switch between hyperpolarised and depolarised states observed in vivo under anaesthetic (Wilson and Kawaguchi, 1996
). Analysis of our models’ stability properties may throw light on this and other questions about the dynamics of MSNs.
We do this by applying dynamical systems theory (Strogatz, 1994
; Izhikevich, 2007
). Briefly, the dynamics of a two-dimensional system like Eqs 1 and 2 can largely be understood by analysing the properties of the system’s fixed points, and how these change as some parameters of the system are varied. Fixed points are the intersections of the system’s nullclines, the curves found by setting all the differential equations to 0. Thus, the fixed points give the values of all the system’s variables for which the system may be stable – though it may not be possible for the system’s variables to simultaneously arrive at all the values required to reach the fixed point.
We now employ this fixed point analysis, finding their stability properties for the basic model described by Eqs 1 and 2, and show that the changes we introduced for the D1 (Eqs 3 and 4) and D2 (Eq. 5) intrinsic models do not alter these over the plausible ranges of dopamine concentration and parameters specific to those models.
Fixed points
The fixed points of Eqs 1 and 2 occur when  namely for:
namely for:
By writing Eq. 13 as u = b(v − vr) and substituting into Eq. 12 we obtain a quadratic:

The values for v at the fixed points are thus the roots of Eq. 14, which from the standard formula are
Then, substituting Eq. 15 into Eq. 13, the u values at the fixed points are

In general, the number of fixed points depends on the injection current I: Eq. 15 has two distinct roots for I < I0, giving two fixed points; two repeated roots for I = I0, giving one fixed point; and no roots for I > I0, giving no fixed points. The key current value I0 is the solution to B(I0) = 0, namely:

Given the direction of increase of Eq. 1, we know that having no fixed points for I > I0 means that the neuron model will produce the up-stroke of the spike. The value of I0 is thus effectively the model neuron’s rheobase current
1
. We concentrate on values of I ≤ I0, to understand the types of fixed points at subthreshold current injections, and the change that occurs at I = I0.
Stability of fixed points
Understanding the types of fixed point is a two-step process. First, we find the Jacobian (matrix of partial derivatives) of the system, which gives the direction of change for each variable as a function of all the system’s parameters and other variables. For Eqs 1 and 2, we find the Jacobian:
and note that it only depends on v. Thus, we need only substitute the values of v from Eq. 15 into Eq. 18 to find the Jacobian at the fixed points of the model neuron:
Second, we determine the eigenvalues of the Jacobian at the fixed points. The signs and types (real, complex) of the two eigenvalues tell us whether or not the system can reach the fixed point, and how it behaves when moving toward or away from it. The fixed points are classified on this basis as a node or spiral, and either stable or unstable. Fixed points can also be of the “saddle” type. Nodes and spirals have real and complex eigenvalues, respectively; stable and unstable types correspond to all negative and all positive real parts, whereas saddle points correspond to one negative and one positive real part. (An explanation of the full classification, including further, rarer, types, is given in Strogatz, 1994
; Izhikevich, 2007
).
As it is two-dimensional, we can analytically determine the two sets of eigenvalues for Eq. 19 (one set per fixed point, corresponding to the choice of ±). The eigenvalue pairs λ1, λ2 of Eq. 19 solve the determinant equation:
The sign of the two eigenvalues can then be inferred from the result that a quadratic with roots x1, x2 is of the form (x − x1) (x − x2) = x2 − (x1 + x2)x + x1x2. This implies that
The neuron model given by Eqs 1 and 2 must always have  . Therefore, we can see immediately from Eq. 22 that one fixed point (corresponding to the choice of + in Eq. 21 and − in Eq. 22) must have one positive and one negative eigenvalue: it is thus always a saddle.
. Therefore, we can see immediately from Eq. 22 that one fixed point (corresponding to the choice of + in Eq. 21 and − in Eq. 22) must have one positive and one negative eigenvalue: it is thus always a saddle.From Eq. 20, the condition that the eigenvalues are real at a fixed point is

The condition that the second fixed point is a node thus becomes, after some algebra,

When b < 0, as for the MSN model, this inequality is always satisfied: the second fixed point is a node. From Eq. 21, the second fixed point is stable (has negative eigenvalues) if:

When b ≤ aC (including also b < 0) this relation is always satisfied. Therefore, the second fixed point is always a stable node. Figure 5
A illustrates these fixed point types at the intersection of the nullclines on the (v, u) phase-plane.
Figure 5. Stability of the MSN model’s fixed points. (A) Without injection current, two fixed-points are defined by the intersection of the v-nullcline (solid) and the u-nullcline (dashed). The first is a stable node (filled square); the second is a saddle (open square). (B) Increasing injection current causes a saddle-node bifurcation. The MSN model always had two fixed points: a stable node (solid line) and a saddle (dashed line). The point where these curves meet (black dots) corresponds to the bifurcation point I0. At higher currents, there are no fixed points, and the neuron model spikes – hence I0 is also the rheobase current. We can see that the two dopamine models do not alter the fixed point structure, but rather translate the fixed-point trajectories so that I0 occurs at higher (D1 model) or lower (D2 model) injection currents. These curves were obtained for the particular set of MSN model parameters used in this paper, and were plotted using I as a function of v from: baseline model, Eq. 14; D1 model, Eq. 14 with vr ← vr(1 + Kϕ1); D2 model, Eq. 14 with k ← (1 − αϕ2)k. Dopamine levels were ϕ1 = ϕ2 = 0.8.
We have shown that any model of the form Eqs 1 and 2 with b < 0, such as the MSN model, has two fixed points when the injection current is less than I0: one always a saddle, one always a stable node. The disappearance of this fixed point pair at I = I0 is a saddle-node bifurcation: thus I0 is both the rheobase current and the bifurcation point (Figure 5
B). We now look at how these properties are affected by the dopamine model extensions.
Effects of the dopamine models on the stability properties
We begin with the D1 MSN model given by Eqs 3 and 4. We need only consider here changes due to Eq. 3 to establish the membrane potential stability properties, as Eq. 4 modifies only the slow-current reset after spiking. Hence, we write 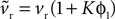 and make the replacement
  in Eqs 12–25. As ϕ1 ∈ [0, 1] and we expect K > 0 – confirmed by the search results – then
  Given that k > 0 and b, vt < 0, this has two effects. First, from Eq. 17, that increasing ϕ1 will always increase the rheobase current I0, as shown in Figure 3
A. Second, as none of the key criteria for fixed point type and stability (Eqs 21–25) depend on vr, the fixed points are still a stable node and a saddle. For, while
Given that k > 0 and b, vt < 0, this has two effects. First, from Eq. 17, that increasing ϕ1 will always increase the rheobase current I0, as shown in Figure 3
A. Second, as none of the key criteria for fixed point type and stability (Eqs 21–25) depend on vr, the fixed points are still a stable node and a saddle. For, while  changes the magnitude of B in Eq. 15, it is only the choice of sign of B that is important. The addition of the D1 intrinsic model changes neither the number nor type of fixed points.
and make the replacement in Eqs 12–25. As ϕ1 ∈ [0, 1] and we expect K > 0 – confirmed by the search results – then Given that k > 0 and b, vt < 0, this has two effects. First, from Eq. 17, that increasing ϕ1 will always increase the rheobase current I0, as shown in Figure 3
A. Second, as none of the key criteria for fixed point type and stability (Eqs 21–25) depend on vr, the fixed points are still a stable node and a saddle. For, while changes the magnitude of B in Eq. 15, it is only the choice of sign of B that is important. The addition of the D1 intrinsic model changes neither the number nor type of fixed points.The effect of the D2 intrinsic model given by Eq. 5 is also immediately evident. We write 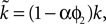 and make the replacement
  in Eqs 12–25. As we define ϕ2 ∈ [0, 1], and expect α ∈ [0, 1] (confirmed by the search results – Table 2
), then
in Eqs 12–25. As we define ϕ2 ∈ [0, 1], and expect α ∈ [0, 1] (confirmed by the search results – Table 2
), then  Therefore, we can see: from Eq. 17 that increasing ϕ2 decreases I0 (as promised in our description of the model (Eq. 5); this effect of the intrinsic D2 model is shown by the f–I curves in Figure 3
B); from Eq. 22 that the first fixed point is still a saddle; and from Eqs 24 and 25 that the second fixed point is still a stable node. The addition of the D2 intrinsic model changes neither the number nor type of fixed points.
Therefore, we can see: from Eq. 17 that increasing ϕ2 decreases I0 (as promised in our description of the model (Eq. 5); this effect of the intrinsic D2 model is shown by the f–I curves in Figure 3
B); from Eq. 22 that the first fixed point is still a saddle; and from Eqs 24 and 25 that the second fixed point is still a stable node. The addition of the D2 intrinsic model changes neither the number nor type of fixed points.
and make the replacement in Eqs 12–25. As we define ϕ2 ∈ [0, 1], and expect α ∈ [0, 1] (confirmed by the search results – Table 2
), then Therefore, we can see: from Eq. 17 that increasing ϕ2 decreases I0 (as promised in our description of the model (Eq. 5); this effect of the intrinsic D2 model is shown by the f–I curves in Figure 3
B); from Eq. 22 that the first fixed point is still a saddle; and from Eqs 24 and 25 that the second fixed point is still a stable node. The addition of the D2 intrinsic model changes neither the number nor type of fixed points.We see no effect of the dopamine models on the type of subthreshold dynamics of the MSN model. In both cases, for the full range of dopamine receptor activations (ϕ1, ϕ2) and the expected range of values for the models’ variables, the fixed points remain a saddle and a stable node. In Figure 5
B we illustrate how the dopamine receptor activation translates the fixed-points as a function of the injection current, but does not change their type or number. Rather, the principal effect of dopamine activation is to change I0. Thus, regardless of the choice of parameter values (within realistic bounds) for the basic model or dopamine models, our MSN models show no bistability.
Massively Increasing NMDA Receptor Activation can Induce MSN Bimodality
Recent in vitro studies have reported MSN membrane potential bimodality appearing spontaneously after application of NMDA agonists (Vergara et al., 2003
; Carrillo-Reid et al., 2008
). The bimodal behaviour resembles that seen under anaesthetic in vivo (Wilson and Kawaguchi, 1996
), but the up/down transitions are irregular, and the up-state durations are highly variable. This bimodality is characterised by two distinctive peaks in the membrane potential histogram – an example from Carrillo-Reid et al. (2008)
is redrawn in Figure 6
A – corresponding to a “down-state” of between −80 and −70 mV, and an “up-state” of around −55 mV (Vergara et al., 2003
; Carrillo-Reid et al., 2008
). Its dependence on NMDA receptor activation has led these researchers to name this phenomenon “dendritic bistability”. However, we show here a possible mechanism for this NMDA-dependent membrane potential bimodality in the absence of any bistability.
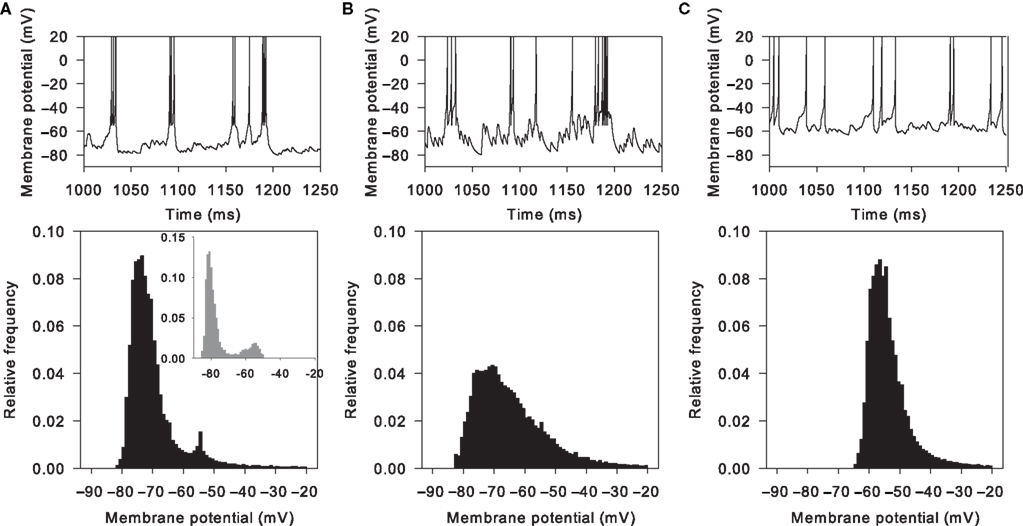
Figure 6. Massive NMDA conductance increase causes spontaneous bimodality of model MSN membrane potential. Top row: membrane potential traces from 250 ms of simulation. Bottom row: corresponding histograms of membrane potential values for 4 s of the simulation. (A) Tuned baseline MSN model can show a spontaneously bimodal membrane potential, with an NMDA agonist model that assumes slow, irregular, massive increases in NMDA conductance (here m = 100, r = 4 Hz). The resulting membrane potential histogram clearly shows a bimodal distribution, with similar peak centres to those observed in the in vitro studies (inset; histogram redrawn from Carrillo-Reid et al., 2008
). (B) Multiplying AMPA conductance instead to achieve the same number of spikes does not similarly cause bimodality in the membrane potential (using m = 5, r = 3 Hz for the AMPA synapses, giving approximately the same total number of spikes as in panel A). (C) Removing the NMDA receptor blockade (Eq. 9) also prevented bimodality in the membrane potential (using m = 12.5, r = 2 Hz for the NMDA synapses, giving approximately the same total number of spikes as in (A)).
We simulated the effect of NMDA agonist by multiplying the NMDA synaptic conductance (see Materials and Methods). Figure 6
A shows that large multipliers (∼100 − 150×) applied to the basic, tuned MSN model result in spontaneous jumps between hyperpolarised and depolarised membrane potentials, in the absence of similarly patterned synaptic input. We hypothesised that this behaviour was due to the simulated voltage-dependent blockade of NMDA receptors by Mg2+ ions. Consistent with this, we found that simply multiplying the AMPA conductance to achieve the same number of spikes did not cause membrane potential bimodality (Figure 6
B). Similarly, removing the voltage-dependent blockade of NMDA receptors (Eq. 9) also removed the membrane potential bimodality (Figure 6
C). The absence of the distinctive bimodality was observed for all tested equivalent conductance multipliers (see Materials and Methods) of AMPA and of unblocked NMDA receptors. Hence, rather than some form of “dendritic bistability”, the observed bimodality could result entirely from the voltage-dependent blockade of NMDA receptors.
We also found that increasing D1 activation increased the bimodality of the membrane potential, as the distance between the two membrane potential peaks in the histogram (as measured by Dv – see Materials and Methods) monotonically increased with increasing D1 activation. This reflects the more hyperpolarised resting potential with increasing D1 activation (Eq. 3). At the same time spiking during the depolarised phases was enhanced, reflecting the increased sensitivity to NMDA-based post-synaptic potentials (Eq. 10). Conversely, increasing D2 activation had no effect on the bimodality.
How then does this bimodality arise from the combination of NMDA conductance amplification and receptor blockade? The maintenance of a depolarised up-state of the membrane potential comes from two other sources: after each spike the membrane potential resets to −55 mV (model parameter c), and the ongoing depolarisation of the neuron from the synaptic input can cause the membrane potential to remain in that region, maintaining the up-state. Both of these effects are also clear in the membrane potential trace and corresponding histogram following massive AMPA conductance increase (Figure 6
B). The characteristic difference of the NMDA agonist simulations (and the experimental data) is the little time spent at intermediate membrane potentials when moving from down-to-up states.
Figure 7
illustrates how the combination of massive NMDA conductance and receptor blockade causes the rapid, spontaneous, down-to-up-state transition. The receptor-gating function B(v) is an exponential function of the membrane potential voltage (Figure 7
A). Hence, small voltage increases non-linearly increase the NMDA current drive of the membrane potential. The massive increase in NMDA conductance in the simulations here in turn amplifies this non-linear effect. We can see this when looking closely at the inputs and variables of the MSN model in the 10 ms before the initial spike of an up-state (Figures 7
B,C). Each small increase in excitatory synaptic current depolarises the membrane potential, in turn increasing B(v) and decreasing the gating of the NMDA current. At some critical level of excitatory synaptic current, a small rise increases B(v) sufficiently that the additional NMDA current causes v to increase more than the synaptic current subsequently decays (we leave the determination of the exact level of the critical depolarisation to future work, as it clearly has a complex dependence on the history of synaptic input). From that point, B(v) and v form a positive feedback loop, each rise in one causing a rise in the other, and the membrane potential rapidly rises to a depolarised state and spikes. For the illustrated spike, we can identify the small cluster of receptor events between 4 and 2 ms before the spike peak as the source of the critical depolarisation. If we delete any one of those events then the feedback process is not initiated and the membrane remains at the down-state.
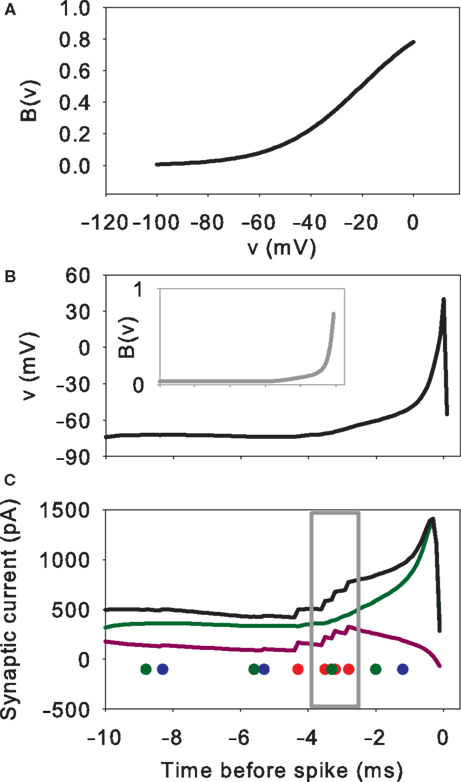
Figure 7. Mechanism of rapid down-to-up state membrane potential jump through NMDA conductance amplification and receptor blockade. (A) NMDA current gating function B(v). (B) Example spike peak and preceding 10 ms of membrane potential. Inset shows corresponding time-course of B(v). (C) Synaptic currents and receptor events during that 10 ms. We plot the gated NMDA current (B(v)Inmda; green), the sum of AMPA and GABAa currents (Iampa + Igaba; purple), and resulting total synaptic current (black). The dots indicate the time of synaptic events: NMDA (green), AMPA (red), and GABA (blue). Single synaptic events cause very small deflections in the membrane potential voltage in the down-state (e.g. between 10 and 8 ms before the spike). A cluster of excitatory synaptic events (grey box) can sufficiently increase the membrane potential to set off a positive feedback loop between v and B(v)Inmda: beyond this point, each increase in v increases B(v)Inmda, which in turn increases v, and so on. The feedback is terminated when the voltage nears or crosses the reversal potential for NMDA, at 0 mV in this model. Hence, the membrane potential appears to move between two regimes, even if the neuron is not intrinsically bistable. The irregularity of the up/down transitions in the model is due to the random occurrence of sufficiently-depolarising clusters of synaptic events: if any of the events within the grey box is manually removed from the simulation, the spike fails to occur.
We could directly compare the NMDA agonist model results to the control simulations using multiplied conductances for AMPA or unblocked NMDA receptors only up to the limits of normal behaviour by the model under massive NMDA conductance increase
2
(for us, m = 150 at r = 4 Hz). Increasing the NMDA conductance multiplier further reveals a clear limitation of using a reduced model. We observed occasional action potentials with prolonged voltage wanderings just before the spike peak (Figure 8
). This is a consequence of using NMDA reversal potentials in a point model, directly coupling membrane polarisations by synaptic events to the generation of action potentials. Once the membrane potential has risen above the NMDA reversal potential all subsequent NMDA events become inhibitory, and the massive NMDA conductance multiplier makes the effect large enough to delay the action-potential up-stroke. We have also observed this effect if the NMDA events are occurring at a very high rate (>100 Hz) with a much smaller multiplier.
Figure 8. Disrupted spike behaviour in the reduced models with massive excitatory conductance. Applying too large a multiplier to the NMDA conductance causes the voltage trajectory to wander just before a spike peak. This example uses m = 200 and r = 4 Hz. (A) A 250 ms segment of membrane potential, showing bursts of rapid spiking separated by inter-burst voltages near spike peaks. (B) Replotting the segment along the black bar in panel A shows an example of the membrane potential rapidly depolarising towards the spike peak but interrupted by a prolonged period of membrane potential fluctuation. These periods are due to one or more NMDA receptor events occurring after the membrane potential has passed the NMDA reversal potential (here 0 mV). With the massively increased conductance, the events have a significant inhibitory effect on the membrane potential, delaying its rise. However, the spike-peak is eventually reached, as the model has no stable states under this level of equivalent current injection (see Stability of Fixed Points).
We have proposed a framework for modelling dopaminergic modulation of MSN intrinsic and synaptic ion channels within the canonical neuron model recently introduced by Izhikevich (2007)
. Using a principled procedure that minimised the number of free parameters at each stage, we showed that the neuron model and our extensions to it could provide excellent fits to both current-injection and spike-input response curves from a 189-compartment model of the MSN (Moyer et al., 2007
), across all of the dopamine-free, D1, and D2 receptor configurations of the two models. Given the comparative complexities of the two models, the extent of the correspondence is quite remarkable. The procedure we adopted here, as outlined in Figure 1
, is generally applicable for modelling neuromodulation of any neuron type expressed in the Izhikevich (2007)
formalism.
That is not to say such multi-compartment models are thus somehow redundant. Rather, we were fortunate that Moyer et al. (2007)
had produced such an excellent update of their multi-compartmental model of the MSN in time for us to do this work. We note that this is an example of the ideal use of such complex neuron models: that they be used as the “gold-standard” against which we must validate our reduced models. We have also illustrated the limitations of such reduced models here. The fits to the input–output data, though all qualitatively excellent, were off in the large input-range for some models. A further limitation was that the tuned models showed pathological spiking behaviour if the NMDA conductance was made too large.
Changing the fitting error metric did not consistently improve the fits to the input–output curves; changing the initial parameters selected for the baseline model tuning did, but resulted in a model that could not show the fundamental MSN-like property of paired-pulse facilitation. It is certainly possible that better fits to the f–f curves could be obtained if we had relaxed some of the restrictions we placed on the parameters available for tuning. We maintained the ampa:nmda and ampa:gaba conductance ratios from the Moyer et al. (2007)
model, as these were based on available experimental data; but different interpretations of the experimental data suggests quite a range of potential ratios for ampa:nmda (Hjorth, 2009
). Similarly, we modeled only D1 effects on NMDA-receptor potentials and D2 effects on AMPA-receptor potentials, again following currently available data (Moyer et al., 2007), but it would not be surprising if it turned out that D1 activation had short-term effects on AMPA receptors and D2 activation had short-term effects on NMDA receptors (Surmeier et al., 2007
).
Effects of Dopamine on the Input–Output Response of MSNs
Our combination of numerical and analytical results allow us to reach a set of novel insights about dopamine’s effects on the computations of the MSN. The simplest models of dopamine’s actions propose that dopamine respectively facilitates or attenuates cortical input to D1 and D2 MSNs (Albin et al., 1989
; Gurney et al., 2001
), partly based on the observed effects on their target structures. We have seen that this simple mapping is true for both D1 and D2 complete models. In particular, our models predict that these effects remain consistent over the whole range of receptor activation.
However, this simple story hides the complexity of the interactions between intrinsic and synaptic effects of dopamine. The clean facilitation and attenuation were only seen when combining the synaptic and intrinsic effects together. Our model predicts that D2 receptor dependent effects on intrinsic ion channels are always facilitatory – analytically, we showed that D2 receptor activation did indeed increase sensitivity to input by reducing the rheobase current I0. Yet our model also predicts that D2 intrinsic effects are always dominated by synaptic effects for any level of receptor activation, and hence the ultimate response to synaptic barrage is attenuation. Our model for the intrinsic D2 effects was derived from Moyer et al. (2007)
, whose model predicted that the combined effect of D2 activation on fast sodium, A-type potassium, and L type calcium currents was increased sensitivity to input. By contrast, Hernandez-Lopez et al. (2000)
reported that adding D2 agonist to striatum in vitro reduced sensitivity to input and right-shifted the f–I curve. We can simply capture this effect by reversing the sign of the D2 intrinsic model, and hence increasing the rheobase current I0 (from Eq. 17). Then both intrinsic ion channel and synaptic effects of D2 activation would reduce the sensitivity of the MSN, removing some complexity from the story.
For D1 receptor activation the story is more complex. Others have proposed qualitative models for how D1 activation inhibits MSNs when already hyperpolarised but excites MSNs when already depolarised, whether through current injection (Hernandez-Lopez et al., 1997
) or synaptic input (Nicola et al., 2004
). These are all variants on the original hypothesis that dopamine acts to increase its target neuron’s signal-to-noise ratio (Servan-Schreiber et al., 1990
). We showed (Figure 3
A) that our D1 intrinsic model predicts simultaneous increases in the slope of the f–I curve and of the effective rheobase current following D1 activation. In other words, increasing D1 activation would increase the signal-to-noise ratio of the D1 MSN: the neuron stops responding to weak inputs, but increases its response to strong inputs.
It is not clear that there is a realistic scenario in which these intrinsic effects of D1 receptor activation are relevant. Our models predict that the signal-to-noise ratio effect would be partly or wholly obscured under synaptic barrage for high D1 receptor activation. For, while increasing D1 activation did increase the output for a given input rate, the quantity of synaptic events required to initiate spiking – equivalent to the rheobase current – did not markedly change (Figure 3
D). This highlights the difficulties of extrapolating from models that do not consider dopaminergic modulation of synaptic input (Gruber et al., 2003
). The loss of the signal-to-noise effect is robust for the MSN and D1 models fitted to the Moyer et al. (2007)
model’s input–output behaviour. However, synaptic input could reliably cause a signal-to-noise change if dopamine has a less dramatic effect on NMDA receptor potentials: for example, halving the value of β1 restores the simultaneous increase in the f–f curves’ slope and the synaptic input rate required for output with increasing D1 activation. There may be also a more nuanced role for the effects of dopamine on intrinsic ion channels: further work using this framework will explore possible distinct roles of tonic and phasic dopamine release, and the implications of the relative affinities of D1 and D2 receptors (Richfield et al., 1989
).
Dynamic Properties of the MSN
The tuned baseline MSN model showed the delayed first spike at time-scales of up to several thousand milliseconds, consistent with those recorded in vitro (Nisenbaum et al., 1994
). Our dopamine models predicted that D1 and D2 activation would respectively lengthen and reduce the time-to-first spike for a given magnitude of current injection. Conversely, these effects were reversed for the mean time-to-first-spike in response to synaptic input. Similarly, the magnitude and time-scale of the reduced model’s paired-pulse facilitation replicated prior experimental data (Mahon et al., 2000a
). Our model could also show the facilitation’s putative dependence on the slow A-type potassium current (Mahon et al., 2000b
). Doubling a – the effective inactivation time constant for the current – drastically reduced the facilitation effect.
We addressed the hypothesis that the switch between hyperpolarised and depolarised states observed in vivo (Wilson and Kawaguchi, 1996
) was due to the inherent bistability of the MSN membrane potential, and that this bistability may be induced by dopamine (Gruber et al., 2003
). We showed that the basic MSN model given here was not bistable, and adding dopaminergic modulation does not introduce bistability. Further, our analysis showed this to be true for the whole class of neurons (i.e. those for b < 0) and dopamine models that we introduced, regardless of specific choices of parameter values. Hence the lack of dopamine-induced bistability is not trivial: had we chosen a model of dopamine receptor activation that increased b > 0, then indeed dopamine would change the stability properties of the model MSN. Nonetheless, we could fit the input–output behaviour of the dopamine-modulated (Moyer et al., 2007
) model with our simpler interpretations of dopamine’s known effects. These results reinforce the numerical demonstrations by Wolf et al. (2005) and Moyer et al. (2007)
that their multi-compartment MSN model was unlikely to be bistable. We thus support their conclusion that the bimodality observed in the MSN membrane potential in vivo (Wilson and Kawaguchi, 1996
) is imposed from the patterning of afferent input under anaesthetic, as suggested in experiments by Mahon et al. (2001) and Kasanetz et al. (2002)
.
We could induce spontaneous membrane potential bimodality to unpatterned input by increasing NMDA receptor conductance. Recent in vitro studies have claimed that NMDA agonists cause “dendritic bistablity” in MSNs (Vergara et al., 2003
; Carrillo-Reid et al., 2008
). However, we obtained bimodal membrane potential distributions under NMDA-agonist like conditions, with no bistability of the neuron involved. Rather than “dendritic bistability”, the bimodality was entirely due to the voltage-dependent blockade of the NMDA receptors. Hence our results predict that the spontaneous bimodality would not reliably appear in vitro using a Mg2+-free preparation. We also predict that D1 receptor activation would enhance the NMDA-dependent spontaneous bimodality, through its simultaneous enhancement of NMDA receptor induced synaptic potentials and of the hyperpolarising inwardly rectifying potassium current.
Conclusions
This work has successfully established biologically realistic reduced models of striatal MSNs and their modulation by dopamine. They fulfill our original aim of being sufficiently simple to embed in large-scale models of the striatal network (Humphries et al., 2009
). Yet the MSN models are remarkably accurate in their replication of input response data from experimental and multi-compartmental modelling studies. Of course, new experimental data, and new modelling challenges, are constantly appearing. Recent work using transgenic mice suggests further differences between D1 and D2 expressing MSNs. The D1 MSNs may be larger than D2 MSNs, supporting more dendritic trees, and hence are less sensitive to injection current (Gertler et al., 2008
) – our analysis shows that one way for the reduced models to capture this property is by assigning different initial k values to the D1 and D2 MSNs. Further, while dopamine has long been known to modulate spike-timing dependent plasticity at cortico-striatal synapses, work on the same mouse lines suggests strong asymmetry in the effects of D1 and D2 activation (Shen et al., 2008
). Our models provide a basis for exhaustive study of the interplay between dopamine’s effects on synaptic plasticity and on the post-synaptic neuron. More generally, our extensions to the Izhikevich formalism provide a tractable framework for further studies of dopamine’s effects on the computations carried out by striatal neurons.
The authors declare that the research was conducted in the absence of any commercial or financial relationships that could be construed as a potential conflict of interest.
We thank Jason Moyer for generously sending us the input–output data from the multi-compartment medium spiny neuron model. This work was supported by the EU Framework 6 Project IST-027819-IP (MH); EPSRC Research Grant EP/C516303/1 (RW, KG); and the CARMEN e-science project (www.carmen.org.uk
) funded by the EPSRC (EP/E002331/1) (NL, KG).
The Supplementary Material for this article can be found online at http://www.frontiersin.org/computationalneuroscience/paper/10.3389/neuro.10/026.2009/
- ^ So long as b < 0 (see Izhikevich, 2007 ).
- ^ We argue in the Methods that these limits at m = 150 and r = 4 Hz are anyway the maximum realistic values of these parameters. Nonetheless, we can of course multiply the AMPA conductance further still, beyond the testable ‘equivalent’ range set by the realistic behaviour of the MSN model during NMDA agonist simulation. However, if we do so no bimodality emerges. The model, as expected, increases it spiking output and hence grows the histogram peak corresponding to the reset potential at −55 mV. However, the clean transition between down-and-up states, with little time spent at intermediate voltages, does not arise.
Bolam, J. P., Bergman, H., Graybiel, A. M., Kimura, M., Plenz, D., Seung, H. S., Surmeier, D. J., and Wickens, J. R. (2006). Microcircuits in the striatum. In Microcircuits: The Interface Between Neurons and Global Brain Function, S. Grillner and A. M. Graybiel, eds (Cambridge, MA, MIT Press), pp. 165–190.
Ferro, M. M., Bellissimo, M. I., Anselmo-Franci, J. A., Angellucci, M. E. M., Canteras, N. S., and Cunha, C. D. (2005). Comparison of bilaterally 6 OHDA- and MPTP-lesioned rats as models of the early phase of parkinson’s disease: histological, neurochemical, motor and memory alterations. J. Neurosci. Methods 148, 78–87.
Hernandez-Lopez, S., Tkatch, T., Perez-Garci, E., Galarraga, E., Bargas, J., Hamm, H., and Surmeier, D. J. (2000). D2 dopamine receptors in striatal medium spiny neurons reduce L-type Ca2+ currents and excitability via a novel PLC[beta]1-IP3-calcineurin-signaling cascade. J. Neurosci. 20, 8987–8995.
Wolf, J. A., Moyer, J. T., Lazarewicz, M. T., Contreras, D., Benoit-Marand, M., O’Donnell, P., and Finkel, L. H. (2005). NMDA/AMPA ratio impacts state transitions and entrainment to oscillations in a computational model of the nucleus accumbens medium spiny projection neuron. J. Neurosci. 25, 9080–9095.