Shapley ratings in brain networks
- 1 Department of Cognitive Neuroscience, Radboud University Nijmegen Medical Centre, The Netherlands
- 2 Institute of Anatomy II, Heinrich Heine University, Germany
- 3 Vogt Brain Research Institute, Heinrich Heine University, Germany
- 4 Department of Computer Science, Heinrich Heine University, Germany
- 5 Department of Psychological and Brain Sciences, Indiana University, USA
Recent applications of network theory to brain networks as well as the expanding empirical databases of brain architecture spawn an interest in novel techniques for analyzing connectivity patterns in the brain. Treating individual brain structures as nodes in a directed graph model permits the application of graph theoretical concepts to the analysis of these structures within their large-scale connectivity networks. In this paper, we explore the application of concepts from graph and game theory toward this end. Specifically, we utilize the Shapley value principle, which assigns a rank to players in a coalition based upon their individual contributions to the collective profit of that coalition, to assess the contributions of individual brain structures to the graph derived from the global connectivity network. We report Shapley values for variations of a prefrontal network, as well as for a visual cortical network, which had both been extensively investigated previously. This analysis highlights particular nodes as strong or weak contributors to global connectivity. To understand the nature of their contribution, we compare the Shapley values obtained from these networks and appropriate controls to other previously described nodal measures of structural connectivity. We find a strong correlation between Shapley values and both betweenness centrality and connection density. Moreover, a stepwise multiple linear regression analysis indicates that approximately 79% of the variance in Shapley values obtained from random networks can be explained by betweenness centrality alone. Finally, we investigate the effects of local lesions on the Shapley ratings, showing that the present networks have an immense structural resistance to degradation. We discuss our results highlighting the use of such measures for characterizing the organization and functional role of brain networks.
Introduction
Numerous biological and artificial networks can be conceptualized as graphs of vertices connected by directed or undirected edges. The application of graph theory to such networks provides a principled understanding of structural features such as connectedness, “reachability,” motif composition, or degree distribution, which characterize these networks and help to predict their functional properties (for reviews see Hilgetag et al., 2002 ; Sporns, 2003 ; Sporns et al., 2004 ). In graphs that are neither completely random nor entirely regular, it is interesting to characterize not only the overall network properties but also the features of individual vertices, their contribution to the overall network, and the network effects of their removal or insertion (Kaiser and Hilgetag, 2004 ; Kötter and Stephan, 2003 ; Sporns and Kötter, 2004 ). Assessing the contribution of individual nodes is a focus in game theory where the overall success of coalitions can be decomposed into the putative contributions of individual players in the game (Osborne and Rubinstein, 1994 ).
In this paper, we introduce the concepts of game theory to the analysis of graphs derived from brain networks. First, we briefly define the Shapley function, which is used to assign Shapley values to individual contributors. Second, we give an intuitive description of how the concepts of Shapley function and Shapley values can be mapped to brain networks. Third, we recall a formal method for calculating Shapley values in neural networks and explain the meaning of specific values. Fourth, we devote a larger section to examples using connectivity matrices from specific interregional networks of the primate brain where we have calculated the Shapley values. We compare the effect of existing versus non-existing edges in the network, as well as specific networks versus random controls. Next, the relation of Shapley values to other network indices, such as cluster coefficients and betweenness centrality, is studied. Finally, we investigate the use of Shapley values in lesion analysis of brain networks. We conclude that our notion of Shapley values in brain networks adds a new point of view to structural network analysis that is related to “connectedness” and the identification of network “hubs” (Sporns et al., 2007 ). In the future, Shapley value analysis promises to be particularly useful in the investigation of lesion effects where it may have a functional counterpart (Aharonov et al., 2003 ; Keinan et al., 2004 ).
Materials and Methods
The Shapley function
One approach to analyzing the contributions of individual nodes to overall network connectivity is the assignment of so-called Shapley ratings (here interchangeably also referred to as Shapley values). Originally conceived by game theorist Shapley (1953) , the Shapley value is a means of fairly portioning the collective profit attained by a coalition of players, based upon the relative contributions of the players to that profit. More formally, we can consider N to be a set of players in some game, S ⊆ N to be a subset of players forming a coalition within this game, and f : P(N) ⇒ R to be the function that assigns a real numbered profit to the subset S of players. Abstractly, f is referred to as a characteristic function; in this context, the characteristic we are interested in is a network's connectivity. By definition, for any f, f(Ø) = 0, where Ø is the empty set. A Shapley value is assigned by the Shapley function Φ : N ⇒ R, which associates each player in N with a real number and which is uniquely defined by the following axioms (Shapley, 1953 ):
- Efficiency: all profits must be distributed:
 .
. - Symmetry: the ordering of the players i and j has no influence on their Shapley values: φf(i) = φf(j).
- Additivity: the collective profits of two games, defined by characteristic functions f and g, are mutually exclusive. The Shapley values obtained from two separate games are thus independent, and the values must be added player by player φf+g = φf + φg.
The determination of the value of φ can be conceived intuitively as follows. Suppose π is a permutation of the set of players N. In other words, if all players lined up, π represents one possible ordering of players in this queue. Suppose also that, for a given π, player i is part of the coalition that consists of all players standing in front of him in this queue. That is, if pπi represents the subset of players preceding i in the queue π, then the contribution of player i to this coalition is the profits of the coalition including him less the profits of the coalition without him. As a formula
This particular distribution scheme would be quite unfair if only applied to a single permutation of N, since the payoffs are dependent only upon the composition of the queue preceding player i, and are thus not truly representative. However, Shapley showed that if this value is calculated as an average over the set, denoted Π, of all possible permutations of N (of which there are |N|!), the result is a fair distribution of value according to the contribution as determined by f, and it obeys the three axioms outlined above. The Shapley function for a characteristic function f is thus given by
A Shapley function for neuronal networks
While this original derivation of φ was meant to apply to the analysis of game-like systems in economy and decision making, it has proven useful when abstracted for applications within a variety of different paradigms. Focusing on brain research, the complicated behavioral effects resulting from regional brain damage and the interest in large-scale brain connectivity motivate an assessment of the contributions of individual brain regions to the global properties of the networks made up by neurons and their interconnections.
On the macroscopic scale, which is typically the resolution of clinical observations, the brain can be idealized as a network consisting of brain regions and their interconnections. From a graph-theoretical view, brain regions then are regarded as homogeneous vertices whose directed edges express binarized connection densities. Using tools from graph theory, one can assess the contribution of individual nodes to overall network properties, in particular to the “reachability” of other nodes through the paths that are comprised by the directed edges. The importance of a node would consequently be assessed in terms of the effects that its removal has on the paths connecting all pairs of nodes.
We have presented a novel method for assigning Shapley values as vertex ratings in a directed graph representing a neuronal connectivity network (Abraham et al., 2006 ). This requires a definition of the characteristic function f, such that it represents the contribution that a given neuronal structure makes to the overall connectivity of the network of which it is a part. To do this, we conceive of the brain as a directed graph, denoted G = (VG, EG), whose set of vertices VG represents a set of neuronal structures (nuclei or cortical regions) and whose set of directed edges EG represents the set of unidirectional connections (projections) between these structures. To represent a given vertex's contribution to overall connectivity (analogous to a given player's contribution to the collective profit), we then introduce the concept of strongly connected components. Graph G is considered to be strongly connected if, for every pair of vertices i and j contained in V, there is a directed path from i to j (and from j to i). That is, it is possible to follow projections from each neuronal structure to any other. If a subgraph of G is denoted by G′ = V′, E′, with V′⊂VG and E′⊂EG, then the set SCC(G) is an enumeration of all possible maximal subgraphs G′ contained in G which are strongly connected in this manner. In other words, each such G′ is a strongly connected component of G. Note that two different strongly connected components do not have any common nodes.
The number of strongly connected components in G is an indication of its connectedness. If |SCC(G)| = 1, this indicates that there is a directed path in G from any vertex i ∈ VG to any other vertex j ∈ VG. If these nodes represent neuronal structures, this means that any structure is capable of communicating with any other; thus, all forward and feedback signals are possible. If, however, a network G is comprised of n ∈ N disconnected components, the value of |SCC(G)| is at least n. Thus, the function SCC(G) has an important implication for the analysis of neuronal connectivity. If a vertex i is removed from G (analogous to a localized lesion), the number of connected components may also be altered, and the magnitude of this alteration can be considered a measure of the contribution of i to the connectivity of G. Thus, |SCC| is an acceptable characteristic function for our analysis; for a given vertex set V′⊂VG, where G′(V′,E′) is the subgraph of G with E′ being the set of all edges whose two vertices are in G′, the characteristic function fG is given by
Note that, for a strongly connected graph G, the value of fG(G) is 1. Having obtained an appropriate characteristic function for connectivity, it is possible to proceed with a determination of Shapley values as described above

It is notable that, because lower values of |SCC(G′)| correspond to higher connectivity, the average of values fG for permutations including i, minus that for permutations excluding it, will be lower for nodes whose existence in G results in higher connectivity. Thus, a lower value for φf(i) indicates that vertex i contributes more to a network's connectivity. In general, if the graph is strongly connected, the Shapley ratings for vertices obtained in this manner have a sum over all vertices of one. Lacking connectivity information altogether (other than that the graph is strongly connected), the expected value of a random node in the network consisting of n nodes is therefore 1∕n, and ratings can be assigned a meaning relative to this value.
A separate but related question is: having removed a vertex from the graph, how does this alter the contribution of other nodes in the graph? This can tell us, for example, which intact structures can conceivably compensate for the loss of another brain structure, or which are effectively independent of it. Having analyzed a graph G for its Shapley values, we can subsequently analyze the graph induced by the removal of vertex i. The resulting set of differences between Shapley values gives us a measure of the relative dependence of all other vertices upon i, with respect to connectivity, as well as some indication of those vertices whose importance is most affected by the loss of i.
Results and Discussion
Intact networks
In this section, we present examples of Shapley values calculated for two graphs representing large-scale brain networks, one representing visual cortical areas and the other representing prefrontal cortical areas. The first graph is a previously published connectivity matrix of macaque visual cortex (Y92; Young 1992 , based on data compiled by Felleman and Van Essen, 1991 ). The graph comprised 30 disjoint areas from primary visual cortex (V1) to association areas in parietal (7a), temporal (TH), and prefrontal (46) lobes. Connections between these areas were represented as binary entries in the connection matrix, with all empty fields filled with zeros. A graphical representation of this network is shown in Figure 1 .
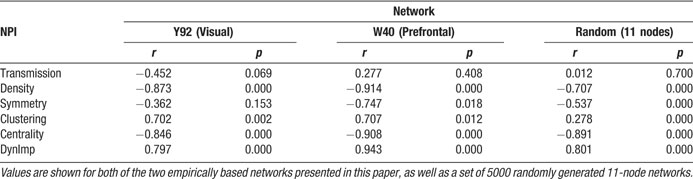
Figure 1. Diagram portraying the directed graph representing the Y92 network. Only neuronal connections that are known to exist are drawn. The positions of the nodes were obtained by multidimensional scaling (MDS) using Kruskal's method using the software package Systat 10 on the correlations between the connectivity vectors for each node as described in full detail in Kötter and Stephan, 2003 .
Since the sum of all node ratings is constrained to a value of 1, the expected Shapley rating for an area in this matrix was 1∕30 ≈ 0.033. As explained above, a lower Shapley value indicates that a node has a stronger impact on the “reachability” of other vertices, whereas a high value indicates that a vertex can be removed without strong effects on the structure of the remaining network. By far the most negative Shapley rating was obtained for area V4, a densely connected color-sensitive area in the ventral visual processing stream (Figure 2 ). The two areas with the next lowest Shapley ratings, frontal eye field (FEF) and 46 (centro-lateral prefrontal cortex), have to be interpreted with caution since these are the only frontally located areas in this matrix, which take a special position in the network. Other areas with low Shapley ratings are mostly densely connected structures of the prestriate cortex (V2, V3, VP) and the dorsal stream regions (MSTd, 7a, MT, STPp, LIP, DP), as well as temporal area TF. Areas with high Shapley values include predominantly temporal stream areas, comprising all inferotemporal (IT) areas, and notably the primary visual cortex (V1), whose subcortical input is ignored here.
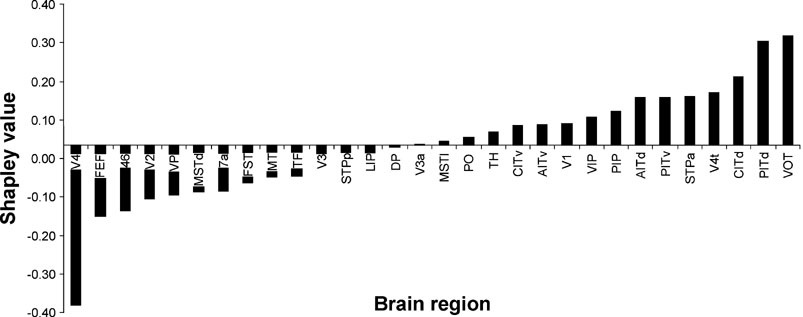
Figure 2. Shapley values obtained for the Y92 matrix. The x-axis is located at the expected Shapley value for a 30-node network, which is 1∕30 ≈ 0.033.
The second example comprises three variations on the matrix of connections between regions of macaque prefrontal cortex (W40; Walker, 1940 ) that were curated from anatomical tracing studies represented in the CoCoMac database (Kötter, 2004 ; Stephan et al., 2001 ). The graphs for these matrices are illustrated in Figure 3 .
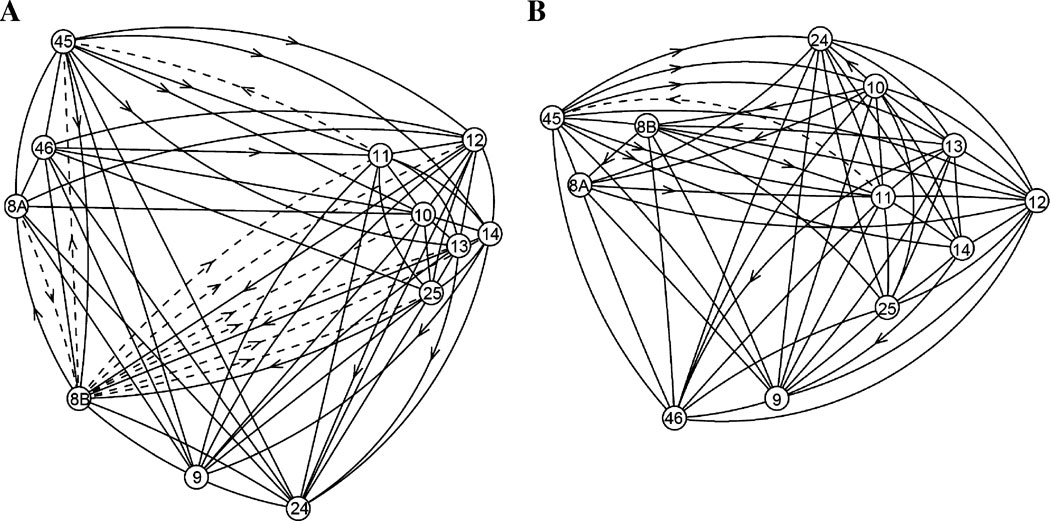
Figure 3. Diagram portraying the directed graphs representing the prefrontal interregional cortical network. (A) Original W40-0 and W40-1 networks as analyzed in previous studies (Kötter and Stephan, 2003 ; Passingham et al., 2002 ; Stephan et al., 2001 ); (B) W40-2 network. The positions of nodes were obtained by MDS (see legend to Figure 1 ). The dashed lines indicate connections whose status of existence was unknown.
In a previous study, we analyzed the node similarities and cluster structure of this matrix (Passingham et al., 2002 ). We concluded that each node had a unique characteristic set of afferent and efferent connections and that the family relationships among nodes differentiated a small set of groups, notably a densely intraconnected cluster of orbitomedial areas (areas 10–14, 25), a group of lateral prefrontal areas (45, 46, 8A), and a third group of densely connected areas (8B, 9, 24) that mediated between the first two. The Shapley value analysis allows us now to extend and refine this characterization.
As in previous studies, here we initially assumed that an absence of connectivity information most likely indicates a factual absence of the respective connection. Therefore, we filled in the empty cells of the connectivity matrix with zeros (W40-0). The resulting Shapley ratings led to the ranking of nodes as shown in Figure 4 . In this first variant, the vertices with the lowest Shapley ratings were areas 9, 24, and 12, which are also the only areas that have connections with all other areas in the connectivity matrix of the prefrontal cortex (Figure 3 ).
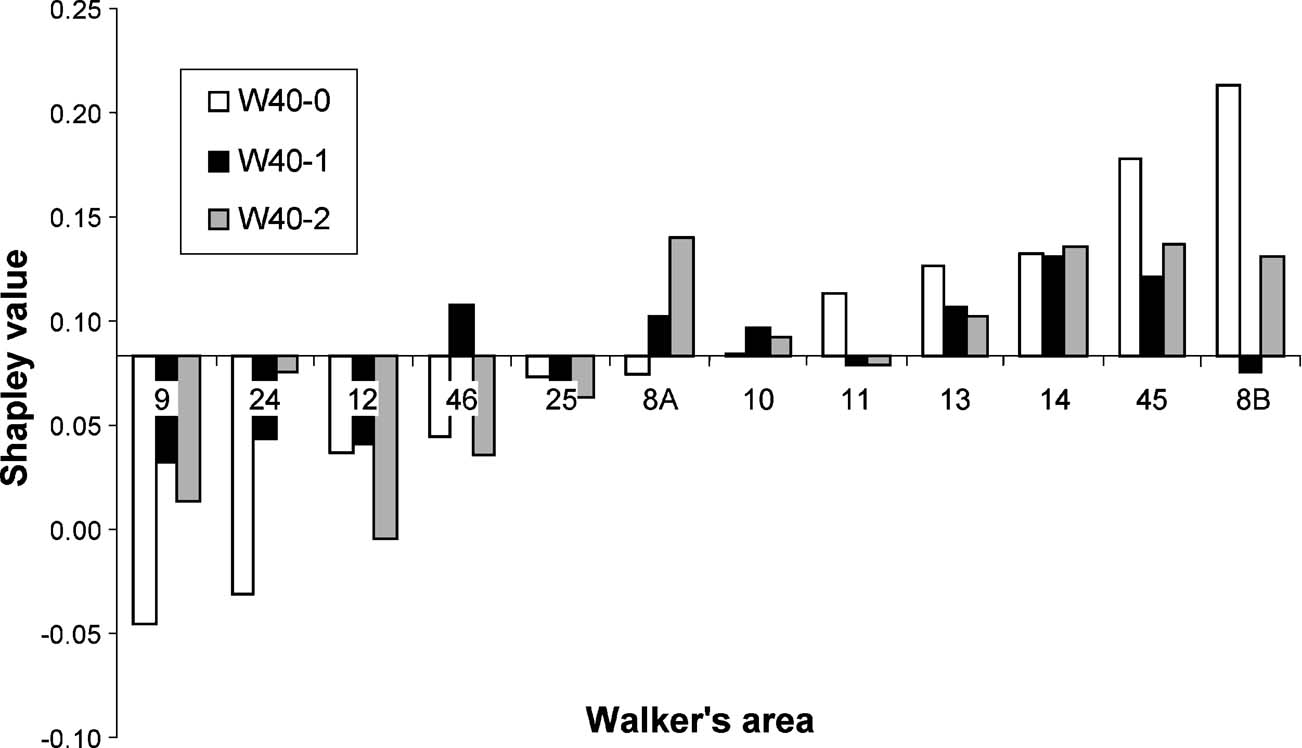
Figure 4. Histograms showing the relative Shapley ratings for areas in the three variants of the W40 network, sorted by scores for the W40-0 variant. The x-axis is located at the expected Shapley value for a 12-node network, which is 1∕12 ≈ 0.083.
These three areas take part in the orbitomedial and the densely connected intermediate groups of areas. If we include the area with the next lowest Shapley rating (area 46) then not only are all three major groups of areas represented, but we note that, on a functional level, at least two of these areas (in particular areas 24 and 46) are known to be among the most commonly activated regions across a broad range of functional imaging paradigms and have been identified as being hypoactivated in attention deficit hyperactivity disorder (e.g., Dickstein et al., 2006 ). At the other extreme, the three areas with the highest Shapley values (8B, 45, 14) are clearly associated with very specific brain functions (spatial and object recognition, autonomic control). Each of these three areas belongs again to a different one of the three groups of areas defined by Kötter and Stephan (2003) so that each cluster contains areas with both very low and very high Shapley ratings. In absolute terms, the Shapley ratings of areas 9 and 24 were negative, which indicates a very strong impact considering that the expected Shapley rating in a network with regular connectivity (and thus equal area contributions, e.g., a ring) is 1∕n = 1∕12 ≈ 0.083. Altogether, half of the areas had Shapley values smaller than 0.083.
As mentioned above, the prefrontal connectivity graph shown in Figure 3 contained some unknown edges. We treated them like absent connections (W40-0), which is the common procedure under the assumption that all substantial projections are likely to have been documented. Knowing, however, that at least some of the efferent connectivity of area 8B was unavailable due to mapping limitations resulting from a redefinition of area 8B in later studies (see Barbas and Pandya, 1989 vs. Petrides and Pandya, 1994 , as well as discussion in legend of Figure 1 of Kötter and Stephan, 2003 ), we calculated as a control the Shapley ratings under the other extreme assumption that all unknown connections did actually exist (W40-1). As could be expected from the relatively small number of changes, this alternative calculation produced a very similar ranking of most areas. A few differences, however, were noticeable: (a) there were no longer any negative Shapley ratings, that is, the absolute dependence on a few individual areas decreased; (b) the overall range of Shapley values decreased as highly positive values were decreased; (c) the insertion of edges in the graph (or inversely: removal of some of its connections) affected other nodes in different ways; areas from the orbitomedial cluster were much less affected then those contained in the other two clusters.
We obtained a third variant of the prefrontal matrix which resulted from a more recent evaluation of tracing data where the information database had been updated and extended and the mapping procedure had been refined to take into account additional options (W40-2). Altogether this matrix had only a single unspecified entry: the projection from area 11 to area 45, which we assume to be absent. Ordering of the Shapley ratings by size led to a very similar sequence of network contributions: while areas 12, 9, 46 continued to have the lowest Shapley ratings, the importance of area 24 greatly decreased. By contrast, area 25 (in Walker's map the rostro–dorsal part of anterior cingulate gyrus, similar to Brodmann's area 32) gained importance. The list of areas with the most positive Shapley values was now led by area 8A, before areas 45, 14, and 8B.
The consistency of the ranking of areas with all three matrices speaks to the robustness of both the data collation procedure and the analysis method, which produce comparable results despite differences in the degree and methods of filling of otherwise strongly constrained connectivity matrices. In addition, the list of areas with extreme values extends our earlier functional interpretation of a low Shapley rating relating to a general functionality with frequent activation of the area as opposed to a high Shapley rating relating to specialized functionality with a more task-dependent activation, by including area 8A (FEF) as an area specialized in eye movements. The ranking spawns further interest in the functional roles of areas 12 and 9, which are poorly understood but appear to be critically positioned at the interface between different groups of prefrontal areas. We propose that lesioning any of the areas with very low Shapley values should have profound effects on network function.
Comparison with other measures of network connectivity
Network participation indices (NPIs) are values derived from a directed graph representing a neuronal network, which represent some aspect of a node's participation within the network (Kötter and Stephan, 2003 ). The three indices proposed in the original paper were: the density of connections of a node, or its degree of interconnectedness; transmission, which refers to the ratio of outdegree to indegree; and symmetry, which is a measure of reciprocal connectivity between a node and its neighbors. Two variants of the symmetry measure have been calculated for the present study: symmetry-all includes all types of known symmetrical connectivity, (including reciprocal absence of connections); whereas symmetry-exists includes only those symmetrical connections known to exist. As we will see, only the latter is interesting in the context of this study and is therefore referred to unless the specific distinction is made.
Like Shapley values, density values are highest for areas 9, 24, and 12 in the prefrontal network (Figure 2 in Kötter and Stephan, 2003 ). Two other nodal connectivity measures that have been useful in characterizing structural connectivity are: the clustering coefficient (Watts and Strogatz, 1998 ), which is a measure of the connectedness of a node's neighbors; and betweenness centrality (Freeman, 1977 ; Honey et al., 2007 ), which measures how central a node is within its network. One further measure of nodal importance is that of dynamical importance, which evaluates the effect of a particular node upon the maximum eigenvalue of the connectivity matrix, a value which has been used to describe global connectivity in a variety of network paradigms (Restrepo et al., 2006 ). Table 1 shows the correlational relationships of these six indices with the Shapley values obtained here, for both the visual network (Y92) and the prefrontal network (W40, averaged over its three variants).

Table 1. Pearson correlation coefficients (r) and associated p-values (p) for correlations with Shapley values for: the three NPI values, the clustering coefficient, betweenness contrality, and dynamical importance.
In both the visual and prefrontal networks, density and betweenness centrality exhibited strong and significant negative correlations with Shapley values; symmetry (of existing connections) was not significant in the visual network indicating that it is not a requirement for negative Shapley values. Since smaller Shapley values indicate higher nodal importance, the negative correlation was expected. Clustering coefficients showed significant positive correlations with Shapley ratings in both networks, indicating an inverse relationship. Dynamical importance was effectively positively correlated since—somewhat similar to Shapley ratings—a negative value indicates a great influence. Transmission was not significantly correlated with Shapley values in either matrix.
These relationships were also evaluated for a set of 5000 randomly generated 11-node networks for which Shapley values and the above measures were calculated. Again, there appeared to be no correlation whatsoever with transmission, while density, symmetry, and betweenness centrality showed significant negative correlations. Clustering coefficient was again positively correlated with Shapley values, although the strength of this correlation was substantially reduced. The matrix size of n = 11 was selected on the basis of its calculation time complexity, similarity to the W40 matrix size, and the observation that the calculated correlations were relatively stable at this size (see Figure 5 ).
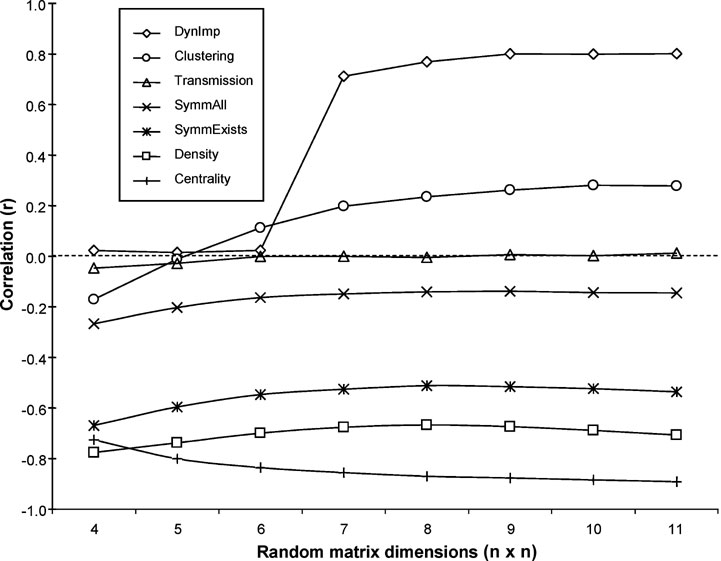
Figure 5. Relationship between matrix size and nodal measure correlations with Shapley values, as derived from a set of 5000 randomly generated matrices. Dynlmp = dynamical importance (Restrepo et al., 2006 ).
It is interesting to note the relationship between matrix size and correlation for these measures. In particular, the positive correlation of the clustering coefficient was not apparent until a size of at least n = 7. Likewise, the (negative) correlation of betweenness centrality with Shapley values grew with increasing matrix size. Conversely, the three NPI measures, symmetry-all, symmetry-exists, and density, appeared to have slightly weakened correlations with increasing matrix size, a pattern which may reflect their underlying similarities, as well as differences of these measures with respect to the clustering coefficient and betweenness centrality. Such differences may relate in part to the local nature of the NPI measures, as opposed to the dependence of the clustering coefficient and betweenness centrality on larger neighborhoods of nodes, an effect that is limited in smaller networks. This relationship also serves as a caveat for the application of these measures to networks with very few (i.e., less than seven) nodes.
A stepwise multiple linear regression analysis performed in Matlab, on data obtained from the randomly generated matrices, identified betweenness centrality as the factor best explaining the variance of Shapley values (R2 = 0.789). Linear models with density, symmetry, and dynamical importance alone were less explanatory (R2 = 0.479, 0.278, 0.632, respectively). Individually, density, symmetry, and dynamical importance added similarly to the power of the betweenness centrality model ( , respectively), whereas clustering coefficient and transmission added virtually nothing to the model. These results illustrate a strong, albeit partial relationship between betweenness centrality, dynamical importance, density, symmetry, and Shapley ratings, while clearly demonstrating that these measures are not completely redundant. Moreover, there appears to be little or no predictive relationship between clustering coefficient, transmission, and Shapley ratings.
Lesioned networks
Taking these analyses a step further, we evaluated the changes in the Shapley rating of prefrontal areas following removal of a single area from the network (Figure 6 ). Obviously, if an area is removed then no Shapley rating can be calculated for that area itself. For the “lesioned” W40 connectivity matrix, there remain 11 areas whose expected Shapley rating is 1∕(12 − 1) ≈ 0.091.
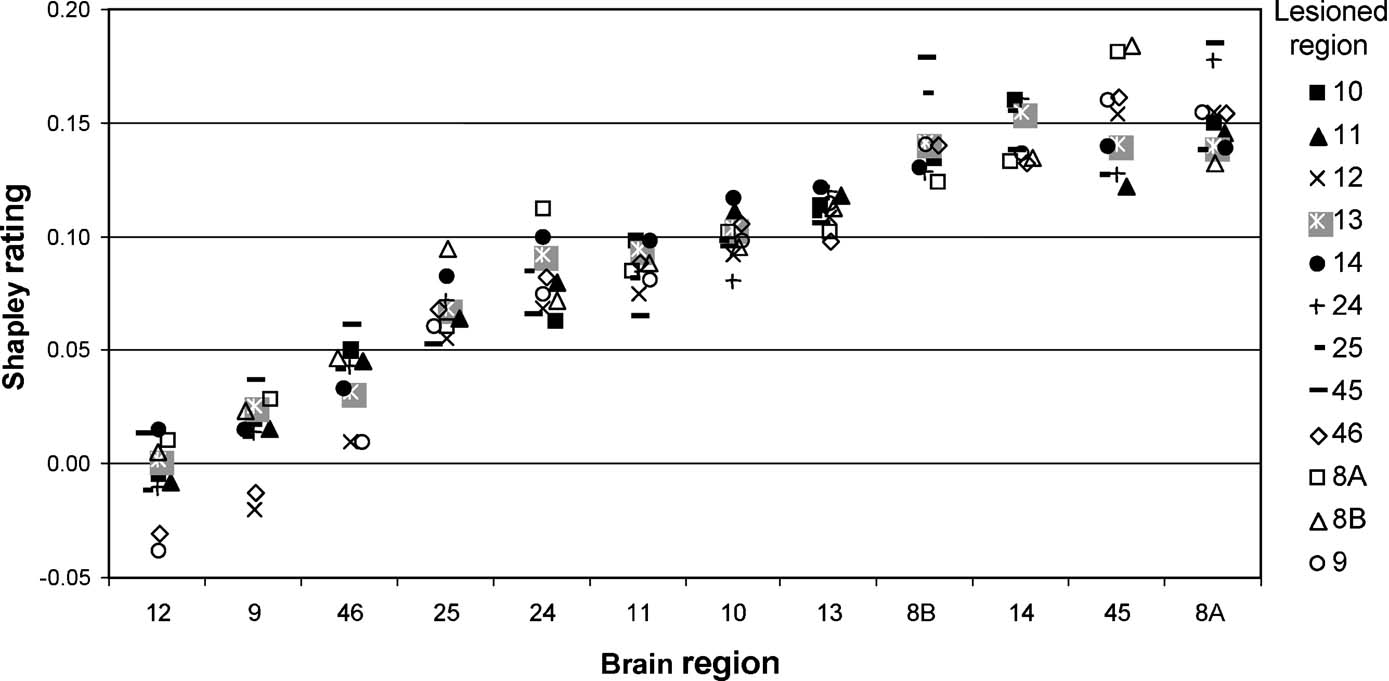
Figure 6. Shapley ratings for brain regions in the W40-2 network ordered along the abscissa by increasing mean Shapley values. For each of these brain regions, the different shapes represent the Shapley values obtained for subgraphs induced by the elimination of a particular brain region (symbols explained on the right).
We found that three areas (areas 12, 9, and 46; Figure 6 , left-most areas) always had the lowest Shapley ratings independent of which other area was removed. Also, the effects of removal differed: taking out either area 12, 9, or 46 strongly increased the importance of the remaining two. Altogether, the ratings for individual nodes were only weakly dependent upon the location of the lesion, and there were no huge or erratic changes in Shapley ratings.
Nevertheless, elimination of some areas (9, 46, 8B, 12, and 8A) clearly increased the range of the Shapley ratings among areas in the network, whereas removal of others (e.g., 45, 11, 14, 25) decreased it, thus making the network contributions more homogeneous. Area 45 appears to be particularly interesting when assessing the overall extent of absolute changes to Shapley values in the network induced by the removal of individual areas (Figure 7 ). Note that the influence on the homogeneity of network contribution does not correlate well with any individual node index, including the Shapley rating of the lesioned node (r = −0.46). This result confirms from a different perspective that area 45 has a special role in the connectivity pattern of the prefrontal network, which predicts the network to be highly sensitive to lesion effects. The special connectivity of area 45 in the prefrontal network was already pointed out by (Kötter and Stephan 2003 ) with respect to its network participation, and noting the exceptionally low symmetry of its connectivity, with a paucity of afferents and a strong preponderance of efferents (high transmission index).
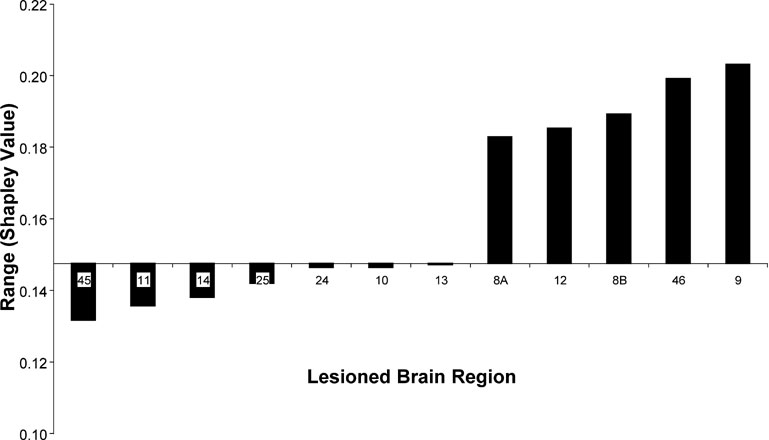
Figure 7. Range of Shapley values in increasing order for different eliminated brain regions (abscissa) calculated as the difference between the highest and lowest values among the remaining nodes from the W40-2 matrix. The level of the abscissa indicates the range value in the intact network.
Discussion and Conclusions
The application of game theoretical concepts to neuronal network models is a novel approach in connectivity analysis. By assigning Shapley values to nodes in these networks, it is possible to quantify the contribution that each individual node makes to the overall connectivity of the network.
There are a few practical limitations inherent in this approach. If we have a network consisting of n nodes then, to calculate the Shapley value of a node by Shapley's formula, we have to consider all n! permutations of the set of n nodes. Therefore, the number of steps to compute a Shapley value is proportional to n!. However, there are some cases in which the Shapley value can be computed efficiently (Abraham et al., 2006 ). Another problem is that the numbers involved in the computation quickly get too large for precise integer arithmetic. This made it necessary to implement special data types that can handle longer integers even for the relatively small networks with up to 30 nodes that we used.
As with every new connectivity measure, it is important to investigate its relationship to existing measures. Accordingly, we have compared this measure with other node-specific measures of connectivity, namely density, symmetry, transmission, betweenness centrality, and the clustering coefficient. Our results showed a strong association between Shapley ratings and betweenness centrality values with a (negative) correlation of −0.89 indicating a strong similarity between these concepts. Density, symmetry (of existing connections), and dynamical importance are also highly correlated with Shapley values (Table 1 ). Moreover, each of these values, coupled with betweenness centrality in a general linear model, can explain over 80% of the variance in Shapley values. These relationships suggest important underlying similarities, as well as differences, between the individual measures investigated here. At this time, a mathematical proof of the precise relationships between these and other nodal measures of network connectivity seems elusive, but an approximation may already yield interesting insights into their nature and application to neuronal networks. Hypotheses about the interdependence can conceivably be generated by using hierarchical clustering approaches comparing the indices across a large number of brain regions. The relationship between such analyses and the theoretical roles of particular neuronal structures within a large-scale network merits further investigation.
Conceptually, the removal of a node with a relatively low Shapley rating (and thus a high contribution) would be expected to affect the network connectivity in some important way, whereas the removal of those nodes with higher ratings would be expected to have a lesser impact. Thus, the rating has potential utility as a means of analyzing discrete network lesions, by predicting the magnitude at which a particular lesion would be expected to disrupt network connectivity. It would also speak to the question of whether there are particular nodes whose lesion can or cannot be compensated for. Moreover, a re-assignment of Shapley ratings based upon a lesioned version of a network can provide an indication of how this lesion affects the relative contribution of the remaining nodes. This can, for instance, be done by evaluating relative Shapley values during consecutive stepwise removal of nodes (which by itself is a problem of high complexity). The characterization of the network disintegration as, for instance, “graceful degradation∕degeneration” versus “catastrophic failure” could potentially contribute to the investigation of brain connectivity from the point of view of system theory.
Previous work on network vulnerability has been carried out, for example, for the world wide web (Barabasi and Albert, 1999 ), which turns out to be robust with respect to random deletion of nodes, but rather vulnerable to targeted attack on heavily connected hubs (Albert et al., 2000 ; Doyle et al., 2005 ). In the case of brain networks, a measure of edge vulnerability (Kaiser and Hilgetag, 2004 ) has been defined and has led to the identification of edges whose loss most affects global structural measures. Such edges often correspond to “bridges,” that is, edges linking segregated clusters of brain regions. A more detailed study of lesion effects on network structure has revealed a pattern of degradation in large-scale brain networks that resembles that of scale-free networks (Kaiser et al., 2007 ). Shapley values may offer a new analytic tool for predicting the functional impact of lesioning network nodes. For example, our analysis of the visual network Y92 suggested that a lesion of area V4 might have a strong impact on the visual network, which is in line with the earlier observation of Felleman and Van Essen (1991) that V4 is extremely densely connected within the visual cortical network. An analysis of a similar connection matrix comprising visual and sensorimotor areas has shown that V4 has very high betweenness centrality (Honey et al., 2007 ) and that its removal strongly degrades small-world attributes of the remaining network (Sporns et al., 2007 ). Other putative hub regions identified on the basis of centrality and motif contributions include areas FEF, 46 and 7a, all of which are shown to have strongly negative Shapley values in the present analysis. By contrast, our analysis suggests that lesions of IT areas or even V1 would lead to rather discrete network disturbances within the cerebral cortex. Shapley values suggest a potentially very significant role for prefrontal area 46 and FEF, which is worth noting given that these areas are not a primary part of the visual cortical network. It needs to be investigated, however, how their connectivity with posterior cortex compares with other frontal areas.
It is important to note that all these considerations address the structural integrity of the network, whereas the significance of these measures within a functional network in the context of phenomena such as stimulus-driven or endogenously produced activity—and how they are affected by lesions—is not yet well defined (see Sporns et al., 2004 ). While Shapley values have been introduced at the functional level (e.g., Aharonov et al., 2003 ; Keinan et al., 2004 ), it is unclear how they are related to structural Shapley values. In order to tie structure-function relationships together more closely, we need a large database of correlated structural and functional measurements in the same species or—even better—the same individual organism, such as lesions induced by stroke or by transcranial magnetic stimulation, compared to structural and functional measures including MRT and EEG. From there, we will need computational models that can provide testable predictions of mechanistic links between structure and function. Neuroinformatics is still very much in the first steps to become useful for answering basic and clinical questions concerning brain function.
Conflict of Interest Statement
The authors declare that the research was conducted in the absence of any commercial or financial relationships that could be construed as a potential conflict of interest.
Acknowledgements
RK and EW received funding by the DFG (KO 1560∕6-2, WA 674∕10-2). AR, RK, and OS were funded by the McDonnell Foundation. We thank Gleb Bezgin for helpful discussions.
References
Abraham, M., Kötter, R., Krumnack, A., and Wanke, E. (2006). A connectivity rating for vertices in networks. In Proceedings of the 4th IFIP International Conference on Theoretical Computer Science 2006, SSBM (Berlin, Springer), pp. 283–298.
Aharonov, R., Segev, L., Meilijson, I., and Ruppin, E. (2003). Localization of function via lesion analysis. Neural Comput. 15, 885–913.
Albert, R., Jeong, H., Barabási, A.-L. (2000). Error and attack tolerance of complex networks. Nature 406, 378–382.
Barbas, H., and Pandya, D. N. (1989). Architecture and intrinsic connections of the prefrontal cortex in the rhesus monkey. J. Comp. Neurol. 286, 353–375.
Dickstein, S. G., Bannon, K., Xavier Castellanos, F., and Milham, M. P. (2006). The neural correlates of attention deficit hyperactivity disorder: an ALE meta-analysis. J. Child Psychol. Psychiatry 47, 1051–1062.
Doyle, J. C., Alderson, D. L., Li, L., Low, S., Roughan, M., Shalmov, S., Tanaka, R., and Willinger, W. (2005). The “robust yet fragile” nature of the internet. Proc Natl Acad Sci USA 102, 14497–14502.
Felleman, D. J., and Van Essen, D. C. (1991). Distributed hierarchical processing in the primate cerebral cortex. Cereb. Cortex 1, 1–47.
Hilgetag, C. C., Kötter, R., Stephan, K. E., and Sporns, O. (2002). Computational methods for the analysis of brain connectivity. In Computational Neuroanatomy—Principles and Methods, G. A. Ascoli, ed.(Totowa, NJ, Humana Press), pp. 295–335.
Honey, C. J., Kötter, R., Breakspear, M., and Sporns, O. (2007). Network structure of cerebral cortex shapes functional connectivity on multiple time scales. Proc Natl Acad Sci USA 104, 10240–10245.
Kaiser, M., and Hilgetag, C. C. (2004). Edge vulnerability in neural and metabolic networks. Biol. Cybern. 90, 311–317.
Kaiser, M., Martin, R., Andras, P., and Young, M. P. (2007). Simulation of robustness against lesions of cortical networks. Eur. J. Neurosci. 25, 3185–3192.
Keinan, A., Sandbank, B., Hilgetag, C. C., Meilijson, I., and Ruppin, E. (2004). Fair attribution of functional contribution in artificial and biological networks. Neural Comput. 16, 1887–1915.
Kötter, R. (2004). Online retrieval, processing, and visualization of primate connectivity data from the CoCoMac database. Neuroinformatics 2, 127–144.
Kötter, R., and Stephan, K. E. (2003). Network participation indices: characterizing component roles for information processing in neural networks. Neural Netw. 16, 1261–1275.
Passingham, R. E., Stephan, K. E., Kötter, R. (2002). The anatomical basis of functional localization in the cortex. Nat. Rev. Neurosci. 3, 606–616.
Petrides, M., and Pandya, D. N. (1994). Comparative architectonic analysis of the human and the macaque frontal cortex. In Handbook of Neuropsychology, vol. 9. F. Boller and J. Grafman, eds.(Amsterdam, Elsevier), pp. 17–58.
Restrepo, J. G., Ott, E., and Hunt, B. R. (2006). Characterizing the dynamical importance of network nodes and links http://arxiv.org/abs/cond-mat/0606122v1
Shapley, L. S. (1953). A value for n-person games. In Contributions to the Theory of Games II, H. W. Kuhn, and A. W. Tucker, eds.(Princeton, Princeton University Press), pp. 307–317.
Sporns, O. (2003). Graph theory methods for the analysis of neural connectivity patterns. In Neuroscience Databases: a Practical Guide, R. Kötter, ed.,(Boston, Klüwer), pp. 171–186.
Sporns, O., Chialvo, D., Kaiser, M., and Hilgetag, C. C. (2004). Organization, development and function of complex brain networks. Trends Cogn. Sci. 8, 418–425.
Sporns, O., Honey, C., Kötter, R. (2007). Identification and classification of hubs in brain networks. PLoS ONE 10, e1049.
Stephan, K. E., Kamper, L., Bozkurt, A., Burns, G. A. P. C., Young, M. P., Kötter, R. (2001). Advanced database methodology for the collation of connectivity data on the Macaque brain (CoCoMac). Phil. Trans. R. Soc. Lond. B 356, 1159–1186.
Walker, A. E. (1940). A cytoarchitectural study of the prefrontal areas of macaque monkey. J. Comp. Neurol. 98, 59–86.
Watts, D. J., and Strogatz, S. H. (1998). Collective dynamics of “small-world” networks. Nature 393, 440–442.
Keywords: cerebral cortex, connectivity, game theory, graph analysis, neural network
Citation: Rolf Kötter, Andrew T. Reid, Antje Krumnack, Egon Wanke and Olaf Sporns (2007). Shapley ratings in brain networks. Front. neuroinform. 1:2. doi: 10.3389/neuro.11/002.2007
Received: 30 August 2007;
Paper pending published: 24 September 2007;
Accepted: 24 October 2007;
Published online: 30 November 2007.
Edited by:
Jan Bjaalie, International Neuroinformatics Coordination Facility, Sweden; University of Oslo, NorwayReviewed by:
Gully A. Burns, USC Information Sciences Institute, USAPetter Holme, NIAAA, USA
Copyright: © 2007 Kötter, Reid, Krumnack, Wanke and Sporns. This is an open-access article subject to an exclusive license agreement between the authors and the Frontiers Research Foundation, which permits unrestricted use, distribution, and reproduction in any medium, provided the original authors and source are credited.
*Correspondence: Rolf Kötter, Section Neurophysiology and Neuroinformatics, Department of Cognitive Neuroscience, Radboud University Nijmegen Medical Centre, POB 9101, 6500 HB Nijmegen, The Netherlands. e-mail: rk@cns.umcn.nl