A high-resolution anatomical framework of the neonatal mouse brain for managing gene expression data
- Department of Neurology, UCLA School of Medicine, USA
This study aims to provide a high-resolution atlas and use it as an anatomical framework to localize the gene expression data for mouse brain on postnatal day 0 (P0). A color Nissl-stained volume with a resolution of 13.3 × 50 × 13.3 µ3 was constructed and co-registered to a standard anatomical space defined by an averaged geometry of C57BL∕6J P0 mouse brains. A 145 anatomical structures were delineated based on the histological images. Anatomical relationships of delineated structures were established based on the hierarchical relations defined in the atlas of adult mouse brain (MacKenzie-Graham et al., 2004) so the P0 atlas can be related to the database associated with the adult atlas. The co-registered multimodal atlas as well as the original anatomical delineations is available for download at http∕∕www.loni.ucla.edu∕Atlases∕ . The region-specific anatomical framework based on the neonatal atlas allows for the analysis of gene activity within a high-resolution anatomical space at an early developmental stage. We demonstrated the potential application of this framework by incorporating gene expression data generated using in situ hybridization to the atlas space. By normalizing the gene expression patterns revealed by different images, experimental results from separate studies can be compared and summarized in an anatomical context. Co-displaying multiple registered datasets in the atlas space allows for 3D reconstruction of the co-expression patterns of the different genes in the atlas space, hence providing better insight into the relationship between the differentiated distribution pattern of gene products and specific anatomical systems.
Introduction
The morphogenesis and functional development of the mammalian central nervous system is regulated by the interaction of genes expressed at specific times and locations during development. The roles of these genes can be better understood by studying their spatial and temporal expression patterns. Most studies of gene expression pattern analysis use invasive methods to generate their data. As a result, little spatial information is preserved during sample processing, and pattern analysis is restricted to a local area. To relate the genetic information to the brain anatomy, the Mouse Biomedical Informatics Research Network (BIRN) project has generated a multimodal atlas for adult mouse brain and created an atlas interface (Mouse BIRN Atlasing Toolkit—MBAT) which can incorporate genetic information in an anatomical context (Boline et al., 2006 , http:∕∕www.nbirn.net∕tools∕index.shtm ). The ultimate goal is to use the atlas as a framework for centralizing gene expression data collected using different methods and from separate laboratories, so the cross-community, cross-modality data correlation can be standardized. Currently, this atlas interface incorporates gene expression data obtained with microarray assay to the atlas space based on anatomical concepts. It also allows registration of in situ data of adult mouse brain to the orthogonal planes of adult brain atlas. In this study, we aim to extend the anatomical framework to a neonatal developmental stage and use it to incorporate data of gene expression assays shown in image formats, which are usually used to compensate for the low resolution of microarray assay.
To study the contribution of genes in brain development, a high-resolution anatomical framework at an early developmental stage is essential to correlate the distribution of gene products and the cell type within each structure. Although the basic anatomical architecture of a mouse brain at postnatal day 0 (P0) is similar to an adult one, the neonatal brain is not simply a smaller version of the adult brain. Due to incomplete nerve myelineation and differentiated maturation for different brain structures at P0, some of the anatomical structures at P0 cannot easily be referenced from the atlas of adult brain. Currently available high-resolution brain atlases for early developmental stages only provide a limited number of sections and structural delineations (Jacobowitz and Abbott, 1998 ; Schambra et al., 1992 ). In addition, since these neonatal atlases use paper format and individual atlas planes are not spatially in register, it is difficult to use them to integrate and present the information acquired from other sources into the atlas space.
Previously, we defined a standard atlas space with stereotaxic coordinates for the neonatal (P0) C57BL∕6J mouse brain using MRI brain volumes (Lee et al., 2005 ). Although this atlas represents a native space of brain volumes and provides a 3D anatomical framework, it does not provide cellular scale resolution. Here, we extend past efforts by incorporating high-resolution Nissl-stained data, which reveals cytoarchitecture of brain structures, into the previously developed P0 digital atlas. As images with detailed anatomy are co-registered to the standard space, high-resolution anatomical space can be indexed using the stereotaxic coordinates. The neonatal atlas therefore provides a region-specific framework which allows data association based on anatomical and∕or spatial relations.
The serviceability of the high-resolution anatomical framework of the atlas can be illustrated by incorporating gene expression data generated using invasive staining methods, such as in situ hybridization and immunohistochemistry staining, to the atlas space. Gene expression analyses using these methods are performed by staining thin brain slices; therefore, the results of single assays are restricted to a single plane. In order to differentiate between different gene products, one or a few genes are assayed in a single data image. It is labor intensive to perform sample preparation throughout the whole brain, and many laboratories focus their experiments on specific regions. Thus, results from single experiments usually provide only a regional picture of gene activity. These assays reveal the precise anatomical location where the gene product is distributed but reconstruction of the gene expression patterns using multiple assays compensates for the restrictions due to the staining methods, and greatly enhances the significance of single studies. This can be achieved by combining gene expression datasets in a common atlas framework. Co-displaying the data with brain anatomy also allows one to establish relationships between the differentiated distribution pattern of gene products and specific anatomical systems, potentially providing better data realization and interpretation.
Individual images can be related to the 3D atlas space with a plane equation that computes the atlas brain slice corresponding to the experimental data. Since the functions of anatomical structures are the result of the interaction of several genes, associating high-resolution gene expression data with high-resolution anatomical models would provide a better insight into how gene products contribute to functional differentiation during early brain development.
Materials and Methods
Constructing the high-resolution P0 atlas
Preparation of histological volume. Brain slices of 25 µm thickness were collected coronally from a C57BL∕6J mouse on the first day after birth (P0). These slices were stained, aligned, and warped to a reference MRI volume using the same protocols described in MacKenzie-Graham et al., 2004 . The registration procedures employed corrected the slice distortions introduced during sample preparation. The 3D histological volume was reconstructed using 150 registered histological sections 50 µm apart. All animals were housed and treated in accordance with the UCLA Animal Research Committee guidelines.
Labeling anatomical structures. Tissue labeling of the histological image volume was delineated on the images after 2D non-linear distortion were corrected. Labeling was done using BrainSuite2 (Shattuck et al., 2004 , http:∕∕www.loni.ucla.edu∕Software ). The delineation was based on coronal sections, aided by consultation of the orthogonal planes. Primary references were the prenatal mouse brain atlases of Jacobowitz et al., 1998 and Schambra et al., 1992 . Because the boundaries of most structures were left undefined in these primary references, delineations were inferred from the cytoarchitectural atlas of adult mouse brain (Paxinos and Franklin, 2001 ) based on cell arrangement, and relative position to the surrounding structure and 3D morphology.
The nomenclature and abbreviation used were primarily based on Paxinos and Franklin's mouse brain atlas, thus remaining consistent with those used in the predefined atlas-based database (MacKenzie-Graham et al., 2004 ). If the structures in the anatomical database were hard to discriminate in the stained slices, they were labeled as their parent structures based on the hierarchical relations defined in the adult mouse brain (Paxinos and Franklin, 2001 ) and Brain Architecture Management System (Bota et al., 2005 , BAMS http:∕∕brancusi.usc.edu∕bkms ). The relationships between anatomical structures were organized hierarchically and modeled using BrainGraph (MacKenzie-Graham et al., 2003 ).
Registering histological image volume to the standard space. The reconstructed histological brain volume was re-sampled to the standard atlas space with the registration protocol described in Lee et al., 2005 . In brief, the histological brain was first co-registered to the MRI-based atlas using a 12-parameter transformation (Woods et al., 1993 ). An anatomical label volume was reconstructed from the delineations based on the defined anatomical hierarchical relations such that it had the same 13 features defined in the low-resolution MRI-based atlas. Feature-based warping was then performed by maximizing the mutual information between the anatomical labels of the two brain volumes (Leow et al., 2005 ).
Manage gene expression data using the atlas framework
Two XML-format documents are used to manage the gene expression data. An in-house atlas visualization interface uses these documents to display and manage data in the atlas space. The “contours” document is used to specify the areas with enriched gene expression in each image, and the “DataSet” document is used to group image data assayed for the same target (e.g., brain slices from the same batch of assay). Data management using XML format allows flexible data modeling in various atlas interfaces and will facilitate data sharing across different information systems.
“Contours” document. This document describes the spatial locations of the regions of interest (ROI, e.g., areas with positive signal in gene expression data) for each image and the expression level of these areas within that image. Each ROI is represented with a “contour” element, and the “contour” elements with the same ROI properties are organized under a “contours” element. The property of these grouped ROI (e.g., expression pattern, level) is indicated with the “ID” attribute of the “contours” element. The location of ROI in the source image is specified with pixel coordinates of the corresponding contour points and the coordinate values of each contour are retained using multiple “vertex” elements. In summary, the “contours” document represents the gene expression patterns in an image with the following schema organization:
The “Volume-Source” schema specifies the image file presenting these contours, and “Space-type” indicates whether pixel or real coordinates are used in the “vertex” schema. Note that the vertex coordinates of this document report the locations of the ROI on the experimental image. Therefore, documentation and delineation of the gene expression pattern is independent of the data-to-atlas spatial relations. Once the data-to-atlas spatial relationship is identified, the coordinates of the vertices may be transformed to the 3D atlas coordinates.
“DataSet” document. The “DataSet” document was designed for organizing the data images with a common property (e.g., assays for the same gene) and retaining the linear data-to-atlas transformations for these images. It uses multiple “Data” elements to reference the image files in the dataset, each of which indicates the absolute file path of an individual image and specifies a management plane that form the atlas. It also contains a “Signal-Contour” element that indicates the file path of the “contours” document used to represent the ROI in the image. The organization of the schemas is:
The “Data” element uses the following six elements to specify the data-to-atlas spatial relationship for the experiment image it represents. The “Atlas-Section-Center,” “Atlas-Translation,” and “Atlas-Rotation” elements describe the oblique plane of the atlas. The “Input-Translation” and “Input-Transform-Matrix” indicate the image translation, rotation, and scaling that linearly register the experimental image to the oblique plane of the atlas. The “Input-Section-Center” element is used to identify the orthogonal plane if the experimental data is a 3D volume. These parameters are sufficient to compute a unique management plane in the atlas to house an experimental image. These transformation schemas can also be reused to register the data to a different version (e.g., higher resolution) of atlases for the mouse brain of the same developmental stage.
Reconstruct 3D gene expression patterns from multiple co-registered data
Gene expression data. We chose the published in situ hybridization data generated by Gray et al., 2004 from the MGI database (http:∕∕www.informatics.jax.org ) to evaluate this atlas-based management framework. This group used in situ hybridization to reveal the expression pattern of 1445 transcription factors in the brains of developing mice, and the data are available at both the MGI database and the Mahoney database (http:∕∕mahoney.chip.org∕mahoney ). The selected images are the gene assays at P0 that present regionally restricted gene expression patterns. The dataset for each gene expression assay contains 10–20 brain slices sectioned in the coronal orientation (rostral-caudal). After acquiring the raw images from the database, each of the brain slices was cropped and saved as individual 8-bit image file. For visualization purposes, non-brain regions were masked. The actual dimensions of the brain slices were not specified by the MGI database and were determined based on visual comparison with the atlas brain when co-displayed on the same canvas.
The atlas oblique plane corresponding to each slice was determined by an experienced neuroanatomist based on visual inspection of the images and comparison of the structures on the atlas planes. This was assisted by the use of MBAT which allows for viewing an arbitrary digital section from a 3D brain volume. The selected plane is the “management plane” for all derivative data from this image.
Each brain slice was further warped to its corresponding atlas section using a feature-based registration method such that the atlas anatomical labels properly mapped to the registered image. The features used for registration were the recognizable anatomical structures and the external boundaries of the image and its management atlas plane. The displacement fields used to warp the images are derived by propagating the force field used to bring the structural boundaries into register using a 2D heat diffusion model.
An xml-formatted “DataSet” document was used to manage a group of registered images from any single gene assay. The file location of each of these images, as well as the rotation, translation, and scaling of the atlas used to generate the corresponding plane for each experimental slice were recorded in this document.
Delineating gene expression image. The MGI database annotated the gene expression level in large brain structures, but in most cases the expression was restricted to substructures within this area. To examine expression at a more detailed level, we only delineated the boundaries of areas that showed positive gene expression signals. The boundaries of the areas with enriched gene expression were delineated using in-house software.
Blocks with the same range of intensity were outlined with single contours to differentiate the expression level. Contours of these delineations were assigned with numbers from 50 to 250 with steps of 50 to reflect the relative expression level of that region, with a higher number representing a stronger signal among the same batch of assays. If the expression pattern within an area was clustered (cellular specific), the recognizable boundaries of this area were outlined with a single contour, rather than delineating each cluster.
The contours drawn on the original images were transformed using the same displacement fields used to warp the source images. The location of the contours in the 2D images was saved in a separate “contours” xml-format document. The “Signal-Contour” of the “Data” element that represents the corresponding registered image in the “DataSet” document refers to this transformed “contours” document.
Mapping gene expression to the brain anatomy. To map gene expression pattern to atlas coordinates, the vertex coordinates in the contours document are transformed to the atlas space using the registration parameters of that image. Polygons formed by these transformed vertices are modeled as 3D ROI objects and used to represent the gene expression pattern in atlas space. This allows us to examine the relation of anatomical structures to the gene expression patterns by calculating the pixels of each anatomical label within each ROI. Two ratios were computed for each anatomical structure:
Results
The high-resolution atlas
The histological volume for the image base of the atlas has a resolution of 6.6 × 50 × 6.6 µm3 (1024 × 150 × 1024 voxels) (Figure 1 ). Plane generated by arbitrarily sectioning from the histological volume still provides high-resolution anatomy. In total, 145 delineated structures and 169 anatomical relations were defined for this histological volume (Figure 2 ). Hierarchy of these anatomical labels is modeled as a BrainGraph representation (Figure 2 B).
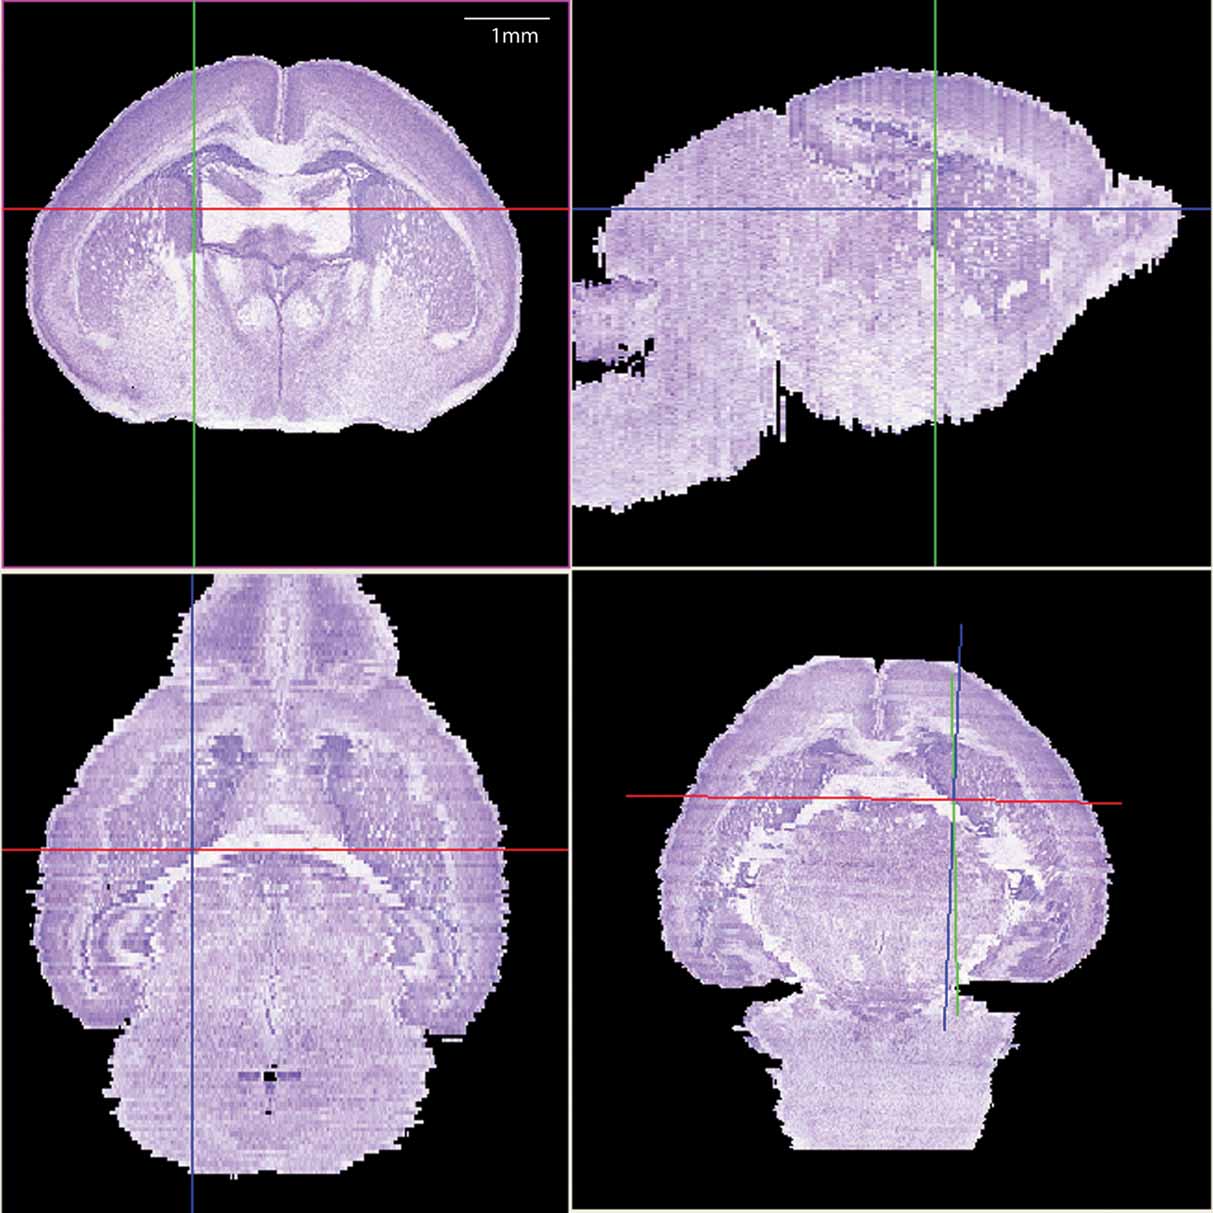
Figure 1. The 3D brain reconstructed from high-resolution histological images. The Nissl slices were collected at a near-to-coronal orientation (top-left panel). Top-right (sagittal orientation) and lower-left (horizontal orientation) panels show the two orthogonal planes and the lower-right panel shows an arbitrary section. The same view point (intersection of axes) was used in all planes.
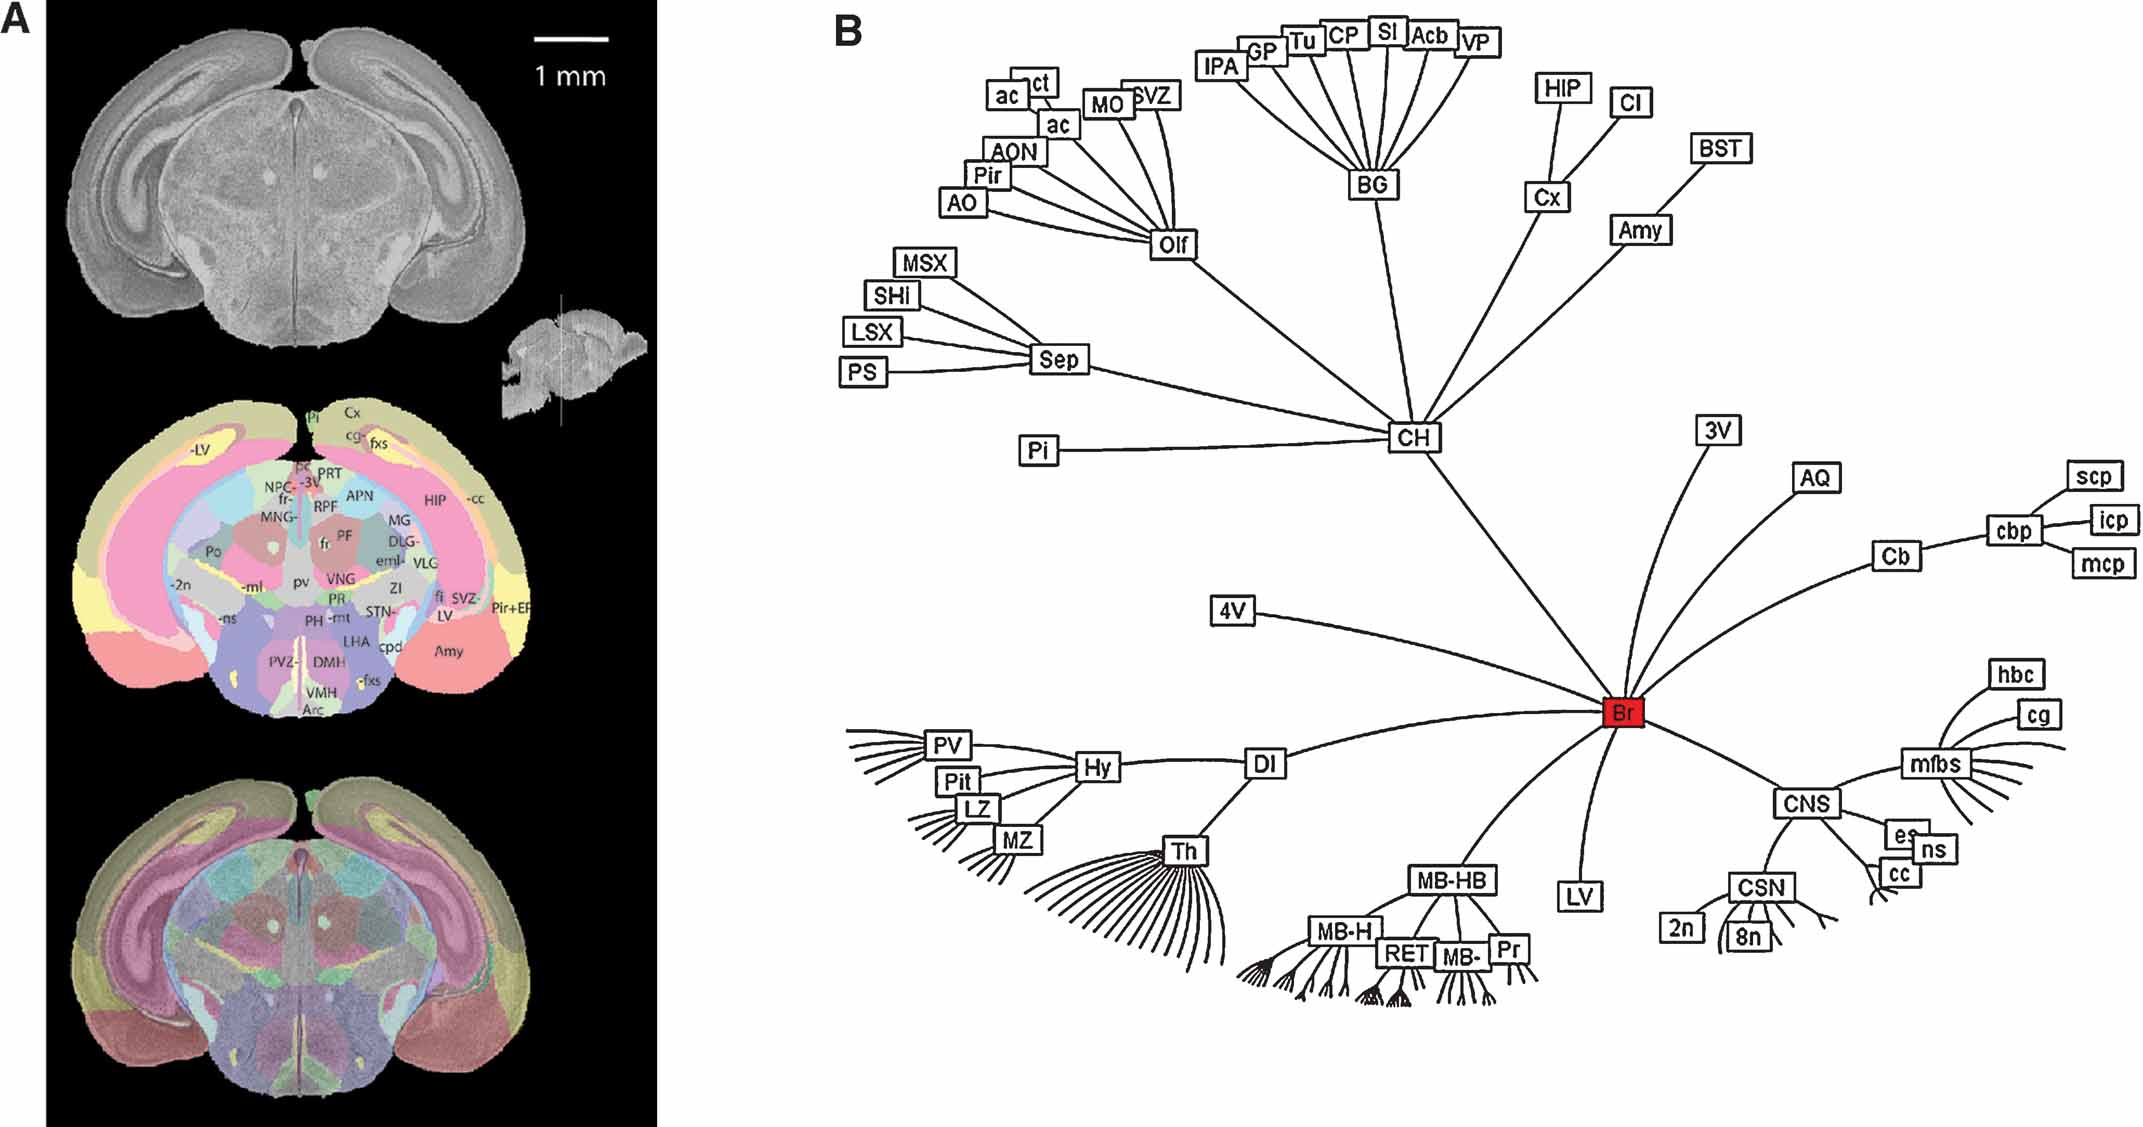
Figure 2. Delineation of anatomical structures and their hierarchic relationship. (A) One of the coronal sections of the Nissl-stained brain tissue and anatomical delineations. Location and orientation of this slice is illustrated in the sagittal section of the reconstructed brain volume (insert). Top: Nissl-stained image from the reconstructed histological brain. Middle: color index of the anatomical delineations. Bottom: overlay of the image and the delineations. (B) BrainGraph representation of the hierarchic relationship between the anatomical structures. Abbreviations of anatomical structures are provided in the Appendix.
A sub-sampled version of the reconstructed histological volume (13.2 × 50 × 13.3 µm3) and the anatomical label volume were co-registered to the defined MRI atlas space (Figure 3 ). Global registration has been previously validated in Lee et al., 2005. Briefly, the anatomical labels of the MRI volumes map onto the co-registered histological volume with high accuracy in the major structures (Figure 3 , right). The previously defined coordinate system is now applied to the high-resolution brain anatomy using the co-registered label volume.
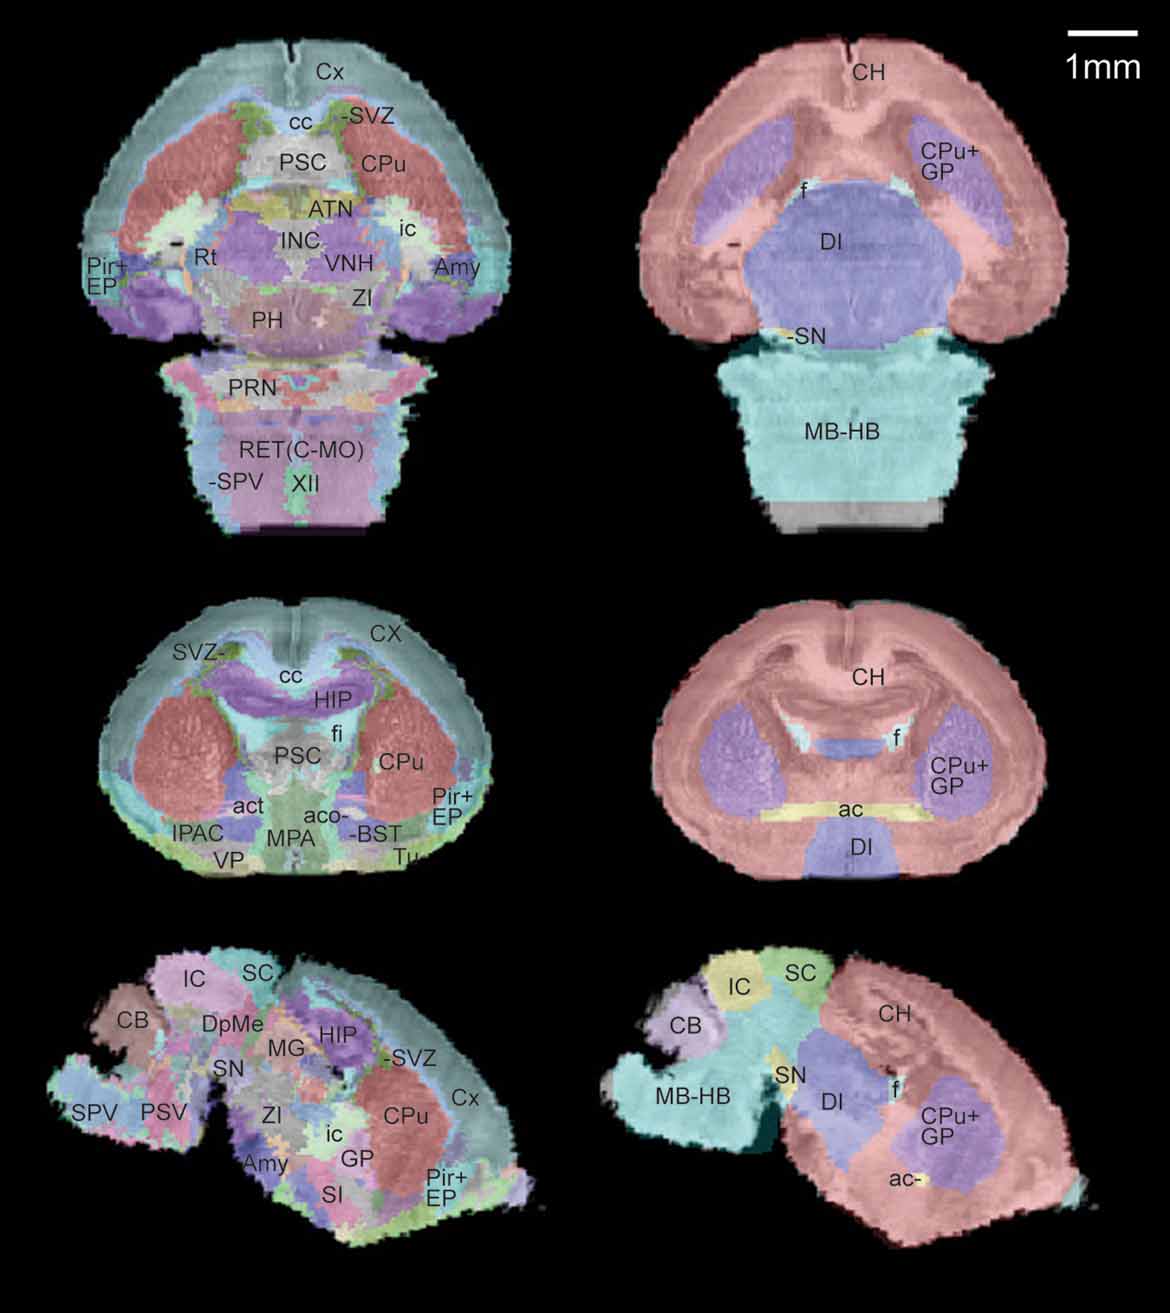
Figure 3. Co-registration of the multimodal neonatal atlas. Horizontal, coronal, and sagittal views of the Nissl atlas sectioned at position (−1.34, 0.77, −0.406) of the stereotaxic coordinate system defined in Lee et al., 2005 . (Left column) The high-resolution histological volume and the anatomical delineations were co-registered to the P0 atlas space defined in Lee et al., 2005 . (Right column) The anatomical structures from the MRI atlas brain (target for registration) are shown overlaid on the co-registered histological brain volume.
The co-registered multimodal atlas as well as the original anatomical delineations are available for download at http:∕∕www.loni.ucla.edu∕Atlases∕ . The visualization application SHIVA developed by LONI (http:∕∕www.loni.ucla.edu∕Software ) and MBAT developed by Mouse BIRN (Boline et al., 2006 ) can interactively describe the anatomical structures when viewing the atlas package consisting of the image volume, anatomical volume, and BrainGraph document.
Comparing this atlas with the adult mouse brain (MacKenzie-Graham et al., 2004 ), two neonatal structures stood out as having significant differences from their adult counterpart: the subventricular zone (SVZ) and the cerebellum (CB). While only a small area of SVZ is left in the adult olfactory area, it is easily visible along the lateral ventricle throughout the anterior forebrain at the age of P0 (Figure 3 , left). In contrast, the neonatal CB is unfoliated and occupies a much smaller portion in the brain, resulting in a large morphological difference from the adult. Because these areas go through such extreme changes over this period, it is logical to examine them for alterations of gene activity during brain development. This neonatal atlas offers a regional anatomical framework specific to the early developmental stage and is a valuable resource for these types of studies.
Managing gene expression data in the atlas space
The Lef1 gene assay dataset is used to illustrate our atlas-based management (Figure 4 ). The original data of the in situ hybridization images were acquired from the same batch of assay (assay T04972110a-Rostral from http:∕∕www.informatics.jax.org∕searches∕image.cgi?10055 ). Each image was registered to the corresponding atlas plane and the overlays of the registered pairs are shown in Figure 4 . Co-displaying the management planes allows for visual realization for the spatial relationship of these data in the atlas space (Figure 5 ).
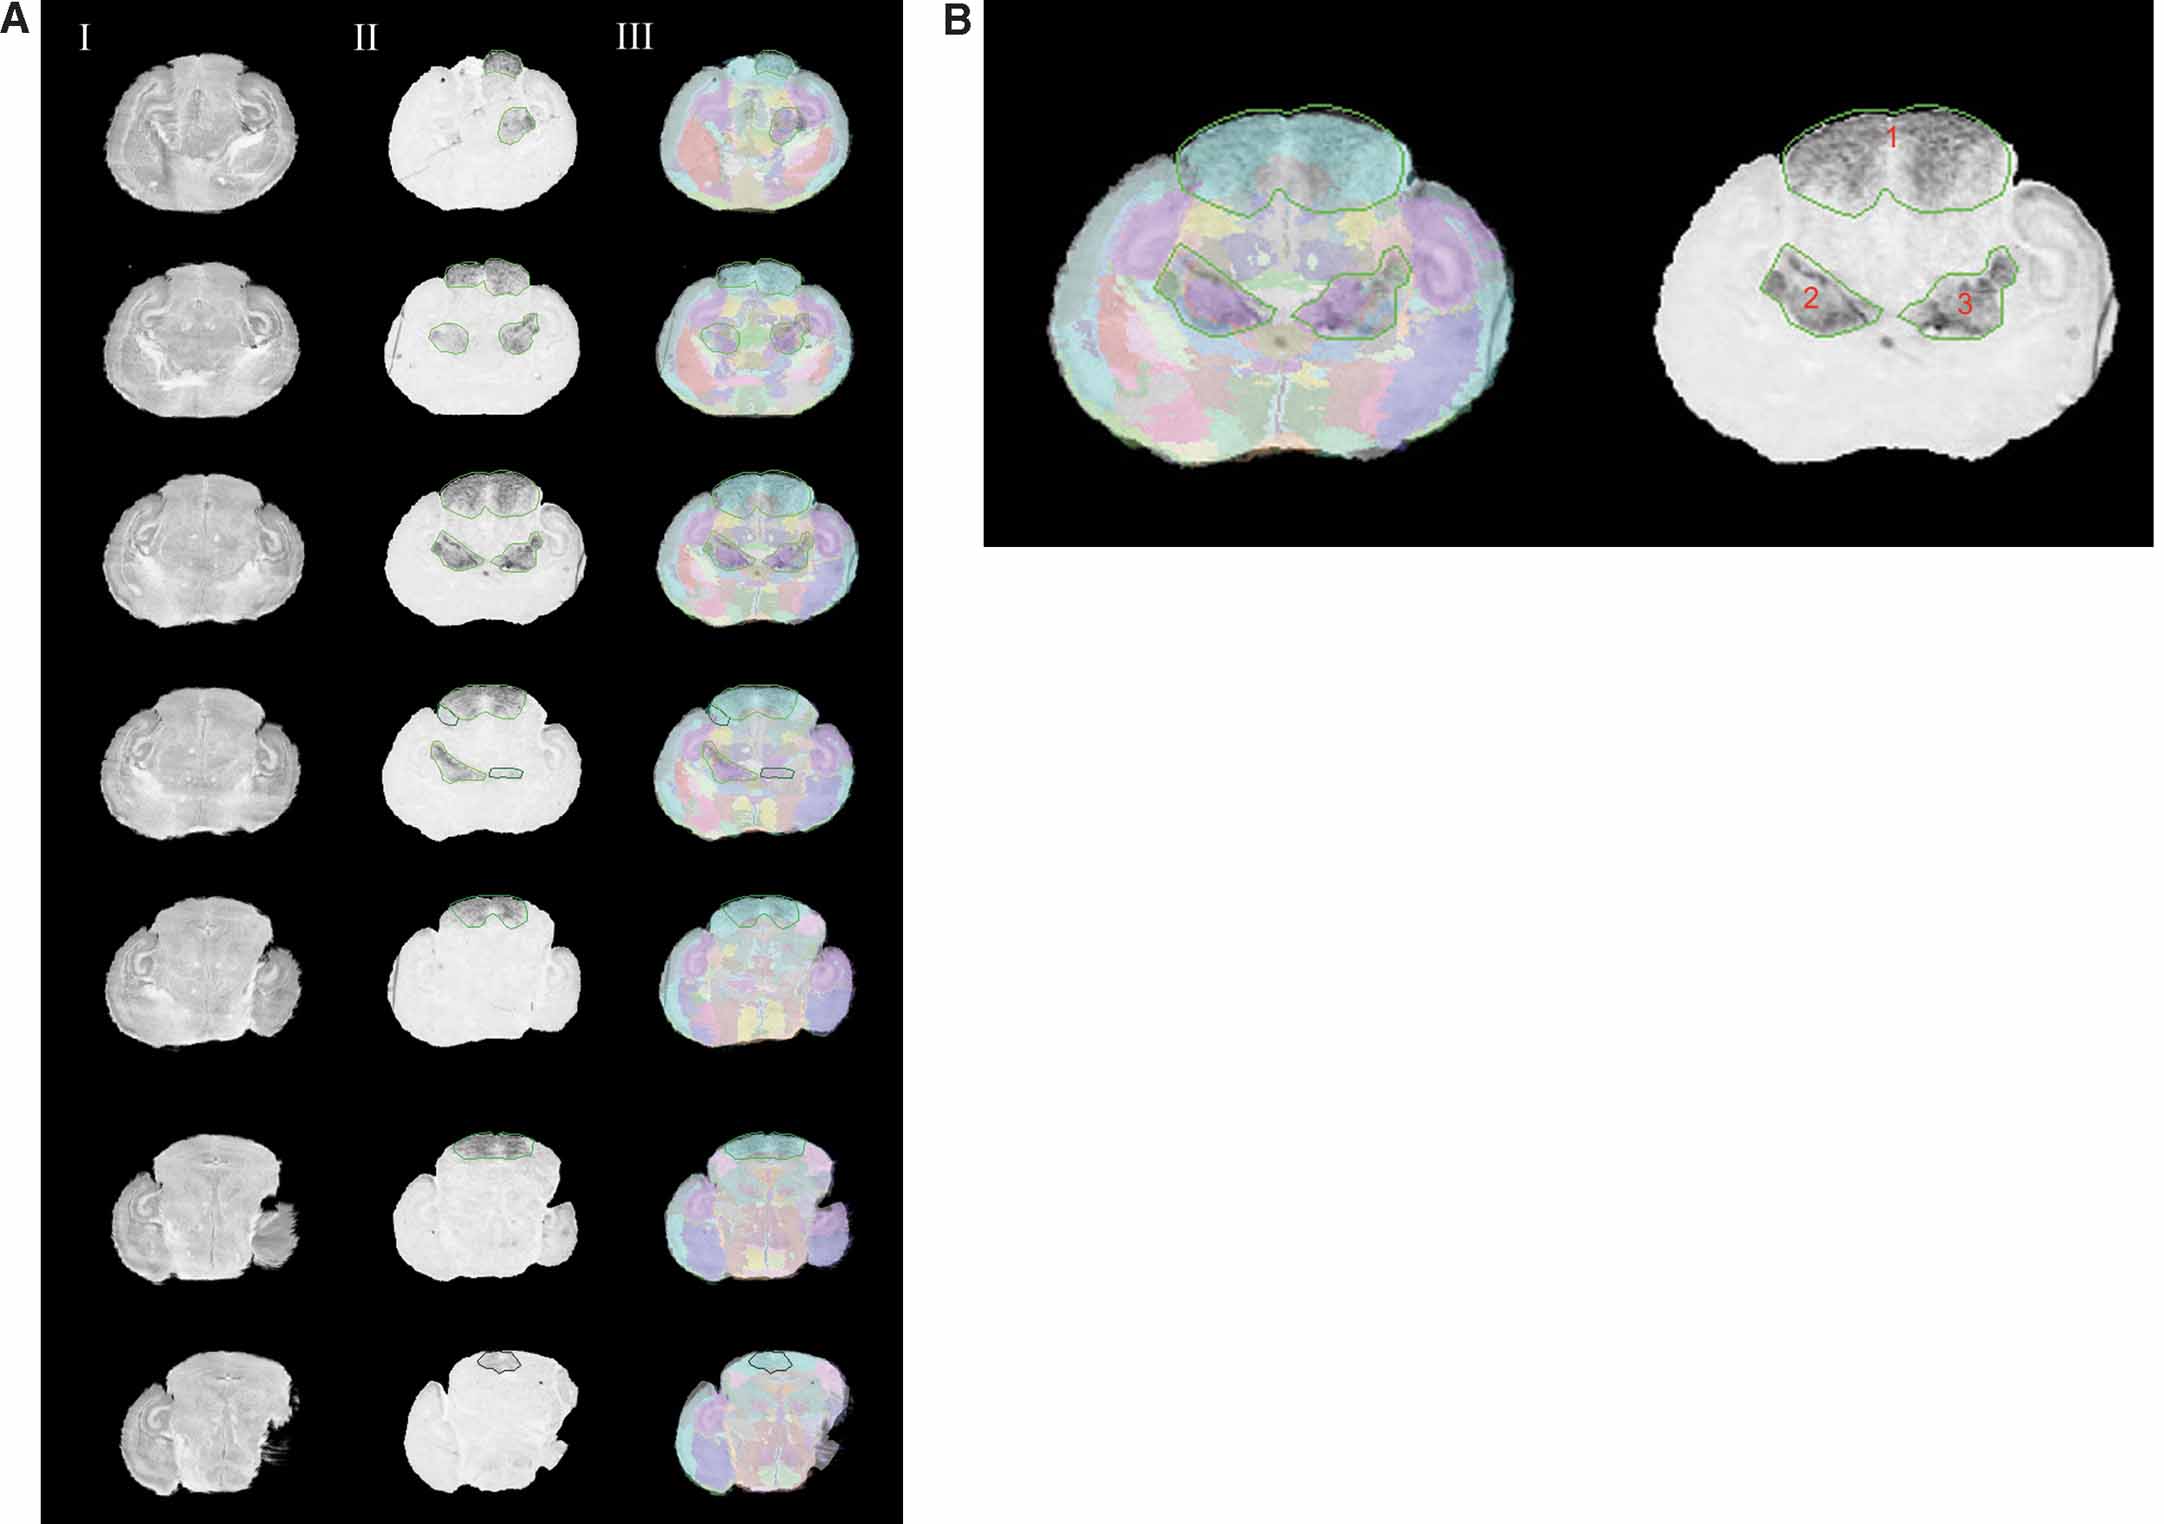
Figure 4. Normalizing the Lef1 gene expression data in the atlas space. (A) Rostral to caudal images of Lef1 with areas of positive gene expression and their corresponding slices in the Nissl Atlas. Column I: histological slices digitally sectioned from the atlas. Column II: registered in situ hybridization assay for Lef1 transcription factor with contours of enriched Lef1 gene expression. Each contour uses different shades of green to represent the expression level for the areas the contours surround, with a brighter one representing a higher gene expression level. Column III: the overlay of the Lef1 assay images, and the corresponding atlas slice with its anatomical delineations. Only images with areas of positive signals are shown here. Rows from top to bottom show a rostral-to-caudal order of the brain slices. (B) A larger view of the experimental image of the 3rd row in A. All three contours represent the highest gene expression level.
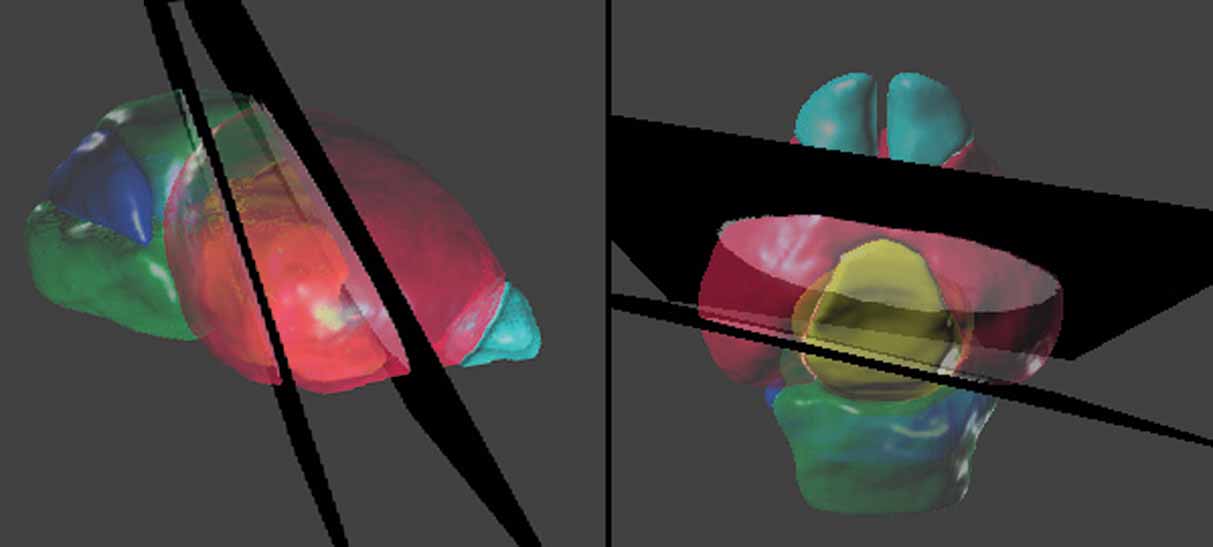
Figure 5. Spatial relations between the anatomical structures and the management planes for Lef1 dataset. The atlas is shown with the most rostral and caudal management planes (black) housing the in situ hybridization data from Figure 4 . The rest of the management planes are distributed between these planes and do not intersect within the brain. Left: lateral view. Right: dorsal view. The opaque blocks on the management planes are the registered brain slices of the in situ hybridization data. Color indices for the 3D objects of the anatomical structures—cyan, olfactory bulbs; red, cerebrum; yellow, diencephalons; green, midbrain-hindbrain; blue, cerebellum.
Based on data-to-atlas spatial relationship specific for an image, the contours that outline the areas with enriched gene expression on this image can be transformed into the atlas space (Figure 4 B and left of Figure 6 A). Co-localization of the ROI objects from the same dataset reconstructs the 3D expression for a gene in the atlas space and allows for relating this pattern to multiple anatomical structures (left of Figures Figure 6 A and 6 B). In this example, the expression of Lef1 gene seems to be mainly distributed in the superior colliculus and the ventral-lateral part of the thalamus.
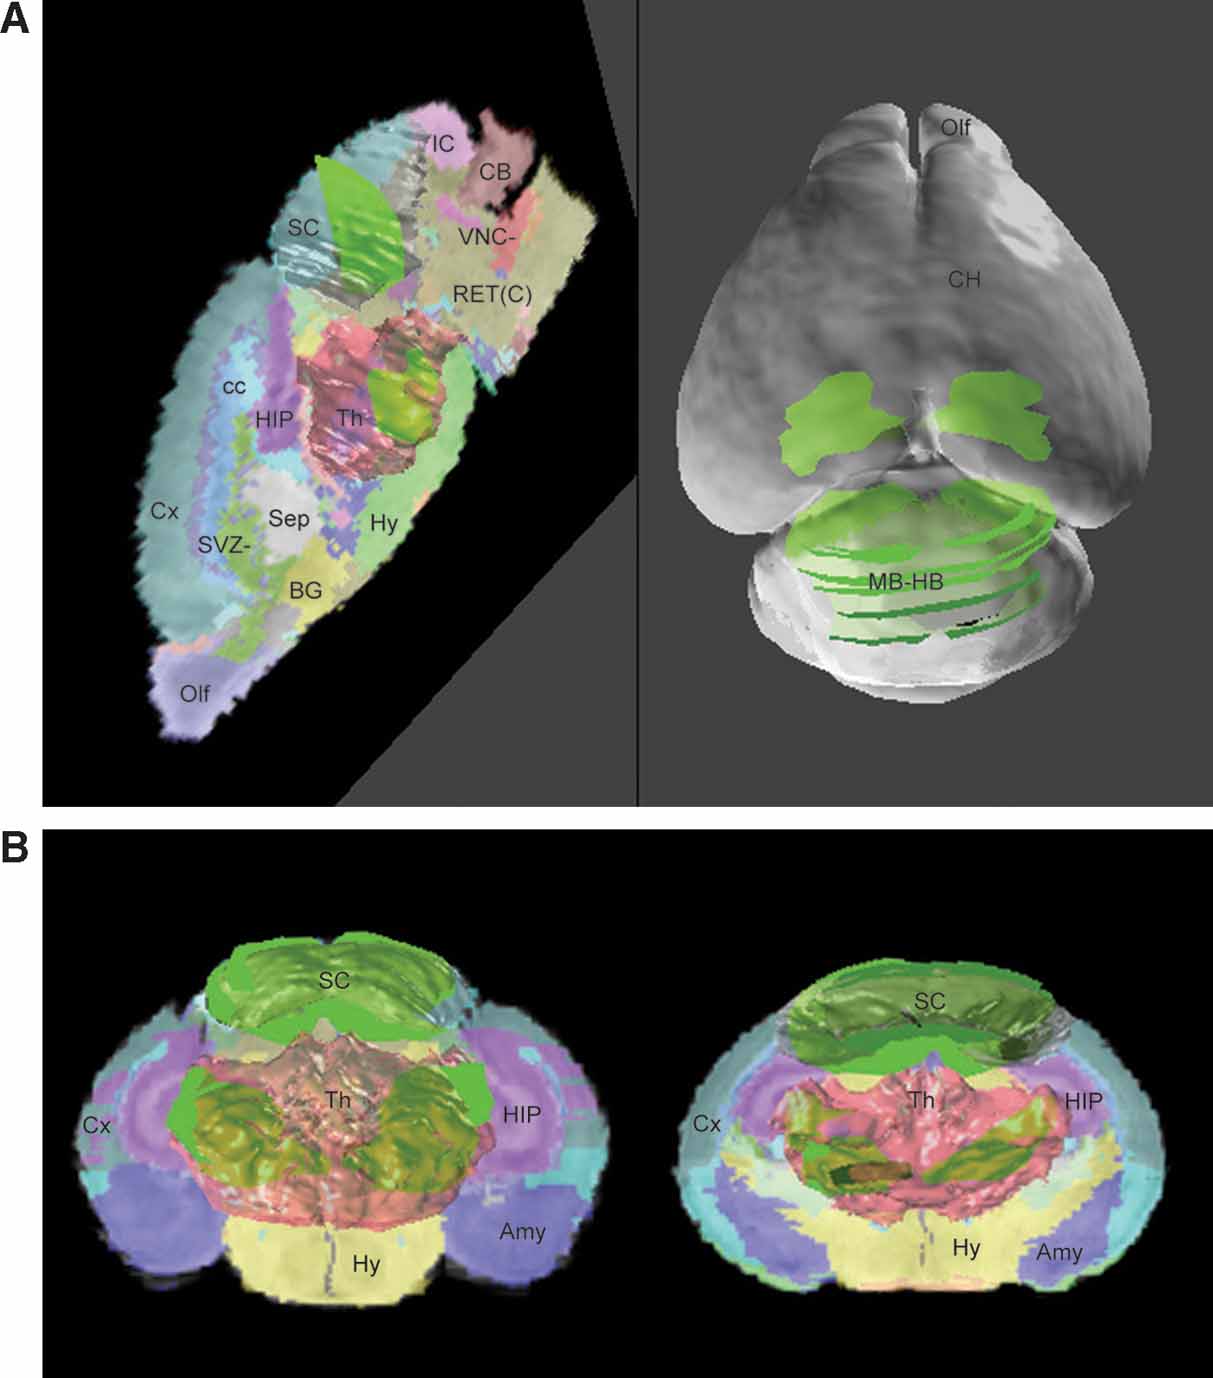
Figure 6. ROI objects used to represent the gene expression pattern in the atlas space. The ROI objects (green) of the Lef1 gene are displayed with the surface models of superior colliculus (SC, white) and thalamus (Th, light red) (A). Left: the contours illustrated in Figure 4 B were converted into 3D objects and displayed in the atlas space together with a sagittal slice of the high-resolution atlas. Right: distribution of ROI objects derived from all contours in Figure 4 A is shown on a surface model of the atlas. (B) Distribution of all ROI objects and two coronal sections of the atlas. Left: frontal view. Right: back view.
Since the ROI objects only represent the spatial information of a gene expression pattern, this spatial information needs to associate with the anatomical concepts in order to perform further cross-modality data analysis. The ratios described in the methods were used to determine the relation between the atlas structures and the ROI objects. Together, these can give an indication of this anatomical association when dealing with an imperfect cross-modality image registration.
The local anatomical ratio represents the anatomical composition of the ROI objects, and the inclusion ratio indicates a probability that an anatomical structure shows enriched gene expression. For example, in Figure 4 B, the two types of ratios for superior colliculus suggested that it is very likely the area within contour 1 (Figure 4 ) corresponds to this anatomical structure (left in Figure 7 A and left in Figure 7 B).
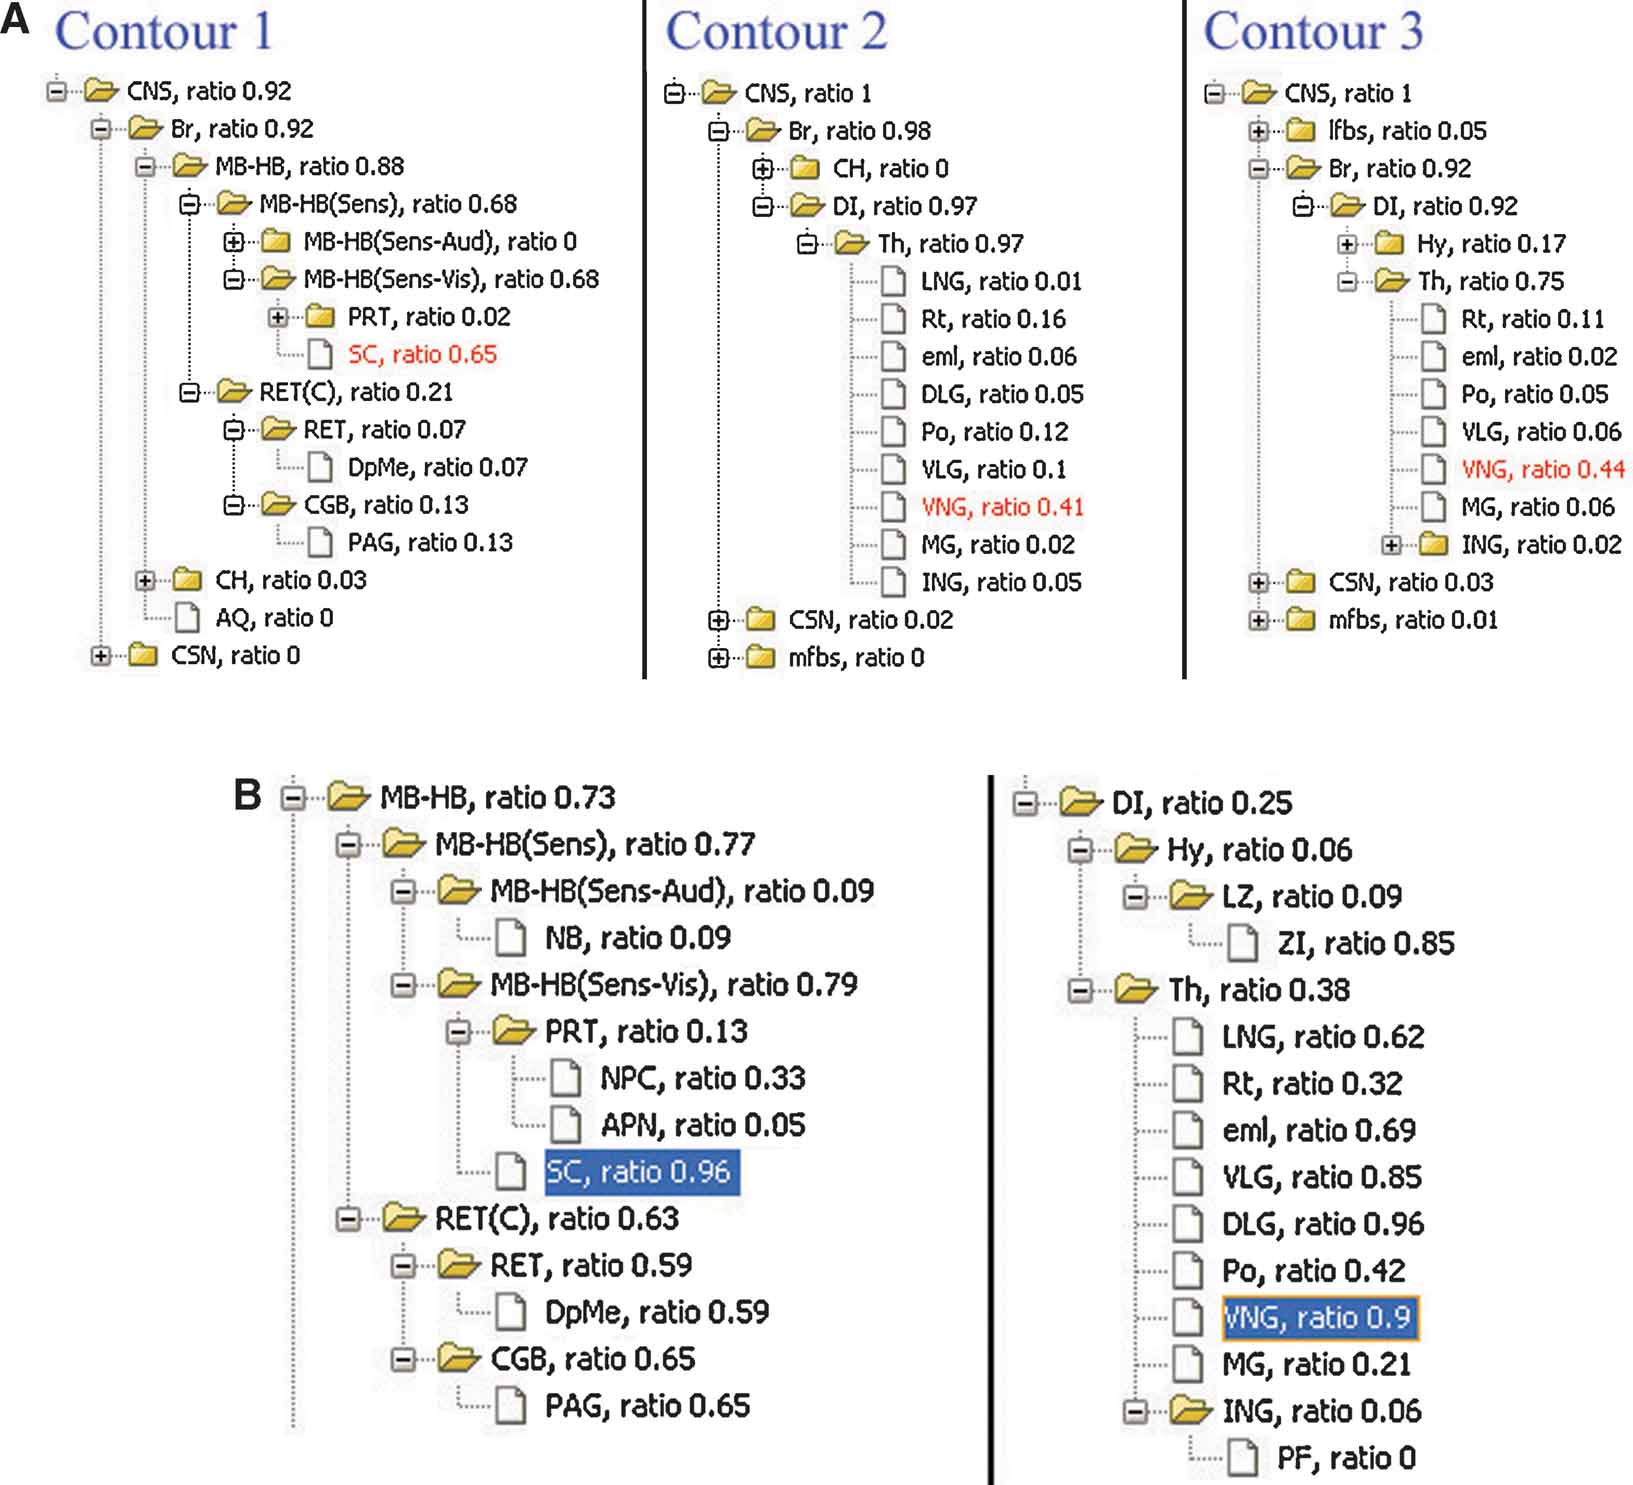
Figure 7. Local anatomical information relating to the gene expression pattern in single image. (A) Analysis of local anatomy for contours surrounding the areas with enriched Lef1 gene expression illustrated in Figure 4 B. The anatomical trees are the hierarchical summaries of the local anatomical composition within contours in Figure 4 B. The values appended to each of the structure abbreviations are the local anatomical ratios for each structure within this ROI. The highlighted structures were those with the largest local anatomical ratio within this ROI. (B) Structures in midbrain-hindbrain (MB-HB) (Left) and diencephalons (DI) (Right) are organized based on anatomical hierarchy. Inclusion ratios for each anatomical structure in this management plane are shown next to the structure abbreviations. The highlighted structures are those with significant ratios in both (A) and (B).
In the case that more than one significant structures map onto the range of ROI, the anatomical hierarchical relations can provide the most appropriate common parental structure to associate with this ROI object. For example, the ventral nuclear group (VNG) is the most significant structure for both of the ROI objects derived from contour 2 and 3 and is consistently enclosed by them in Figure 4 B (Figure 7 A, right two panels). However, this structure only partially occupies either of these two ROI objects (Figure 7 B, right panel) and is therefore not sufficient to represent them. Hence, instead of the VNG, it would be more appropriate to have these two ROI objects associate with its closer parental structure—the thalamus.
The expression pattern throughout the structures can be further examined using the inclusion ratio computed from all planes in the dataset. For example, the values computed for the Lef1 gene dataset demonstrate that it is highly expressed in superior colliculus and several structures in lateral and ventral thalamus such as dorsal lateral geniculate nucleus (DLG), ventral lateral geniculate nucleus (VLG), lateral nuclear group (LNG), and VNG (Figure 8 ). Association between the ROI object and the anatomical structures relates the ROI objects to several levels of the anatomical hierarchy, thus allowing for the extension of data retrieval and comparison at multiple anatomical scales (Boline et al., 2006 ; Martone et al., 2002 ).
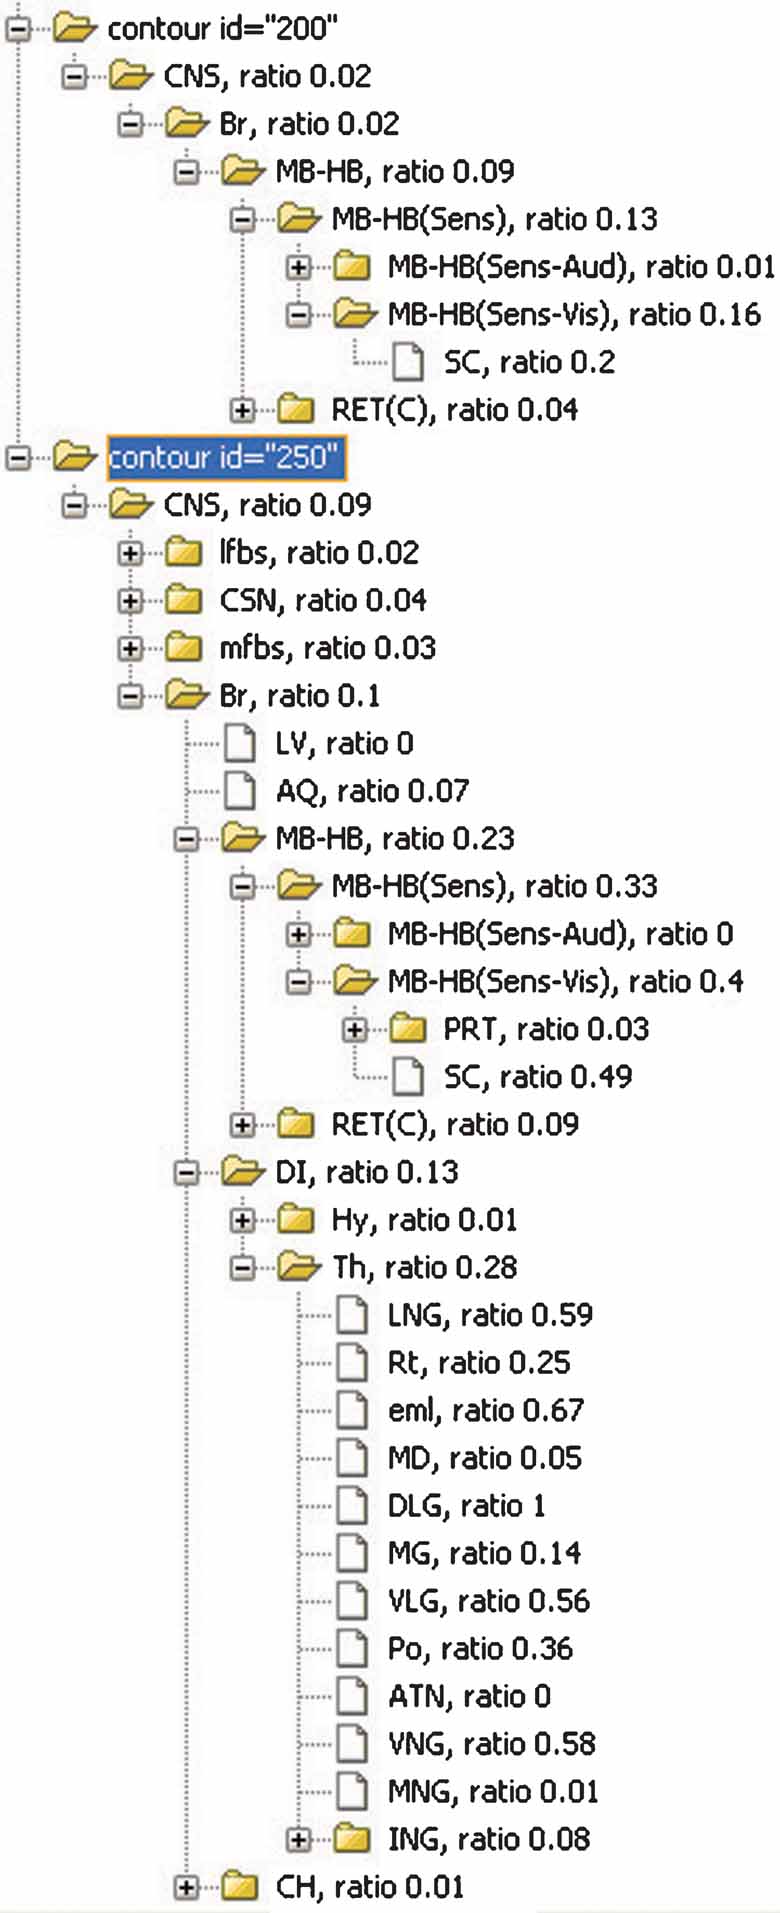
Figure 8. The inclusions ratios of anatomical structures from all planes in Lef1 dataset. The inclusion ratios of structures are summarized from all images in Lef1 dataset and differentiated with different expression levels (structures included by the ROI objects representing the same expression level were counted together. Only high expression level, represented with ID = 250 and 200, is shown here). The significant structures with enriched Lef1 expression include the superior colliculus (SC, 0.2 + 0.49 at expression level 200 and 250, respectively) and lateral and ventral thalamic structures LGN, DLG, VLG, and VNG.
The digital atlas can provide a management framework that facilitates cross-dataset comparison by using multiple “DataSet” documents. To simplify visualization of multiple genes and gene levels, ROIs coming from different “DataSet” documents can be assigned different colors (Figure 9 ). Presenting these ROI in the atlas space provides a clearer view of which genes are exclusively expressed (Figure 9 A) or co-expressed (Figure 9 B). Even though technique difficulties prevent the delineation of several small sub-structures, for example, layers in the cerebral cortex, co-registering the gene expression patterns in the atlas may still give additional information. For instance, Figure 9 B shows that while the ROI objects for the Mef2C and Neurod2 are both consistently associated with the cerebral cortex, the Mef2C gene is more restricted to the upper layers.
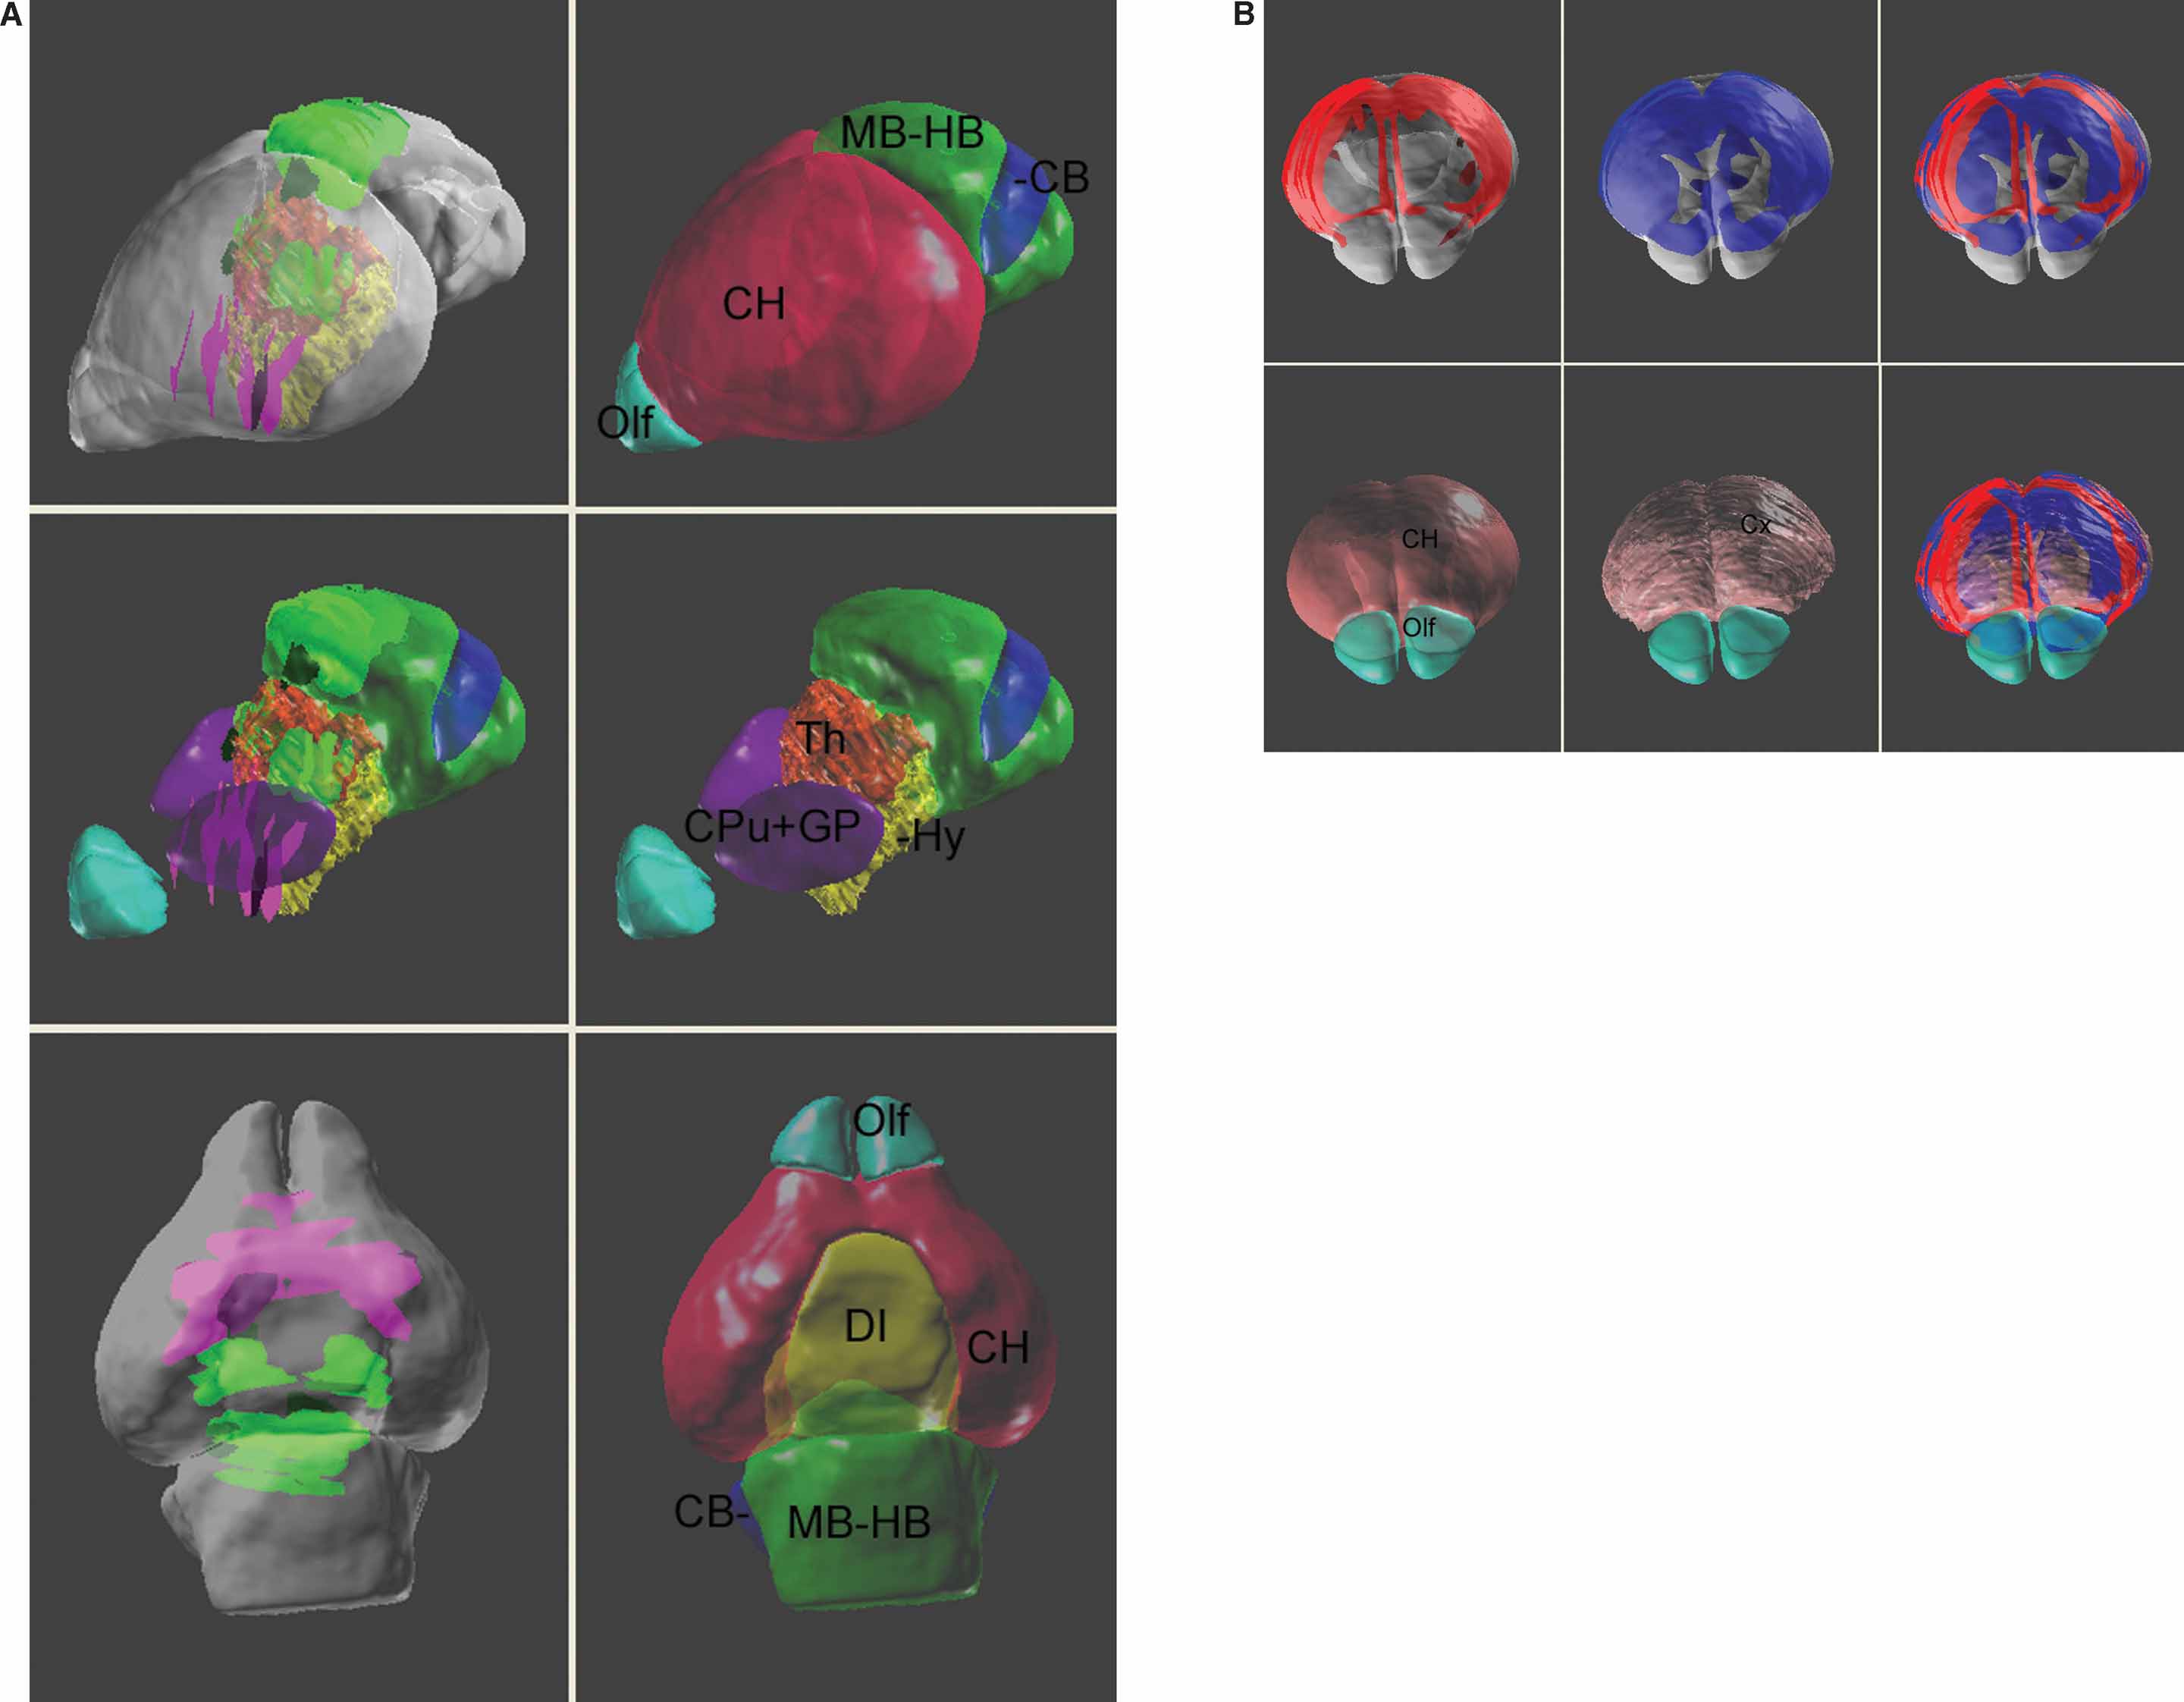
Figure 9. Co-visualization of multiple gene expression dataset in the atlas space. (A) Left column: co-expression patterns of Lef1 (green planer blocks) and Lhx8 (magenta planer blocks) in the atlas space. Right column: surface model of the anatomical structures. Middle row: the surface model of cerebrum is removed to reveal the location of the basal ganglia nuclei, thalamus, and the hypothalamus. The top two rows present the brain from a frontal-lateral view and the bottom row is a ventral view of the brain. Local anatomical analysis shows that the Lhx8 gene is expressed mainly in the area of basal ganglia and septum and is exclusive to the distribution of Lef1 gene. (B) A frontal-dorsal view for the expression of Mef2C (red, top-left), Neurod2 (blue, top-middle) genes, and together (right). The surface model of the anatomical structures were co-displayed in the bottom row.
Discussions
In this study, we provide a high-resolution atlas of neonatal mouse brain that is registered to the space defined by the averaged shape of native brains. We used in situ hybridization data to demonstrate the applicability of the atlas as a framework for data normalization and reconstruction of the gene expression pattern from individual experiments. Co-registering the gene expression data in the atlas space will allow for the analysis of data in an anatomical specific framework.
Significant developing structures for postnatal study
We observed that the SVZ and the CB of the neonate show significant differences from their adult counterparts, and they continue to differentiate postnatally. Thus, these are obvious areas to examine gene expression profile changes over the course of development. The anatomical models of these structures provided by this atlas are valuable resources for examining the developmental events in these structures.
The SVZ has been known as a pool of neuronal progenitor cells during embryonic neurogenesis from which the preneural cells continuously move to the cortical plate during corticogenesis. This structure begins to decrease dramatically during postnatal development and little remains in adulthood (Gates et al., 1995 ). This structure has been identified as the harbor for neural stem cells, as cells in this region retain their capability to differentiate into neuronal cells after the brain is fully developed (Alvarez-Buylla and Garcia-Verdugo, 2002 ). To study how this developing event evolves, it is necessary to examine the co-localization of gene product, extracellular matrix, and cell type within a small region. The high-resolution digital map thus provides a region-specific framework for centralizing data from different assays.
In CB, the migration of Purkinje cells has not yet completed at the time of birth, and cerebellar granule cells have just begun massive clonal expansion and differentiation. The CB at this development stage is thus unfoliated and occupies a much smaller portion in brain volume when compared with the adult. The relative ease of postnatal experimentation and well-known functional compartments make the CB a good model to study the structural pattern formation in mammalian central nervous system.
Morphological differences in CB as well as in other areas result in a complicated spatial relationship between the developing and the mature brain. This issue can be handled by using consistent nomenclature and the anatomical terms for the atlases of different developmental stages. By associating with a common anatomical model, experimental data from different developmental stages can be compared with each other. The digital atlas hence offers a dynamic framework to study these postnatal developmental events across different time courses.
Incorporating high-resolution gene expression data
The BIRN project has established a microarray database and relates these data to the adult brain atlas using anatomical concepts. Microarray assays are efficient in obtaining differentiated expression profiles of all the candidate genes. However, since it is difficult to dissect an unstained structure from the brain during sample preparation, the data generated with this method is related to brain anatomy on a coarse level. Many studies use this method for systematically screening for specific genes, and then identify their exact location on a cellular scale using in situ or immuno-histochemistry staining.
Unlike microarray data management, which can be related to anatomical concepts, management of 2D data requires a plane equation that relates the image pixels to the atlas. Several gene expression databases for mouse brain manage their image data by registering them to an orthogonal plane of the brain atlas that has defined stereotaxic coordinates (e.g., GenePaint, Carson et al., 2005 ; Allen Brain Atlas, Lein et al., 2007 ). Unlike adult mouse brain, no external reference points can be used to consistently orient the position of the developing brain. As a result, brain slices cannot be sampled with a fixed angle from an external landmark during sample collection. Since no canonical atlas plates are available to house data from oblique planes, current databases simply relate the gene expression in early development stages to brain anatomy by literally describing the expression patterns in the brain structures (e.g., MGI, Gray et al., 2004 ; GENSAT, Gong et al., 2003 ).
By providing a digital neonatal atlas, data of image format now can be associated with the anatomical infrastructure. Sections collected without spatial framework can be handled in the atlas space with linear transformation. Registering the gene expression pattern to an anatomical framework provides a more comprehensive picture than purely text descriptions (Figures 6 and 9 ). The high-resolution atlas allows the gene expression pattern in the images to be registered to a specified anatomical structure and is capable of containing the information with the anatomical models at multiple hierarchical levels (Figures 7 and 8 ). Data from a plane thus can be transferred to an anatomical base via this structural association, and can be correlated to both image and microarray data from the database using spatial transformations and anatomical concepts. Cross-community, cross-modality data analysis can then be performed with a proper design in dataset categorization and representation for data obtained from various sources. Such information integration will potentially save a great deal of time and resources by allowing the reuse of similar data from different studies.
Data analysis with reconstructed gene expression
The data models of gene expression patterns discussed in this manuscript only reflect the patterns from their source images and therefore are planar. The anatomical information derived from reconstructing 3D gene expression (Figures 8 ) implies the areas of gene activity in each anatomical structure. The distribution of expression within an anatomical structure can be inferred by extrapolating the planar ROI objects associated with that structure between image slices. This allows for statistical correlation of the expression pattern of genes with the distribution patterns of other gene products.
In addition to comparing the pattern of different genes, it is also possible to model the area with different cell type with the ROI objects and perform the same spatial analysis as the gene expression data. This in turn facilitates the examination of the interaction between gene products and their contributions to the function of the anatomical structures.
Conclusion
The digital neonatal atlas provides a high-resolution anatomical reference for neonatal brain and also a framework for normalizing gene expression data at an early developmental stage. The Mouse BIRN project has developed tools that allow data about specific genes to be retrieved from several public databases (e.g., GeneNetwork, Allen Brain Atlas, and GENSAT) and compared using an atlas interface. Incorporating data in the atlas space allows individual researchers to use the atlas as mediator to interact with a variety of atlas-associated public resources. Data from separate data sources can be compared and correlated with each other, thus facilitating cross-modality, cross-community data analysis for individual studies.
Conflict of Interest Statement
This research was conducted in the absence of any commercial or financial relationships that could be construed as a potential conflict of interest.
Acknowledgements
This work was supported by NIH Grant U24 RR021760 to the Mouse Biomedical Informatics Research Network (BIRN, http:∕∕www.nbirn.net ), which is funded by the National Center for Research Resources at the National Institutes of Health (NIH).
Appendix:
List of the abbreviations of anatomical structures described in the high-resolution P0 atlas.

References
Alvarez-Buylla, A., Garcia-Verdugo, J. M. (2002). Neurogenesis in adult subventricular zone. J. Neurosci. 22, 629–634.
Boline, J. K., MacKenzie-Graham, A., Shattuck, D., Yuan, H., Anderson, S., Sforza, D. M., Wang, J., Williams, R. W., Wong, W., Martone, M. E., Zaslavsky, I., and Toga, A. W. (2006). A digital atlas and neuroinformatics framework for query and display of disparate data. In Society for Neuroscience (Atlanta).
Bota, M., Dong, H.-W., and Swanson, L. W. (2005). Brain architecture management system. Neuroinformatics 3, 15–48.
Carson, J., Ju, T., Lu, H. C., Thaller, C., Xu, M., Pallas, S. L., Crair, M. C., Warren, J., Chiu, W., and Eichele, G. (2005). A digital atlas to characterize the mouse brain transcriptome. PLoS Comput. Biol. 1, e41.
Gates, M. A., Thomas, L. B., Howard, E. M., Laywell, E. D., Sajin, B., Faissner, A., Götz, B., Silver, J., and Steindler, D. A. (1995). Cell and molecular analysis of the developing and adult mouse subventricular zone of the cerebral hemispheres. J. Comp. Neurol. 361, 49–66.
Gong, S., Zheng, C., Doughty, M. L., Losos, K., Didkovsky, N., Schambra, U. B., Nowak, N. J., Joyner, A., Leblanc, G., Hatten, M. E., and Heintz, N. (2003). A gene expression atlas of the central nervous system based on bacterial artificial chromosomes. Nature 425, 907–908.
Gray, P. A., Fu, H., Luo, P., Zhao, Q., Yu, J., Ferrari, A., Tenzen, T., Yuk, D. I., Tsung, E. F., Cai, Z., Alberta, J. A., Cheng, L. P., Liu, Y., Stenman, J. M., Valerius, M. T., Billings, N., Kim, H. A., Greenberg, M. E., McMahon, A. P., Rowitch, D. H., Stiles, C. D., and Ma, Q. (2004). Mouse brain organization revealed through direct genome-scale TF expression analysis. Science 306, 2255–2257.
Jacobowitz, D. M., and Abbott, L. C. (1998). Chemoarchitectonic atlas of the developing mouse brain (CRC press).
Lee, E. F., Jacobs, R. E., Dinov, I., Leow, A., and Toga, A. W. (2005). Standard atlas space for C57BL∕6J neonatal mouse brain. Anat. Embryol. 210, 245–263.
Lein, E. S., Hawrylycz, M. J., Ao, N., Ayres, M., Bensinger, A., Bernard, A., Boe, A. F., Boguski, M. S., Brockway, K. S., Byrnes, E. J., Chen, L., Chen, L., Chen, T., Chin, M. C., Chong, J., Crook, B. E., Czaplinska, A., Dang, C. N., Datta, S., Dee, N. R., Desaki, A. L., Desta, T., Diep, E., Dolbeare, T. A., Donelan, M. J., Dong, H., Dougherty, J. G., Duncan, B. J., Ebbert, A. J., Eichele, G., Estin, L. K., Faber, C., Facer, B. A., Fields, R., Fischer, S. R., Fliss, T. P., Frensley, C., Gates, S. N., Glattfelder, K. J., Halverson, K. R., Hart, M. R., Hohmann, J. G., Howell, M. P., Jeung, D. P., Johnson, R. A., Karr, P. T., Kawal, R., Kidney, J. M., Knapik, R. H., Kuan, C. L., Lake, J. H., Laramee, A. R., Larsen, K. D., Lau, C., Lemon, T. A., Liang, A. J., Liu, Y., Luong, L. T., Michaels, J., Morgan, J. J., Morgan, R. J., Mortrud, M. T., Mosqueda, N. F., Ng, L. L., Ng, R., Orta, G. J., Overly, C. C., Pak, T. H., Parry, S. E., Pathak, S. D., Pearson, O. C., Puchalski, R. B., Riley, Z. L., Rockett, H. R., Rowland, S. A., Royall, J. J., Ruiz, M. J., Sarno, N. R., Schaffnit, K., Shapovalova, N. V., Sivisay, T., Slaughterbeck, C. R., Smith, S. C., Smith, K. A., Smith, B. I., Sodt, A. J., Stewart, N. N., Stumpf, K., Sunkin, S. M., Sutram, M., Tam, A., Teemer, C. D., Thaller, C., Thompson, C. L., Varnam, L. R., Visel, A., Whitlock, R. M., Wohnoutka, P. E., Wolkey, C. K., Wong, V. Y., Wood, M., Yaylaoglu, M. B., Young, R. C., Youngstrom, B. L., Yuan, X. F., Zhang, B., Zwingman, T. A., and Jones, A. R. (2007). Genome-wide atlas of gene expression in the adult mouse brain. Nature 445, 168-176.
Leow, A. D., Huang, S. C., Geng, A., Becker, J., Davis, S., Toga, A. W., and Thompson, P. (2005). Inverse consistent mapping in 3D deformable image registration: its construction and statistical properties. Proceedings of the Information Processing in Medical Imaging, Glenwoods Springs, Colorado.
MacKenzie-Graham, A., Jones, E. J., Shattuck, D. W., Dinov, I. D., Bota, M., and Toga, A. W. (2003). The informatics of a C57BL∕6J mouse brain atlas. Neuroinformatics 1, 397–410.
MacKenzie-Graham, A., Lee, E.-F., Dinov, I. D., Bota, M., Shattuck, D. W., Ruffins, S., Yuan, H., Konstantinidis, F., Pitiot, A., Ding, Y., Hu, G., Jacobs, R. E., and Toga, A. W. (2004). A multimodal, multidimensional atlas of C57BL∕6J mouse brain. J. Anat. 204, 93–102.
Martone, M. E., Gupta, A., Ludaescher, B., Zaslavsky, I., and Ellisman, M. H. (2002). Federation of brain data through knowledge-guided mediation. In Neuroscience Databases: A Practical Guide, R. Kotter, ed. (Boston, Kluwer Academic Press), pp. 275–292.
Paxinos, G., and Franklin, K. B. J. (2001). The mouse brain in stereotaxic coordinates. xxv, (San Diego, Academic Press), p. 264.
Schambra, U. B., Lauder, J. M., and Silver, J. (1992). Atlas of the prenatal mouse brain (LL, Academic Press).
Shattuck, D. W., MacKenzie-Graham, A., and Toga, A. W. (2004). DUFF: Software Tools for Visualization and Processing of Neuroimaging Data. Proceedings of the Biomedical Imaging: Macro to Nano, IEEE International Symposium, pp. 644–647.
Swanson, L. W. (1990). Brain maps: structure of the rat brain: a laboratory guide with printed and electronic templates for data, models, and schematics. (Elsevier).
Keywords: atlas, C57BL∕6J, in situ hybridization
Citation: Erh-Fang Lee, Jyl Boline and Arthur W. Toga (2007). A high-resolution anatomical framework of the neonatal mouse brain for managing gene expression data. Front. neuroinform. 1:6. doi: 10.3389/neuro.11/006.2007
Received: 13 September 2007;
Paper pending published: 24 September 2007;
Accepted: 12 October 2007;
Published online: 2 November 2007.
Edited by:
Jan G. Bjaalie, International Neuroinformatics Coordination Facility, Karolinska Institutet, Sweden; University of Oslo, NorwayReviewed by:
Trygve B. Leergaard, University of Oslo, NorwayIlya Zaslavsky, Spatial Information Systems Laboratory, University of California San Diego, USA
Copyright: © 2007 Lee, Boline, Toga. This is an open-access article subject to an exclusive license agreement between the authors and the Frontiers Research Foundation, which permits unrestricted use, distribution, and reproduction in any medium, provided the original authors and source are credited.
*Correspondence: Arthur W. Toga, Laboratory of Neuro Imaging, Department of Neurology, UCLA School of Medicine, 635 Charles Young Drive South, Suite 225, Los Angeles, CA 90095, USA. e-mail: arthur.toga@loni.ucla.edu