1
Center for Biomedical Imaging, Ecole Polytechnique Fédérale de Lausanne, Lausanne, Switzerland
2
Faculty of Biology and Medicine, University of Lausanne, Lausanne, Switzerland
3
Department of Radiology, University of Lausanne, Lausanne, Switzerland
4
Department of Radiology, University of Geneva, Geneva, Switzerland
Glucose supply from blood to brain occurs through facilitative transporter proteins. A near linear relation between brain and plasma glucose has been experimentally determined and described by a reversible model of enzyme kinetics. A conformational four-state exchange model accounting for trans-acceleration and asymmetry of the carrier was included in a recently developed multi-compartmental model of glucose transport. Based on this model, we demonstrate that brain glucose (Gbrain) as function of plasma glucose (Gplasma) can be described by a single analytical equation namely comprising three kinetic compartments: blood, endothelial cells and brain. Transport was described by four parameters: apparent half saturation constant Kt, apparent maximum rate constant Tmax, glucose consumption rate CMRglc, and the iso-inhibition constant Kii that suggests Gbrain as inhibitor of the isomerisation of the unloaded carrier. Previous published data, where Gbrain was quantified as a function of plasma glucose by either biochemical methods or NMR spectroscopy, were used to determine the aforementioned kinetic parameters. Glucose transport was characterized by Kt ranging from 1.5 to 3.5 mM, Tmax/CMRglc from 4.6 to 5.6, and Kii from 51 to 149 mM. It was noteworthy that Kt was on the order of a few mM, as previously determined from the reversible model. The conformational four-state exchange model of glucose transport into the brain includes both efflux and transport inhibition by Gbrain, predicting that Gbrain eventually approaches a maximum concentration. However, since Kii largely exceeds Gplasma, iso-inhibition is unlikely to be of substantial importance for plasma glucose below 25 mM. As a consequence, the reversible model can account for most experimental observations under euglycaemia and moderate cases of hypo- and hyperglycaemia.
Brain function relies on glucose supply from blood, which occurs through membrane-spanning proteins that are facilitative carriers located at the blood-brain-barrier (BBB). There are several glucose carrier isoforms present in the brain. However, the predominant glucose transporter (GLUT) proteins involved in cerebral glucose utilization are GLUT1 and GLUT3, GLUT1 being present in all brain cells including the endothelial cells of the capillaries (and with very low neuronal expression in vivo), and GLUT3 almost restricted to neurons (reviewed in Simpson et al., 2007
). Therefore, GLUT1 is considered the principal carrier of glucose at the BBB.
The process of glucose transport in the brain is saturable (Crone, 1965
) but not rate limiting for the glycolytic pathway (Betz et al., 1976
). Models of glucose transport across the BBB were developed based on standard Michaelis-Menten (MM) kinetics (e.g. Lund-Andersen, 1979
). However, since brain glucose can achieve concentrations similar to or higher than the KM of the glucose carrier, reversible MM kinetics has been introduced to describe the transport process (Cunningham et al., 1986
; Gruetter et al., 1998
). The reversible MM kinetics of glucose transport implies a near linear relation between brain and plasma glucose, as it has been experimentally determined in several studies in both humans (e.g. Gruetter et al., 1998
) and rats (e.g. Choi et al., 2002
). The reversible MM equation previously derived (Cunningham et al., 1986
; Gruetter et al., 1998
) reliably describes the relationship of brain to plasma glucose but it has not been taken as a general model because it is unable to account for features of the glucose carrier that include trans-acceleration or asymmetry (Barros et al., 2007
). On the other hand, a conformational four-state exchange kinetic model of simple solute carriers (e.g. Cuppoletti and Segel, 1975
) can account trans-acceleration, product inhibition and asymmetry (Carruthers, 1990
), and was used in a recently developed multi-compartmental theoretical model of brain glucose transport (Barros et al., 2007
).
Recently developed models describe the dynamics of brain glucose transport over time but require many unknown parameters and can only be solved by numerical analysis (e.g. Barros et al., 2007
; Simpson et al., 2007
). The aim of the present study was to develop a single analytical expression based on the aforementioned conformational four-state exchange model of carriers to describe steady-state glucose transport across the BBB with only three unknown constants. The analytical equation that was now developed was tested with previously measured relationships between brain and plasma glucose concentrations and compared to both the reversible and standard MM models.
Kinetic Model of Glucose Transport
Glucose selectively binds to facilitative glucose carriers that mediate solute movement in both directions of the BBB. This facilitated diffusion is dependent on the concentration gradient, which is maintained by phosphorylating intracellular glucose thus achieving continued net uptake. Non-carrier mediated diffusion of glucose molecules through the plasma membrane was assumed to be negligible as generally observed (e.g. Gruetter et al., 1998
; Barros et al., 2007
). As referred before, it was considered that GLUT1 is the main responsible for the facilitative transport of glucose across the BBB (Simpson et al., 2007
).
Figure 1
A represents the alternating-conformation model for a membrane carrier (e.g. Cuppoletti and Segel, 1975
), for which Eq. 1 can be derived using the King-Altman method (King and Altman, 1956
) and the definitions proposed by Cleland (1963)
, as shown in Section “Derivation of the Net Velocity Equation for the Four-State Exchange Model” in Appendix.
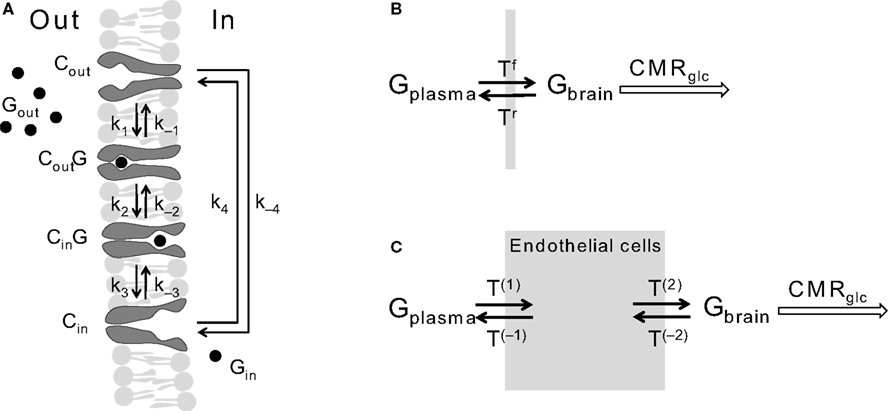
Figure 1. (A) Schematizes the alternating-conformation kinetics of the glucose carrier. In the absence of glucose (Gout or Gin), the carrier can exist in two inter-converting isomers that are ready to bind glucose either outside (Cout) or inside (Cin) the membrane. When loaded, the carrier can also assume two isomeric forms favouring glucose release to the outer (CoutG) or inner (CinG) side of the membrane. The rate constants k1 and k−3 define glucose binding while k−1 and k3 define its dissociation from the carrier. The rate constants k2 and k−2 or k4 and k−4 reflect the isomerisation of the loaded or unloaded carrier. Panel (B) Shows the simplest model of bidirectional glucose transport (Tf and Tr) represent the forward and reverse fluxes of glucose diffusion) through a BBB that was considered as a single membrane. In panel (C), the compartment composed by the endothelial cells was included and thus four unidirectional fluxes (T) are required to describe glucose flow through the BBB. The glucose consumption rate CMRglc was considered as a metabolic compartment in the system.
In Eq. 1, v0 is the net transport across the carrier, Vmax is the maximum velocity of the forward transport, Gout and Gin are the glucose concentrations in the outer and inner compartments,  and
and  are the Michaelis constants for the forward and reverse transports, Keq is the equilibrium constant for the overall reaction, which is 1 for facilitated diffusion processes such as brain glucose transport (discussed in Cuppoletti and Segel, 1975
), and Kii is an inhibition constant, in particular the iso-inhibition constant reflecting the inhibition of Gout transport by Gin (Segel, 1993
).
are the Michaelis constants for the forward and reverse transports, Keq is the equilibrium constant for the overall reaction, which is 1 for facilitated diffusion processes such as brain glucose transport (discussed in Cuppoletti and Segel, 1975
), and Kii is an inhibition constant, in particular the iso-inhibition constant reflecting the inhibition of Gout transport by Gin (Segel, 1993
).
and are the Michaelis constants for the forward and reverse transports, Keq is the equilibrium constant for the overall reaction, which is 1 for facilitated diffusion processes such as brain glucose transport (discussed in Cuppoletti and Segel, 1975
), and Kii is an inhibition constant, in particular the iso-inhibition constant reflecting the inhibition of Gout transport by Gin (Segel, 1993
).From Eq. 1, we note that the inhibition constant Kii represents the Gin at which the velocity of glucose uptake is half of the maximum under saturating Gout (i.e when  ). Classic enzymology predicts that Gin in the system described by this equation acts as a mixed (or noncompetitive) inhibitor of the glucose carrier (Leskovac, 2003
).
). Classic enzymology predicts that Gin in the system described by this equation acts as a mixed (or noncompetitive) inhibitor of the glucose carrier (Leskovac, 2003
).
). Classic enzymology predicts that Gin in the system described by this equation acts as a mixed (or noncompetitive) inhibitor of the glucose carrier (Leskovac, 2003
).In the derivation of Eq. 1, considering that the isomerisation rate of the unloaded carrier is faster than the other conformational changes is equivalent to the assumption of a single conformation for the unloaded carrier (see “Derivation of the Four-State Conformational Model Assuming Fast Isomerisation of the Unloaded Carrier” in Appendix). In that case, the expression derived for the net velocity matched the equation derived for the reversible MM model with two carrier-glucose intermediate complexes. This suggests that Kii is a kinetic parameter that represents the isomerisation between the unloaded carriers at the membrane (depicted as Cout and Cin in Figure 1
A), being the eventual product inhibition related to the maintenance of the carrier in a conformation that facilitates the binding of Gin.
In the numerical analysis of glucose transport at the BBB by Barros et al. (2007)
, the best description of experimental observations by a conformational four-state exchange model included symmetric rather than asymmetric glucose carriers. Carrier asymmetry is pertinently analysed in Section “Asymmetry of the Carrier” in Appendix, which suggests that the maximum rate of glucose transport is largely unaffected by the presence of asymmetric carriers at the BBB. Therefore, assuming kinetic symmetry of the carrier, Eq. 1 can be simplified to:
where Vmax is the maximum apparent velocity of the forward transport and KM is the Michaelis constant for both forward and reverse transport.
Glucose transport across the BBB was described as a three compartment system as in previous studies (e.g. Cunningham et al., 1986
; Mason et al., 1992
; Gruetter et al., 1998
): the BBB separates the blood circulation compartment from the brain aqueous phase, which is kinetically separated from the metabolic pool where glucose is consumed. In this model, the physical distribution space of glucose at steady-state was assumed to equal the brain water phase, which implies that glucose is evenly distributed in the intra- and extracellular spaces (discussed in Lund-Andersen, 1979
; Pfeuffer et al., 2000
) and that transport across cellular membranes is fast compared to glucose consumption rate. In a first approach, the BBB was assumed to behave as a single membrane (Figure 1
B). Since there is a relatively small distribution space for glucose inside endothelial cells and the rate of transport is fast when compared to consumption (Simpson et al., 2007
), this approximation is valid at steady-state. As referred above, transport across the BBB was described using a composition of unidirectional fluxes and symmetric kinetic constants for influx and efflux. The fraction of blood volume in the brain depends on the experimental conditions that affect subject physiology (Shockley and LaManna, 1988
). With a blood volume of 3% and a dry weight of 20%, the size of the entire aqueous phase (Vd) was considered 77% of brain’s volume (Lund-Andersen, 1979
). Cerebral glucose consumption rate was considered to be invariable in the range of glucose concentrations analysed.
At steady-state, inward transport (Tf) matches outward transport (Tr) plus glucose consumption, i.e. brain glucose is described by the expression:

where Gbrain is the glucose in the brain (in μmol g−1), T is the rate of glucose influx (Tf) or efflux (Tr) across the BBB (in μmol g−1 min−1), and CMRglc is the cerebral metabolic rate for glucose consumption (in μmol g−1 min−1), schematised in Figure 1
B.
By inserting Eq. 2 in Eq. 3, the relation between glucose concentrations in brain and plasma at steady-state can then be described by:
where Gbrain and Gplasma are the concentrations of glucose in brain (in μmol g−1) and in plasma (in mM), Tmax denotes the apparent maximal transport rate across the BBB (μmol g−1 min−1), Kt and Kii denote the apparent Michaelis and inhibition constants (in mM), Vd is the volume of the physical distribution space of glucose in the brain (0.77 mL/g).
From Eq. 4, it is apparent that when Kii equals Kt, the equation is formally equivalent to the equation deduced for the standard MM kinetics (see Gruetter et al., 1998
). We also note that if Kii largely exceeds Gplasma, Eq. 4 approximates the form derived for the reversible MM model previously described (Gruetter et al., 1998
). As stated above and shown in Section “Derivation of the Four-State Conformational Model Assuming Fast Isomerisation of the Unloaded Carrier” in Appendix, the reversible MM model is equivalent to the four-state conformational model with a fast exchange rate between unloaded carrier conformations (see Eq. A5).
Transport Model Including Endothelial Compartment
In the model described above, glucose uptake by the brain was simplified to be across a single membrane, which reduced the modelled system to the minimum number of required compartments. In reality, other physical compartments must be considered when glucose diffuses between the blood stream and the cytosol of brain cells where glucose is phosphorylated by hexokinase. Endothelial cells and interstitial space are two compartments that must be considered between the blood and the brain cells. A single but complex expression can be derived for a model that includes all these compartments, as shown in Section “Transport Model Including Both Endothelial and Interstitial Compartments” in Appendix.
However, while the distribution of GLUT1 in the luminal and abluminal membranes of the endothelium is on the same order of magnitude (e.g. Simpson et al., 2007
), glucose transporter proteins are more concentrated in the membrane of brain cells than in membranes of the endothelium (discussed in Barros et al., 2007
). Accordingly, the diffusion across the membranes of astrocytes and neurons is not limiting for the global rate of glucose transport and thus the interstitial space and the brain cells are traditionally considered as a single kinetic compartment, consistent with similar intra- and extracellular glucose concentrations (Pfeuffer et al., 2000
; Poitry-Yamate et al., 2009
). In these conditions, a model can be designed as shown in the scheme of Figure 1
C, adding the endothelial compartment to the model of Figure 1
B. The endothelium was taken as a finite compartment and much smaller than the compartment constituted by brain cells (Simpson et al., 2007
), and endothelial glucose consumption was neglected.
At steady-state, glucose transport is now represented by the following mathematical expressions:
where Gend is the glucose concentration in the endothelial compartment (in μmol g−1), and T are the unidirectional fluxes depicted in Figure 1
C (in μmol g−1 min−1). By inserting Eq. 2 in Eq. 5, and assuming symmetric transport properties for both membranes of the endothelial compartment, we arrive at the expression:
relating Gbrain and Gplasma at steady-state, and accounting for the effect of the inclusion of the endothelial compartment in the model. As above, when Kii largely exceeds Gplasma we obtain an equation equivalent to the corresponding formulation of reversible MM kinetics (see Appendix in Gruetter et al., 1998
). Interestingly, by rearranging the components of this equation, we can create an expression with the same algebraic typology of Eq. 4, which assumed a single membrane at the BBB:
Comparing this expression to Eq. 4, we can infer that the maximum rate of glucose diffusion in the overall process is affected by both Kt and Kii. In this model that includes two membranes defining the endothelial compartment, the calculated Tmax for glucose uptake represents the maximum transport rate at each membrane and not for the global mechanism, and hence Tmax will have a different value from the single-membrane model. The kinetic constants Kt and Kii have the same value either the model is extended to include the endothelium or not.
Estimation of Kinetic Parameters and Statistical Analysis
Previously published relationships of Gbrain to Gplasma were fitted with the obtained analytical Eqs 4 and 6. In particular, the model was tested with results acquired in vivo by localized 1H NMR spectroscopy from human subjects (Gruetter et al., 1998
) and rats (Choi et al., 2002
; Lei and Gruetter, 2006
), and measured with biochemical assays (Morgenthaler et al., 2006
; Poitry-Yamate et al., 2009
).
Data analysis was performed with GraphPad Prism 4 (GraphPad Software, CA, USA). The entire range of measured values in each data set was fitted using a non-weighted minimization of the sum of squares. The F-test was used to compare the fit of the currently described four-state conformational model with the reversible MM model.
Transport was described by four parameters: apparent half saturation constant Kt, apparent maximum rate constant Tmax, the isoinhibition constant Kii, and glucose consumption rate CMRglc. Tmax was estimated relatively to a constant CMRglc, which was assumed to not vary over the range of glucose concentrations studied. The determined kinetic parameters were compared to the values obtained with the standard and reversible models reported in the respective studies (Gruetter et al., 1998
).
The kinetic parameters describing brain glucose transport were determined with from published data sets (Gruetter et al., 1998
; Choi et al., 2002
; Morgenthaler et al., 2006
), which are plots of brain glucose concentration measured as function of plasma glucose.
Table 1
summarises the kinetic parameters determined with the four-state conformational model with or without the endothelial compartment, and with the reversible and standard MM models. Including the endothelial compartment in the model, glucose transport at the BBB was characterized by Kt ranging from 1.5 to 3.5 mM, Tmax/CMRglc from 4.6 to 5.6, and Kii from 51 to 149 mM.
The comparison of the fit quality of the present four-state conformational model with the reversible MM model to these data sets is shown in Figure 2
. The fitting of these three data sets with the conformational and the reversible models was not significantly different (F = 0.18 and P = 0.68 for Figure 2
A, F = 0.62 and P = 0.42 for Figure 2
B, F = 0.03 and P = 0.86 for Figure 2
C). Therefore the reversible MM model that has one less unknown parameter may be preferable for the description of glucose transport in these particular cases.
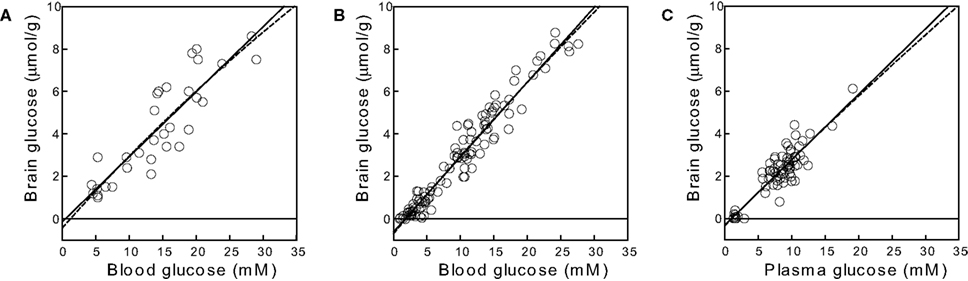
Figure 2. Brain glucose concentration as function of plasma glucose concentration in three different studies. (A) Human brain, in Gruetter et al. (1998)
; (B) rat brain (under α-chloralose anaesthesia), in Choi et al. (2002)
;
(C) rat brain, in Morgenthaler et al. (2006)
. The data sets were analysed with the reversible (solid lines) and the conformational four-state exchange (dashed lines) models (see kinetic parameters in Table 1
). In these experimental conditions and for the range of glucose concentrations studied, the reversible MM model is clearly able to describe the brain-blood glucose relationship, with the advantage of requiring the estimation of only two
kinetic parameters.
We observed that the current model can fail to reliably describe glucose transport in cases where Gbrain was studied over a more limited range of Gplasma or if data was absent at lower Gplasma (Figure 3
A). In such cases, lacking the initial values that define the experimental curve, Kii tends to equal Kt leading to kinetics that is similar to the standard MM model. For the particular data set of Figure 3
A (Lei and Gruetter, 2006
), Tmax/CMRglc was 9.2 ± 5.5 (0–20.2) and Kt was 8.8 ± 11.1 (0–31.0) mM. On the other hand, when data was mainly composed of measurements at low Gplasma and few high Gplasma, Kii tends to infinity and the fitting superimposes the reversible MM model. This case is exemplified in Figure 3
B (Poitry-Yamate et al., 2009
), where Tmax/CMRglc was 4.9 ± 0.4 (4.0–5.7) and Kt was 4.1 ± 1.3 (1.5–6.7) mM.
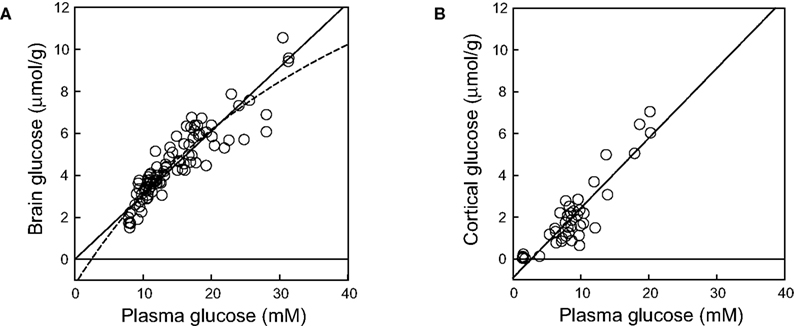
Figure 3. Brain glucose concentration as function of plasma glucose concentration in two extreme cases, when the experimental curve is ill-defined at lower (A) or higher (B) plasma glucose concentrations. In panel (A), the model takes the form of the standard MM model (results from the whole rat brain reported in Lei and Gruetter, 2006
); in panel (B), the model superimposes the reversible MM model (results from the rat cortex reported in Poitry-Yamate et al., 2009
).
The present work derives a single analytical expression that describes steady-state glucose transport across the BBB using a model of a carrier with four possible conformations, including isomerisation of the loaded or unloaded carrier and glucose binding or dissociation at both sides of the membrane. This model was described by a Kt on the order of a few mM, as previously determined from the reversible model, and an iso-inhibition constant Kii that largely exceeds Gplasma, suggesting a week inhibitory role of Gbrain on glucose uptake.
The system was first described as a single membrane at the BBB and then extended to include the endothelial cells as a compartment representing the BBB. The equations of the overall process in each of these models are algebraically equivalent and only differ in the estimated Tmax of glucose transport that has a two-fold different value and thus must have a different interpretation: the apparent maximum rate of glucose transport was approximately doubled when the endothelial compartment was included, representing the maximum transport at each membrane and not for the overall transport process. As expected from previous studies (Pappenheimer and Setchell, 1973
; Gruetter et al., 1998
), kinetic constants reflecting substrate affinity (Kt and Kii) were not affected by the extension to include the endothelial compartment.
These compartmental models may also be described to include asymmetry of the glucose carrier kinetics. This does not affect the algebraic form and thus the fitting of the model to the relation between brain and plasma glucose concentrations. However, increasing the number of kinetic constants in such expression did not allow a reliable estimation of all the parameters as the inherent degrees of freedom are insufficient. For such models a numerical analysis would be preferred in detriment of using a single analytical expression to describe the glucose transport mechanism.
Since the concentration of carriers in cerebral cells is much higher than at the BBB, interstitial space together with neurons and glia were considered to form a single kinetic compartment, as in traditional kinetic models (e.g. Cunningham et al., 1986
; Mason et al., 1992
; Gruetter et al., 1998
). Nevertheless, we noted that the inclusion of the interstice as an extra compartment at the BBB, separated from brain cells, also allowed the development of a single equation algebraically similar to the equations for simpler models (see Eq. A9), even when different concentration of glucose carriers were considered at the membrane of brain cells. We found that the number of metabolic compartments was directly associated with an increase in the degree of complexity in the dependence of maximum rate of the global diffusion process from the other kinetic constants. Since it did not provide additional knowledge on the system, this model was not tested with experimental data.
Astrocytic processes are in direct contact with blood vessels, thus some models were developed to include an astrocytic compartment which is separated from neuronal cells and included in a gliovascular unit (Barros et al., 2007
; Simpson et al., 2007
). To describe substrate dynamics in this gliovascular unit, not only glucose concentrations but also the concentration of products of its metabolism in plasma and/or brain would be required, in particular pyruvate and lactate. In addition, carriers for monocarboxylates that are responsible for eventual pyruvate/lactate exchange between cells should be included in all the membranes involved, as detailed in the model described by Simpson et al. (2007)
. Our model included glial cells together with neurons in the metabolic compartment without specifying where glucose is mostly consumed, which was able to adequately describe glucose dynamics at the BBB. To support this, it is known that glucose carriers exist at higher concentration in the membrane of these cells than at the BBB (reviewed in Simpson et al., 2007
) such that glucose is evenly distributed in brain’s aqueous phase (Pfeuffer et al., 2000
; Poitry-Yamate et al., 2009
).
The apparent Michaelis constant Kt was found to be on the order of a few mM, as previously determined with the reversible model (Gruetter et al., 1998
). The present model of glucose diffusion into the brain includes both efflux and transport inhibition by Gbrain, predicting that Gbrain eventually approaches a maximum when it is higher than Kii. However, since Kii largely exceeds Kt and the concentration of physiological brain glucose concentrations, iso-inhibition is unlikely to be of substantial importance when plasma glucose is below 25 mM. This suggests that the reversible model can account for most experimental observations under physiological conditions. In fact, the fit of experimental data (Figure 2
) was not statistically different with the four-state conformational model and the reversible MM model previously proposed (Gruetter et al., 1998
). However, in metabolic conditions where high glucose concentrations are observed (for example under eventual uncontrolled diabetes), the inhibition constant Kii may be important in describing glucose transport at the BBB.
In conclusion, the four-state conformational model to describe steady-state brain glucose concentration resulted in an inhibition constant that largely exceeds the observed glucose concentrations, implying a fast isomerisation between unloaded carrier forms. We further conclude that kinetic parameters of glucose transport are closely determined by the reversible model when physiological ranges of plasma glucose are studied. Finally, well defined experimental curves of Gbrain as a function of Gplasma covering broad concentration ranges are of advantage for an adequate estimation of all the kinetic parameters.
(A) Derivation of the Net Velocity Equation for the Four-State Exchange Model
In the present work, the four-state conformational model was described without any assumption on the rate constants (ki) of the isomerisation between the four conformations of the glucose carrier. The derivation of the net velocity equation for the transport mechanism depicted in Figure 1
A using the King-Altman method (King and Altman, 1956
) results in the following expression (Eq. A1) that includes the rate constants for all the possible reactions of isomerisation between the four carrier forms:

where [C]t represents the total carrier concentration.
The use of Cleland’s (1963)
method allows replacing rate constants by kinetic parameters that can be determinate experimentally, leading to the following net velocity equation:
This is the Eq. 1 on which our model was based. Being the derivation made without any assumption on the relative values of rate constants ki (Figure 1
A), the kinetic parameters are defined by the algebraic solutions shown in Table A1
.
Note that when rewriting Eq. A2 (with Keq = 1) in a form that is algebraically equivalent to the equation that expresses transport in terms of an affinity term K and four resistant terms Roo, Ree, Rio and Roi (e.g. Stein, 1986
; Carruthers, 1991
; Simpson et al., 2007
) the following expression is obtained:
from which the kinetic constants used in the present paper can be directly related to the resistance parameters, i.e 
 Vmax = 1/Roi, Kii = KRoi/Ree and
  (through Keq = 1).
Vmax = 1/Roi, Kii = KRoi/Ree and (through Keq = 1).It should be further noted that when Gbrain = 0, corresponding to zero-trans transport, Eq. A2 is identical to the standard Michaelis-Menten expression, and therefore Vmax and KM are equivalent to the corresponding constants measured in zero-trans experiments.
(B) Derivation of the Four-State Conformational Model Assuming Fast Isomerisation of the Unloaded Carrier
This section of the appendix aims to show that fast isomerisation between unloaded carrier conformations is equivalent to the reversible MM model of glucose transport. In Section “Derivation of the Net Velocity Equation for the Four-State Exchange Model” in Appendix we derived the net velocity equation of the glucose carrier without any assumption on the relative rate constants ki (Figure 1
A). However, if the isomerisation between unloaded carrier forms is faster than all the other conformational alterations, i.e. k4 and k−4 are much larger than the rate constants for the other reactions, by dividing both numerator and denominator by k4 + k−4, the net velocity equation A1 can be approximated by:
When this expression is treated using the definitions proposed by Cleland (1963)
, the net velocity equation is given by:
where the kinetic parameters are defined by the rate constants as shown in Table A2
.
Such enzymatic system is formally equivalent to a simple reversible MM mechanism with two central complexes in which the conversion of substrate (Gout) into product (Gin) are considered distinct reactions (Leskovac, 2003
). Hence, a fast isomerisation of the unloaded carrier in comparison to the other conformational changes is mathematically equivalent to an enzymatic mechanism comprising a single conformation for the unloaded carrier. The difference between Eqs 1 and A4 is the absence of the term containing Kii in the latter. This observation suggests that Kii is an inhibition constant that reflects the action of Gin as inhibitor of the isomerisation of the unloaded carrier, probably by stabilization of the carrier in the conformation that favours binding of Gin.
The insertion of Eq. A4 in Eq. 3, for a system described in Figure 1
B with symmetric glucose carriers and satisfying the steady-state condition, originates the equation that describes the reversible MM model of glucose transport (Gruetter et al., 1998
):
(C) Asymmetry of the Carrier
Both standard and reversible MM models of glucose transport traditionally assumed facilitated diffusion through symmetric carrier proteins at the several membranes composing the BBB (e.g. Gruetter et al., 1998
). Experiments performed in vivo in a non-invasive way measured only two variables (Gbrain and Gplasma), which restricts the number of kinetic constants that can be directly determined and used to describe glucose dynamics at the BBB. Nevertheless, the effect of the existence of asymmetry in the glucose carriers can be analysed.
As found in the present study, the number of compartments composing the BBB did not affect the arithmetic form of the relation between brain and plasma glucose concentrations. Thus, for the sake of example, the single-membrane model was used to test for potential effects of the presence of asymmetric glucose carriers at the BBB. The combination of Eqs 1 and 3 results in the following expression that includes different apparent Michaelis constants for the transport in each direction.
In this equation, Tmax is the apparent maximum velocity of the forward transport, and  and
and  are the apparent Michaelis constants for the forward and reverse transports. Note that Keq was assumed 1 for facilitated diffusion (Cuppoletti and Segel, 1975
).
are the apparent Michaelis constants for the forward and reverse transports. Note that Keq was assumed 1 for facilitated diffusion (Cuppoletti and Segel, 1975
).
and are the apparent Michaelis constants for the forward and reverse transports. Note that Keq was assumed 1 for facilitated diffusion (Cuppoletti and Segel, 1975
).The data set in Figure 2
A was used as example to test the effect of asymmetry. As shown in Table A3
, the value of Tmax/CMRglc is more resistant to variations of the ratio  when
when  is smaller than
  , rather than when
  exceeds. Moreover, the estimated kinetic parameters are less affected by asymmetry when Kii is constrained to 51 mM (value obtained for symmetric transport). In any case, for a constant CMRglc, Tmax increased with the increment of
  relative to
  , suggesting that if asymmetry is considered there is higher affinity for glucose in the brain than in plasma.
when is smaller than , rather than when exceeds. Moreover, the estimated kinetic parameters are less affected by asymmetry when Kii is constrained to 51 mM (value obtained for symmetric transport). In any case, for a constant CMRglc, Tmax increased with the increment of relative to , suggesting that if asymmetry is considered there is higher affinity for glucose in the brain than in plasma.
(D) Transport Model Including Both Endothelial and Interstitial Compartments
The four-state conformational model of glucose transport was described either assuming a single membrane at the BBB or including the endothelium as an extra compartment. The complexity of the BBB can take other compartments as is the case of the interstitial space between the endothelium and the brain cells, which occupies 20% of the total brain volume (Hrabetová and Nicholson, 2004
). The addition of the interstitium, i.e a third compartment, to the model of glucose diffusion across the BBB (Figure 1
C), requires the inclusion of a new pair of unidirectional fluxes [T(3) and T(−3)] that represent glucose transport at brain cell membranes. At steady-state, the process is described by:
where Gint is the glucose concentration in the interstitial compartment (in μmol g−1), and T are the unidirectional fluxes (in μmol g−1 min−1) at each membrane (take Figure 1
C as example).
The distribution of the glucose carriers is certainly not uniform at all membranes. As discussed in Barros et al. (2007)
, the number of glucose carriers is higher at the membrane of brain cells than in endothelial membranes, which directly affects the value of Tmax. Thus, the factor n was introduced to reflect the relative concentration of carriers at those membranes. Assuming symmetric transport properties for all membranes involved in the model, the insertion of Eq. 2 in the Eq. A7 originate the following expressions:
Note that Gend and Gint are also affected by their respective distribution volumes, but they were omitted for simplification. These equations can be solved to produce the expression A9 that relates Gbrain and Gplasma at steady-state.
Equation A9 is formally equivalent to Eqs 4 and 6 (here conveniently shown in the form of Eq. 7) obtained for a model that either is composed of a single membrane at the BBB or includes the endothelial compartment. In fact, in the case of considering the number of carriers at the cellular membrane of astrocytes and neurons much larger than in the endothelial cells, i.e. if n is considered infinite, this equation will be approximate Eq. 6 (or 7), which includes the endothelial compartment at the BBB (scheme of Figure 1
C). The apparent maximum transport rate Tmax estimated with Eq. A8 will differ from the other models, being affected by the flux at each carrier involved and the relative carrier concentrations at each membrane of the BBB. Kt and Kii have the same value as in the other models. For n = 10, i.e. when carriers exist at five-fold higher concentration in brain cells than in endothelial membranes, as it was assumed in the model described by Barros et al. (2007)
, Eq. A9 becomes:
The authors declare that the research was conducted in the absence of any commercial or financial relationships that could be construed as a potential conflict of interest.
The authors acknowledge helpful discussions with Dr. Vassily Hatzimanikatis. This work was supported by Swiss National Science Foundation (grant 3100A0-122498) and by Centre d’Imagerie BioMédicale (CIBM) of the UNIL, UNIGE, HUG, CHUV, EPFL and the Leenaards and Jeantet Foundations.