1
Institute of Biomedical Engineering, Boǧaziçi University, Istanbul, Turkey
2
HMS/MIT/MGH Athinoula A. Martinos Center for Biomedical Imaging, Charlestown, MA, USA
3
Department of Neurosciences, University of California San Diego, La Jolla, CA, USA
Comprehending the underlying mechanisms of neurovascular coupling is important for understanding the pathogenesis of neurodegenerative diseases related to uncoupling. Moreover, it elucidates the casual relation between the neural signaling and the hemodynamic responses measured with various imaging modalities such as functional magnetic resonance imaging (fMRI). There are mainly two hypotheses concerning this mechanism: a metabolic hypothesis and a neurogenic hypothesis. We have modified recent models of neurovascular coupling adding the effects of both NO (nitric oxide) kinetics, which is a well-known neurogenic vasodilator, and CO2 kinetics as a metabolic vasodilator. We have also added the Hodgkin–Huxley equations relating the membrane potentials to sodium influx through the membrane. Our results show that the dominant factor in the hemodynamic response is NO, however CO2 is important in producing a brief post-stimulus undershoot in the blood flow response that in turn modifies the fMRI blood oxygenation level-dependent post-stimulus undershoot. Our results suggest that increased cerebral blood flow during stimulation causes CO2 washout which then results in a post-stimulus hypocapnia induced vasoconstrictive effect.
In order to meet the expected increased demand of the brain for glucose and oxygen during neuronal activation, the activated area stimulates vasodilation which leads to an increase in local cerebral blood flow (CBF) and cerebral blood volume (CBV), and hence an increased delivery of glucose and oxygen (Iadecola and Nedergaard, 2007
; Irani et al., 2007
; Metea and Newman, 2007
). While neurons and astrocytes produce the signals of vasodilation, endothelial cells, pericytes and smooth muscle cells transduce these signals into a change in CBF in a healthy brain (Girouard and Iadecola, 2006
; Drake and Iadecola, 2007
; Schummers et al., 2008
). This phenomenon is called neurovascular coupling. This coupling is tightly controlled via numerous biological signaling pathways. The control may be via metabolic factors (CO2, K+, adenosine etc.) or via neurogenic factors (neurotransmitters, NO etc.) (Estrada and DeFelipe, 1998
).
Maintaining this synchronous control is vital, since any impairment in it may lead to ischemic lesions and even toxicity due to excess of metabolic factors (Girouard and Iadecola, 2006
). The dissynchrony may also occur under many pathological conditions such as Alzheimer disease, hypertension, ischemic stroke (Girouard and Iadecola, 2006
), migraine (Akin et al., 2006
) and Huntington’s disease (Clark et al., 2002
). Importantly, understanding details of normal coupling and its disruption in disease will guide identification of possible treatment options.
In spite of the knowledge of many vasodilators, such as nitric oxide, arachidonic acid, potassium (K+), CO2, bicarbonate and adenosine, their relationship to neurovascular coupling is not fully understood. Among them, the vasodilatory role of nitric oxide during neuronal activity has been shown both during flicker stimuli in cat optic nerve (Buerk et al., 1996
) and during forepaw stimuli in rat somatosensory areas (Buerk et al., 2003
). There are mainly two hypotheses that are used to explain brain hemodynamics in terms of these vasodilators (Estrada and DeFelipe, 1998
; Riera et al., 2008
). According to the first hypothesis, namely the metabolic hypothesis, local CBF increase is a result of several vasodilators such as CO2, K+ and adenosine which are the metabolic products of neuronal activation (Estrada and DeFelipe, 1998
). Whereas according to the second hypothesis, the neurogenic hypothesis, local CBF is maintained via vasodilator neurotransmitters that are ‘synaptic products’ released by the neurons as a result of neuronal activation (Estrada and DeFelipe, 1998
; Riera et al., 2008
). However, recent studies have shown that the coexistence of both neurogenic and metabolic factors is needed to regulate cerebral perfusion (Ito et al., 2005
; Riera et al., 2008
). In this study we aim to compare the relative importance of these two neurovascular coupling hypotheses in producing changes in CBF, blood volume, and oxygenation.
Brain hemodynamics is intensely studied using different neuroimaging modalities such as functional magnetic resonance imaging (fMRI), positron emission tomography (PET) and optical imaging. Each one of these modalities provides valuable insight into specific components of neurovascular coupling. Recent work in neuroimaging studies demonstrates that not only integration of multiple neuroimaging modalities is required, but that mathematical modeling is necessary to understand the complex physiology underlying neurovascular coupling. There are numerous models aiming to explain either the vascular or the neurometabolic response to brain activation. The Balloon and Windkessel models are among the ones describing the vascular response. According to the Balloon model, the venous compartment expands as a result of the output of the capillary bed (Buxton et al., 1998
). The Windkessel model extends the balloon model to incorporate vascular compliance (Mandeville et al., 1999
). A neurometabolic model that couples brain electrical activity and energy metabolism via the Na+–K+ pump and mitochondrial respiration was developed by Aubert and Costalat (2002)
. They recently extended that model by adding an astrocytic compartment (Aubert and Costalat, 2005
). There exist models that combine the vascular and metabolic compartments to investigate how CBF is controlled via metabolic and neurogenic pathways. Banaji’s model is a good example that focuses on autoregulation of the blood vessels via different feedback mechanisms (Banaji et al., 2005
). While these are just a few of the numerous models described in the literature, in general there is a need for a model which describes CBF in terms of both neurogenic and metabolic mediators that are directly related to the neuronal stimulus as an input to the model.
We have constructed a biochemical model of neurovascular coupling which has the action potential firing frequency as an input. We have set CBF dependent on the neuronal signals resulting from synaptic activity, NO, and as a result of an energy metabolism product, CO2. We have chosen NO among the other vasodilators, since it has been shown by many studies that NO related increases in CBF is more dominant compared with other vasodilators at specific brain regions such as cerebellum (Yang et al., 1999
, 2003
) and somatosensory cortex (Lindauer et al., 1999
). Our choice of CO2, which is a product of oxidative phosphorylation, is based on the fact that increases in CO2 decreases the pH of the medium (Chen and Anderson, 1997
), leading to a significant increase in CBF (Kety and Schmidt, 1948
). The model input is the frequency of the action potentials generated by the neurons in response to a stimulus, and CBF, blood oxygenation level-dependent (BOLD) signal, CBV and the metabolite concentrations are the outputs of the system. This input triggers both the energy pathways and synaptic activity. We have first tested the relative contributions of neurogenic and metabolic pathways for evoking changes in the CBF, BOLD and partial pressure of CO2 (pCO2) and interpret our findings in the context of existing experimental findings described in the literature (Hoge et al., 1999a
,b
; Kim et al., 1999
; Uludağ et al., 2004
; Wise et al., 2007
), paying attention to differences that arise as stimulus duration increases from tens of seconds to a couple of minutes.
Model Description
Our model is designed to explore the relative importance of two neurovascular coupling mechanisms in producing a blood flow response given changes in the frequency of action potentials: one of metabolic origin and the other neurogenic. The metabolic mechanism is based on the product of oxidative phosphorylation, carbon dioxide; whereas the neurogenic mechanism is based on nitric oxide, a synaptic activity product (Figure 1
). These two factors diffuse to the extracellular matrix and then to blood vessels and produce vasodilation in the arterioles giving rise to changes in regional CBF and the BOLD signal.
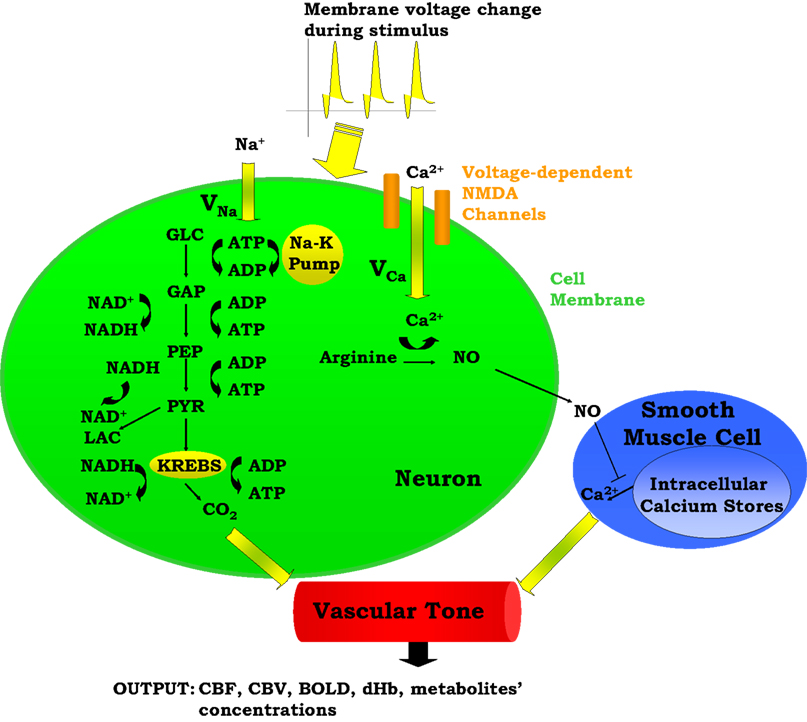
Figure 1. A Schematic representation of the proposed model. ADP, adenosine diphosphate; AP, action potential; ATP, adenosine triphosphate; BOLD, blood oxygenation level-dependent; Ca2+, calcium; CBF, cerebral blood flow; CBV, cerebral blood volume; CO2, carbon dioxide; dHb, deoxyhemoglobin; GAP, glyceraldehyde-3-phosphate; GLC, glucose; K, potassium; LAC, lactate; Na, sodium; NAD+, nicotinamide adenine dinucleotide; NADH, reduced nicotinamide adenine dinucleotide; NO, nitric oxide; PEP, phosphoenolpyruvate; PYR, pyruvate.
The model has one input which is the frequency of action potentials. This can be kept constant or can be expressed as a time-dependent function throughout the stimulus duration. This frequency modulates the cell membrane potential by changing the flux of sodium and calcium ions across the membrane resulting in energy-product related and synaptic activity related vasodilation respectively. The sodium entry into the cell during an action potential increases the intra-cellular sodium concentration, thus increasing the Na+–K+ pump rate and consumption of adenosine triphosphate (ATP). The ATP supply for Na+–K+ pump comes from the phosphocreatine buffer, glycolysis, and mitochondrial respiration. Glucose (GLC) is delivered to the tissue by the vessels, and it turns into pyruvate (PYR) by passing through the glycolysis intermediary steps: glyceraldehyde-3-phosphate (GAP) and phosphoenolpyruvate (PEP). After this point PYR either goes to mitochondria and starts oxidative phosphorylation via aerobic respiration, or it turns into lactate (LAC) via anaerobic respiration. During these processes, there is a continuous electron transfer between nicotinamide adenine dinucleotide (NAD) and reduced nicotinamide adenine dinucleotide (NADH), and a phosphate transfer between ATP and adenosine diphosphate (ADP).
The equations describing sodium membrane transport, the Na+–K+ pump, neuronal energy metabolism (phosphocreatine buffer, glycolysis), and blood-brain-barrier exchange reactions are provided by Aubert and Costalat (2002)
, and the equations for NADH kinetics and mitochondrial respiration are provided by Aubert et al., (2007)
. The vasodilator carbon dioxide is produced as a result of oxidative phosphorylation. The other vasodilator nitric oxide, NO, is produced as a result of calcium (Ca2+) entry into the neuron which activates NO production. NO then diffuses to and enters the smooth muscle cells around the arterioles. It then inhibits Ca2+ efflux from internal Ca2+ sources in these cells and so leads to vasodilation (Toda and Okamura, 1998
). CBF is assumed to be dependent only on arteriolar diameter changes as given by Poiseuille’s equation, and the pressure drop between the two ends of the vessel is assumed to be constant. The BOLD signal is then derived from CMRO2 and CBF using Davis’ BOLD equation (Davis et al., 1998
).
In the next subsections, we provide details of each step in our model. The initial conditions for the new variables added to Aubert’s model in this work are presented in Table 1
, and all parameters are defined in Table 2
. Unless otherwise stated, concentrations of metabolites are in mmol/L. The reaction rates are in mmol/L s. The subscripts within the tables and the text are a, arteriole; n, neuron; v, venule; c, capillary (in our case capillary stands for pre-capillary arteriole); sm, smooth muscle.
Action Potentials Modulate Intra-Cellular Na+ and Ca2+ Concentrations
Our model uses action potential frequency as an input. In our model, the action potential frequency is assumed to be almost 0 before and after the stimulus and taken as 150 Hz during the stimulus. We have fit a gaussian function to a generic action potential (Bean, 2007
) to obtain the membrane voltage changes as a function of time,
Where  is the voltage in mV as a function of time t and the remaining parameters are specified in Table 2
. The voltage change for a train of action potentials is obtained by convolving Eq. 1 with the sequence of action potentials [S(t)] as:
is the voltage in mV as a function of time t and the remaining parameters are specified in Table 2
. The voltage change for a train of action potentials is obtained by convolving Eq. 1 with the sequence of action potentials [S(t)] as:
is the voltage in mV as a function of time t and the remaining parameters are specified in Table 2
. The voltage change for a train of action potentials is obtained by convolving Eq. 1 with the sequence of action potentials [S(t)] as:
where S(t) is equal to 0 unless t is at the onset of an action potential such that  For example, for action potentials arriving at a frequency of 100 Hz, tn = n Δt where Δt = 10 ms.
For example, for action potentials arriving at a frequency of 100 Hz, tn = n Δt where Δt = 10 ms.This voltage change is then used to obtain the voltage-dependent Na+ and Ca2+ channel activations. The Na+ influx  as a function of voltage and time is obtained by the Hodgkin–Huxley equations (Hodgkin and Huxley, 1952
). The current calculated using Hodgkin–Huxley equations is then converted from μA/cm2 to mmol/L s considering a 5-μm radii spherical cell.
as a function of voltage and time is obtained by the Hodgkin–Huxley equations (Hodgkin and Huxley, 1952
). The current calculated using Hodgkin–Huxley equations is then converted from μA/cm2 to mmol/L s considering a 5-μm radii spherical cell.
as a function of voltage and time is obtained by the Hodgkin–Huxley equations (Hodgkin and Huxley, 1952
). The current calculated using Hodgkin–Huxley equations is then converted from μA/cm2 to mmol/L s considering a 5-μm radii spherical cell.Calcium influx in the neuron is mediated through N-methyl-D-aspartate receptor (NMDAR) channels that are voltage dependent (Shouval et al., 2002
). This influx, the rate of Ca2+ concentration change in the neuron  is given as a product of the fraction of NMDARs that move from the closed to open state after each presynaptic action potential, the peak NMDA receptor conductance and the membrane potential (please see Shouval et al., 2002
for a detailed description of the equations and parameters).
is given as a product of the fraction of NMDARs that move from the closed to open state after each presynaptic action potential, the peak NMDA receptor conductance and the membrane potential (please see Shouval et al., 2002
for a detailed description of the equations and parameters).
is given as a product of the fraction of NMDARs that move from the closed to open state after each presynaptic action potential, the peak NMDA receptor conductance and the membrane potential (please see Shouval et al., 2002
for a detailed description of the equations and parameters).The rate of intracellular sodium concentration change  is used as an input to the metabolic rate equations described in Section ‘Results’. The rate of intracellular calcium concentration change
  is used in the production of NO as described below.
is used as an input to the metabolic rate equations described in Section ‘Results’. The rate of intracellular calcium concentration change is used in the production of NO as described below.A Brief Description of Aubert and Costalat’s Model of Stimulus Induced Changes in Oxygen Consumption
The portion of Aubert and Costalat’s model (Aubert and Costalat, 2002
) that we utilize here couples ionic current (Na ion flux) to brain energy metabolism (glycolysis, mitochondrial respiration and the phosphocreatine buffer). An increase in intracellular Na+ activates the Na+–K+ pump and consumes more ATP. To compensate for the ATP decrease, the cell produces ATP through glycolysis, mitochondrial respiration and the phosphocreatine buffer. The following equation from the work of Aubert et al., (2007)
, which is based on the respiratory chain equation from Holzhütter et al. (1985
), is used to describe the CMRO2 (or νmito) in the model. The description and values of the parameters V, nop, KmADP, kr, phi, phi0, H, Hm and nr can be found in Aubert et al. (2007
).
This oxygen consumption modulates the oxygen concentration in the tissue, altering the concentration gradient with respect to the blood vessel (Eq. 28 of Aubert and Costalat, 2002
), thus changing the rate of oxygen extraction from the vessel (Eq. 43 of Aubert and Costalat, 2002
).
CO2 Kinetics
The carbon dioxide concentration in the neuron increases with mitochondrial respiration and decreases with CO2 diffusion from the neuron to the precapillary arterioles via the concentration gradient,

The mitochondrial respiration rate (νmito) is given by Eq. 23 from Aubert et al. (2007)
. According to the brain tissue compartmentalization assumption of Aubert and Costalat (2002)
, Vcap and Vn are the volume fractions of the precapillary arterioles and neurons in the brain respectively, and nAero is the stoichiometric constant. The rate of CO2 diffusion from the neuron to the precapillary arterioles  is given by:
is given by:
where  is the effective diffusion rate depending on the CO2 diffusion coefficient
  and effective distance that CO2 diffuses (deff). CO2n is the concentration of CO2 in the neuron and CO2c is the concentration of CO2 in the precapillary arterioles.
is the effective diffusion rate depending on the CO2 diffusion coefficient and effective distance that CO2 diffuses (deff). CO2n is the concentration of CO2 in the neuron and CO2c is the concentration of CO2 in the precapillary arterioles.This CO2 diffusion increases CO2 concentration in the precapillary arterioles that is cleared by the in-flowing blood from the artery,

The rate of change of CO2 in the precapillary arterioles due to the flowing blood is given by:

where CO2a is the concentration of CO2 in the upstream artery.
Ca2+ and NO Kinetics
Calcium concentration in the neuron varies with the difference between calcium influx into the cell and the calcium decay,

Calcium influx  is described in Section ‘Materials and Methods’. The calcium decay rate
  is given by Majewska (Majewska et al., 2000
),
is given by Majewska (Majewska et al., 2000
),
is described in Section ‘Materials and Methods’. The calcium decay rate is given by Majewska (Majewska et al., 2000
),
where  is the calcium concentration in the neuron and
  is the decay time constant.
is the calcium concentration in the neuron and is the decay time constant.NO concentration in the neuron is determined by the rate of NO production (νNO,n), the diffusion of NO from the neuron to smooth muscle (νNO,sm), and the decay of NO in the neuron (νNO decay,n):

NO production is related to neuronal calcium concentration by Takahashi and Mendelsohn (2003)
, assuming that the maximum neuronal NO release is obtained during the maximal activation of nitric oxide synthase (Luiking and Deutz, 2003
),

The NO produced in the neuron then diffuses to the smooth muscle cells around arterioles:
where Dnew,NO is the effective diffusion rate depending on the NO diffusion coefficient (DNO) and the effective distance over which NO diffuses (deff). Some of the produced NO, on the other hand, is consumed by other reactions within the cell with a time constant (τNO) (Vaughn et al., 1998
),
NO concentration in smooth muscle is determined by the NO diffusion from the neuron (νNO,sm) and the NO decay within the smooth muscle (νNO decay,sm).

The NO decay in smooth muscle is given by Vaughn et al. (1998)
as:
where NOsm is the NO concentration in smooth muscle.
Using the results of a mathematical model of the nitric oxide/cGMP pathway in the vascular smooth muscle cell (Yang et al., 2005
), NO inhibition of calcium in smooth muscle is obtained via a fit:

Modulation of Vascular Tone
We relate the arteriolar diameter to the pCO2 in the precapillary arterioles using the information in Wang et al. (1992)
. Poiseuille’s law states that the flow of blood through a vessel is proportional to the fourth power of the vessel diameter. Using the PaCO2 versus CBF graph in Wang et al.’s work, we recalculated the PaCO2 versus diameter graph with the assumption that 40 mmHg corresponds to the normal CO2 levels in the vessel. We then fit a curve to this new graph and the curve fit formula is given in Eq. 17a where  represents the fractional change in diameter. It well matches with former work of Muizelaar et al. where they find a relationship directly between PaCO2 and diameter (Muizelaar et al., 1988
).
represents the fractional change in diameter. It well matches with former work of Muizelaar et al. where they find a relationship directly between PaCO2 and diameter (Muizelaar et al., 1988
).
represents the fractional change in diameter. It well matches with former work of Muizelaar et al. where they find a relationship directly between PaCO2 and diameter (Muizelaar et al., 1988
).
We have related CO2 concentration to CO2 partial pressure  using the carbon dioxide solubility coefficient
  Baseline CO2 pressure in the vessel is assumed to be 40 mmHg (Lumb, 2003
).
Baseline CO2 pressure in the vessel is assumed to be 40 mmHg (Lumb, 2003
).
using the carbon dioxide solubility coefficient Baseline CO2 pressure in the vessel is assumed to be 40 mmHg (Lumb, 2003
).The fractional diameter change of the arteriole related to NO production is obtained in terms of the smooth muscle calcium concentration (Casm) using the data in Schuster et al.’s work (Schuster et al., 2001
; Figure 4A). We selectively picked the diameter and calcium values at various time instances in the above mentioned work. We then converted this data into percentage change of diameter and calcium by normalizing it with the maximum fluorescence intensity. Then a new graph of diameter versus Ca was obtained to which a curve was fit to obtain Eq. 18a.
where the value of Ca2+sm,max is given in Table 2
.
The vascular radii (in units of meters) is then calculated by simple addition of the CO2 effect (Eq. 17a) and the NO effect (Eq. 18a),

Model Outputs: Flow, Venous Volume, Deoxy-Heamoglobin Concentration and Bold Signal
In the model, a hypothetical brain volume is formed to include a neuron, pre-capillary arteriole and venous compartments that are forming a unit voxel. Assuming the total BOLD signal being a volume-weighted sum of the signals coming from individual voxels (Buxton et al., 1998
) and using Davis’ equation (Davis et al., 1998
) which links normalized CMRO2 and CBF changes to the BOLD signal change, we can then calculate the percent change in BOLD signal within a voxel due to neuronal activation. Hence, the CBF, CBV and BOLD are calculated as follows:
The flow (Fin) in the precapillary arteriole is calculated using the Poiseuille equation with the parameters: radii (R), pressure difference across the two ends of the precapillary arteriole (ΔP), viscosity of the blood (μ) and the length of the vessel (L). We have normalized this flow with arteriole volume in order to have dimensions consistent with Aubert’s model (Aubert and Costalat’s, 2002
).
The output flow from the venous compartment is obtained from the following equation (Mandeville et al., 1999
; Boas et al., 2003
):
In Eq. 21 we assume laminar flow (α = 2), and constant β represents diminished volume reserve at elevated pressures. We are using β = 2 as representative of the range of 1 ≤ β ≤ 3 from the literature (Mandeville et al., 1999
; Huppert et al., 2007
).
The following equation (Buxton et al., 1998
) is used for venous volume calculations,

where Fin and Fout are calculated using Eqs. 20a and 21.
The deoxy-Heamoglobin (dHb) concentration and the BOLD signal are calculated by Buxton et al. (1998)
, Davis et al. (1998)
, respectively:

with the parameters O2a, M and β′ given in Table 2
. O2c is the precapillary arteriole oxygen concentration.
Solving the Ordinary Differential Equations
The model is comprised of 20 variables. Volumes, areas and CBF values are all expressed per unit tissue volume. In order to solve the ordinary differential equations, we have used the ode23s tool of MATLAB7.5 for stiff equations. Besides the equations given in sections above, the first 13 equations in Table 1
in Aubert’s model (Aubert and Costalat, 2002
) are used in this model with the corresponding parameters within the same work.
Assumptions
We set CBF dependent solely on radii changes with the assumption that the local CBF changes in precapillary arterioles are dependent more on diameter changes of the vessels than the pressure difference between the two ends of them, which may not be the case during systemic changes (heart rate, stroke volume etc.) activated during brain function.
We have also assumed that the NO and CO2 effect on blood flow are independent of each other. Although previous research on rats suggest that inhibition of nitric oxide synthase reduces the CBF response to hypercapnia (Wang et al., 1995
), more recent research on humans found no significant change in CBF response to hypercapnia under NOS inhibitors (White et al., 1998
). We base our model on this more recent finding.
The fourth assumption to be mentioned here is that the energy consumption during brain activation is solely due to the Na+–K+ pump. Actually when the Na+–K+-ATPase is blocked in the whole brain, the energy usage drops dramatically (Riera et al., 2008
), a fact which makes this assumption acceptable.
We modeled the action of NO and Ca on pre-capillary arterioles since they have smooth muscle cells which dilate actively by using NO and Ca signaling pathways.
We have also assumed that Ca entry into channels is solely through NMDA channels. Our assumption is based on the studies which show that calcium elevation due to synaptic activity is almost totally blocked in the presence of NMDA channel blocker AP5 (Müller and Connor, 1991
; Alford et al., 1993
; Malinow et al., 1994
).
We plot Ca2+ and Na+ dynamics in the neuron as a response to a stimulus lasting 20 and 100 s (Figure 2
). A sample part from the stimulus in Figure 2
A, shows the change in membrane voltage, i.e. action potentials, during the stimuli.
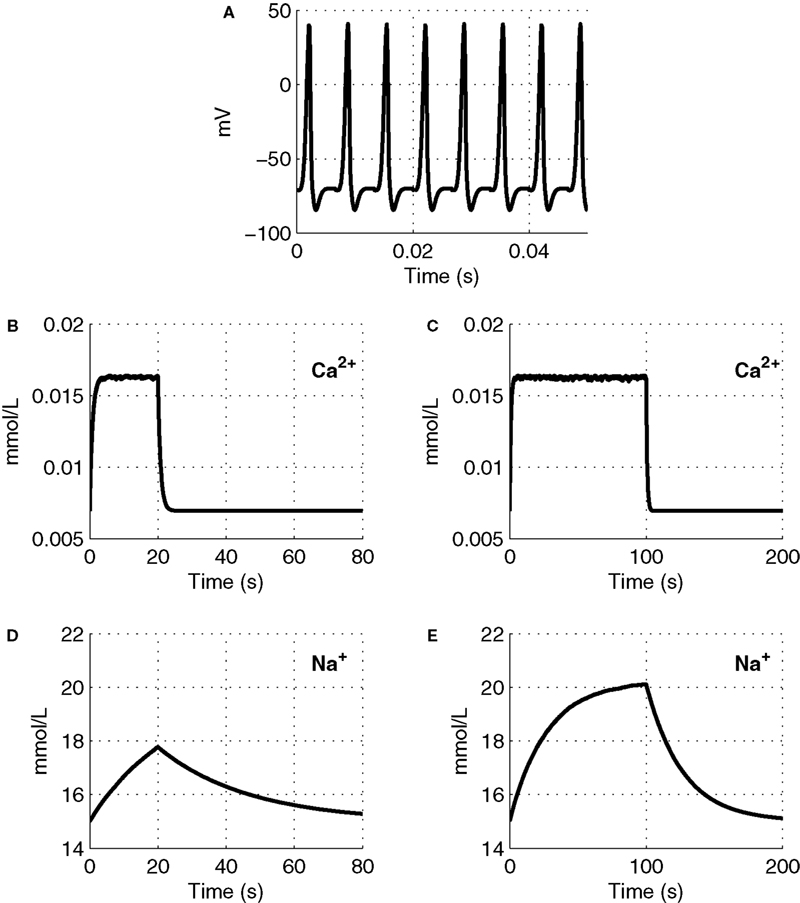
Figure 2. The input function of the model: a series of action potentials at 150 Hz (A), only a portion is shown as an example. The Ca2+ and Na+ concentration as a response to the stimulus. Results are given (B) and (D) for a 20-s stimulus and (C) and (E) for a 100-s stimulus.
To explore the relative roles of the vasoactive agents NO and CO2 in the stimulus evoked change in CBF, in Figure 3
we plot the relative change in CBF (rCBF) for a short (20 s) and long (100 s) duration stimulus considering modulation of the vascular tone by NO only, CO2 only, and both NO and CO2.
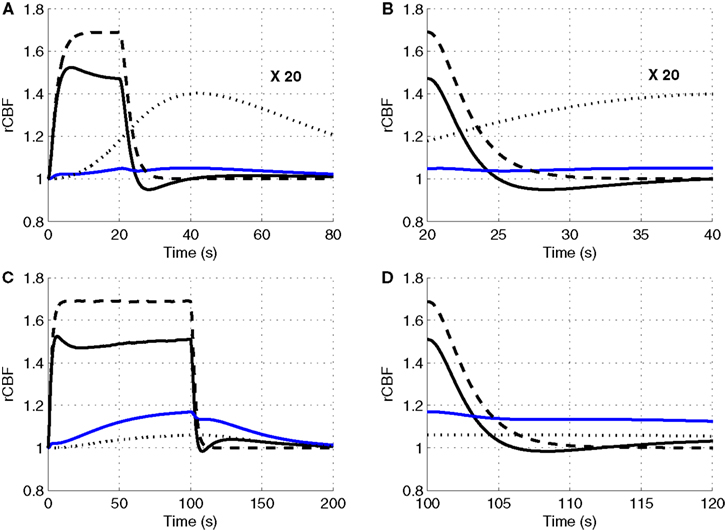
Figure 3. Our model results for an evoked change in CBF considering the vasoactive role of only NO (dashed line), only CO2 (dotted line), both NO and CO2 (solid line). The relative change in CMRO2 is indicated by the blue line. Results are given (A) and (B) for a 20-s stimulus and (C) and (D) for a 100-s stimulus. In each case we considered the stimulus as a train of action potentials at a repetition frequency of 150 Hz as input to our model. Note that in (A) we increased the scale of the only CO2 effect (dotted line) by ×20. CBF, cerebral blood flow; CMRO2, cerebral metabolic rate of oxygen.
The largest change in CBF is observed with NO only, while CO2 alone is producing only a small increase in CBF. When both NO and CO2 effects on vascular tone are considered, the CBF response is reduced relative to NO alone. We observe a flow overshoot during the first 10 s of the stimulus, a significant post-stimulus undershoot for the short stimulus, and a slow post-stimulus recovery for the long-stimulus. These results reveal that the vessels may dilate or constrict depending on the balance of CO2 production by the mitochondria and washout by the flowing blood.
In Figure 4
we plot the evoked changes in the BOLD signal corresponding to the differing flow responses from NO only, CO2 only, and both NO and CO2 modification of vascular tone. Inhibiting the effect of NO significantly reduces the flow response (see Figure 3
) leading to a negative BOLD response as the reduced flow response does not oversupply the increased demand for oxygen. Considering the effects of both NO and CO2 compared with NO alone attenuates the peak BOLD response during the stimulus and modifies the post-stimulus BOLD undershoot, increasing the undershoot for a short stimulus and diminishing its duration for long stimulus. This modification of the post-stimulus BOLD undershoot is due to a slow CMRO2 recovery and the post-stimulus flow undershoot.
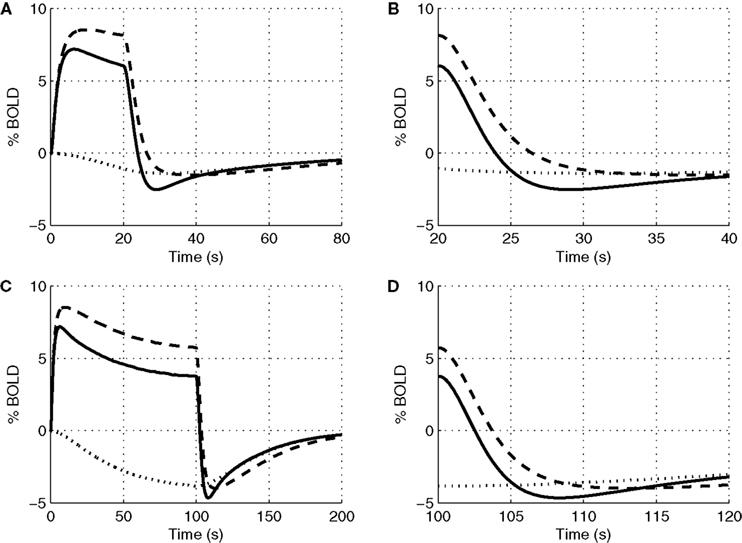
Figure 4. Our model results for an evoked change in BOLD considering the vasoactive role of only NO (dashed line), only CO2 (dotted line), and both NO and CO2 (solid line). Results are given (A) and (B) for a 20-s stimulus and (C) and (D) for a 100-s stimulus. In each case we considered the stimulus as a train of action potentials at a repetition frequency of 150 Hz as input to our model. BOLD, blood oxygenation level-dependent.
The precapillary arteriole pCO2 pressure corresponding to the three different vasoactive effects is plotted in Figure 5
. It is evident that the large flow response produced by NO is washing out more CO2 than is being produced by the increased oxygen consumption, causing a reduction in the pCO2 akin to the washout of deoxygenated hemoglobin during a stimulus. When the effect of NO on vascular tone is neglected, we observe that the pCO2 increases because the flow response is too small to wash out the extra CO2 produced by the increased oxygen consumption, consistent with the negative BOLD signal in Figure 4
. We also observe a post-stimulus overshoot in the pCO2 arising from the slow recovery of oxygen consumption.
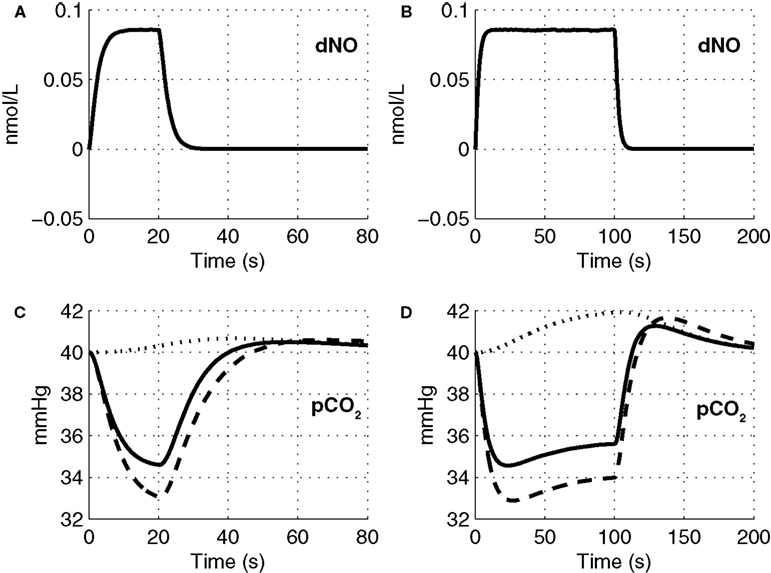
Figure 5. Change in NO levels in smooth muscle (A,B) and the partial pressure of CO2 in the precapillary arteriole (C,D) are plotted considering the flow response from NO alone (dashed line), CO2 alone (dotted line), and both NO and CO2 (solid line) for the 20-s stimulus (A,C) and the 100-s stimulus (B,D). pCO2, partial pressure of CO2.
To provide support for the magnitude of the CO2 effect in varying vascular tone in our model, we simulated the change in flow and BOLD as the systemic pCO2 was increased, and compared our simulation results with experimental results. The simulated results are shown in Figure 6
compared with experimental data from Kety and Schmidt (1948)
, Grubb et al. (1974) and Hoge et al. (1999b)
. Our model results well match with the experimentally observed flow changes and the BOLD changes.
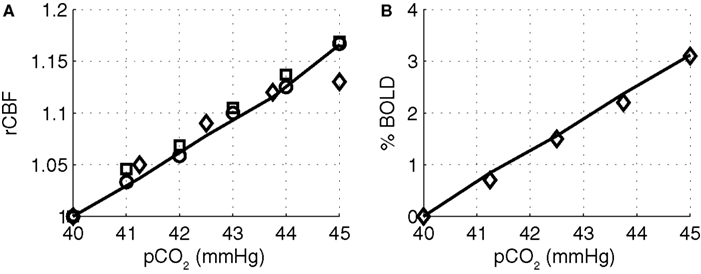
Figure 6. Modeled (A) CBF and (B) BOLD versus the partial pressure of CO2 compared with experimental data from (Kety and Schmidt, 1948
) circles, (Grubb et al. , 1974
) squares, and (Hoge et al., 1999b
) diamonds. Our model results are indicated by the solid line. CBF, cerebral blood flow; BOLD, blood oxygenation level-dependent.
In Figure 7
A, we plot the peak value of the post-stimulus CBF undershoot versus stimulus duration as predicted by our model compared with a survey of experimental data from the literature (Hoge et al., 1999b
; Kim et al., 1999
; Krüger et al., 1999
; Rosengarten et al., 2001
; Lu et al., 2004
; Uludağ et al., 2004
). We considered only human visual stimulation experiments for this comparison. The specific studies and their associated data points are provided in Table 3
. For both experimental studies and our model, the CBF undershoot reaches a maximum for a stimulus duration of ∼20 s, and slowly diminishes for longer duration stimuli.
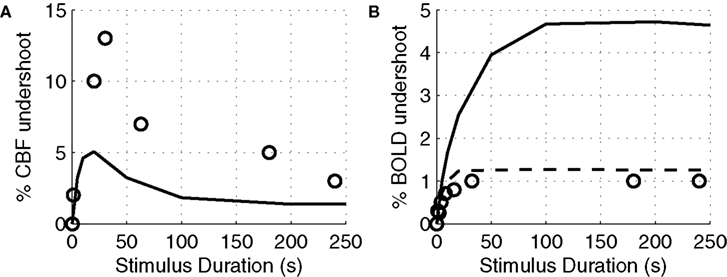
Figure 7. Peak CBF undershoot versus stimulus duration (A). BOLD undershoot versus stimulus duration (B). Experimental data (circles), model results (solid line), model results when the model is forced to have a faster CMRO2 increase following stimulus onset and recovery post-stimulus (dotted-line). CBF, cerebral blood flow.
Finally, we plot our model prediction of the post-stimulus BOLD undershoot versus stimulus duration in Figure 7
B compared with a survey of experimental data from the literature in Table 4
(Hoge et al., 1999a
; Krüger et al., 1999
; Royl et al., 2001
). Our results show that BOLD undershoot increases during the first 50 s of stimulus duration and then reaches a plateau around 100 s, while the literature suggests that the plateau is reached around 30 s and at a much smaller amplitude. We note that we obtain better agreement between the model and experimental data if we force the model to have a faster CMRO2 increase following stimulus onset and recovery post-stimulus.
We have performed a sensitivity analysis to verify the robustness of the CBF post-stimulus behavior shown in Figure 3
. The decay constants for Ca and NO were varied over their physiological range ( : 0.5–1 s, Göbel and Helmchen, 2007
, τNO: 0.5–5 s, Vaughn et al., 1998
). While there was a dramatic decrease in the CBF undershoot as we increased
: 0.5–1 s, Göbel and Helmchen, 2007
, τNO: 0.5–5 s, Vaughn et al., 1998
). While there was a dramatic decrease in the CBF undershoot as we increased  we none-the-less still observe an undershoot at
  We observed that τNO had no significant effect on the CBF undershoot. In addition, the diffusion constants for NO (3.3 × 10⁻⁵ to 4.8 × 10⁻⁵ cm2/s; Seraya and Nartsissov, 2002
; Kavdia and Popel, 2004
) and CO2 (1.14 × 10⁻⁵ to 2.5 × 10⁻⁵; Geers and Gros, 2000
) have a negligible effect on the undershoot results. Increasing the maximum Na conductance (gNa) decreases the undershoot, completely abolishing it when gNa > 15 mS/cm2 (we used 4.4 mS/cm2 in Figure 7
; Meyer et al., 1997
). Varying NMDA conductance (gNMDA) had no effect on the undershoot over the range of 500–1350 μM/(ms mV) (Shouval et al., 2002
).
We observed that τNO had no significant effect on the CBF undershoot. In addition, the diffusion constants for NO (3.3 × 10⁻⁵ to 4.8 × 10⁻⁵ cm2/s; Seraya and Nartsissov, 2002
; Kavdia and Popel, 2004
) and CO2 (1.14 × 10⁻⁵ to 2.5 × 10⁻⁵; Geers and Gros, 2000
) have a negligible effect on the undershoot results. Increasing the maximum Na conductance (gNa) decreases the undershoot, completely abolishing it when gNa > 15 mS/cm2 (we used 4.4 mS/cm2 in Figure 7
; Meyer et al., 1997
). Varying NMDA conductance (gNMDA) had no effect on the undershoot over the range of 500–1350 μM/(ms mV) (Shouval et al., 2002
).
: 0.5–1 s, Göbel and Helmchen, 2007
, τNO: 0.5–5 s, Vaughn et al., 1998
). While there was a dramatic decrease in the CBF undershoot as we increased we none-the-less still observe an undershoot at We observed that τNO had no significant effect on the CBF undershoot. In addition, the diffusion constants for NO (3.3 × 10⁻⁵ to 4.8 × 10⁻⁵ cm2/s; Seraya and Nartsissov, 2002
; Kavdia and Popel, 2004
) and CO2 (1.14 × 10⁻⁵ to 2.5 × 10⁻⁵; Geers and Gros, 2000
) have a negligible effect on the undershoot results. Increasing the maximum Na conductance (gNa) decreases the undershoot, completely abolishing it when gNa > 15 mS/cm2 (we used 4.4 mS/cm2 in Figure 7
; Meyer et al., 1997
). Varying NMDA conductance (gNMDA) had no effect on the undershoot over the range of 500–1350 μM/(ms mV) (Shouval et al., 2002
).The results of our model confirm the expected dominant vasodilatory role of NO, however CO2 is also important in modulating the shape of the response, in particular the initial overshoot and post-stimulus undershoot. Our results indicate that a washout of CO2 has a vasoconstrictive effect throughout the stimulus because NO dominates the blood flow response. While the vasoactive role of NO in producing a blood flow response is known experimentally (Morikawa et al., 1992
; Iadecola et al., 1993
; Akgören et al., 1994
), there is no experimental support for the possible blood flow effects of locally-produced-CO2.
The transient increase in nitric oxide, as reported in the literature, varies widely. While there are some studies showing the change to be as low as 2.2 nM in rats after parallel fiber stimulation (Kimura et al., 1998
) and 0.3 nM in cat nucleus tractus solitarius after arginine application (Wu et al., 2002
), some values are as high as 80 nM in cat after visual stimulus (Buerk et al., 1996
) and 200 nM in rats after forepaw stimulus (Buerk et al., 2003
). We also varied the decay constants for NO over their physiological range τNO: 0.5–5 s (Vaughn et al., 1998
). Our sensitivity analysis showed that τNO had no significant effect on the CBF undershoot. The shape of the reported NO responses also varies as stimulus type changes. The shape of the NO change in our model is more similar to the experimentally measured response for a visual stimulus (Buerk et al., 1996
), than for a forepaw stimulus (Buerk et al., 2003
).
A post-stimulus CBF undershoot has been observed by numerous groups. Specifically, the CBF undershoot has been observed in rat somatosensory cortex (Lindauer et al., 1993
; Kida et al., 2007
), cat visual cortex (Jin and Kim, 2008
), and human visual cortex (Hoge et al., 1999a
; Kim et al., 1999
; Lu et al., 2004
; Uludağ et al., 2004
; Chen and Pike, 2009
). Our simulations also result in a post-stimulus CBF undershoot. Our results show that the interplay between NO and CO2 is a possible explanation for this undershoot, without ruling out the effect of other possible confounding mechanisms such as neuronal inhibition.
Although there is no direct evidence for a hypocapnic vasoconstrictive effect of CO2 washout during brain activation in the literature, our model provides a novel explanation for features of the CBF response observed in the literature. Inspecting the components of the CBF response for short and long stimuli, we observe a post-stimulus undershoot for short stimulus while we see only a very brief and small undershoot for the long duration stimulus which is subsequently followed by a slow positive CBF recovery. For short stimuli, the increase in CBF during the stimulus has washed-out more CO2 than is being produced by the increased oxygen consumption. This reduces tissue pCO2 such that when the NO vasodilation returns to baseline post-stimulus, the reduced pCO2 results in vasoconstriction and an undershoot in CBF (see Figure 5
C). For longer stimuli, the oxygen consumption increase is greater and takes a long time to recover post-stimulus. Thus more CO2 is produced than is being washed away, allowing pCO2 to increase relative to baseline and return slowly to baseline as oxygen consumption returns to baseline (see Figure 5
D). This results in dilated vessels and a slowly recovering positive increase in CBF. These model results are consistent with a CBF undershoot observed experimentally following a 20 s stimulation of the occipital cortex by a flickering radial checkerboard (Uludağ et al., 2004
). Kim et al. found a modest undershoot in the primary visual cortex under 63 s of red/black reversing circular checkerboard stimulus (Kim et al., 1999
). In a similar experiment with a longer stimulus duration (3 min), a mild CBF undershoot is observed in primary visual cortex under low-contrast radial checkerboard (Hoge et al., 1999a
), which are all consistent with the results of the model (see Figure 7
A). The model underestimates the experimental data which may be due to other possible mechanisms leading to CBF undershoot which are not considered in the model such as neuronal inhibition.
Our model also provides a novel explanation for an initial CBF overshoot during the first 10 s of a stimulus (see Figure 3
) as observed by Krüger et al. (1999)
arising from CO2 dynamics rather than neuronal habituation. During the initial few seconds of the stimulus, the CBF response is dominated by the NO effect. This increase in CBF, washes out CO2, the vessels constrict slightly because of the reduced pCO2, and thus CBF reduces slightly from the increased vascular resistance. Interestingly, closer inspection of our results for the longer duration stimulus (Figure 3
C) shows a subsequent increase in CBF after reaching a minimum at 20 s, consistent with Hoge et al. (1999a
), Krüger et al. (1999
). This secondary increase in CBF arises from oxygen consumption continuing to increase during the stimulus, producing more CO2 (see Figure 5
D), dilating the vessels, and increasing CBF.
The positive BOLD response is determined by the relative contributions of CBV, CBF and CMRO2. When the effect of only NO and both NO and CO2 are considered, a positive BOLD response is obtained during the stimulus. Inhibiting the effect of NO diminishes the CBF increase significantly and so results in a negative BOLD response due to the insufficient oxygen supply to the activation area. This result is supported by various experimental efforts to determine the effect of NO in neurovascular coupling. Stevanovic et al. showed that inhibiting nitric oxide synthase significantly attenuates the CBV, CBF and BOLD responses (Stefanovic et al., 2007
). Since this inhibition of nitric oxide is not 100%, and it also diminishes the neural activation though less strongly, they still obtained a very low but still positive BOLD response. Findings from other works also suggest that the positive BOLD response is abolished by the inhibition of nitric oxide (Burke and Bührle, 2006
).
For the post-stimulus BOLD undershoot, three mechanisms have been suggested:
(1) sustained oxygen consumption after CBF has returned to baseline (Frahm et al., 1996
; Schroeter et al., 2006
),
(2) a slow recovery of CBV to baseline compared to CBF (Mandeville et al., 1999
), and
(3) a post-stimulus CBF undershoot (Hoge et al., 1999a
).
Our model results suggest that the BOLD undershoot for short stimuli is mostly due to a CBF undershoot that arises from a reduced pCO2. Experimental data supporting the BOLD undershoot due to a CBF undershoot resulting from reduced pCO2 levels can be found in a recent work by Wise et al. (2007)
. In their work, the end-tital CO2 undershoot, after a fixed-inspired hypercapnic challenge, precedes the BOLD undershoot. Although they do not show the CBF transients, a possible explanation for this is that, the CBF, before returning to baseline, washed-out the pCO2 below the baseline levels, and this, in response, caused an undershoot in CBF. For long stimuli, on the other hand, the post-stimulus BOLD undershoot in our model arises from a sustained oxygen consumption slowly recovering to baseline. Although this sustained oxygen consumption raises pCO2 above baseline, resulting in an increase in CBV, this does not enhance the post-stimulus BOLD undershoot because the elevated pCO2 also increases CBF washing out more CO2 and deoxygenated hemoglobin. Our model results support the combined roles of a flow undershoot and a sustained post-stimulus increase in CMRO2 in producing a BOLD undershoot, with the former dominating for short-stimuli and the latter for longer duration stimuli. We also want to point out that we have assumed a flow-volume relationship, which discarded any possible BOLD undershoot that could be produced by a slow volume recovery. The BOLD undershoot in our model would be enhanced by a slow volume recovery. We also note that our model does not comment on the possible role of active vasoconstriction related to inhibitory signals as recently suggested in Devor et al. (2007)
. Finally, the relative contributions of these different mechanisms of vasoregulation will likely be altered in cerebrovascular disease.
In addition, the model’s slow CMRO2 onset and recovery dynamics require further support. We used in the model the CMRO2 kinetics given in Aubert et al., (2007)
, which is based on the respiratory chain equation from the work of Holzhütter et al. (1985)
. The slow onset kinetics in CMRO2 used in this model is controversial and should be discussed. For example, a PET study from Mintun et al showed a 4.7% increase in CMRO2 60 s after the stimulus onset, while this value reaches 15% after 25 min of stimulation (Mintun et al., 2002
). A recent work from Lin et al. also obtained slow CMRO2 onset kinetics using fMRI (Lin et al., 2009
). The work of Prichard et al. confirms this slow increase in CMRO2, showing a slow lactate decay after the onset of photic stimulation (Prichard et al., 1991
). In contrary, other recent works show a much faster increase in CMRO2 (Davis et al., 1998
; Maciejewski et al., 2004
; Shen et al., 2008
; Wu et al., 2009
). For example; Wu et al. calculated the CMRO2 from CBF and BOLD signals using a biophysical model. They obtained a CMRO2 increase, reaching a steady state within a few seconds as a response to visual stimulation. We tried different CMRO2 onset kinetics in our model to see the possible changes in our results (data not shown). The BOLD percentage increase was lower for the fast kinetics than for the slow kinetics, and in better agreement with literature. The CMRO2 onset kinetics also has an effect on tissue pO2. With a slow onset we do not observe any transient decrease in tissue pO2 (data not shown), as opposed to the existing literature on the topic (Ances et al., 2001
; Offenhauser et al., 2005
). This is also supported by two recent studies, which use pharmacological agents to eliminate the blood flow response, and measure the BOLD signal in response to stimulation as an indicative of CMRO2. Time to peak values obtained by these studies are around 10 s, supporting a faster CMRO2 onset kinetics (Nagaoka et al., 2006
; Zappe et al., 2008
). However, the increasing kinetics for CMRO2 did not have much of an effect on the CBF onset, and CBF and BOLD post-stimulus transients, the parameters altering the shaping of the hemodynamic response on which we have focused our discussion.
In summary, the increase in CBF during stimulation likely reduces local tissue pCO2. This is another possible explanation for the post-stimulus CBF undershoot that has been described in the literature. It should also be added that the relative contributions of these different mechanisms of vasoregulation will likely be altered in cerebrovascular diseases.
The authors declare that the research was conducted in the absence of any commercial or financial relationships that could be construed as a potential conflict of interest.
We would like to acknowledge Tamer Demiralp, Sava Sakadžić, Qianqian Fang, Uzay Emrah Emir and Rickson Coelho Mesquita for their helpful comments. This work is funded by TUBITAK-BAYG and NIH (R01NS-057476, P01NS-055104 and R01NS-051188).
Devor, A., Tian, P., Nishimura, N., Teng, I. C., Hillman, E. M., Narayanan, S. N., Ulbert, I., Boas, D. A., Kleinfeld, D., and Dale, A. M. (2007). Suppressed neuronal activity and concurrent arteriolar vasoconstriction may explain negative blood oxygenation level-dependent signal. J. Neurosci. 27, 4452–4459.
Wise, R. G., Pattinson, K. T., Bulte, D. P., Chiarelli, P. A., Mayhew, S. D., Balanos, G. M., O’Connor, D. F., Pragnell, T. R., Robbins, P. A., Tracey, I., and Jezzard, P. (2007). Dynamic forcing of end-tidal carbon dioxide and oxygen applied to functional magnetic resonance imaging. J. Cereb. Blood Flow Metab. 27, 1521–1532.