Faculty of Biomedical Engineering, Technion – Israel Institute of Technology, Israel
Metal microelectrodes are widely used in neuroscience research, and could potentially replace macroelectrodes in various neuro-stimulation applications where their small size, specificity, and their ability to also measure unit activity are desirable. The design of stimulating microelectrodes for specific applications requires knowledge on how tip geometry affects function, but several fundamental aspects of this relationship are not yet well understood. This study uses a combined experimental and physical finite elements simulation approach to formulate three new relationships between the geometrical and electrical properties of stimulating cone-tipped tungsten microelectrodes: (1) The empirical relationship between microelectrode 1-kHz impedance and the exposed tip surface area is best approximated by an inverse square-root function (as expected for a cone-tipped resistive interface). (2) Tip angle plays a major role in determining current distribution along the tip, and as a consequence crucially affects the charge injection capacity of a microelectrode. (3) The critical current for the onset of corrosion is independent of tip surface area in sharp microelectrodes.
Metal microelectrodes are pervasive in basic neuroscience research and are also seen as a promising alternative to macroelectrodes in many neuro-stimulation applications, including sensory-motor prosthetic interfaces for the disabled (Normann, 2007
; Normann et al., 1999
; Weiland et al., 2005
), deep brain stimulation (Lozano et al., 2002
; McCreery et al., 2006
; Volkmann, 2004
) and brain machine interfaces (Donoghue, 2002
; Maynard et al., 1997)
. Microelectrode advantages include reduced tissue displacement and trauma, higher stimulation specificity, and the ability to combine unit recordings and stimulation in the same device, which can facilitate more accurate probe placement as well as closed-loop applications. However, to be considered suitable for long-term stimulation applications, microelectrodes must be electrochemically and mechanically stable (Das et al., 2007
; Edell et al., 1992
; Liu et al., 1999
), as well as biocompatible (Szarowski et al., 2003
). A major challenge in the design of stimulating microelectrodes is obtaining the high current densities required by the small tip size, while avoiding the critical values for the onset of microelectrode degradation (Gimsa et al., 2006
; Merrill et al., 2005
).
A significant body of literature discusses the electrical properties of the electrode–tissue interface (McCreery et al., 1987
; Robinson, 1968
; Stieglitz, 2004
) and its stimulation frequency (Bates and Chu, 1992
; Franks et al., 2005
; Gimsa et al., 2005
; Onaral et al., 1984
; Sun and Onaral, 1983
) and material (Cogan, 2003
; Gimsa et al., 2005
; Merrill et al., 2005
) dependences. Additional studies have focused on calculating the potential fields around electrodes (Butson and McIntyre, 2006
; Gimsa et al., 2006
; McIntyre and Grill, 2001
; McIntyre et al., 2004
; Suesserman et al., 1991
), and elucidating how the spreading currents interact with neural tissue (reviewed in Tehovnik, 1996
; Tehovnik et al., 2006
).
In addition to the fundamental effects of materials and frequency, geometric parameters such as tip geometry and size can also crucially affect the suitability of microelectrodes for specific neuro-stimulation applications by effecting functional characteristics like the current density distribution, impedance and corrosion thresholds (see, e.g., Gimsa et al., 2006
, for a detailed study on the characteristics of bipolar electrodes with several different geometries). Interestingly, some basic form–function relationships are still not fully resolved in the important case of cone-tipped microelectrodes. For example, Robinson (1968)
implies an inverse relationship between microelectrode impedance and tip surface area, by presenting impedance in units of MΩ μm2 (as it would be for a parallel-plate capacitor). In contrast, experimental measurements performed using platinum-iridium electrodes (Tielen et al., 1971
) suggest a logarithmic relationship.
The present study is aimed at further elucidating the behavior of stimulating microelectrodes with respect to tip geometry, including the relationships between tip shape and size and interfacial impedance, current density distribution along the electrode-electrolyte boundary and the critical currents for the onset of microelectrode degradation. To address these issues our study combines a series of in vitro measurements using (primarily) tungsten microelectrodes, and analysis of finite elements numerical solutions for current density distributions around stimulating microelectrodes. Our study focuses on a search for generic relationships that can potentially be useful in many practical situations (using measurements from the nearly universal 1-kHz impedance testing equipment). We conclude by discussing the study’s limitations, and the relationship of our findings to the theoretical behavior of cone-shaped capacitors and resistors.
Geometrical and Electrical Measurements
Forty-nine glass-insulated tungsten microelectrodes and three platinum microelectrodes (Nano-Biosensors, Nazareth, Israel) were examined. Each microelectrode was photographed using a Nikon Eclipse TS100 microscope with a Nikon Digital Sight DS-5Mc camera, and its geometry was analyzed in MATLAB R2006b (MathWorks, Natick, MA, USA). The exposed tip of the microelectrode (Figure 1
A) was approximated to a simple cone whose base diameter (D) and distance between apex and base perimeter (L) were measured. The tip’s angle (the two-dimensional projection of an axisymmetric spatial angle) and surface area were calculated according to:
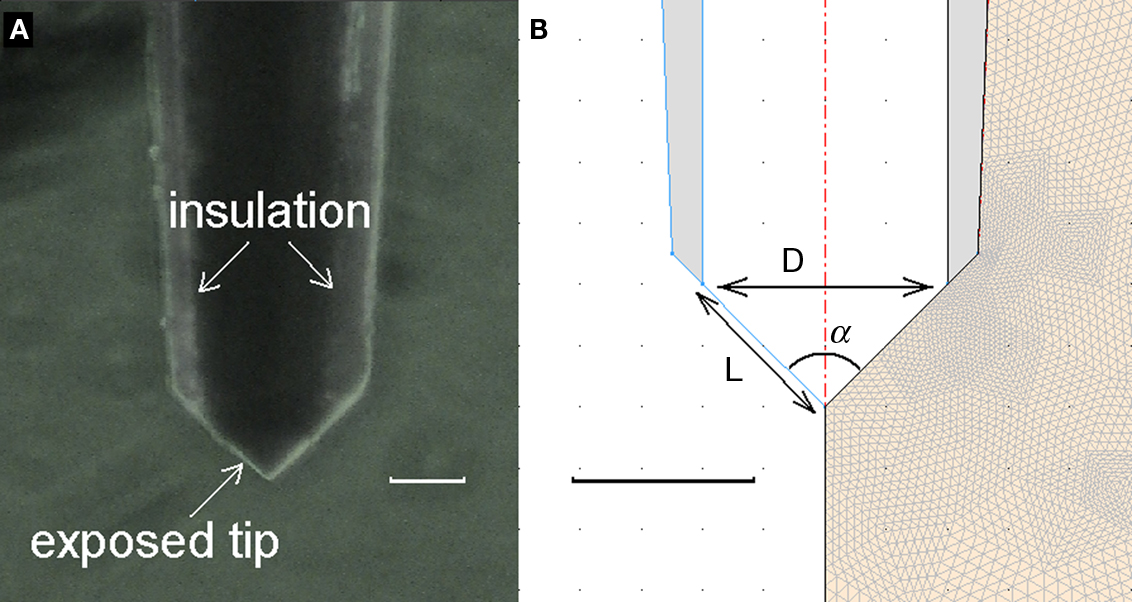
Figure 1. (A) Microscopic photograph of a microelectrode with a nearly right-angled tip. (B) Axisymmetric microelectrode model and finite elements mesh in surrounding medium (the medium extends much further than shown). Scale bars are 20 μm.
The combined impedance of the microelectrode and its interface with an electrolyte approximating the ionic composition of the extracellular matrix (0.15-M NaCl solution), was measured at 1 kHz using a 10-nA sine wave (FHC impedance meter).
A variable amplitude 100-Hz sinusoidal alternating current was then applied to the circuit using an analog stimulus isolator (model 2200, A-M SYSTEMS, Sequim, WA, USA), driven by a DF1643 series function generator. One-minute stimulations were repeatedly carried out with gradually increasing current amplitudes until visible damage to the microelectrode’s tip was obtained at a critical current. As the microelectrodes were delivered in different sets, the first microelectrode in each set was used to establish a rough range of damage threshold, and the rest were used to make the fine specific measurements. Twenty-two tungsten microelectrodes and three platinum microelectrodes that provided an accurate reading of damage thresholds were included in the analysis. A critical current density was calculated from the geometrical measurements as follows:

Modeling and Simulation
Our simulations are based on an adaptation of the finite elements model of a stimulating microelectrode introduced by McIntyre and Grill (2001)
. Considering the frequency used for stimulation (100 Hz), the dimensions and the electrical properties of the solution (or of biological tissues) allow us to utilize a quasi-static approximation and solve the Laplace equation for the DC case (Plonsey, 1969
). A cylindrical insulated microelectrode with an uninsulated cone-shaped tip was set in axial-radial coordinates (Figure 1
B), and the Laplace equation:

was solved for a surrounding conductive medium (σ = 0.3 S/m, as typical for cortex tissue – Sances and Larson, 1975
) with dimensions 2 mm × 1 mm (representing a three-dimensional cylinder of volume 2π mm3). The microelectrode tip was set to 1 V and the edges of the surrounding medium were set to 0 V. Electrical flux perpendicular to the insulation was not allowed, and radial flux at r = 0 was fixed to zero due to symmetry considerations. In contrast with the model of McIntyre and Grill (2001)
, apex curvature is neglected and the surfaces of the tip and the insulation are parallel, to suit the geometry of the microelectrodes tested experimentally.
The model was solved in COMSOL Multiphysics 3.2b (COMSOL Inc., Burlington, MA, USA). The simulation resulted in a map of potentials inside the medium, from which a field of current density was derived. The current density near the tip was analyzed for different conical geometries (same angle with changing surface area, and vice versa).
Impedance-Geometry Relationship
The tungsten microelectrodes were classified into two major classes according to their tip angle: an acute angle class (24 microelectrodes; tip angles 41 ± 5° STD) and a nearly right-angle class (25 microelectrodes; tip angles 81 ± 5°).
To understand the dependence of microelectrode impedances on form parameters, we measured characteristic 1-kHz impedances for our entire sample. Impedances were found to be strongly dependent on the tip surface area (Figure 2
), irrespective of their tip angle. We tested three different functional fits for this dependence, where the highest correlation (r = 0.93) was found between impedances and the inverse square-root of the surface area:
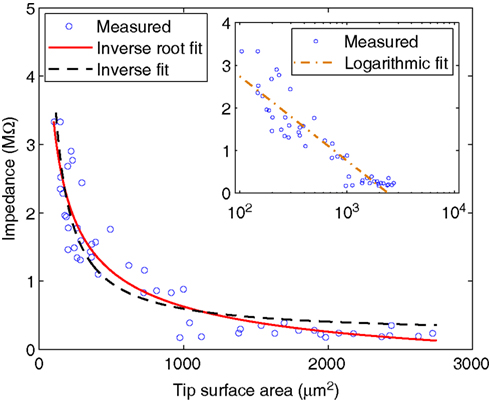
Figure 2. Impedance of electrode-electrolyte complex vs. tip surface area of tungsten microelectrodes, with possible inverse and inverse-root relationships. Inset: Logarithmic relationship, in logarithmic scale.
Strong correlations were also found to the inverse of surface area (r = 0.91), in agreement with Robinson’s model (Robinson, 1968
), and to the logarithm of surface area (r = −0.92), consistent with previous measurements (Tielen et al., 1971
). Note that the predictions of inverse-root and inverse fits at 1000 μm2, for instance (Z = 627 and Z = 595 kΩ, respectively), are close to that of Robinson for platinum electrodes under 1-kHz stimulation – Z = 557 kΩ (Robinson, 1968
, p. 1067). By comparing mean square errors (MSE) of the fits, the superiority of inverse-root relationship over inverse and logarithmic relationships becomes clearer (MSE = 0.114, 0.144 and 0.136, respectively). For further justification of favoring inverse-root relationship, see discussion.
We next calculated the dependence of the mean current density along the tip in the model simulation on the form parameters. Within the tip size range of 200–3000 μm2, the mean current density (J) is nearly independent of tip angle, with relative differences between the cases of 40° and 90° of 4.8 ± 3.0%. In contrast, J is strongly related to the tip surface area (Figure 3
). Here too, inverse square-root relationships (Eqs 6 and 7) provide an excellent fit with the results (r > 0.99 for both), whereas inverse and logarithmic relationships yield weaker fits: MSE values of these fits are more than an order of magnitude larger than the MSE of the former fits (Figure 3
, inset).
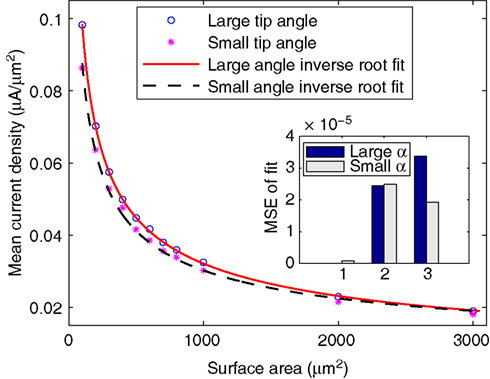
Figure 3. Mean current density vs. tip surface area, as predicted by simulation for two extreme cases of tip angle – 40° and 90°. Inset: MSE of three different fits: (1) inverse root, (2) inverse and (3) logarithmic.
Threshold Currents for Microelectrode Degradation
Values of critical currents for microelectrode degradation were registered from experimental observations. In contrast to the impedance, the critical current and current density of the microelectrodes are considerably dependent on tip angle, as the small angle class (14 samples; tip angles 41 ± 4° STD) and the large angle class (eight samples; tip angles 83 ± 4°) exhibit an entirely different behavior from each other. We find that the critical current density has a clear inverse dependence on tip surface area for the large angle specimens (Figure 4
A; r = 0.98, after excluding two specimens which we later refer to as outliers):
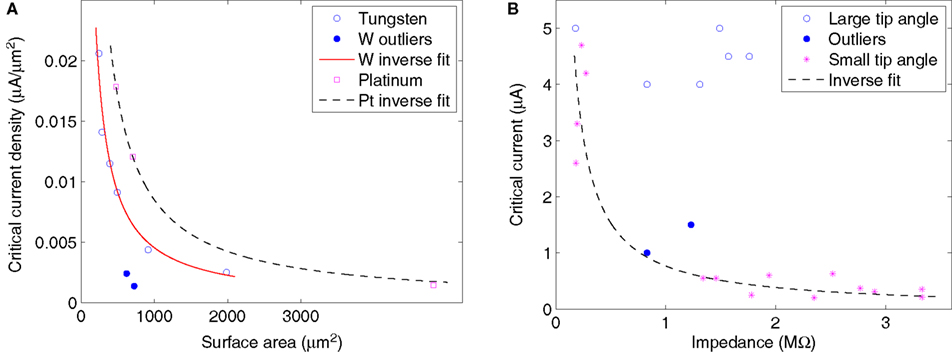
Figure 4. (A) Critical current density of large tip angle species vs. tip surface area, with inverse fits (putative outliers are excluded). (B) Critical current for corrosion of tungsten microelectrodes vs. impedance of electrode-electrolyte complex, with possible inverse relationship for species with small tip angle.

An inverse relation to increasing surface area was also obtained for the three platinum microelectrodes tested under the same conditions (r > 0.99, tip angles: 82, 84 and 90):

Critical current density of small angle tungsten specimens showed no significant dependence on either surface area or impedance.
As for critical current, in the small angle class it substantially drops along with increase in impedance (Figure 4
B) and an inverse relationship:

was found to best fit the results (r = 0.94), whereas in the large angle class the critical current showed no significant relation to impedance, nor to surface area. Specifically, all specimens resisted corrosion until current reached 4–5 μA except for the two above-mentioned outliers which underwent corrosion at 1–1.5 μA (despite the fact that they were not exceptional in terms of neither impedance nor surface area), suggesting that these microelectrodes may have been defective.
Effect of Critical Regions
To gain a better understanding of the tip behavior under the application of current, we analyzed the spatial distribution of current densities near the tip in our numerical solutions. Simulation results (Figures 5
A,B) show that the computed current distributions along the tip is far from being uniform and is characterized by two regions of high current density: the apex of the cone (hereinafter: tip head) and the perimeter of its base where the metal becomes exposed (hereinafter: end of insulation). This observation coincides with the numerical results obtained by Gimsa et al. (2006)
. Since corrosion is expected to commence where current density is the highest, these regions will be referred to as “critical regions”. Indeed, during stimulation we experimentally observed the formation of bubbles at these regions (Figure 5
C). Gaseous bubbles (of hydrogen, oxygen or chlorine) are formed as a result of the solution’s hydrolysis and occur first at the regions where current density is highest.
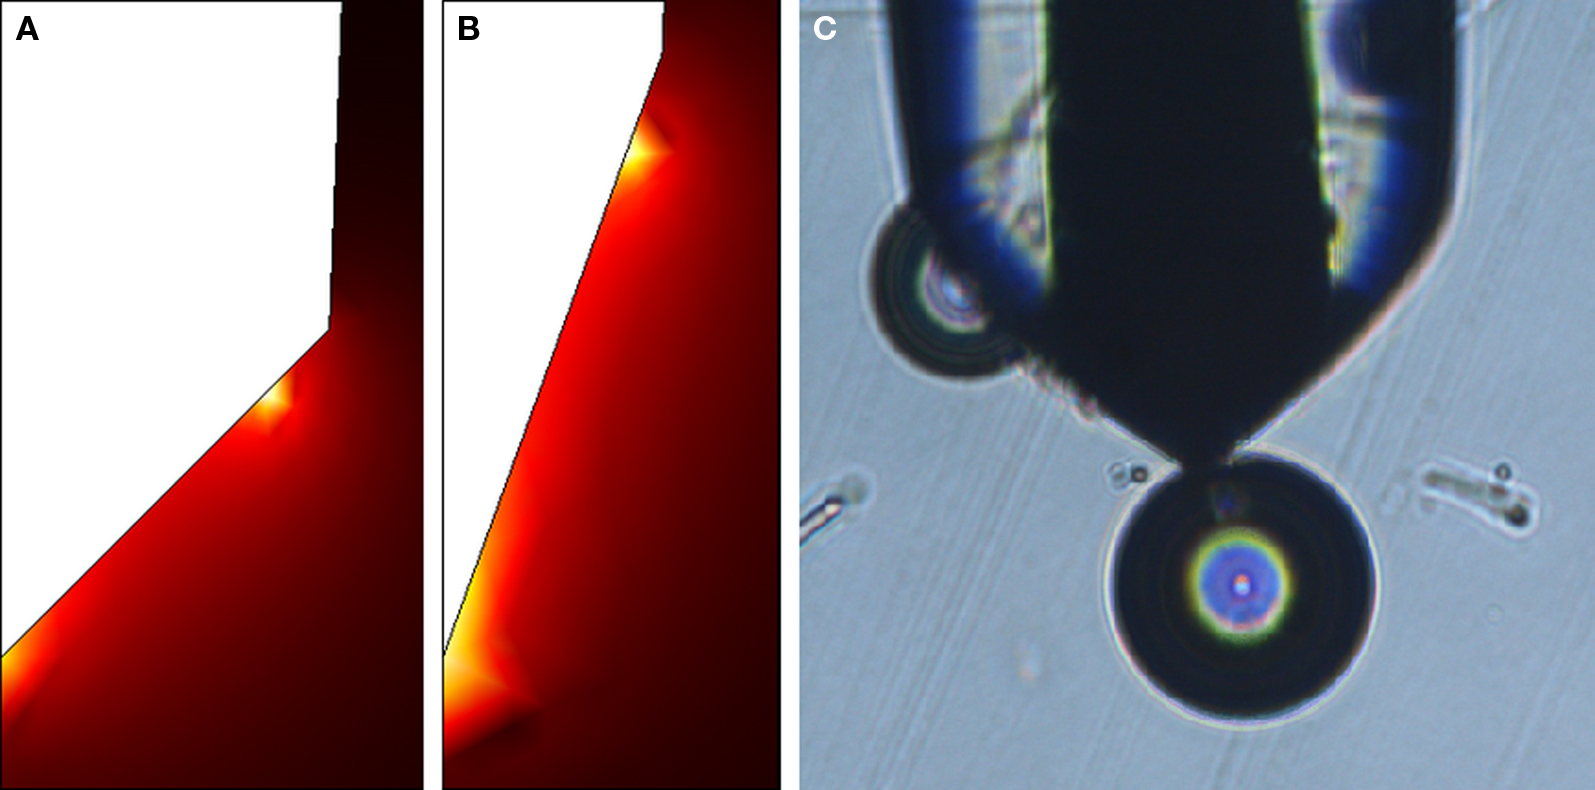
Figure 5. (A,B) Distribution of current density magnitudes obtained in numerical simulation around 90° tip (A) and around 40° tip (B). Brighter colors correspond to higher values. (C) Experimental observation of microelectrode during stimulation. Note that virtual black-white border appears due to light refractions and does not indicate a metal-insulation border.
The critical regions were under scrutiny when numerically analyzing changes in current density with respect to the tip’s cone parameters. The current density at these regions was computed for a spectrum of angles so as to explore the source for differences in behavior between acute angle tips and right-angle tips. In order to isolate the effect of tip angle, surface area was held constant at 444 μm2 (Figure 6
A) and later at 2000 μm2 (Figure 6
B). For the larger surface area current density at end of insulation remains higher than that at tip head for all angles, whereas for the smaller surface area the inequality reverses for small angles. A transition range exists between 40 and 50 , with 46 being the intersection of the two corresponding linear fits. Such observation can certainly account for the different behavior exhibited by the two classes of microelectrodes, since the two classes are on opposite sides of the “turnover” angle: (41 ± 4°) ≤ 46 ≤ (83 ± 4°).
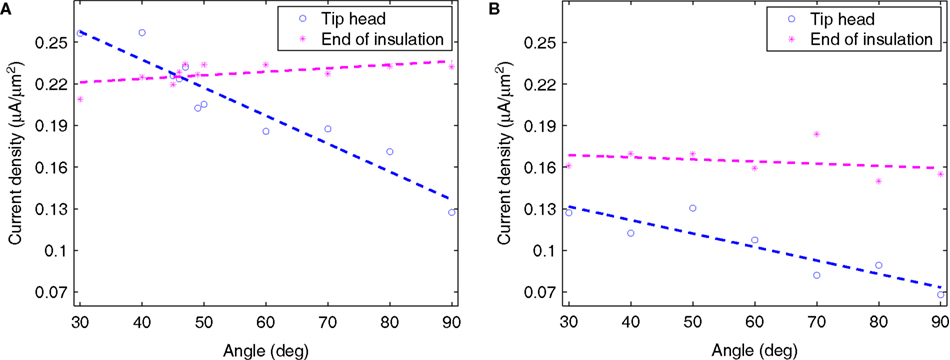
Figure 6. Current density at tip’s head and at end of insulation vs. tip angle, as obtained in simulation and plotted with linear fits, for two different values of surface area. (A) S = 444 μm2, r = 0.95 for tip head and r = 0.59 for end of insulation, and (B) S = 2000 μm2, r = 0.90 and r = 0.29, respectively. In both cases only the tip head’s correlation is statistically significant.
A graphical visualization of the entire current density distribution along tips of two representative types (90° and 40°) is shown in Figures 5
A,B, and shows that the current density at the tip head is substantially reduced as a result of tip blunting.
In order to isolate the effect of surface area, current density was examined at the two critical zones for two different cases of constant tip angle – 90° (Figure 7
A) and 40° (Figure 7
B). The simplest relationships that fitted all four simulations sufficiently well (|r| ≥ 0.95) were inverse-root:
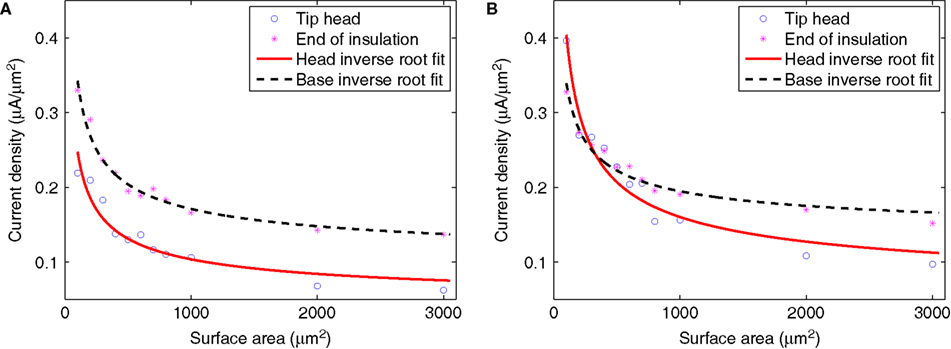
Figure 7. Simulated current density at critical regions vs. tip surface area, with inverse-root fits, for two extreme cases of tip angle. (A) 90°, and (B) 40°.

(with different proportionality constants) and logarithmic, although the latter cannot apply for large values of surface area (otherwise implying negative current densities) and thus their validity is restricted.
Main Contributions
In this study, we systematically examined the dependence of certain electrical properties of metal microelectrodes on the geometry of the exposed tip, using a combined experimental and simulation approach. Our experimental sample consisted of tungsten microelectrodes with sharp or right-angled tips, and with surface areas that varied over 1.5 orders of magnitude (100–2700 μm2). Our results provide new insights regarding these dependences that may also assist the design of microelectrodes for safe and efficacious stimulation of neural tissue.
We first compared three different functional relationships for the experimentally derived dependence between the impedance Z(1 kHz) and tip surface area S: a logarithmic relationship (obtained by Tielen et al., 1971
), an inverse relationship (implied by the model of Robinson, 1968
), and an inverse-root relationship. To the best of our knowledge, such comparison was not made before the present work. The inverse square-root relationship (Eq. 5) yielded the best fit (Figure 2
). This functional form is also consistent with our model simulation results, where the mean current density J was found to vary as  irrespective of tip angle (Figure 3
), thus predicting the same relation for the impedance itself:
irrespective of tip angle (Figure 3
), thus predicting the same relation for the impedance itself:
irrespective of tip angle (Figure 3
), thus predicting the same relation for the impedance itself: 
(where V is a constant voltage). The fact that inverse-root fit was significantly better than other fits for simulated mean current density (Figure 3
) strengthens the certainty about inverse-root relationship for measured impedance (Figure 2
).
The conical microelectrode geometry studied here renders the full theoretical analysis of the problem quite complicated. Nevertheless, certain approximate solutions can provide additional insights into the validity of our experimental and simulation results. The electrochemical double-layer can be seen as a capacitor with two cone-shaped plates. The analytical solution for a minimally-trimmed cone capacitor was derived by Selby (1962)
:
where ε is the medium’s absolute permittivity, h is the trimmed cone’s height, D is the distance between the imaginary apices of the cones and θ is the cones angle. Since the surface area of a minimally-trimmed cone practically equals πh2 tan(θ/2)/cos(θ/2), the following relation is derived for the impedance:

This solution does not take into consideration the shunt capacitance introduced in models of the interface (e.g., Robinson, 1968
).
In contrary, analysis of resistance relates solely to the surrounding medium, as interfacial currents are strictly capacitive under the low currents used in impedance measurements. When neglecting fringe effects and assuming current spread in an infinite medium with conical equipotentials, an inverse-root relationship with respect to the surface area can be derived:
This analytical result is in agreement with the inverse square-root relationship found in the simulation results where a resistive medium was assumed. In the experimental measurements, both the resistive medium and the capacitive interface play a role in determining the impedance. The better experimental fit of the inverse-root functional may imply that the effect of the medium on the impedance is stronger than that of the interface.
A second major focus of our study was on thresholds for microelectrode degradation, for which the direct implication is corrosion of the metal. Degradation might also be accompanied by other Faradaic processes and the formation of free radicals which are hazardous for the living tissue. Both experimental and simulation results demonstrated a significant disparity between the properties of sharper tips (∼40°) and blunter tips (∼90°). The constant critical current for blunt tips is surprising, implying that larger tip would not improve the microelectrode’s endurance. The calculation of critical current density (Eq. 3) refers only to mean density, whereas corrosion selectively begins at critical regions where current density is much higher. Most of the current flows through a small fraction of the surface, hence an increase in surface area contributes mostly to regions of low current density. As a result, enlarging the surface only moderately affects current densities at critical regions while significantly decreasing critical mean current density. This coincides with the different relationships obtained both experimentally (Figure 4
A) and in simulation (Figure 7
): current densities at critical regions moderately decline with increase in surface area (varying as  ), whereas critical mean current density drops more rapidly (varying as 1/S). Our results thus support and extend McIntyre and Grill’s (2001)
observation that peak current density is not linearly proportional to the change in surface area.
), whereas critical mean current density drops more rapidly (varying as 1/S). Our results thus support and extend McIntyre and Grill’s (2001)
observation that peak current density is not linearly proportional to the change in surface area.
), whereas critical mean current density drops more rapidly (varying as 1/S). Our results thus support and extend McIntyre and Grill’s (2001)
observation that peak current density is not linearly proportional to the change in surface area.Methodological Choices and their Generality
We have attempted to study generic, practical aspects of form-function relations in stimulating microelectrodes. This has led us to focus on 1-kHz impedances, universally used to qualitatively characterize microelectrodes in both laboratory and clinical settings. Clearly, a more thorough impedance spectroscopy treatment is needed in order to understand how our observations are related to the (generally frequency-dependent, non-linear and non-stationary) microelectrode properties (e.g., Gimsa et al., 2005
). Moreover, the proposed relationships describing 1-kHz impedance are relevant in a wide range of measured surface area (100–2700 μm2) but are not necessarily valid outside this range. Indeed, some of the functional forms we have obtained imply physically impossible negative impedances for very large tips.
The study of microelectrode degradation focused on the properties of tungsten microelectrodes using 100-Hz sinusoidal stimulation. Pulse frequencies of approximately 100 Hz (typical range: 90–130 Hz) are most commonly used in DBS stimulation paradigms, and driving the electrodes with sinusoidal currents (rather than low duty-cycle pulses used for neuro-stimulation) simply accelerates the electrodes’ degradation. Tungsten microelectrodes are typically only used for stimulation in undemanding acute studies due to their relatively low damage thresholds. We therefore also measured a small sample of platinum microelectrodes, and contrasted the empirical results with the behavior of physical models, overall suggesting that our results appear to be material-independent. Nevertheless, it will be interesting to test whether the more clinically useful platinum/iridium microelectrodes manifest similar degradation modes and characteristics.
The authors declare that the research was conducted in the absence of any commercial or financial relationships that could be construed as potential conflict of interest.
We thank Mr. Nabil Jadaon and Dr. Emad Nimer of Nano Biosensors Ltd. for many helpful discussions and for providing the electrodes, and Dr. Oscar Lichtenstein for making available some of the equipment. We would like to acknowledge Dr. Victor Pikov and the reviewers for their important comments on the manuscript, and the support provided by Israeli Science Foundation grant #1248/06 and European Research Council starting grant #211055.
The Supplementary Material for this article can be found online at http://www.frontiersin.org/neuroengineering/paper/10.3389/neuro.16/013.2009/
Tielen, A. M., Giesen, C., and Mollevanger, W. (1971). Some mechanical and electrical characteristics of metal microelectrodes. Institute of Medical Physics TNO Report 2.3.65/1 MEI (Utrecht, The Netherlands). Reproduced in: Lemon, R. (1984). Methods for Neuronal Recording in Conscious Animals (IBRO Handbook Series: Methods in the Neurosciences, Vol. 4), A. D. Smith, ed. (London, Wiley), p. 74.