Combining Phylogenetic and Occurrence Information for Risk Assessment of Pest and Pathogen Interactions with Host Plants
 Ángel L. Robles-Fernández
 Andrés Lira-Noriega
- 1Facultad de Física, Universidad Veracruzana, Xalapa, Mexico
- 2Instituto de Ecología, A.C., Red de Estudios Moleculares Avanzados, Xalapa, Mexico
- 3Consejo Nacional de Ciencia y Tecnología (CONACYT), Mexico City, Mexico
Phytosanitary agencies conduct plant biosecurity activities, including early detection of potential introduction pathways, to improve control and eradication of pest and pathogen incursions. For such actions, analytical tools based on solid scientific knowledge regarding plant-pest or pathogen relationships for pest risk assessment are needed. Recent evidence indicating that closely related species share a higher chance of becoming infected or attacked by pests has allowed the identification of taxa with different degrees of vulnerability. Here, we use information readily available online about pest-host interactions and their geographic distributions, in combination with host phylogenetic reconstructions, to estimate a pest-host interaction (in some cases infection) index in geographic space as a more comprehensive, spatially explicit tool for risk assessment. We demonstrate this protocol using phylogenetic relationships for 20 beetle species and 235 host plant genera: first, we estimate the probability of a host sharing pests, and second, we project the index in geographic space. Overall, the predictions allow identification of the pest-host interaction type (e.g., generalist or specialist), which is largely determined by both host range and phylogenetic constraints. Furthermore, the results can be valuable in terms of identifying hotspots where pests and vulnerable hosts interact. This knowledge is useful for anticipating biological invasions or spreading of disease. We suggest that our understanding of biotic interactions will improve after combining information from multiple dimensions of biodiversity at multiple scales (e.g., phylogenetic signal and host-vector-pathogen geographic distribution).
1. Introduction
Understanding the geographic distribution and evolutionary ecology of plant pests and pathogens represents an advance in phytosanitary risk assessment. While pests and pathogens can arrive at new locations through natural dispersal, or be introduced for the purpose of biological control or accidentally, or even by hybridization in situ [1], their relationships with specific hosts highlights their potential to interact with different hosts, which is largely determined by their phylogenetic constraints. Typically, phytosanitary agencies provide plant biosecurity at regional or national levels through eradication or control of new pests via preventive activities such as quarantining, detection of illegal introduction through customs, and other local measures, once the problem is detected. However, although pest control and phytosanitary risk assessment require a thorough analysis of the areas of distribution of pests or pathogens, the environmental conditions in which they develop, and the hosts with which they are associated, resources available for carrying out such analyses are normally insufficient. A more effective alternative for an efficient phytosanitary response should be based on analytical tools that incorporate sound scientific knowledge regarding plant-pest relationships to help identify which pests pose risks [2, 3]. Two of the most informative sources of information (i.e., dimensions of biodiversity [4, 5]) for phytosanitary risk assessment include the geographic distribution of the pests and their associated hosts and phylogenetic distance among hosts as a surrogate of vulnerability, given that phylogenetically close species or genera share a higher probability of being affected by the same pest [6]. It is possible to encode information about phylogenetic distances among species in such a way that it can be shown geographically [7], thus providing a spatially explicit risk assessment of the plant-pest interactions. On this theoretical basis, it is possible to calculate the probability of infection by a pathogen or attack by a pest, either through its geographical distribution or by using statistical methods to estimate the incidence of pests on a series of hosts of different phylogenetic distances. The combination of these two sources of information regarding pest/pathogen-host interactions would provide a more comprehensive and integrated biogeographic approach to risk analysis.
In general, information currently available regarding the interaction of plants with pests or pathogens, or even insects, is scarce and mainly pertains to a few sites. However, it is possible to use information about the number of known hosts and the phylogenetic distance between known hosts and other species of interest to make inferences regarding plant-taxon interactions at different taxonomic or phylogenetic levels [6]. Gilbert et al. [6] used the Global Pest and Disease Database of the Plant Protection and Quarantine Division of the Animal and Plant Health Inspection Service of the United States Department of Agriculture (APHIS-PPQ) database to extract all of the recorded plant pests from 210 genera of flowering plants, and evaluate the strength of the phylogenetic signal in terms of host range for nine major groups of plant pests and pathogens. They found clear statistical patterns in terms of the likelihood of different plant genera sharing a common pest. On the other hand, primary biodiversity data of species distributions for major taxa can be readily accessed via several online databases, such as the Global Biodiversity Information Facility (GBIF)1, and can be used simply as occurrence information with which to conduct spatial queries or as input data for obtaining potential distributional ranges from species distribution modeling. As distributional data from such databases present spatial and taxonomic biases and gaps, they must therefore be used with some caution [8].
Here, we propose an approach by which to: (1) assess the probability that a source host shares a pest with a target host, considering the phylogenetic distance between them, and (2) use this model to project the intensity of the expected likelihood in geographic space given the distribution of host taxa in what could be interpreted as a spatial index of interaction or risk to host plants. This procedure represents an efficient method for performing a geographical assessment, especially when interpretation depends on the interactions of the pest or pathogen with host plants or any other agent (e.g., insects) found to be associated with the host plants. We apply this protocol to a set of ambrosia beetles (Scolytinae: Xyleborina) and their associated hosts to illustrate the efficacy of this assessment and evaluate its similarity to empirical evidence collected previously [6, 9].
2. Methods
2.1. Beetle and Plant Host Incidence Matrix
We derived an incidence matrix I based on information pertaining to 23 ambrosia beetle species and their associated host plant species by retrieving information from one of the most comprehensive databases on bark and ambrosia beetles, curated by Thomas Atkinson2. These 23 species were selected because of their phylogenetic relationship to Xyleborus glabratus, an invasive alien species in North America and vector of the fungus Raffaelea lauricola, which causes Laurel Wilt Disease and is a major agent for tree mortality for species of Lauraceae [10]. In general, these data coincided with recently published information on the phylogenetic relationships of ambrosia beetles [11]. The taxonomy of beetle species to X. glabratus was checked using information validated for GBIF and NCBI with the R package taxize [12].
Using information from the same database, we found 372 host plant species associated with this set of beetle species. From this group of host plant species, we summarized information at the genus level (243 genera), of which we kept only those genera with phylogenetic information valid for the Angiosperm Phylogeny Group (APG III; [13] for reconstructing a phylogenetic hypothesis (235 genera in total; see below). A final incidence matrix I = aij was then obtained with 20 beetle species for rows i and 235 host plant genera for columns j, coding it as 1 if the beetle-plant association was reported as present and 0 otherwise. We considered only beetle species with three or more plant associations, since a lower number of incidences could lead to unreliable results in the linear regression ([6]; see below).
2.2. Plant Host Phylogenetic Distance Matrix
For the 235 host plant genera, an ultrametric phylogenetic tree was obtained from Phylomatic through the R package brranching [14]. This tree was then imported into Phylomatic, where branch lengths were estimated using the bladj function [15]. This step uses information from the APG III supertree [13] and the dated nodes given by Wikstrom [16]. From this phylogenetic tree, we then obtained a symmetric real-valued dissimilarity matrix D1 = [dij] of order n = 235, in which dii = 0 for all 1 ≤ i ≤ n and dij ≥ 0 for all 1 ≤ i < j ≤ n for each n plant genus with the R package ape [17] and then transformed the matrix as D = log10(D1 + 1), following Gilbert et al. [6].
2.3. Beetle-Host Association Probability Matrix
To obtain the probability of a host plant genus being affected by, or found in association with, a particular beetle species (or all of the beetle species), we calculated a logistic regression relating the host-beetle incidences in matrix I to the host phylogenetic distances in matrix D, using phylogenetic distance as the independent variable. To this end, we first constructed a two-column array between I and D as follows: for each row in I, we randomly selected one interacting host (known as the source host), and then selected the remaining host genera (target hosts) iteratively at random. We repeated this process for each row in I, adding the information corresponding to each new row to the two-column array until we had completed the entire set of beetle species. A matrix of probabilities P was then obtained by applying the regression coefficients to the logistic transformation of I (see Section 2.2). In Equation (2), β0 and β1 were obtained by repeating the previous procedure 1,000 times and selecting both the mean intercepts (β0) and slope coefficients (β1) of these regressions.
2.4. Presence-Absence Matrices Of Host Plants
A presence-absence matrix summarizes information pertaining to the geographic distribution of every host plant species over a regular grid for any given region, with presence coded as 1 and absence as 0. We defined M = [mij] in which mij = 1 if the host genera was present and mij = 0 where absent. If this occurred, we considered two cases with which to show the host plant genera distribution on a regular grid of 1 degree spatial resolution: one matrix containing information on host plant genera, derived from the list of host plant species in the database of Atkinson (called M1), and a second matrix corresponding to host plant genera in the phylogenetic tree but showing occurrences for each genus directly from GBIF using the R package spocc [18] (called M2). For M1, all 372 host plant species were used to obtain occurrence data from GBIF, after which we grouped information at the genus level and merged it with the genera in the phylogenetic distance matrix D. This procedure rendered a matrix of m = 232 host plant genera by n = 62, 640 sites. For M2, the occurrence data from GBIF rendered a matrix of m = 203 host plant genera by n = 62, 640 sites. We used both matrices M1 and M2 to illustrate the fact that the occurrence data could also be biased or incomplete when using different avenues by which to retrieve it. This problem is potentially common when handling resources available on different databases or using different search engines (e.g., accessing GBIF directly online or through the R package spocc).
2.5. Interaction or Infection Spatial Index and Risk Maps
We obtained an interaction or infection matrix G = PM by multiplying matrix P by matrix M1 or M2. Matrix G contains information about the probability that a given source host can share a beetle with other target hosts when they are present at a given site. We suppose that each interaction or infection event could occur regardless of which host is the source, an ideal scenario that simplifies the process of the interaction or infection. The interaction or infection index per site was then obtained by summing each column in G. Finally, to spatialize this index vector, we assigned the longitude and latitude of every cell in the 1 degree grid to build a raster that portrays the index value over geographic space. This index was normalized and rescaled with cumulative and generalized logistic transformation using the R package bossMaps [19], allowing us to compare among different outputs (e.g., different sets of species or genera); this index is equivalent to a suitability index. We also converted the logistic output to a binary map, using a threshold of 0.5 (see Supplementary Material).
2.6. Relationship between Host Range, Host Richness and Interaction or Infection Spatial Index
To explore the relationship between host range (i.e., the number of host genera interacting with a beetle species) and the correlation between host richness (i.e., number of host genera per cell in the grid) and the interaction or infection index, we obtained the correlation coefficients rn between the interaction or infection index for each beetle species gn (n = 20 cases) and host richness S (rgn,S = corr(gn, S)). These correlation coefficients were then used to perform a linear regression with a negative exponential transformation of the host range (Equation 3). Host richness was estimated by for mij both for M1 and M2, respectively. Host range was obtained from for aij elements of I. All methods were implemented in the R package geotax available through GitHub3.
3. Results
Figure 1 shows the probability of a host plant genus sharing a beetle interaction determined by the phylogenetic distance from the source host using the coefficients of the logistic regression (Table 1). Particular cases are highlighted in the figure, in which the red dotted line corresponds to the case where all beetles are included in the analysis; three other cases were selected to show relationships in which the beetle corresponds to (1) a narrow host range and phylogenetically constrained species (Xyleborus xylographus), (2) an intermediate host range and phylogenetically constrained species (Xyleborus glabratus), and (3) a wide host range and phylogenetically dispersed species (Xylosandrus crassiusculus).
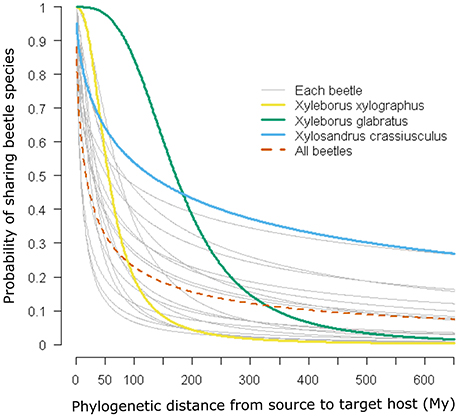
Figure 1. Phylogenetic signal and probability of host plant genera sharing beetle species. Curves are predicted from logistic regressions using the coefficients given in Table 1. Four relationships are highlighted: a narrow host range and phylogenetically constrained species (Xyleborus xylographus), a wide host range and phylogenetically constrained species (Xyleborus glabratus), a wide host range and phylogenetically dispersed species (Xylosandrus crassiusculus), and all beetle species together.
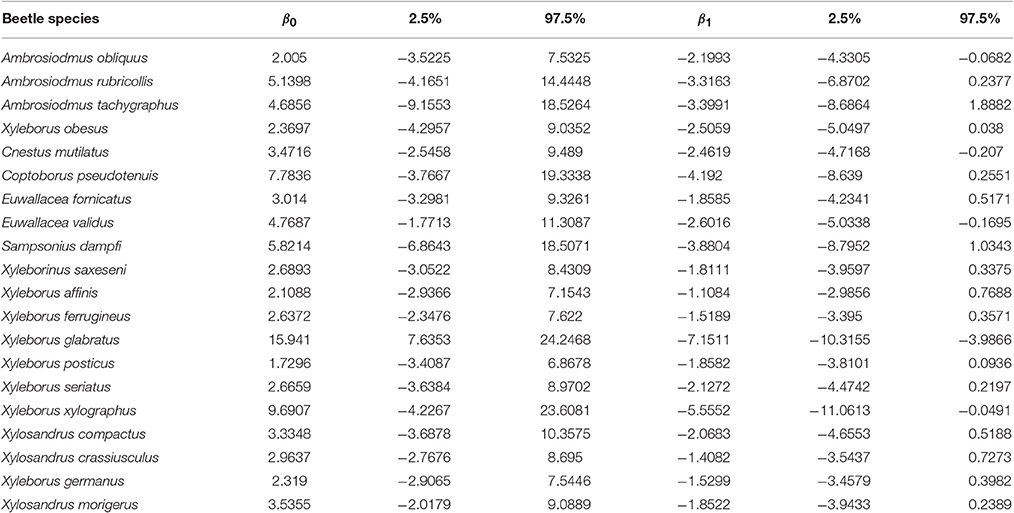
Table 1. Logistic regression coefficients and confidence intervals.
The geographic expression of the interaction or infection index in the case of all beetles pooled together derived from both M1 and M2 shows approximately the same pattern, although some differences in the pattern distribution are apparent depending on the particular host plant distribution matrix used (Figure 2). These maps indicate that the highest probability of interaction or infection occurs over large areas worldwide, with the highest intensity of this process occurring in parts of Neotropical America and the eastern and western coasts of North America, Central Europe, smaller portions of sub-Saharan Africa and Madagascar, Southeast Asia, and eastern and northern portions of Australia. These patterns corresponded in large part to the distribution of the 235 host genera worldwide. When the distribution of the index was mapped over the binary map, we observed a reduction in the distribution of the interaction or infection index (Figure S1).
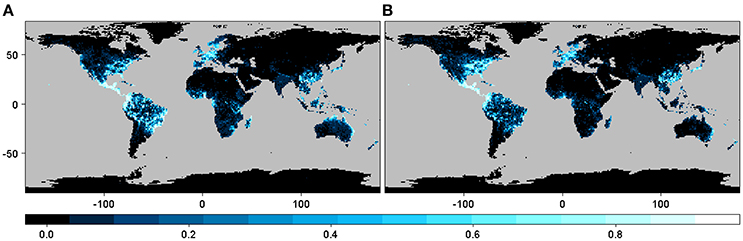
Figure 2. Spatial projection of the interaction or infection index summarized at 1-degree spatial resolution for the case with all of the beetles pooled together using GBIF occurrence information from (A) host plant genera derived from the list of host plant species in the bark beetles database (M1) and (B) host plant genera in the phylogenetic tree after obtaining the occurrences for each genus directly using the R package spocc (M2).
The geographic distribution of the interaction or infection index for the three particular cases of phylogenetic constraint and host range depicted different regions depending on the beetle species and host plant genera distribution matrix, although these differences were not so marked between M1 and M2 (Figure 3). In the narrow host range and phylogenetically constrained species (Xyleborus xylographus), the intensity of the interaction was highest in eastern North America, Central Europe, and parts of Southeast Asia. For the intermediate host range and phylogenetically constrained species (Xyleborus glabratus), highest intensity was in eastern North America, from the northern limit of the Neotropics through Central America, and in northern and eastern South America, as well as in eastern China, Southeast Asia, and eastern Australia. In the wide host range and phylogenetically dispersed species (Xylosandrus crassiusculus), the distribution of the interaction index intensity was similar to X. glabratus.
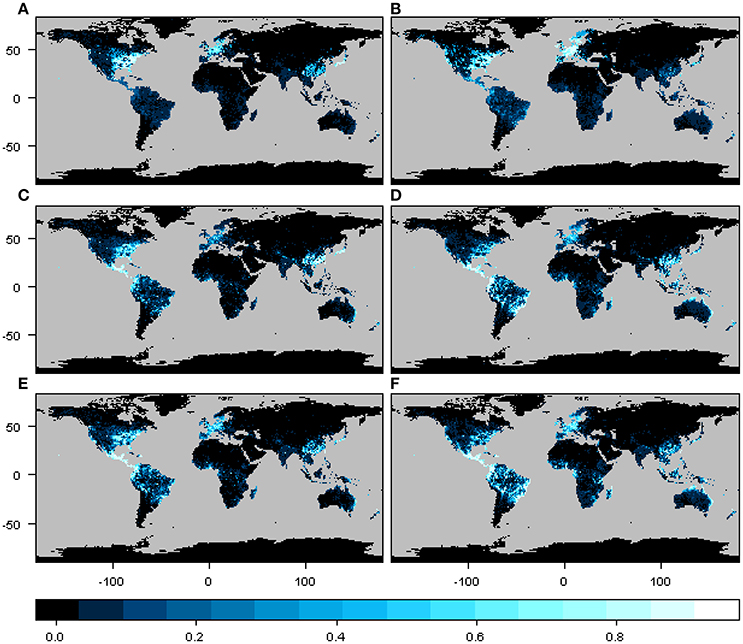
Figure 3. Spatial interaction or infection index for three cases of host range size and different levels of phylogenetic constraint. Maps in (A,C,E) correspond to the interaction or infection index for host plant genera from the original host-beetle database (M1), and maps in (B,D,F) correspond to the interaction or infection index for host plant genera from the phylogenetic tree (M2). The three cases correspond to a narrow host range and phylogenetically constrained species (Xyleborus xylographus), a wide host range vector and phylogenetically constrained species (Xyleborus glabratus) and a wide host range and phylogenetically dispersed species (Xylosandrus crassiusculus). Maps summarize information at 1-degree spatial resolution.
We observed a linear relationship (Equation 3) between the transformed host range size H and the correlation coefficient r between the interaction or infection index and host richness. The values to calculate the relationship are shown in Table 2. This pattern was constant when the correlation was conducted for both host plant genera matrices M1 and M2 (Figure 4). This result showed that, with a small number of interacting hosts, the model had a lower correlation with host richness; however, when the host range was large, the correlation with host richness grew asymptotically to one. It is thus possible to characterize quantitatively the nature of the interaction (according to host range and phylogenetic constraint) in relation to a set of pests or interacting agents and their hosts.
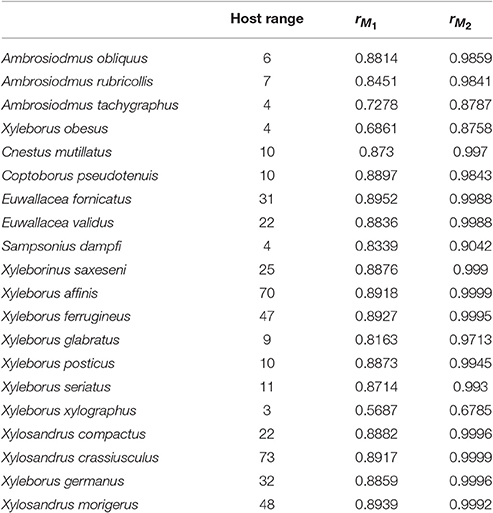
Table 2. Host range for each beetle species and correlation coefficients between host plant genera richness and the interaction or infection index from M1 and M2.
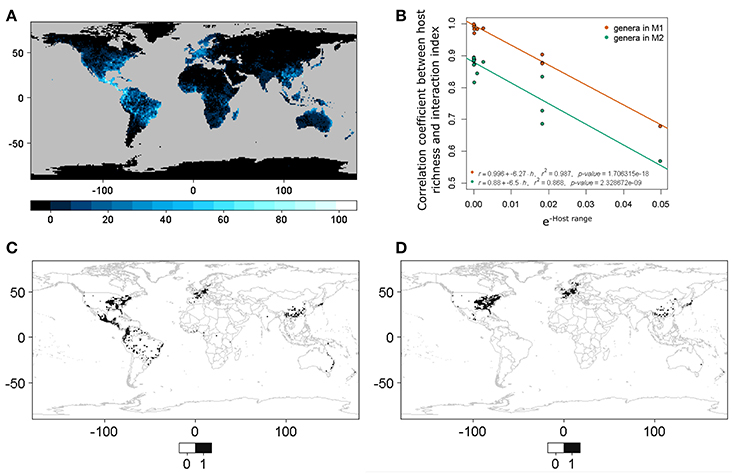
Figure 4. (A) World host richness. This corresponds to host plant genera in M1. (B) Linear model between host range (negative exponential transformation, also see Equation 3; a small value implies a larger host range and vice versa) and the correlation coefficients between host richness and the interaction or infection spatial index. M1 corresponds to host plant genera derived from the list of host plant species in the bark beetles database and M2 to host plant genera in the phylogenetic tree after obtaining the occurrences for each genera directly using the R package spocc. (C) Binary predictive model for Xylosandrus crassiusculus, a generalist bark beetle species. (D) Binary predictive model for Xyleborus xylographus, a specialist bark beetle species. Note that cases (C,D) correspond to extremes in (B), and that (C) has a higher correlation with species host richness than (D).
4. Discussion
Prediction of biological interactions and invasions is a challenge. From a phytosanitary perspective, meeting this challenge would yield the potential to anticipate the ecological and evolutionary dynamics of species and the potential for alteration of native or cultivated ecosystems. Here, we show that combining information from the ecological and phylogenetic relationships of pest species and geographic distributions of known and potential hosts offers an opportunity to map risk of problems even before a new pest is recognized. This process could also be used to anticipate the potential for species invasions [20] or outbreaks of disease related to novel pathogens [21].
Development of interaction or infection predictions involves two main steps: The first is to estimate the likelihood of sharing a pest from simple linear regression models sensu [6]. The second is to use that likelihood to predict the geographic patterns of interactions, considering the distribution of known hosts of the species, or those that could potentially interact with the species, given their phylogenetic proximity to the interacting agents (i.e., vectors, pests, etc.). The first step of this process allows estimation of the probability of sharing a host, considering different levels of phylogenetic proximity among hosts and host range size. This result is therefore very informative from an ecological and evolutionary perspective in terms of evaluation of patterns of infection [9]. The second step projects the likelihood of interaction over geographic space, presenting spatially explicit predictions of the interaction between the agents and their hosts.
While we know of no previous attempt to represent this combination of factors geographically, some previous efforts to combine ecological, phylogenetic, and geographic information have been made. For example, Leibold et al. [7] coded phylogenetic nodes per site to obtain geographical patterns of the phylogenetic signal, but without considering the interaction process. Furthermore, in a recent study Morales-Castilla et al. [22] summarized different frameworks to infer biotic interactions from different biodiversity dimensions, one of which included a combination of phylogenetic information and species distributions. However, none of these frameworks transferred or projected the inferred interactions to geographic space. We suggest that this step is critical in anticipating potential interactions; from our analysis, we can conclude that the potential geographic distribution depends on, or is a consequence of, the number and type of interactions (i.e., according to host range and level of phylogenetic constraint; also see [23, 24]). An extension of this approach could be to improve single species distribution models [25] by including both the customary environmental information and species interactions. Moreover, since this index may be interpreted as a suitability index for predicting ecological interactions, it could also be interpreted as summarizing the parts of the realized ecological niche of the species related to the Eltonian ecological niche [26, 27]. Given the fact that biotic interactions are difficult to predict and quantify at geographic scales [28], this information is crucial for predicting the geographic distributions of species [29, 30].
In our example using ambrosia beetles, we detected at least three main cases of potential interaction between the likelihood of sharing an interaction and phylogenetic distance among hosts. These situations were the narrow host range and phylogenetically constrained species (Xyleborus xylographus), narrow to intermediate host range and phylogenetically constrained species (Xyleborus glabratus) and wide host range and phylogenetically dispersed species (Xylosandrus crassiusculus). These cases show a different pattern in terms of the likelihood of sharing an interaction, which is quantified from the coefficients of the linear regression (see Figure 1 and Table 1). Moreover, these individual patterns correspond well with the host range known for these beetle species from the original database. Prediction of these patterns had been suggested by Gilbert et al. [6] and other authors have found similar trends [31]; however, those authors did not show the geographic pattern of the relationship with actual or potential hosts.
We conclude from these single-species relationships that, to obtain a statistically significant linear regression model or a relationship with less uncertainty, it is necessary to have several observed interactions with different hosts or use quantitative impact data [32]. In our single-species examples, we excluded cases in which the beetles had two or fewer host plant species. In addition, the relationship pattern observed with all beetles pooled together was frequently different from that of single-species cases, thus suggesting that useful information exists at the single-species level that differs from that of the whole set of species. Interestingly, when we project the interaction or infection index for the single-species cases, it is clear that potential interaction with hosts depends largely on their geographic distribution and also that the differences in the predictions for the individual cases are not particularly marked. This outcome could be due to the fact that these beetle species are phylogenetically related and, in some cases, share host genera that have similar geographic distributions. However, we would expect this result to change for different taxonomic groups or sets of species.
Overall, the geographic distribution patterns of the interaction or infection index coincide with the distributions of host genera in both the native and invaded areas of the beetles. The most recently invaded areas for some of these species in North America (i.e., Xyleborus glabratus and Euwallacea sp.) coincide with a pattern of invasion with high intensity values for the interaction or infection index. Areas that are not yet invaded but where the plant host genera are present show high invasive potential, as predicted by other studies. For example, the vector of the fungus Raffaelea lauricola, Xyleborus glabratus which causes the Laurel Wilt Disease, has shown relatively fast expansion in eastern North America following its introduction from Asia in 2002 [33]. The interaction or infection index for this species predicted not only its native range in Asia, but also its currently invaded range in the United States. This species has advanced from Georgia to Texas in a period of 15 years, affecting species from the Lauraceae family and impacting native and cultivated plantations4. However, its invasive potential expands southwards to regions in Mexico, Central, and South America, where Lauraceae species are diverse and abundant, and where cultivated plantations of avocado (Persea americana) are also an economically important crop. Hence, the interaction or infection index appears to predict what is known about the current distribution for these species and can be a valuable tool for anticipating host ranges and areas with potential for invasion.
The fact that we observed a linear relationship between the host range size and the correlation between the interaction or infection index and host richness suggests that host range size and host diversities are important drivers of ecological and evolutionary interactions. Overall, there is a higher intensity of the interaction or infection index between beetles and hosts in more host-diverse regions. This pattern can be useful for interpretation and regionalization of the expected distribution of interactions, considering the diversity of hosts. However, an important difference exists in the results depending on the amount of information used (e.g., whether plant host genera are derived from M1 or M2). We suggest that host richness alone does not provide sufficiently good prediction and that converting the index to a binary map allows for improved delimitation of the areas at higher risk (e.g., Figure 4). This interaction or infection index projected in geographic space provides a manner by which to re-scale the process of infection using both host richness and phylogenetic distance. It is also important to consider that while there is currently more primary biodiversity information (i.e., information on species occurrences) available from which to address new questions from the perspective of biodiversity informatics, variation in both the availability and quality of data remains an important problem to be resolved [34].
In summary, the combination of different biodiversity dimensions is a necessary avenue by which to understand patterns and processes in biodiversity 4, 34, 35, 36. While further theoretical background is still necessary to understand the extent and limitations of combining phylogenetic and distributional information for anticipating biotic interactions, empirical evidence indicates that this tool is promising for confirming actual and vulnerable hosts. Implementation of this relationship in easy-to-use algorithms, such as we present here, represents a step forward toward evaluating risk in phytosanitary and biological invasion assessment, and in particular to project potential host-pest interactions over geographic space. This approach, however, would benefit from further fieldwork to test these models empirically [37]. We also expect that these implementations will be important for more quantitative approaches toward understanding ecological and evolutionary patterns and processes.
Author Contributions
ÁR-F obtained the data, developed the algorithms and implemented the analysis. AL-N conceived the idea and design of the analysis and both authors reviewed the data and outcomes, and wrote the manuscript.
Funding
ÁR-F received partial support from the Consejo Veracruzano de Investigación Científica y Desarrollo Tecnológico (COVEICYDET) 5th Young Talent 2016 award for the analysis presented here. This project was supported by Fondo Sectorial para la Investigación, el Desarrollo y la Innovación Tecnológica Forestal (2015-C01-265677).
Conflict of Interest Statement
The authors declare that the research was conducted in the absence of any commercial or financial relationships that could be construed as a potential conflict of interest.
Acknowledgments
We thank Enrique Ibarra-Laclette and Araceli Lamelas for making important suggestions on the assembly and quality of the phylogenies used in the analysis. Comments and suggestions from Greg Gilbert and Jorge Soberón were important for the development of this project. Reviews from the two assigned reviewers and from A. Townsend Peterson greatly improved the quality of the manuscript. Special thanks to Keith MacMillan for careful English revision.
Supplementary Material
The Supplementary Material for this article can be found online at: https://www.frontiersin.org/article/10.3389/fams.2017.00017/full#supplementary-material
Footnotes
2. ^http://www.barkbeetles.info/
3. ^https://github.com/alrobles/geotax
4. ^https://www.fs.usda.gov/Internet/FSE_DOCUMENTS/fseprd523011.pdf
References
1. Brasier CM. Rapid evolution of introduced plant pathogens via interspecific hybridization hybridization is leading to rapid evolution of Dutch elm disease and other fungal plant pathogens. Bioscience (2001) 51:123–33. doi: 10.1641/0006-3568(2001)051[0123:REOIPP]2.0.CO;2
2. Campbell FT. The science of risk assessment for phytosanitary regulation and the impact of changing trade regulations: the approach to phytosanitary safeguards mandated by the World Trade Organization may hinder adoption of the most efficient methods to protect ecosystems from introductions of invasive species. Bioscience (2001) 51:148–53. doi: 10.1641/0006-3568(2001)051[0148:TSORAF]2.0.CO;2
3. Magarey RD, Colunga-Garcia M, Fieselmann DA. Plant biosecurity in the United states: roles, responsibilities, and information needs. Bioscience (2009) 59:875. doi: 10.1525/bio.2009.59.10.9
4. Stevens RD, Gavilanez, MM. Dimensionality of community structure: phylogenetic, morphological and functional perspectives along biodiversity and environmental gradients. Ecography (2015). 38:861–75. doi: 10.1111/ecog.00847
5. Maclaurin J, Sterelny K. What is Biodiversity? Chicago, IL: University of Chicago Press (2008). doi: 10.7208/chicago/9780226500829.001.0001
6. Gilbert GS, Magarey R, Suiter K, Webb CO. Evolutionary tools for phytosanitary risk analysis: phylogenetic signal as a predictor of host range of plant pests and pathogens. Evol Appl. (2012) 5:869–78. doi: 10.1111/j.1752-4571.2012.00265.x
7. Leibold MA, Economo EP, Peres-Neto P. Metacommunity phylogenetics: separating the roles of environmental filters and historical biogeography. Ecol Lett. (2010) 13:1290–9. doi: 10.1111/j.1461-0248.2010.01523.x
8. Beck J, Böller M, Erhardt A, Schwanghart W. Spatial bias in the {GBIF} database and its effect on modeling species' geographic distributions. Ecol Inform. (2014) 19:10–5. doi: 10.1016/j.ecoinf.2013.11.002
9. Parker IM, Saunders M, Bontrager M, Weitz AP, Hendricks R, Magarey R, et al. Phylogenetic structure and host abundance drive disease pressure in communities. Nature (2015) 520:542–4. doi: 10.1038/nature14372
10. Wear, David N, Greis, John G (eds.). The Southern Forest Futures Project: Technical Report. General Technical Report SRS-GTR-178. Asheville, NC: USDA-Forest Service, Southern Research Station (2013). 542 p.
11. Gohli J, Kirkendall LR, Smith SM, Cognato AI, Hulcr J, Jordal BH. Biological factors contributing to bark and ambrosia beetle species diversification. Evolution (2017) 71:1258–72. doi: 10.1111/evo.13219
12. Chamberlain S, Szocs E. taxize - taxonomic search and retrieval in R. F1000Research (2013). Available online at: http://f1000research.com/articles/2-191/v2
13. GROUP TAP. An update of the Angiosperm Phylogeny Group classification for the orders and families of flowering plants: APG III. Botan J Linn Soc. (2009) 161:105–21. doi: 10.1111/j.1095-8339.2009.00996.x
14. Chamberlain S. brranching: Fetch ‘Phylogenies’ from Many Sources. (2016). R package version 0.2.0. Available online at: https://CRAN.R-project.org/package=brranching
15. Webb CO, Ackerly DD, Kembel SW. Phylocom: software for the analysis of phylogenetic community structure and trait evolution. Bioinformatics (2008) 24:2098. doi: 10.1093/bioinformatics/btn358
16. Wikström N, Savolainen V, Chase MW. Evolution of the angiosperms: calibrating the family tree. Proc R Soc Lond B Biol Sci. (2001) 268:2211–20. doi: 10.1098/rspb.2001.1782
17. Paradis E, Claude J, Strimmer K. APE: analyses of phylogenetics and evolution in R language. Bioinformatics (2004) 20:289–90. doi: 10.1093/bioinformatics/btg412
18. Chamberlain S. spocc: Interface to Species Occurrence Data Sources. (2016). R package version 0.5.4. Available online at: https://CRAN.R-project.org/package=spocc
19. Merow C, Wilson AM, Jetz W. Integrating occurrence data and expert maps for improved species range predictions. Glob Ecol Biogeogr. (2017) 26:243–58. doi: 10.1111/geb.12539
20. Worner S, Gevrey M. Modelling global insect pest species assemblages to determine risk of invasion. J Appl Ecol. (2006) 43:858–67. doi: 10.1111/j.1365-2664.2006.01202.x
21. Poon L, Chu D, Chan K, Wong O, Ellis T, Leung Y, et al. Identification of a novel coronavirus in bats. J Virol. (2005) 79:2001–9. doi: 10.1128/JVI.79.4.2001-2009.2005
22. Morales-Castilla I, Matias MG, Gravel D, Araújo MB. Inferring biotic interactions from proxies. Trends Ecol Evol. (2015) 30:347–56. doi: 10.1016/j.tree.2015.03.014
23. Villalobos F, Rangel TF, Diniz-Filho JAF. Phylogenetic fields of species: cross-species patterns of phylogenetic structure and geographical coexistence. Proc R Soc B (2013) 280:20122570. doi: 10.1098/rspb.2012.2570
24. Huang S, Bininda-Emonds OR, Stephens PR, Gittleman JL, Altizer S. Phylogenetically related and ecologically similar carnivores harbour similar parasite assemblages. J Anim Ecol. (2014) 83:671–80. doi: 10.1111/1365-2656.12160
25. Morales-Castilla I, Davies TJ, Pearse WD, Peres-Neto P. Combining phylogeny and co-occurrence to improve single species distribution models. Glob Ecol Biogeogr. (2017) 26:740–52. doi: 10.1111/geb.12580
26. Hutchinson GE. Cold spring harbor symposium on quantitative biology. Concluding Remarks (1957) 22:415–27.
27. Soberón J. Grinnellian and Eltonian niches and geographic distributions of species. Ecol Lett. (2007) 10:1115–23. doi: 10.1111/j.1461-0248.2007.01107.x
28. Peterson AT, Soberón J, Pearson R, Anderson R, Martínez-Meyer E, Nakamura M, et al. Ecological Niches and Geographic Distributions (MPB-49). Princeton, NJ: Princeton University Press (2011).
29. Anderson RP. When and how should biotic interactions be considered in models of species niches and distributions? J Biogeogr. (2017) 44:8–17. doi: 10.1111/jbi.12825
30. Wisz MS, Pottier J, Kissling WD, Pellissier L, Lenoir J, Damgaard CF, et al. The role of biotic interactions in shaping distributions and realised assemblages of species: implications for species distribution modelling. Biol Rev. (2013) 88:15–30. doi: 10.1111/j.1469-185X.2012.00235.x
31. Cooper N, Griffin R, Franz M, Omotayo M, Nunn CL. Phylogenetic host specificity and understanding parasite sharing in primates. Ecol Lett. (2012) 15:1370–7. doi: 10.1111/j.1461-0248.2012.01858.x
32. Gilbert GS, Briggs HM, Magarey R. The impact of plant enemies shows a phylogenetic signal. PLoS ONE (2015) 10:e0123758. doi: 10.1371/journal.pone.0123758
33. Fraedrich S, Harrington T, Rabaglia R, Ulyshen M, Mayfield Iii A, Hanula J, et al. A fungal symbiont of the redbay ambrosia beetle causes a lethal wilt in redbay and other Lauraceae in the southeastern United States. Plant Dis. (2008) 92:215–24. doi: 10.1094/PDIS-92-2-0215
34. Soberón J, Peterson T. Biodiversity informatics: managing and applying primary biodiversity data. Philos Trans R Soc Lond B Biol Sci. (2004) 359:689–98. doi: 10.1098/rstb.2003.1439
35. Krishtalka L, Humphrey PS. Can natural history museums capture the future? Bioscience (2000) 50:611–7. doi: 10.1641/0006-3568(2000)050[0611:CNHMCT]2.0.CO;2
36. Stephens PR, Altizer S, Smith KF, Alonso Aguirre A, Brown JH, Budischak SA, et al. The macroecology of infectious diseases: a new perspective on global-scale drivers of pathogen distributions and impacts. Ecol Lett. (2016) 19:1159–71. doi: 10.1111/ele.12644
Keywords: ambrosia beetle, biological invasions, biotic interaction, host range, logistic regression, phylogenetic distance, phytosanitary risk assessment
Citation: Robles-Fernández ÁL and Lira-Noriega A (2017) Combining Phylogenetic and Occurrence Information for Risk Assessment of Pest and Pathogen Interactions with Host Plants. Front. Appl. Math. Stat. 3:17. doi: 10.3389/fams.2017.00017
Received: 08 May 2017; Accepted: 09 August 2017;
Published: 29 August 2017.
Edited by:
Stelios Katsanevakis, University of the Aegean, GreeceReviewed by:
Roger D. Magarey, North Carolina State University, United StatesHelen E. Roy, Centre for Ecology and Hydrology, United Kingdom
Copyright © 2017 Robles-Fernández and Lira-Noriega. This is an open-access article distributed under the terms of the Creative Commons Attribution License (CC BY). The use, distribution or reproduction in other forums is permitted, provided the original author(s) or licensor are credited and that the original publication in this journal is cited, in accordance with accepted academic practice. No use, distribution or reproduction is permitted which does not comply with these terms.
*Correspondence: Andrés Lira-Noriega, aliranoriega@gmail.com