A Case Study of Forecasted Earnings Acceleration and Stock Selection in Global and Emerging Stock Markets
 John Guerard
 Anureet Saxena
- McKinley Capital Management, LLC., Anchorage, AK, United States
The allocation of scarce economic resources so as to maximize societal good is at the very core of human economic development. The key contribution of Markowitz [1] was to view this age-old activity in a scientifically rigorous manner, and bring three key elements to the forefront, namely, risk, return and correlations. Since the publication of Markowitz' seminal paper, investment professionals have expensed significant resources in identifying, understanding, and monetizing new sources of uncorrelated returns. This paper moves forward that narrative by focusing on Emerging Markets (EM) and demonstrating the effectiveness of earnings acceleration factors in building significantly better mean-variance optimized portfolios.
Introduction
The allocation of scarce economic resources so as to maximize societal good is at the very core of human economic development. The key contribution of Markowitz [1] was to view this age-old activity in a scientifically rigorous manner, and bring three key elements to the forefront, namely, risk, return, and correlations. Since the publication of Markowitz' seminal paper, investment professionals have expensed significant resources in identifying, understanding, and monetizing new sources of uncorrelated returns. This paper moves forward that narrative by focusing on Emerging Markets (EM) and demonstrating the effectiveness of earnings acceleration factors in building significantly better mean-variance optimized portfolios.
The history of quantitative portfolio management can be divided into two key areas, namely, quest for better return drivers and innovation in managing the risks associated with those drivers. The quest for better drivers can be through identification of new risk factors (for example Fama-French risk factors), market anomalies (for example, seasonal anomalies), behavioral anomalies (over/under reaction hypothesis, anchoring, etc.), or technical anomalies (momentum). The reader is referred to Dimson [2] and Levy [3]. All of these factors continue to be prevalent in the EM space; furthermore, given the relative inefficiency of EM asset classes, the returns to these factors tend to be higher and also more volatile as compared to the developed markets.
There has been tremendous progress in our ability to manage portfolio risks in the past several decades. These includes development of technologies to build factor risk models, reliable estimators of covariance matrix that are robust to presence of outliers, and better understanding of factor alignment problems (FAP). While some of these factors continue to be relevant in managing EM portfolios others assume even more significance. For instance, the risk landscape for EM securities tends to be far more complex and dynamic than the one for developed market securities. Among other things, this implies that a static menu of risk factors as assumed by fundamental risk models is often inadequate to capture the entire spectrum of systematic risk factors that befall on EM securities. Consequently, statistical risk models with their dynamic selection of risk factors tend to perform marginally better in managing EM portfolios (see section Empirical Evidence on the Risk-Return Trade-Off).
The rest of this paper is organized as follows. In section Why Emerging Markets?, we revisit some of the compelling reasons to invest in securities with exposure to EM; we highlight of the fundamental reasons for diversification benefits that accrue by virtue of EM exposure. Section A Review Fundamental Variables and Regression-Based Expected Returns Modeling presents our security selection model. In section Constructing Mean-Variance Efficient Portfolios, we discuss techniques to transform the security selection model into an investable portfolio drawing heavily on Markowtiz' mean-variance optimization framework. Section Empirical Evidence on the Risk-Return Trade-Off presents the computational results, and we conclude the paper by discussing applied investment research implications of our results in section Conclusions and Applied Investment Research Implications.
Why Emerging Markets?
The allocation of scarce economic resources so as to maximize societal good is at the very core of human economic development. The key contribution of Markowitz [1] was to view this age-old activity in a scientifically rigorous manner, and bring three key elements to the forefront, namely, risk, return, and correlations. Next, we examine EM in light of these three statistical characteristics.
Asset prices and fundamental characteristics of the underlying securities are inextricably linked together in the long term. Among other things, this implies that the search of uncorrelated sources of returns eventually boils to finding securities with uncorrelated fundamentals. EM securities offer one of the most compelling example of securities with such uncorrelated fundamental characteristics.
For instance, consider the suite of countries included in the MSCI EM index. Most of these countries did not have a thriving and robust capital market mechanism in place until a few years back. As Mobius notes in his widely cited book [2], when he visited the Jakarta Exchange trading hall prior to the liberalization measures of the Indonesian Government, just a few individuals could be seen holding a desultory bargaining session for half an hour each day; in fact, he noticed a gentleman taking an afternoon nap on his table. This is a far cry from the explosive trading activity that characterizes the Indonesian markets of today; the same can be said for virtually all other EM countries.
The landscape of securities listed on public EM exchanges has changed rapidly both in the number of such securities and their overall market capitalization. This growth can be traced to the broad adoption of liberalization measures among the EM countries, evolving faith in the free market mechanism, and a trend toward privatization of economic resources that have remained captive and unutilized under the aegis of government control for many years. As these resources get restructured to become profit oriented, they will have the unique ability to capitalize technological advances in the western world, thereby leap frogging several stages of technological evolution. For example, consider the telecommunication sector. The most remote and inaccessible areas in EM countries can be connected via the wireless technology thereby completely circumventing the need to wiring these areas to the central hubs, an expensive and time-consuming activity. This productivity premium embodies risk-return-correlation characteristics to EM firms that is distinct from their developed world counterparts.
These changes have happened in the past few decades, and represent an economic evolution that is fundamentally unrelated to the evolution of markets in the developed world thereby representing an organic differentiation between these two asset classes. As a corollary, it follows that the lack of correlation between the developed and EM markets is not a statistical quirk; instead, it is based on the underlying economic and political realities in different parts of the world that is likely to sustain until they catch up with each other.
If the productivity premium represents the growth engine for EM firms, then that engine is fueled by the so-called demographic dividend. While the population growth slows in the developed world, EM countries are experiencing above average growth rates powered by the enhancements in medical technologies leading to lower infant mortality rates, sustained fertility rates and longer lifespans. As consumption patterns in these counties evolve beyond the basic needs of food, health, and security, they will unleash a demand cycle spanning automobiles, cosmetics, entertainment, tourism, electronics, and other consumer products creating a virtuous cycle that will benefit any firm with exposure to EM consumption. Once again, these demand patterns are going to be very distinct and largely uncorrelated with the demand patterns in the developed markets thereby adding credence to the sustainability of diversification benefits.
If there are unique fundamental return drivers in the EM world, they are also accompanied with risk characteristics that are truly unique as well. These risks can be broadly classified into continuous and discrete risks. Examples of continuous risks include inherent volatility of consumption patterns, over heating of equity markets leading to equity market bubbles, over investment in particular sectors such as real estate, lack of appropriate corporate governance structures leading to moral hazard issues, etc. Discrete risks include political risk, government overreaching, financial or fiscal policy over reach, environmental disasters, etc. Fortunately, evolution in quantitative approaches to investing offer ways to manage both kinds of risks.
Continuous risk characteristics, by their very definition, evolve gradually over time. Quantitative risk models based on backward looking data are therefore quite adequate to capture and mitigate these risk factors. Notably, given the complexities of the underlying economic processes, EM markets can often be exposed to latent risk factors that are not appropriately captured by risk models that operate with a static suite of risk factors. For instance, a fundamental risk model with a statically specified suite of risk factors can have risk “blind-spots” in periods of market stress. Statistical risk models, on the other hand, operate with a dynamic selection of risk factors that are better attuned to capturing transitory risk factors. This partly explains the better performance of statistical risk models vis-à-vis fundamental risk models (see section Constructing Mean-Variance Efficient Portfolios). Discrete risks are best addressed through portfolio diversification techniques including country and asset bounds, and monitoring marginal contribution to risks from various risk factors.
Bekaert and Harvey [3] and Harvey [4] examined the risk-return characteristics of EM, reporting higher returns relative to risk than in developed markets. Among other things, Harvey [4] studied the unconditional risk characteristics of EM securities, investigated the tradeoffs of adding them to a portfolio of global securities, and documented the diversification benefits, higher volatility of EM asset class notwithstanding. Harvey also established the significance of local information variables in determining the expected returns of EM securities, as compared to the global information variables that tend to be more prominent in developed market studies. The MSCI Barra researchers in 2008 produced a 20-year perspective on EM, noting the additions of Malaysia, Brazil, South Africa, Thailand, Taiwan, and India had the largest additions in the EM market capitalization, 1988-2008. EM countries substantially outperformed the US, Europe, Japan, and the World for 1988-1992, but did not do so for the 2002-2007 period, producing virtually identical return relative to risk statistics. Have EM continued to outperform developed markets? More importantly, have investible stocks in EM produced a great return-risk ratio than developed country stocks? Secondly, and more importantly for active managers, are excess returns higher in EM given their relative illiquidity? In this case, we use two sets of expected returns, the forecasted earnings acceleration variable, CTEF, and the ten-factor global expected returns, GLER, variable discussed in Guerard et al. [5].
A Review Fundamental Variables and Regression-Based Expected Returns Modeling
Stock selection and security analysis is not new avenue of research. Graham and Dodd [6] and Williams [7] developed the framework for stock analysis well over 75 years ago, formulating the low price-to-earnings multiple, P/E, strategy, in which no investor should purchase a stock with a P/E that exceeded 50% more than the market P/E. Basu [8], Dremen [9, 10], and Guerard et al. [5] documented the continued significance of the Low P/E effect. In 1991, the Markowitz GPRD tested a set of 16 financial variables, including the low P/E model, and composite models for stock selection models over a 15-year period in Japan and the U.S1. The Markowitz team used relative variables, defined as the ratio of the absolute fundamental variable ratios divided by the 60-month averages of the fundamental variable ratios. The GPRD test found that: (1) the outlier and multicollinearity-adjusted, denoted as WLRR, regression-based expected returns outperform equally-weighted models or ordinary least squares-weighted expected returns; (2) the risk model based on historical daily returns is an effective input to mean-variance optimization analysis; (3) optimization with turnover constraint enhanced portfolio returns. That is, limiting quarterly turnover to 10% produced an efficient frontier that was higher than the 20% turnover curve, which was higher than the 30 and 40% turnover constraint efficient frontiers; and (4) survivor-biased free stock universes were important, but not necessary for model development; and (5) modeling results must be tested using a data mining corrections test. The Beaton and Tukey [14] bisquare regression technique identified outliers and re-weighted the data so that re-weighted data could be analyzed with latent root regression, LRR. The bisquare procedure is one of many robust weighting schemes reported in [15]. Latent root regression, see Gunst and Mason [16, 17], addressed the correlation among independent variables, multicollinearity, and identified the important variables (best subset) in the multiple regression analysis. The authors have experimented on several occasions to test the adequacy of linear regression, despite the fact the Beaton-Tukey bisquare is a non-linear process.2 The Bloch et al. [13] article presented initial Data Mining Corrections test results that were reported in the Markowitz and Xu [18] data mining study. Markowitz and Xu put forth several testable models for the presence of data mining3. The Markowitz GPRD team concentrated on efficient frontier estimations and the Data Mining Corrections tests for statistical significance.
Guerard et al. [19] updated and expanded the U.S. stock selection model in Bloch et al. [13] to include forecasted earnings acceleration and price momentum variables4. Guerard et al. [19] referred to the stock selection model as a United States Expected Returns (USER) Model. The 10-factor stock selection model estimated in this study is:
where:
USER and GLER are the “Public Forms” of the McKinley Capital Management models for U.S. and Global stocks, respectively. For the sake of illustration, Figure 1 reports the time series of the regression coefficients for two variables, BP and CTEF for EM securities.
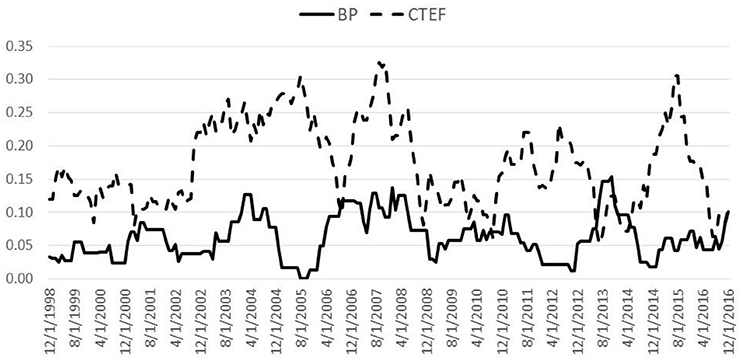
Figure 1. Time series of regression coefficients on BP and CTEF variables (EM securities).
Guerard et al. [24] applied the USER Model to a large set of global stocks for the 1997-2011 time period and reported highly statistically significant stock selection and excess returns. Guerard et al. [24] referred to the global version of the 10-factor expected returns model as the GLER Model5. In fact, stockselection in global markets exceeded stock selection in the U.S., holding constant the model6.
The normalization of at takes two steps. First we set non-positive and non-statistical significant components to be zero. Second, the remaining positive significant components are rescaled so that they add up to 1. The 12-month smoothing is consistent with the four-quarter smoothing in Bloch et al. [13]. While EP and BP variables are significant in explaining returns, the majority of the forecast performance is attributable to other model variables, namely the relative earnings-to-price, relative cash-to-price, relative sales-to-price, price momentum, and earnings forecast variables. The weighting results are extremely consistent with McKinley Capital Management being a Global Growth specialist. The CTEF and PM variables accounted for 40% of the weights in the GLER Model7. The GLER model is very similar to the work by Bob Haugen8.
Practitioners on Wall Street test a very large number of factors or models. We test 36 variables or composite models in this analysis, many of which are not statistically significant but are tested to reflect what is discussed in industrial publications, see Subramanian et al. [34]. Subramanian and her team test ~70 variables in the U.S. every quarter. The authors regularly review the Subramanian et al. [34] work and variables. Many of our additional variables, beyond the set of 16 variables in Bloch et al. [13] tested in this study are suggested and tested in Subramanian et al. [34].
The reader is referred to Levy [36] and Levy [37], Elton et al. [38], and Harvey and Liu [39, 40], Harvey et al. [41], Harvey [42] for more comprehensive discussions of investment anomalies. We end this section by briefly discussing an interesting evolution in EM data sets that has improved our ability to monetize traditional market anomalies in the EM space. Analyst forecasts, inarguably, play a very important role in any quantitative process. Besides being an important forward-looking data set, they provide visibility on the most important fundamental characteristic of any firm, namely, earnings. Given the inherent uncertainty in determining forward looking estimates, a higher analyst coverage is naturally desirable. For historical reasons, EM securities have had less than satisfactory analyst coverage that often limited our ability to apply traditional quantitative factors to EM markets. With increased focus on EM markets, favorable fund flows and higher trading activity, analyst coverage is improving in EM markets (see Figure 2).
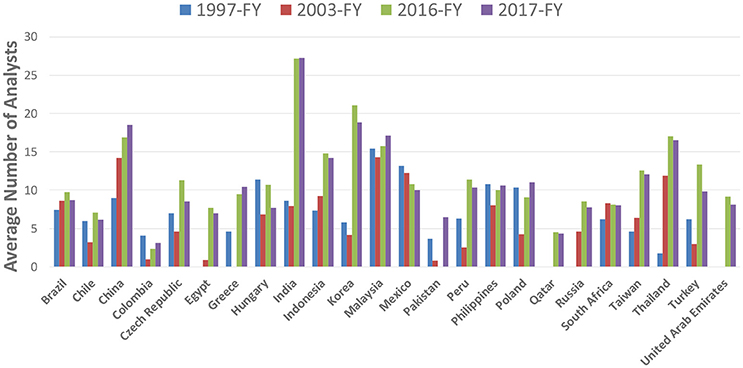
Figure 2. Evolution of analyst coverage for EM securities (by country).
Constructing Mean-Variance Efficient Portfolios
The portfolio expected return, denoted by E(RP), is calculated by taking the sum of the security weight multiplied by their respective expected return:
The portfolio risk (variance) is the sum of the weighted securities' covariances:
where N is the number of candidate securities, wi is the weight for security i such that indicating that the portfolio is fully invested, and E(Ri) is the expected return for security i.
The modeling of variance and covariance can be done by factor model too. The total excess return (relative to risk free rate) for a multiple-factor model (MFM) in the Rosenberg methodology for security j, at time t, dropping the subscript t for time, may be written like this:
The non-factor, or asset-specific return on security j,, is the residual return of the security after removing the estimated impacts of the K factors. The term is the rate of return of factor “k”, which is independent of securities and affects the security's return through its exposure coefficient to β. The factors explained the security's risk best are not necessary the factors for expected return modeling. They may include country, industry, and style factors. One can use two sets of risk models, fundamental or statistical, risk models to estimate Equation (13)9. We use the Sungard APT risk model, which uses principal components in its estimation, in this analysis. The reader is referred to Guerard et al. [24] for evidence supporting the APT risk model and portfolio optimization techniques. An extensive review of factor risk models can be found in Connor et al. [50].
Markowitz [51] writes the general portfolio optimization objective function as
If the investor is more concerned about tracking a particular benchmark, the mean-variance optimization in Equation (5) can be reformulated as a mean-variance tracking error at risk (MVTaR) optimization:
where xb is the weight vector of the benchmark. The total tracking error can be decomposed into the systematic tracking error and the specific tracking error,
Portfolio construction and management can be implemented by determining the balance between portfolio systematic and specific tracking variances10. Constraints are an integral part of portfolios optimization construction process because the error in the estimation of expected return, and variances, and covariances.
Empirical Evidence on the Risk-Return Trade-Off
One can create optimized portfolios using index constituent stocks in the MSCI EM countries for the January 2003–December 2016 time period that outperform stocks in the Non-U.S., All Country World ex US stocks, XUS, see Table 1. We use Mean-Variance optimization with a 4% maximum weight, 8% monthly turnover, a 35 basis point threshold for stocks, the ITG transactions costs estimate of transactions costs, and the Axioma statistical model. The GL, XUS, and EM Mean-Variance (MV) Efficient Frontiers, showing the maximum returns for a given level of risk, or the lowest level of risk for a given level of return, are estimated for targeted tracking errors of 4, 6, and 8%. The MV CTEF and GLER portfolios produce statistically significant active (excess) returns and specific returns (stock selection) in GL, XUS, and EM portfolios. The GLER EM specific returns are slightly higher than the EM CTEF specific returns, see Table 1.
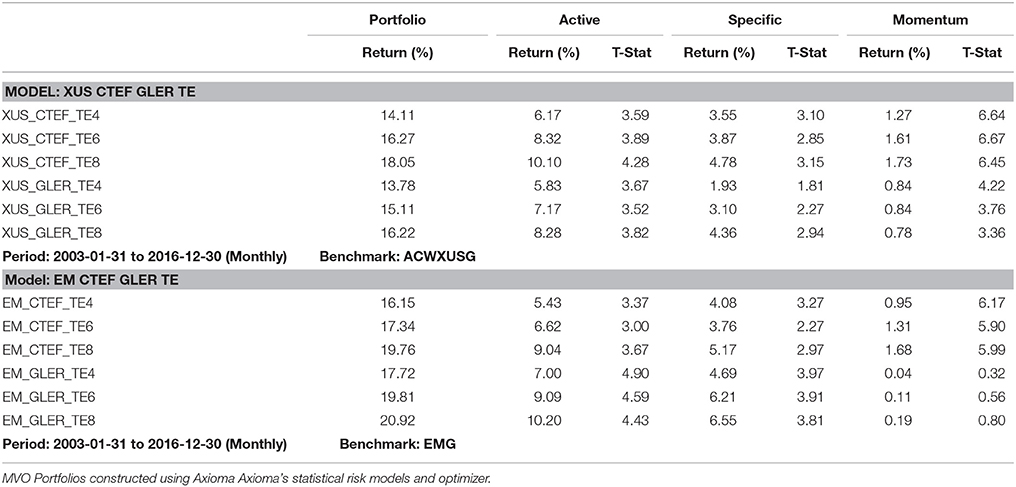
Table 1. Forecasted earnings acceleration and stock selection modeling in global, Non-US, and EM universes using MSCI Index Constituents-only.
The EM CTEF portfolios have statistically significant exposures to Momentum and Value, see Brown [54]. The EM Efficient Frontier portfolios dominate the XUS portfolios, particularly once the targeted tracking errors exceed 6%11. Why Emerging Market? The GLER Information Ratios and Sharpe Ratios are higher in EM than XUS universe, see Table 2. More importantly, Sharpe Ratios and Information Ratios rise as targeted tracking error increase, particularly in the EM universe.
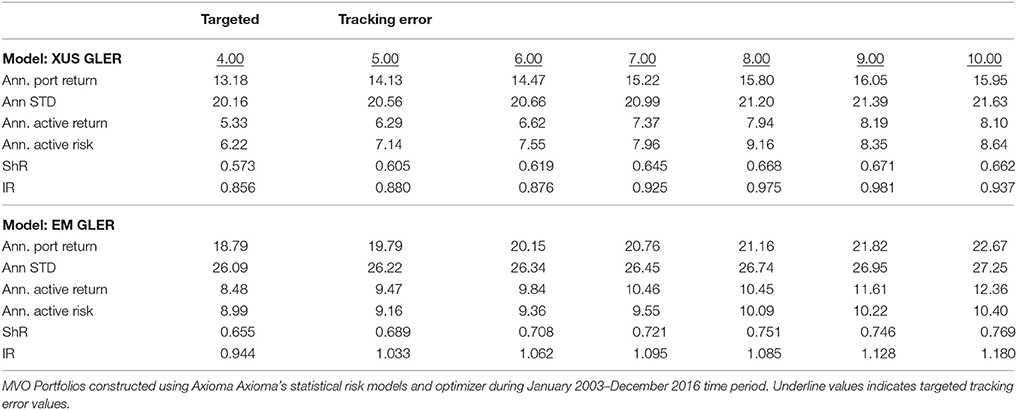
Table 2. Portfolio return, risk, and performance characteristics.
The estimated EM SML dominates the estimated XUS and GL SMLs, see Figure 3. Moreover, the EM SML graph of realized tracking errors and realized excess (active) returns is even more enlightening. Excess returns are much higher in EM than non-US and Global universes.
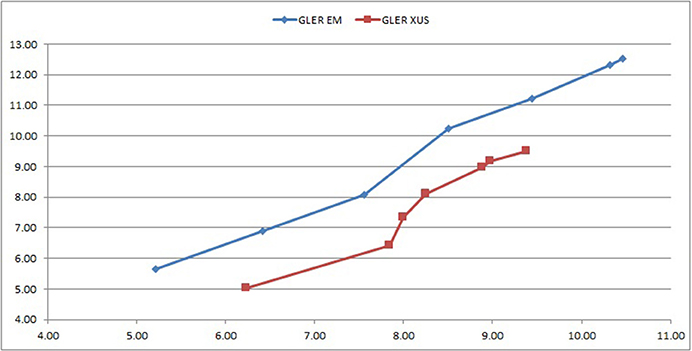
Figure 3. Targeted tracking errors and realized excess returns.
The EM portfolios produce higher Active Returns, Sharpe ratios, and Information Ratios with the Fundamental Risk Models, although both risk models are very effective, producing Information Ratios far exceeding 1.0012.
Conclusions and Applied Investment Research Implications
An investor who seeks to maximize the Geometric Mean, Sharpe Ratio, or Information Ratio, must consider EM stocks. An investor that seeks to be on the Efficient Frontier, should consider the use of a statistical risk and an the alpha alignment factor application. Higher targeted tracking errors are preferred to lower targeted tracking errors. An investor who maximizes the Geometric Mean maximizes terminal wealth Latane [56] and Markowitz [57, 58]. Given that investors eventually pass, investor should target 8% tracking errors, develop more a patience and less risk-aversion, and pass away wealthier. Perhaps their heirs expect nothing less.
Author Contributions
All authors listed have made a substantial, direct and intellectual contribution to the work, and approved it for publication.
Conflict of Interest Statement
JG and AS were employed by company McKinley Capital Management, LLC.
Footnotes
1. ^See Graham et al. [11], Graham [12], Dremen [9, 10], and Basu [8] for discussions of low price-to-earnings models and other fundamental models, such as book value, cash flow and sales. Bloch et al. [13] reported a set of ~270 simulations of GPRD United States and Japanese equity models. The models produced out-of-sample statistically significant excess returns in the portfolios. Sophisticated regression techniques not only enhanced in-sample F-statistics, but also enhanced the Geometric Means of out-of-sample portfolios. Haugen and Baker [20, 21] estimated models in the Graham and Dodd framework and substantiated the continuing effectiveness of fundamental variables.
2. ^Stone and Guerard used a response surface process to identify variables weights in the GPRD eight-factor model. Stone and Guerard [22] found that over 85% of the variables should use linear, not quadratic forms. Moreover, variable interactions did not enhance model estimation.
3. ^We (McKinley Capital Management) have reported DMC's model II test results on all analyses since 2005.
4. ^Guerard et al. [5] reported extensively on the effectiveness of CTEF, the MCM forecasted earnings acceleration variable, composed of Institutional Brokerage Estimate Services (I/B/E/S) forecasts, forecast revisions, and the direction of forecast revisions. Elton et al. [22] created and tested the I/B/E/S database. The price momentum analysis tested in the Guerard et al. [26]. USER and GLER analyses was based on the work of Jack Brush, summarized in [23].
5. ^Guerard et al. [24] estimated a Global Model, GLER, using Equation (1) and the FactSet database for global securities during the January 1999–December 2011 period. In the world of business, one does not access academic databases annually, or even quarterly. Most industry analysis uses FactSet database and the Thomson Financial (I/B/E/S) earnings forecasting database. Guerard et al. [24] and [25] estimated tracking error at risk portfolio (MVTaR) model for the 7,500 largest securities, in terms of market capitalization, for stocks Thomson Financial and FactSet databases, some 46,550 firms in December 2011, and 64,455 stocks in December 2013. In the Guerard et al. [5] earnings forecasting study, Guerard et al. used both APT and Axioma World-wide Statistical Risk Models. We use data only as it is known (or more exactly, our portfolios are tested out-of-sample).
6. ^[26] and Guerard et al. [27].
7. ^The CTEF and PM variable weights are large relive to the first eight factor eights. The relative variables are “growth” variables such that both the Markowitz model and GLER models plot in the growth boxes of the Zephyr style report. The first four factors of GLER are value factors.
8. ^Haugen [28] continued the treatment of the Graham and Dodd variables in his Modern Investment Theory. [29, 30] examined 12 of the most important factors in the U.S. equity markets and in Germany, France, Great Britain, and Japan. The book-to-price, earnings-to-price, sales-to-price, and cash flow-to-price variables were among the highest mean payoff variables in the respective countries. Haugen and Baker [31] published a paper in the Guerard volume to honor Harry Markowitz which updated their models and completely demolished the case for efficient markets, in the eyes of the primary author. Our analysis and the work of Haugen do not report evidence that is consistent with the work of Fama and French [32, 33, 35].
9. ^The first set is a fundamental risk model, such as the Axioma World-Wide Equity Risk Factor Model (AX-WW2.1), which seeks to forecast medium-horizon risk, or risk 3–6 months ahead. The Axioma Fundamental Risk Model uses nine style factors: exchange rate sensitivity, growth (historical earnings and sales growth), leverage (debt-to-assets), liquidity (one month trading volume divided by market capitalization), medium-term momentum (cumulative returns of the past year, excluding the previous month), short-term momentum (last month return), size (natural logarithm of issuer market capitalization), value (book-to-price and earnings-to-price ratios), and volatility (three months average of absolute returns divided by cross-sectional standard deviation). The Axioma fundamentally-based risk model evolved from the MSCI Barra risk model was developed in Rosenberg [43], Rosenberg and Marathe, [44] and thoroughly discussed in Rudd and Clasing [45] and Grinold and Kahn [46]. Statistically-based risk models developed in the works of Roll and Ross [47], Dhrymes et al. [48], Dhrymes et al. [48], and Guerard et al. [49]. The Axioma Statistical Risk Model, World-Wide Equity Risk Factor Model, AX-WW2.1, estimates 15 principal components to measure risk. See Guerard et al. [27] for a comparison of Axioma Fundamental and statistically based risk models. Guerard et al. [27] reported that the statistical model dominated the fundamental risk model in producing a higher set of returns for a given level of risk.
10. ^Guerard [52] reported the effectiveness of the Blin and Bender APT and Sungard APT systems in portfolio construction and management. Blin et al. [53] used a 20-factor beta model of variance and covariances based on 3.5 years of weekly stock returns data. The Blin and Bender Arbitrage Pricing Theory (APT) model followed the Roll factor theory, but Blin and Bender estimated at least 20 orthogonal factors. The trade-off curves in Guerard [52] were created by varying lambda, a measure of risk-aversion, as a portfolio decision variable. As lambda rises, the expected return of the portfolio rises and the number securities in the portfolio declines. The Guerard [52] application minimized risk in terms of a “tracking error at risk” concept in which portfolio risk is three parts systematic tracking variance and one part specific tracking variance. The reader is referred to Blin et al. [53] and Guerard [52] for more explanation of the multi-factor risk model and optimization process.
11. ^We used 150 basis points of transactions costs, each way, in the simulation. If we used Axioma optimization using the ITG cost curves, available for the January 2002–December 2013 period, we find ITG-estimated transactions costs of 108 basis points using a 20% of volume cost. The Axioma EAWTaR2 portfolio had an assumed starting size of $500 million in 2002 that grew to $3 billion by December 2013; outperforming the AWCG benchmark by 260 basis points with an IR of 0.43, a Sharpe Ratio of 0.54, and an active risk of 6.03%. The Axioma optimized portfolio with the ITG cost curves used the same portfolio simulation conditions. See Borkovec et al. [55] for a presentation of the ITG approach to portfolio implementation. We have used a conservation assumption of transactions cost in this analysis.
12. ^The real-time MCM EM portfolio, producing 434 basis points of Active Returns, annualized, and an IR of 1.00 with the Axioma Fundamental Risk Model, is ranked in the top decile of its peers since its March 31, 2011 inception. See Guerard and Chettiappan.“Active Quant: Applied Investment Research in Emerging Markets”, Journal of Investing, forthcoming.
References
2. Dimson E. Stock Market Anomalies. Cambridge: Cambridge University Press (1988).
7. Guerard JB Jr, Markowitz HM, Xu G. Earnings forecasting in a global stock selection model and efficient portfolio construction and management. Int J Forecast. (2015) 31:550–60. doi: 10.1016/j.ijforecast.2014.10.003
8. Graham B, Dodd D. Security Analysis: Principles and Technique. New York, NY: McGraw-Hill Book Company (1934).
10. Basu S. Investment performance of common stocks in relations to their price earnings ratios: a test of market efficiency. J Finance (1977) 32:663–82.
12. Dremen, D. Contrarian Investment Strategies: The Next Generation. New York, NY: Simon & Schuster (1998).
13. Graham B, Dodd D, Cottle S. Security Analysis: Principles and Technique. 4th ed. New York, NY: McGraw-Hill Book Company (1962).
15. Bloch M, Guerard JB Jr, Markowitz HM, Todd P, Xu G-L. A Comparison of some aspects of the U.S. and Japanese equity markets. Jpn World Econ. (1993) 5:3–26.
16. Haugen RA, Baker N. Communality in the determinants of expected results. J Finan Econ. (1996) 41:401–40. doi: 10.1016/0304-405X(95)00868-F
17. Haugen R, Baker N. Case closed. In: Guerard JB, editor. The Handbook of Portfolio Construction: Contemporary Applications of Markowitz Techniques. New York, NY: Springer (2010). doi: 10.1007/978-0-387-77439-8_23
18. Beaton AE, Tukey JW. The fitting of power series, meaning polynomials, illustrated on bank-spectroscopic data. Technometrics (1974) 16:147–85.
19. Andrews DF, Bickel PJ, Hampel FR, Huber PJ, Rogers WH, Tukey JW. Robust Estimates of Location. Princeton, NJ: Princeton University Press (1972).
20. Gunst RF, Webster JT, Mason RL. A comparison of least squares and latent root regression estimators. Technometrics (1976) 18:75–83. doi: 10.2307/1267919
21. Gunst RF, Mason RL. Regression Analysis and its Application. New York, NY: Marcel Dekker, Inc. (1980).
22. Stone BK, Guerard JB Jr. Methodologies for isolating and assessing potential portfolio perfmmance of stock return forecast models with an illustration. In: Guerard JB, editor. The Handbook of Portfolio Construction: Contemporary Applications of Markowitz Techniques. New York, NY: Springer (2010). doi: 10.1007/978-0-387-77439-8_10
24. Guerard JB Jr, Xu G, Gultekin MN. Investing with momentum: the past, present, and future. J Invest. (2012) 21:68–80. doi: 10.3905/joi.2012.21.1.068
26. Guerard JB Jr, Gultekin M, Stone, BK. The role of fundamental data and analysts earnings breadth, forecasts, and revisions in the creation of efficient portfolios. vol. 15. In Chen A, editor. Research in Finance. Greenwich, CT: JAI Press (1997) p. 69–92.
28. Guerard JB Jr, Rachev RT, Shao B. Efficient Global portfolios: big data and investment universes. IBM J Res Dev. (2013) 57:11:1–11:11.
30. Deng S. and Min X. Applied optimization in global efficient portfolio construction using earnings forecasting. J Invest. (2013) 22:104–14. doi: 10.3905/joi.2013.22.4.104
31. Guerard JB Jr, Deng S, Gillam RA, Markowitz H, Xu G. Investing in Global Equity Markets with Particular Emphasis on Chinese Stocks. SSRN. Avaiable online at: https://ssrn.com/abstract=2744304 (2016).
33. Haugen RA, Baker N. Communality in the determinants of expected results. J Financ Econ. (1996) 41:401–40.
35. Haugen R, Baker, N. Case closed. In: Guerard JB Jr, editor. The Handbook of Portfolio Construction: Contemporary Applications of Markowitz Techniques. New York, NY: Springer (2010). p. 601–20.
36. Fama EF, French KR. Cross-sectional variation in expected stock returns. J Finance (1992) 47:427–65.
37. Fama EF, French KR. Size and the book-to-market factors in earnings and returns. J Finance (1995) 50:131–55.
39. Subramanian S, Suzuki D, Makedon A, Hall J, Pouey M, Wang B. A PM's Guide to Stock Picking. New York, NY: Bauk of America MetTill Lynch (2015).
40. Levy H. Introduction to Investments. 2nd ed. Cincinnati, OH: South-Western College Publishing. (1999).
41. Elton EJ, Gruber MJ, Brown SJ, Goetzman WN. Modern Portfolio Theory and Investment Analysis. 7th ed. New York, NY: John Wiley & Sons, Inc. (2007).
42. Harvey CR, Liu Y. Evaluating Trading Strategies. SSRN. Available online at: http://papers.ssrn.com/sol3/papers.cfm?abstract_id=247758 (2014a).
43. Harvey CR, Liu Y. Lucky Factors. SSRN. Available online at: http://papers.ssrn.com/sol3/papers.cfm?abstract_id=2528780 (2014b).
44. Harvey CR, Lin Y, Zhu H. The cross-section of expected returns. Rev Finan Stud. (2016) 29:5–69. doi: 10.1093/rfs/hhv059
45. Harvey CR (2017). Presidential address: the scientific outlook in financial economics. J Finance 72:1399–440. doi: 10.1111/jofi.12530
46. Rosenberg B. Extra-market components of covariance in security returns. J Financ Quant Anal. (1974) 9:263–74.
47. Rosenberg B, Marathe V. Tests of capital asset pricing hypotheses. Res Finance (1979) 1:115–224.
48. Rudd A, Clasing HK. Modern Portfolio Theory: The Principals of Investment Management. Homewood, IL: Dow-Jones-Irwin (1982).
50. Roll R, Ross S. An empirical investigation of the arbitrage pricing theory. J Finance (1980) 35:1071–103.
51. Dhrymes PJ, Friend I, Gultekin NB. A critical re-examination of the empirical evidence on the arbitrage pricing theory. J Finance (1984) 39:323–46. doi: 10.1111/j.1540-6261.1984.tb02312.x
52. Connor G, Goldberg L, Korajczyk RA. Portfolio Risk Analysis. Princeton, NJ: Princeton University Press (2010).
53. Markowitz H. Mean-Variance Analysis in Portfolio Choice and Capital Markets. London: Basil Blackwell (1987).
54. Guerard JB Jr. Investing in global markets: big data and applications of robust regression. Front Appl Math Stat. (2016) 1:14. doi: 10.3389/fams.2015.00014
55. Blin J, Bender S, Guerard JB Jr. Earnings forecasts, revisions and momentum in the estimation of efficient market-neutral Japanese and U.S. Portfolios. In: Chen AH, editor. Greenwich, CT: JAI Press. Research in Finance, Vol. 15 (1997). p. 93–115.
57. Borkovec M, Domowitz, I, Kiernan B, Serbin, V. Pmifolio optimization and the cost of trading. J Invest. (2010) 19:63–76. doi: 10.3905/joi.2010.19.2.063
Keywords: portfolio management, emerging markets, earnings acceleration, mean-variance optimization, stock selection
Citation: Guerard J and Saxena A (2018) A Case Study of Forecasted Earnings Acceleration and Stock Selection in Global and Emerging Stock Markets. Front. Appl. Math. Stat. 4:4. doi: 10.3389/fams.2018.00004
Received: 03 January 2018; Accepted: 02 March 2018;
Published: 27 April 2018.
Edited by:
Young Shin Aaron Kim, Stony Brook University, United StatesReviewed by:
Lorenzo Mercuri, Università degli Studi di Milano, ItalyBarret Pengyuan Shao, Independent Researcher, United States
Copyright © 2018 Guerard and Saxena. This is an open-access article distributed under the terms of the Creative Commons Attribution License (CC BY). The use, distribution or reproduction in other forums is permitted, provided the original author(s) and the copyright owner are credited and that the original publication in this journal is cited, in accordance with accepted academic practice. No use, distribution or reproduction is permitted which does not comply with these terms.
*Correspondence: John Guerard, jguerard@mckinleycapital.com