Biochemical and structural characterization of enolase from Chloroflexus aurantiacus: evidence for a thermophilic origin
 Oleg A. Zadvornyy
 Eric S. Boyd
 Matthew C. Posewitz
 Nikolay A. Zorin
 John W. Peters
- 1Department of Chemistry and Biochemistry, Montana State University, Bozeman, MT, USA
- 2Institute of Basic Biological Problems, Russian Academy of Sciences, Pushchino, Russia
- 3Department of Microbiology and Immunology, Montana State University, Bozeman, MT, USA
- 4Department of Chemistry and Geochemistry, Colorado School of Mines, Golden, CO, USA
Enolase catalyzes the conversion of 2-phosphoglycerate to phosphoenolpyruvate during both glycolysis and gluconeogenesis, and is required by all three domains of life. Here, we report the purification and biochemical and structural characterization of enolase from Chloroflexus aurantiacus, a thermophilic anoxygenic phototroph affiliated with the green non-sulfur bacteria. The protein was purified as a homodimer with a subunit molecular weight of 46 kDa. The temperature optimum for enolase catalysis was 80°C, close to the measured thermal stability of the protein which was determined to be 75°C, while the pH optimum for enzyme activity was 6.5. The specific activities of purified enolase determined at 25 and 80°C were 147 and 300 U mg−1 of protein, respectively. Km values for the 2-phosphoglycerate/phosphoenolpyruvate reaction determined at 25 and 80°C were 0.16 and 0.03 mM, respectively. The Km values for Mg2+ binding at these temperatures were 2.5 and 1.9 mM, respectively. When compared to enolase from mesophiles, the biochemical and structural properties of enolase from C. aurantiacus are consistent with this being thermally adapted. These data are consistent with the results of our phylogenetic analysis of enolase, which reveal that enolase has a thermophilic origin.
Introduction
Enolase (2-phospho-d-glycerate hydrolyase, EC 4.2.1.11) catalyzes the conversion of 2-phosphoglycerate (2-PGA) to phosphoenolpyruvate (PEP) during both glycolysis and gluconeogenesis in all three domains of life (Ballou and Wold, 1957; Wold, 1971). Enolase is a metalloenzyme activated by cations of bivalent metals (Brewer, 1981), such as magnesium (Mg2+). In bacteria, enolases are highly conserved enzymes and commonly exist as homodimers with molecular weights in the range of 80–100 kDa; the mass of a single subunit ranges from 40 to 50 kDa. Intriguingly, purified enolase from the thermophilic bacteria Thermotoga maritima (Schurig et al., 1995) and Thermus aquaticus (Stellwag et al., 1973) have been reported to be octamers. However, enolase from the anaerobic, hyperthermophilic archaeon Pyrococcus furiosus was reported as a homodimer (Peak et al., 1994).
Crystal structures of enolase from a variety of taxonomic sources have been examined; however, the majority of studies have been focused on the structure of the homodimeric enolase from Saccharomyces cerevisiae (Chin et al., 1981; Lebioda et al., 1991; Wedekind et al., 1995; Brewer et al., 1998; Sims et al., 2006; Schreier and Hocker, 2010). In the S. cerevisiae enolase dimeric structure, each monomer consists of a carboxyl terminal catalytic site (Lebioda and Stec, 1988; Lebioda et al., 1989; Stec and Lebioda, 1990; Lebioda and Stec, 1991; Zhang et al., 1994), which is highly conserved in enolases from different microorganisms. In addition, upon binding of the substrate to the active site, several conformations of the loop regions near the active site have been observed in the structures of this enzyme. When co-crystallized with Mg2+ and 2-PGA or PEP, the S. cerevisiae enolase structure adopts a completely “closed” state. In the closed state, the flexible active site loops L1 (residues 36–43) from the lid domain and the L2 (residues 153–169) and L3 (residues 251–277) loops from the barrel domain are all in a closed conformation (Figure 3) (Larsen et al., 1996; Zhang et al., 1997; Sims et al., 2006). In contrast, in the apo state, the L1 motif is far removed from the active site and the L2 and L3 loops are in the “open” conformation (Lebioda and Stec, 1991). In addition to the dimeric structure described above, enolase has been shown to form asymmetric dimers in which the subunits adopt two different conformations (Sims et al., 2006; Schulz et al., 2011).
The catalytic mechanism of enolase has been studied in a number of phylogenetically distinct organisms, including representatives from Archaea, Bacteria, and Eukarya (Wold and Ballou, 1957b; Brewer, 1981; Reed et al., 1996; Zhang et al., 1997). From such studies, it is clear that all members of this superfamily share a common initial reaction step: the abstraction of the R-proton of a carboxylate substrate by a general base (Babbitt et al., 1996; Gerlt et al., 2005), represented by lysine 345 in S. cerevisiae enolase (Poyner et al., 1996). The resulting enolic intermediate is stabilized by a magnesium ion [Mg2+(I)], in the conserved active site that interacts with the intermediate carboxylate group. Enolase is unique in that it is the only member of the enolase superfamily in which a reaction intermediate is coordinated by a second catalytic magnesium ion [Mg2+(II)]. Mg2+(II) interacts with one carboxylate oxygen and a phosphate group oxygen of the substrate 2-PGA. In S. cerevisiae enolase, serine 39 in the L1 motif of the lid domain is the only residue that directly interacts with Mg2+(II), while two water molecules positioned by aspartate 321 complete the coordination sphere of Mg2+(II) (Zhang et al., 1994; Larsen et al., 1996). Both magnesium ions [e.g., Mg2+(I) and Mg2+(II)] are thought to participate in the crucial first step of the enolase reaction, the ionization of 2-PGA to give the negatively charged enolic intermediate and the stabilization thereof.
In the second step of the enolase reaction, the general acid glutamate 211 facilitates the dissociation of the hydroxide to form PEP (Larsen et al., 1996; Poyner et al., 1996; Reed et al., 1996). Enolase mutants in which serine at the position 39 in the L1 loop is substituted for asparagine retain basal catalytic enolase activity with coordination of Mg2+(I) and 2-PGA in an “open” active site that does not require the Mg2+(II) coordination residues (Schreier and Hocker, 2010). Interestingly, a structure of enolase from the anaerobic protozoan Entamoeba histolyca contains 2-PGA in the active site and exists in the open conformation; the Mg2+(II) ion is absent from the active site (Schulz et al., 2011).
The widespread taxonomic distribution of enolase in Bacteria and Archaea (Tracy and Hedges, 2000), coupled with its fundamental role in glycolysis and gluconeogenesis (Wold, 1971; Fothergill-Gilmore and Michels, 1993; Ronimus and Morgan, 2003), strongly suggests that enolase was present in the Last Universal Common Ancestor (LUCA) of Bacteria and Archaea. Evidence derived from the characteristics of deeply branching taxa on the universal tree of life suggests that LUCA may have been a thermophile (Pace, 1991; Ronimus and Morgan, 2003; Lineweaver and Schwartzman, 2003). Proteins isolated from thermophilic microorganisms exhibit properties relative to their mesophilic counterparts that allow them to function in these extreme environments (Miller, 2003).
In the present study, we purified enolase-1 from Chloroflexus aurantiacus (EnoCa), a thermophilic green non-sulfur bacterium that grows photosynthetically under anaerobic conditions. Members of the green sulfur bacteria are thought to have emerged early in the evolution of photosynthetic metabolisms, whereby green sulfur bacteria gave rise to gram positive Heliobacteriales capable of photosynthesis, followed by the emergence of photosynthesis in cyanobacteria (Gupta et al., 1999; Xiong et al., 2000). Detailed biochemical and structural analysis of EnoCa reveal features that are consistent with adaptation to high temperature. These results, in the context of our phylogenetic work indicating enolase has a thermophilic origin, confirm adaptation of this enzyme to high temperature and suggest that EnoCa emerged from a thermophilic ancestor. Comparison of biochemical and structural features of EnoCa with enolase from phylogenetically diverse microorganisms reveal a number of common features that are likely to confer thermostability to members of this enzyme superfamily.
Materials and Methods
Growth Conditions of C. aurantiacus
Chloroflexus aurantiacus strain J.10.fl. (courtesy of Dr. Mikhail F. Yanyushin) was grown in 1 L screw-capped bottles illuminated by two pairs of 100 W incandescent lamps at 56°C in a modified Castenholz Medium (Castenholz, 1969; Yanyushin, 1988) (Tables S1 and S2 in Supplementary Material), or in 100 L fermenters stirred at 200 rpm and bubbled with nitrogen gas passed through a 0.2 μm filter (Fisher Scientific, Ireland). Fermenters were illuminated by five 150 W incandescent lamps.
Purification of EnoCa
Cultures of C. aurantiacus were harvested in mid-exponential growth phase by centrifugation (6,000 × g, 25 min). Cell pellets (100 g) were washed twice with Tris-HCl buffer (50 mM, pH 8.0). Following washing, the cell pellet was re-suspended in Tris-HCl buffer (50 mM, pH 8.0) and sonicated using a Branson Sonifier 450 (VWR Scientific, USA) at 40% power for 5 min at 4°C. This process was repeated two additional times. Unbroken cells and cell fragments were pelleted by centrifugation (14,000 × g, 40 min, 4°C). Following centrifugation, the cell free extract was diluted 10-fold with Tris-HCl buffer (5 mM, pH 8.0), and ~570 mg were applied to Q-sepharose column (GE Healthcare, Sweden) equilibrated with Tris-HCl buffer (50 mM, pH 8.0). A linear gradient of 0.05–1.00M NaCl in Tris-HCl buffer (50 mM, pH 8.0) was applied to the column at a flow rate of 3.5 ml min−1. Enolase fractions with activity eluted at ~0.5M NaCl. These fractions were combined and concentrated using a Molecular Stirred cell (Spectrum Laboratories, Inc., USA). Concentrated protein (~250 mg) was loaded onto a Sephacryl S-300 (Pharmacia, Sweden) gel filtration column (2.5 × 100 cm) at a flow rate 1 ml min−1. Fractions that exhibited enolase activity were combined and subjected to further purification using a hydrophobic Octyl Sepharose column (GE Healthcare, Sweden). The column was equilibrated with 0.8M NaCl in Tris-HCl buffer (50 mM, pH 8.0). A linear gradient of 0.8–0.0M NaCl was applied to the column with a flow rate 2.5 ml min−1. The active enolase fractions were combined and desalted using a Sephadex G-25 (GE Healthcare, Sweden). The purity of protein sample was confirmed by SDS-PAGE. Purified enolase was stored in liquid nitrogen until further biochemical and structural characterization.
EnoCa Protein Concentration and Kinetic Assays
The concentration of protein in these samples was determined using the Bradford Assay (Bradford, 1976) with bovine serum albumin as a standard. The activity of purified EnoCa was determined by monitoring the conversion of 2-PGA to PEP. PEP absorbs at 240 nm and was quantified over time in a temperature-controlled assay using a Cary50-Bio-UV-Visible spectrophotometer. The assay contained 1.5 mM PGA, 5 mM MgCl2 in Bis-Tris propane (50 mM, pH 6.5), and enolase (12 μg), unless otherwise stated. The change in PEP concentration was determined using an absorption coefficient (ε240-25t) = 1.7 mM−1 cm−1 at 25°C and (ε240-80t) = 1.2 at mM−1 cm−1 at 80°C. The absorption coefficient of PEP varies with pH, concentration of Mg2+, and temperature. Corrected molar absorptivity for PEP was used in experiments where pH, Mg2+ concentration, and temperature were varied (Wold and Ballou, 1957a,b). One unit (U) of the enzyme activity was defined as the amount of enolase that converts 1 μmol of 2-PGA into PEP in 1 min at 80°C, unless otherwise stated. Michaelis–Menten kinetic parameters were determined from curves generated by plotting the concentration of substrate p as a function of reaction velocity. The standard reaction mixture contained 1.5 mM 2-PGA, 5 mM MgCl2 in 50 mM Bis-Tris propane (pH 6.5), and enolase sample (12 μg). The 2-PGA concentrations varied from 0.04 to 12 mM, while Mg2+ concentrations ranged from 0.05 to 20 mM. The reaction was initiated by the addition of 12 μg of enzyme. To determine the Mg2+ kinetic parameters, the enzyme was subjected to an additional round of purification using a PD-10 (Sephadex™ G-25, GE Healthcare, Sweden) desalting column equilibrated with Bis-Tris propane buffer (50 mM, pH 6.5) free of Mg2+. To investigate the effect of the Tris-HCl (50mM, pH 8.0), HEPES (50 mM, pH 8.0), or Bis-Tris propane (50 mM, pH 8.0) buffer on the enolase activity, the protein was exchanged on Sephadex G-25 column equilibrated with the corresponding buffer.
Thermal Stability and Temperature Optimum of Enzyme
To investigate the thermal stability of the EnoCa, protein samples were heated for 5 min at the specified temperature (25–90°C), and then placed immediately on ice before being added to the reaction mixture. The activity of heat-treated enzymes was determined using the methods described above at a temperature of 25°C. The optimum temperature for the activity of enolase was determined by evaluating activity over the range of temperatures spanning 25–90°C. Three replicate measurements for each of the experiments described above were made at each sampling interval, and replicate measurements did not vary by more than 5%.
Crystallization and Data Collection
Crystals of EnoCa were obtained by the hanging drop vapor diffusion method at 18°C in 2 μl drops containing a 1:1 protein:reservoir solution ratio. The reservoir solution contained 0.8 ml of Bis-Tris propane buffer (0.1M, pH 9.0), 0.21M NaCl, and 28% PEG 1500. Crystals were cryoprotected by soaking them in the reservoir solution containing an additional 20% (v/v) glycerol, and they were then flash frozen in liquid nitrogen prior to data collection. The crystal composition was confirmed by SDS-PAGE and liquid chromatography–mass spectrometry analysis. Diffraction data were collected at 100 K at the Stanford Synchrotron Radiation Lightsource beamline 9-2, using the MARmosaic 325 CCD Detector (Menlo Park, CA). Data collected from EnoCa crystals were processed and scaled by XDS (Kabsch, 2010).
The structure was solved by molecular replacement (Winn et al., 2011) using the Enterococcus hirae enolase structure [PDB entry 1IYX (Hosaka et al., 2003)] as a search model. Model building was performed in Coot (Emsley et al., 2010). Coordinates were refined to reasonable stereochemistry at a resolution 2.30–3.04 Å using REFMAC5 (Murshudov et al., 1997). The structure was validated using MolProbity (Chen et al., 2010). All molecular images were calculated in PyMol (Delano, 2002). Calculation of root-mean-square deviations (r.m.s.d) was performed with the program LSQKAB (Winn et al., 2011). Structures are submitted to PDB entry 4YWS (native), 4Z17 (with PEP), 4Z1Y (with PGA).
Amino Acid Sequence Comparison and Homology Modeling
Amino acid sequences of enolases from P. furiosus (NP_577944), T. maritima (NP_228685), T. aquaticus (ZP_03497734), Plasmodium falciparum (XP_001347440), Escherichia coli (1E9I_A), Candida albicans (XP_711912), S. cerevisiae (1EBG_A), and Trypanosoma brucei (2PTW_A) were obtained from the NCBI/BLAST/BLASTP server.1 The ProtParam tool, available from the ExPASy server,2 was used to calculate the percentage amino acid composition (Gasteiger et al., 2003). Homology models containing one subunit of enolase from P. furiosus, T. maritima, T. aquaticus, P. falciparum, C. albicans, S. cerevisiae, and T. brucei were generated by SWISS-MODEL (Arnold et al., 2006).
Structural Rigidity Analysis
Homology models were used to perform structural rigidity analysis. The program Floppy Inclusion Rigid Substructure Topography (FIRST) (Jacobs et al., 2001) was used to perform flexibility analysis and to calculate the number of probable (i) hydrogen bonds, (ii) rigid clusters, (iii) sites in the largest rigid cluster, and (iv) the total independent degrees of freedom. Using covalent bonds, hydrophobic tethers, hydrogen bonds, and salt bridges, FIRST defines the constraint network. Based on the constraint network, the program identifies compared parameters of rigid and flexible regions of the protein (Jacobs et al., 2001; Rader et al., 2002). Relationships between calculated and measured protein parameters and optimal growth temperature were determined using XL Stat (ver. 2008.7.03). Pearson correlation coefficients and P-values were generated from 1000 permutations of the data.
Evolutionary Analyses
Enolase-1 sequences were compiled from the DOE-IMG database using enolase-1 sequence from E. coli K12 (NP_417259) as a query. All representative sequences were aligned using ClustalX (ver. 2.0) (Larkin et al., 2007) employing the Gonnett substitution matrix with default parameters. A neighbor-joining tree was used to empirically identify sequences that represent the primary phylogenetic lineages. Representative enolase-1 sequences were realigned as described above and the alignment block was subjected to evolutionary model prediction using ProtTest (ver. 2.4).(Abascal et al., 2005) Phylogenetic reconstruction was performed with the neighbor-joining method specifying the JTT substitution matrix and gamma distributed rate variation (γ = 0.93) with MEGA4 (Tamura et al., 2007) The pairwise deletion option was specified and enolase-2 sequences from Methanothermobacterium thermoautotrophicum strain delta H and Archaeoglobus fulgidus DSM 4304 served as out groups. The phylogenetic tree was projected from 100 bootstrap replicates using FigTree (ver. 1.2.2).3
Results
Thermophilic Origin and Properties of Thermal Adaptation of Enolase from C. aurantiacus
EnoCa shares significant sequence identity with enolases from other organisms distributed across Bacteria and Archaea (alignment not shown). Phylogenetic reconstruction of representative bacterial and archaeal enolase-1 sequences, when rooted with enolase-2, reveal a number of early branching lineages that are derived from thermophilic or hyperthermophilic organisms (Figure 1). Such an observation is consistent with a thermophilic origin for enolase-1. EnoCa-1 from C. aurantiacus, which is characterized here, forms a lineage with other green non-sulfur bacteria that branches late among thermophilic enolase. Nevertheless, these results suggest that the properties of EnoCa are likely to reflect those of the thermophilic ancestor to a greater extent than more recently derived mesophilic representatives.
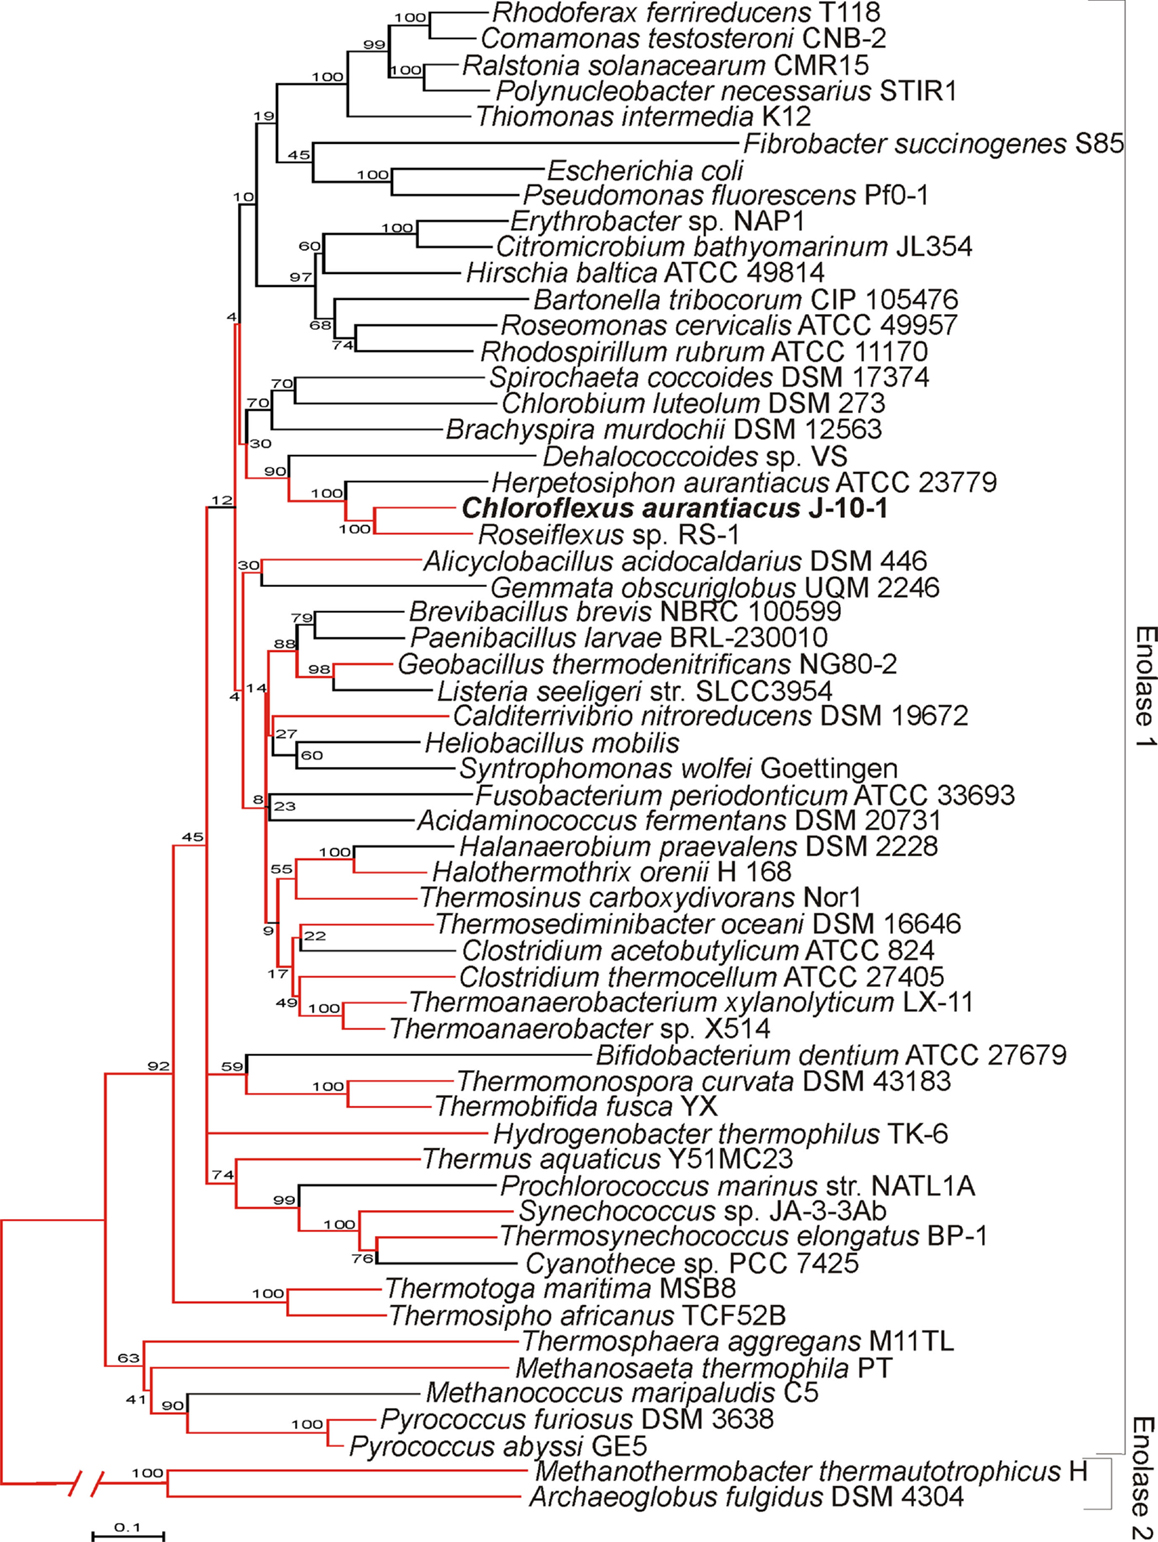
Figure 1. Phylogenetic reconstruction of representative enolase-1 sequences as determined using the neighbor-joining method. Lineages represented by thermophiles are colored red. Parsimony was used to designate thermophilic lineages in cases where both thermophilic and non-thermophilic taxa were present. Bootstrap support values are designated at nodes.
The amino acid composition and flexibility analysis of EnoCa together with enolases from P. furiosus, T. maritima, T. aquaticus, P. falciparum, C. albicans, S. cerevisiae, and T. brucei are given in Table 1. Despite the high level of sequence conservation among enolases, EnoCa has a higher percentage of aliphatic amino acids when compared to enolases from non-thermophilic taxa. The Pearson correlations (r) between optimal growth temperature of microorganisms and parameters associated with EnoCa properties have been calculated to establish positive and negative relationships between these parameters. The results indicate that hydrophobocity indices, aliphatic indices, the total number of sites in the rigid cluster, and the total independent degrees of freedom varied positively and to a significant extent (P < 0.05) with the optimal growth temperature of the strains. In contrast, the relative abundance of polar amino acids, hydrogen bonds, and total number of clusters in the rigid cluster varied inversely with the optimal growth temperature of the strains (Table S3 in Supplementary Material). In addition, the EnoCa structure reveals differences relevant to thermostable proteins, such as the residues that form the loops (138–143, 189–207, and 247–268 in EnoCa) being shorter than the corresponding residues of S. cerevisiae enolase (Figure 3; Figure S6 in Supplementary Material).
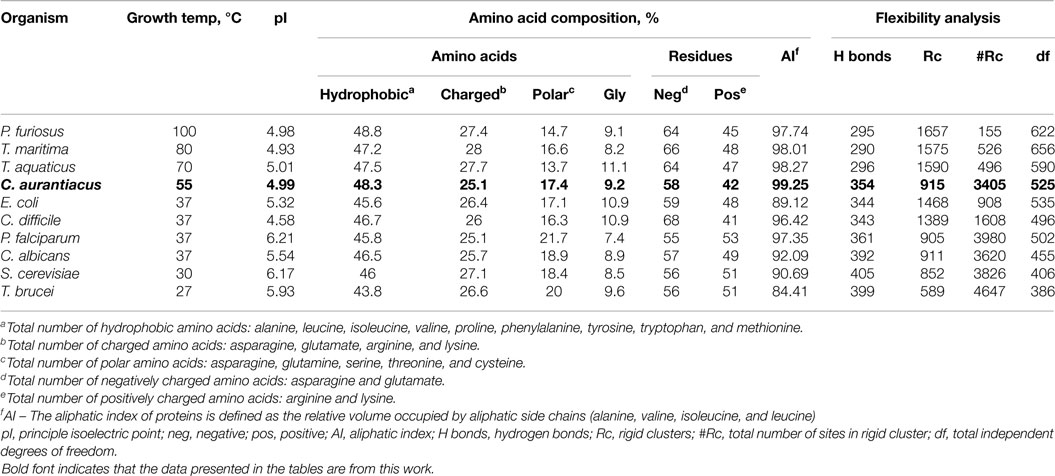
Table 1. Amino acid composition and flexibility analysis of enolases from different microorganisms.
Biochemical Characterization of Enolase from C. aurantiacus
EnoCa was purified as a dimer with a molecular weight of ~92–96 kDa (Table 2; Figures S1–S3 in Supplementary Material). The subunit molecular weight of enolase was determined to be ~46.0 kDa using SDS-gel electrophoresis (Figure S2 in Supplementary Material). The activity of EnoCa was highest (124 ± 5 U mg−1 of protein at 25°C) in Bis-Tris propane buffer, with roughly a 25 and 47% decrease in activity when the enzyme was exchanged in Tris-HCl and HEPES, respectively. EnoCa activity was examined over a pH range of 6.0–10.0 in 50 mM Bis-Tris propane; the optimum pH for the catalytic activity of enolase was determined to be 6.5 (Figure 2A). EnoCa exhibited thermostability at temperatures up to 90°C, as indicated by retention of ~45% of the activity at this temperature when compared to that at 75°C. The temperature optimum for the assay reactions in 50 mM Bis-Tris propane buffer (pH 6.5) was 80°C in comparison to 55°C for the S. cerevisiae enolase (Figures 2B,C).
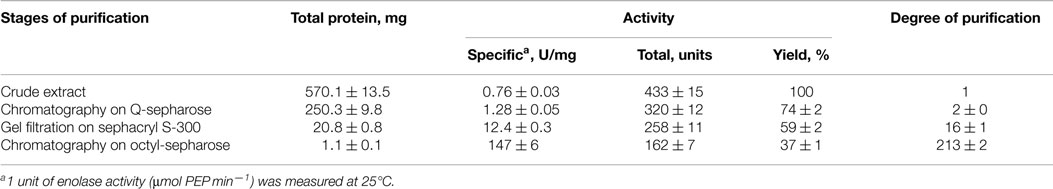
Table 2. The purification of EnoCa.
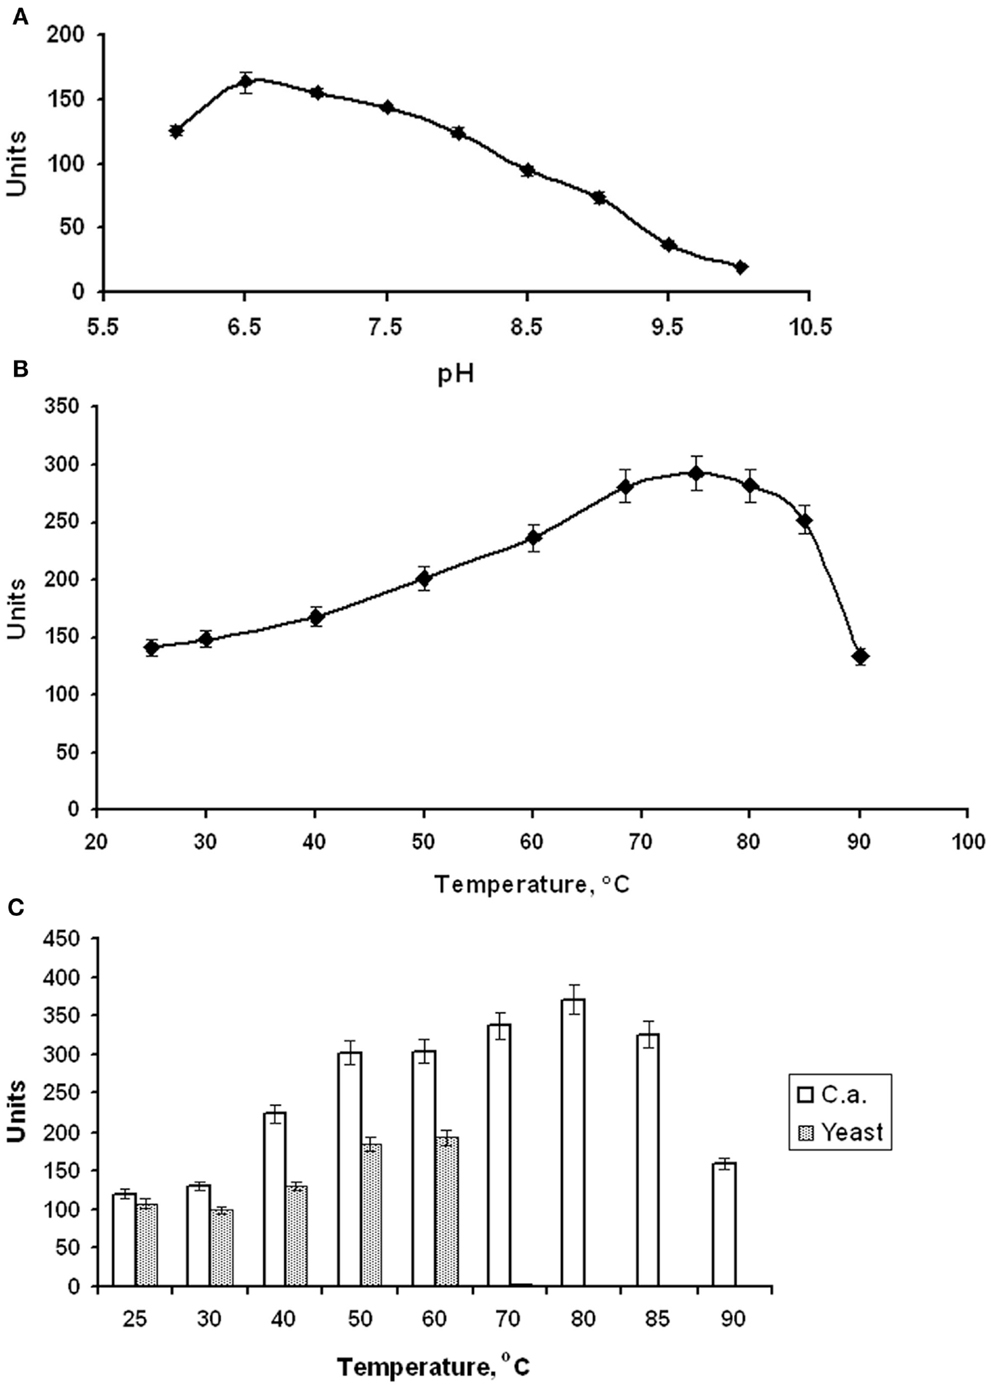
Figure 2. Properties of C. aurantiacus enolase. (A) Determination of pH optimum. (B) Thermostability of C. aurantiacus enolase. (C) Comparison of temperature optimum of C. aurantiacus and Saccharomyces cerevisiae enolases.
The Km of EnoCa for 2-PGA and Mg2+ at 25 and 80°C were determined from measurements of initial rates of the reactions using the Lineweaver-Burk method (Lineweaver and Burk, 1934). EnoCa displayed classical Michaelis–Menten kinetics for both 2-PGA and Mg2+. The enzyme had a lower Km for both 2-PGA (0.035 ± 0.00 mM) and Mg2+ (1.9 ± 0.3 mM) at 80°C, when compared to the Km for these substrates as determined at 25°C (0.16 ± 0.01 and 2.5 ± 0.2 mM, respectively). As expected, the Vmax for 2-PGA (50 ± 1 μmol min−1 mg−1) and Mg2+ (36 ± 2 μmol min−1 mg−1) was higher at 80°C, when compared to that at 25°C (9 ± 1 μmol min−1 mg−1 and 17 ± 2 μmol min−1 mg−1, respectively) (Table 3; Figures S4 and S5 in Supplementary Material). It should be noted that concentrations of at least 10 mM Mg2+ inactivated EnoCa (data not shown).
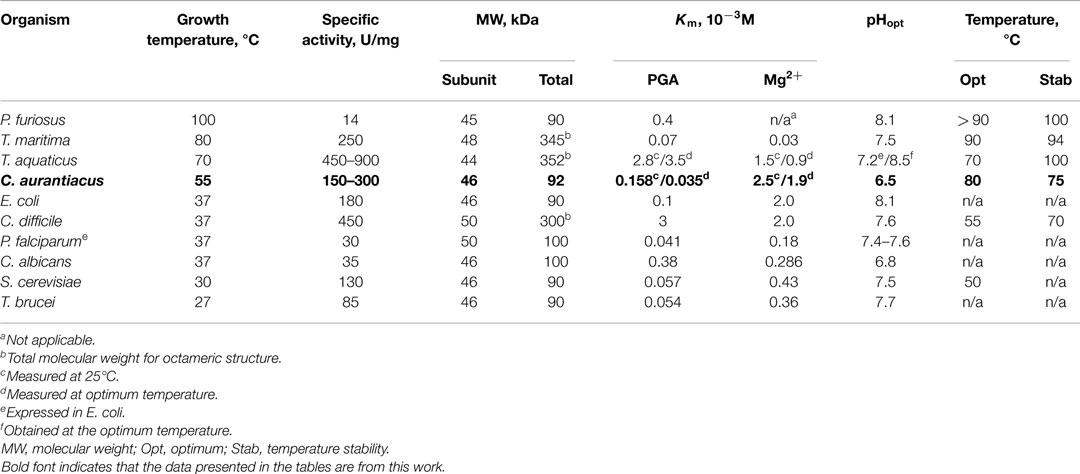
Table 3. Properties of organisms from which enolase have been characterized, and properties of the purified enzymes.
Structural Characterization of Enolase from C. aurantiacus
EnoCa was crystallized under multiple conditions; however, the best crystals were obtained using 0.21M NaCl and 28% PEG 1500. High-resolution crystal structures were obtained for the apo protein as well as proteins with 2-PGA and PEP bound in the active site. The enolase crystals belonged to space group I4, which contained two monomers per asymmetric unit assembled into one homodimer (Table S4 in Supplementary Material). Each monomer of EnoCa contains an amino terminal domain that consists of a three-stranded β-sheet packed against three α-helices and a carboxy terminal domain that consists of an eightfold α/β-barrel (Figure 3); both domain features are typical of the enolase superfamily.
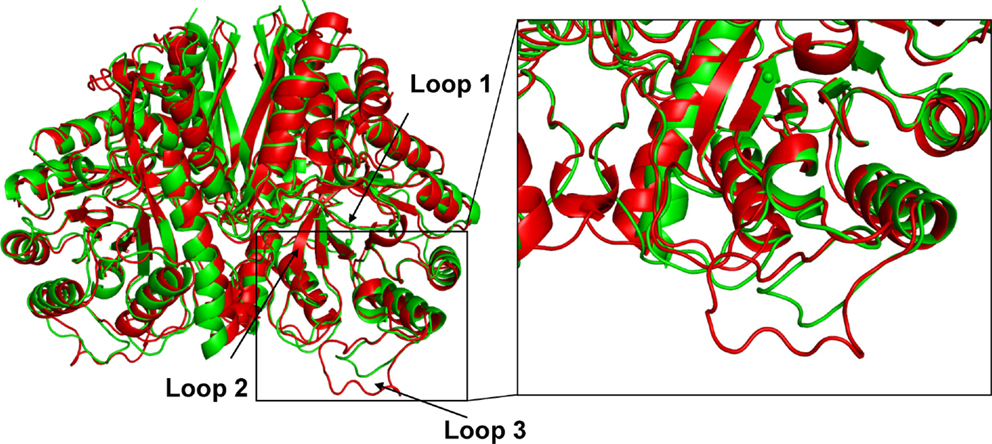
Figure 3. Comparison of crystal structure of C. aurantiacus and Saccharomyces cerevisiae enolase. Difference in the secondary-structure elements of C. aurantiacus enolase (in green) and S. cerevisiae enolase (1EBH; in red). The two structures are superimposed and the difference in the loop with residues 189–207 and L3 loop (residues 247–268) are shown. Insert shows close-up view of the loop L3.
The structure of the apo protein and that containing 2-PGA (2-PGA EnoCa structure) of EnoCa exhibits the so-called “open” conformation, where the L1 loop is away from the active site. The EnoCa structure containing PEP (PEP EnoCa structure) exhibits the so-called “closed” conformation, where the L1 loop is located closer to the active site (Figures 4A,B). Upon superposition with the apo EnoCa structure in the open conformation, the L1 loop in the 2-PGA EnoCa structure (open conformation) displays an r.m.s.d. of 0.38 Å, whereas the PEP EnoCa structure superimposed on the apo EnoCa structure (closed conformation) has r.m.s.d. 3.1 Å.
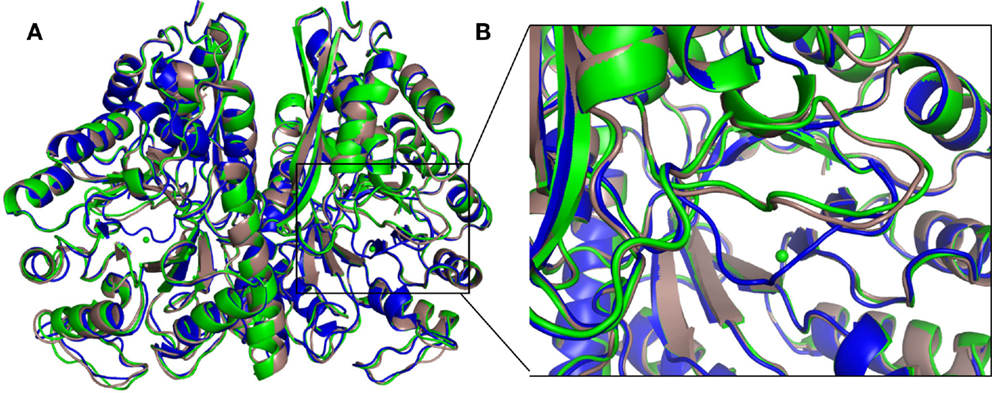
Figure 4. Differences in the overall crystal structures of C. aurantiacus enolase. Superposition of apo (green), 2-PGA (gray), and PEP (blue) structures (A). Close-up view of the L1 loop. In the PEP structure, the L1 loop is shown in close conformation (B).
The remaining electron density was visible in the active site, after refinement of all protein structures. In the beginning of the apo EnoCa structure refinement, the difference map peaks were refined placing Mg2+(I) atom in coordination with Asp241, Glu285, and Asp313, and then three water molecules in an octahedral manner (Figures 5A,B). The nature of the metal ion could not be unambiguously determined from the metal–oxygen distances of between 2.4 and 2.5 Å (Dokmanic et al., 2008). Hence, the octahedral coordination sphere, the presence of Mg2+ in the crystallization buffer, and the fact that Mg2+ is the natural ligand of enolase, is consistent with the modeling of the difference density peak as an Mg2+ ion (Brewer, 1981; Wedekind et al., 1995; Larsen et al., 1996). Like the apo EnoCa structure, a metal ion was mapped to the active site in the 2-PGA and PEP structures. However, for the same reasons described above for the apo EnoCa structure, unambiguous determination of the metal ion was not possible in the 2-PGA and PEP EnoCa structures.
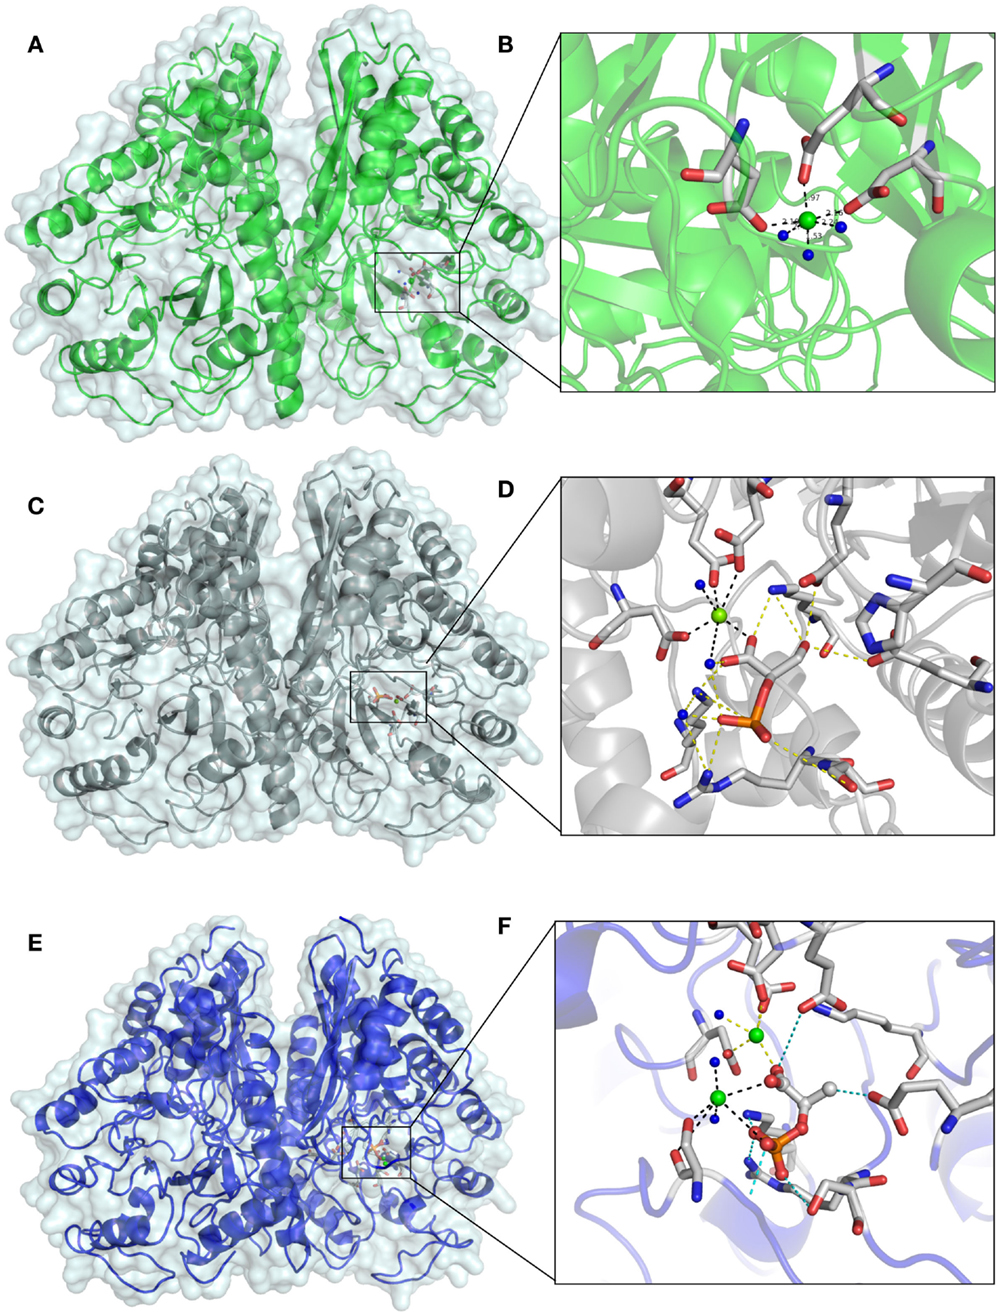
Figure 5. Differences in the active site of crystal structures of C. aurantiacus enolase. The active sites of native EnoA in green (A,B) 2-PGA structure in gray (C,D), and PEP structure in blue (E,F) are shown in overall (A,C,E) and close view (B,D,F).
The presence of 2-PGA and PEP in the active site of EnoCa was confirmed by calculation of a simulated-annealing OMIT map. The simulated-annealing OMIT map shows electron density that correlates with the presence of 2-PGA and PEP molecules (data not shown). As was mentioned before, the L1 loop in 2-PGA EnoCa structure was refined in the open conformation. 2-PGA in the active site is coordinated with Glu165, Glu206, Lys338, Arg367, and Ser368. Additionally, 2-PGA interacts with water molecules, and the carboxyl molecule involved in coordination of conformational Mg2+(I) (Figures 5C,D).
In contrast to the 2-PGA EnoCa structure, PEP was coordinated with the second catalytic metal atom in the active site. The second atom was identified as Mg2+. Mg2+(II) was coordinated with Ser43, water molecules, and phosphate atoms from PEP supporting the octahedral coordination sphere. PEP itself is bound by Glu165, Glu206, Lys338, Arg367, and Ser368 (Figures 5E,F). It should be noted that the electron density was absent for the Ser43 in subunit A of the PEP EnoCa structure due to instability of the L1 region. Nevertheless, the Ser43 was modeled in subunit A with reduced occupancy (0.5).
Discussion
Evolutionary analysis of archaeal and bacterial enolase-1 protein representatives, when rooted with representative enolase-2 proteins, indicate that the earliest branching lineages derive from thermophilic taxa indicating that the enzyme likely has a thermophilic origin. Enolase-1 from the thermophile C. aurantiacus, as characterized here, branches late among the thermophilic ancestry of the enzyme, but prior to when the widespread diversification of organisms harboring this enzyme into lower temperature environments. Thus, it is likely that enolase-1 isolated from C. aurantiacus harbors biochemical and structural properties that are more reflective of the thermophilic ancestor than mesophilic enzymes.
Despite the clear indication that EnoCa is derived from a thermophilic ancestor, the molecular properties of the enzyme exhibit a number of similarities with characterized enzymes from mesophiles. For example, the subunit molecular weights are similar in enolase from E. coli (Wold and Ballou, 1957a), P. furiousus (Peak et al., 1994), S. cerevisiae (Chin et al., 1981), T. brucei (Hannaert et al., 2000), and P. falciparum (Pal-Bhowmick et al., 2004), all of which vary from 45.0 to 46.4 kDa. Moreover, the pH optima of enolases from various organisms are also similar among enzymes (Wold, 1971; Kustrzeba-Wojcicka and Golczak, 2000) and tend to fall within the ~6 to 7 range with activity decreasing sharply in more acidic medium and less so in more alkaline solutions. Since enolase is a cytoplasmic enzyme, this finding likely reflects similar cytoplasmic pH in these organisms and may indicate similar cytoplasmic pH since early in life history. The Km value for 2-PGA as a substrate for EnoCa is 0.16 mM at 25°C and 0.03 mM at 80°C, which compares well with the Km value for S. cerevisiae enolase (0.12 mM) at 25°C (Wold and Ballou, 1957b). Enolase from T. aquaticus and C. difficile have Km values for 2-PGA of 2.8 and 3.0 mM respectively (Stellwag et al., 1973; Green et al., 1993), which is one order of magnitude higher than that observed for C. aurantiacus and S. cerevisiae.
Bivalent metal ions have been shown to be necessary for the activation of enolase. Specifically, Mg2+ has shown to be the strongest activator for all known enolases (Wold and Ballou, 1957b; Faller et al., 1977). Other bivalent metal ions activated homologous enolase enzymes to varying extents (Faller et al., 1977; Brewer, 1981). Km values for the MgCl2 for EnoCa are 2.5 (at 25°C) and 1.5 mM (at 80°C), similar to those from E. coli and C. difficile which are 2.0 mM (at 25°C) but an order magnitude higher than for mesophilic bacteria (Table 3). The decrease in the Km values for 2-PGA and Mg2+ with an increase of the temperature approaching the temperature optimum of the catalytic reaction has been shown for enolase from T. quaticus (Stellwag et al., 1973) and T. maritima (Schurig et al., 1995). Together, these observations indicate adaptation of the thermostable enzymes with respect to their structural properties and activity, showing maximum catalytic efficiency and stability at high temperatures. Similar to the effect of Mg2+ on activity of S. cerevisiae enolase (Faller et al., 1977; Vinarov and Nowak, 1998), the increase in the Mg2+ concentration (higher than 10 mM) inhibited the activity of EnoCa. The inhibitory metal binding site has been identified in structural studies conducted on enolase from T. brucei (Giotto et al., 2003).
Enolase from the thermophile C. aurantiacus (growth optimum = 55°C) exhibits thermostability and a higher temperature optimum (enolase Topt = 80°C) than enolase from the thermophile T. aquaticus (growth optimum = 70°C; enolase Topt = 70°C), but a lower temperature optimum than enolase from the hyperthermophiles P. furiosus (growth optimum = 100°C; enolase Topt = >90°C) and T. maritima (growth optimum = 80; enolase Topt = 90°C) (Table 3). There are several differences in the properties of enolase proteins observed in the primary sequence and structure that may account for the differences in the observed thermostability. For example, the optimal growth temperature of strains significantly correlates with the hydrophobicity index (e.g., number of hydrophobic residues in the protein sequence), aliphatic index (Ikai, 1980), number of rigid clusters in inferred structures, and total independent degree of freedom. These differences would support enhanced thermal stability, since bulkier hydrophobic amino acid side-chains can support stronger hydrophobic interactions in the protein interior (Jaenicke, 1991; Vieille and Zeikus, 2001). Similar adaptations at the structural level have been observed in ribulose-1,5-bisphosphate carboxylase/oxygenase in response to temperature (Miller, 2003). The conformational entropy of the protein molecule increases with elevated temperatures, and this can be attributed to the high degree of disorder observed in the protein–solvent interactions. Therefore, the increase in conformational entropy may have deleterious effects on the structure of the protein molecule by altering its active configuration and leading to its denaturation at elevated temperatures. Hence, to maintain the structural integrity, the thermophilic protein needs to adopt certain strategies that will act as a control mechanism to lower the conformational entropy and prevent it from denaturing at higher temperatures (Kumar and Nussinov, 2001). Increased rigidity of the thermophilic proteins can be considered the first step toward the reduction of the conformational disorder of the protein molecule. This can be achieved by stronger interactions within the protein interior. The rigid clusters, calculated by the FIRST software, are formed from a collection of atoms connected by non-rotatable bonds varying in size from hundreds and thousands of atoms forming a rigid protein core, down to a single atom (Jacobs et al., 2001). Thus, a high temperature stability is the result of adaptation at the structural level in the response to high temperature (Ikai, 1980; Kumar and Nussinov, 2001; Vieille and Zeikus, 2001; Miller, 2003).
In conclusion, the results from the structural analysis of C. aurantiacus enolase presented here are consistent with its thermophilic ancestry. For example, the C. aurantiacus enolase has a decreased number of amino acids that comprise flexible loops (Figure 3). Among proteins that are isolated from thermophiles, it is common to observe an overall greater proportion of amino acids involved in well-defined secondary structure (Ikai, 1980; Vieille and Zeikus, 2001). This is manifested not only in the lack of extensive solvent-exposed loop regions, but also in a greater extent of secondary structure. Increase in the helical content along with shortening of loop regions results in a decrease in conformational entropy. The other feature that was identified in the structural analysis is the absence of second, catalytic Mg2+(II) atom at the active site in the structures containing 2-PGA. It has been reported that the S. cerevisiae and E. histolytica enolase structures contain the 2-PGA that was not coordinated with Mg2+(II) in the active site. This fact might be explained by the pre-catalytic step of the reaction sequence prior to binding of metal II and closure of L1.
Conflict of Interest Statement
The authors declare that the research was conducted in the absence of any commercial or financial relationships that could be construed as a potential conflict of interest.
Acknowledgments
A culture of C. aurantiacus was kindly provided by Dr. Mikhail F. Yanyushin. We thank Dr. Larisa Serebriakova, Dr. Charles M. Lawrence, Jacob H. Artz, Dr. Anoop K. Sendamarai, Dr. George Gauss, and Brian J. Eilers for valuable advice and suggestions. This work supported by a grant from the Air Force Office of Scientific Research (FA9550-14-110147) to JP, EB, and MP. The authors also acknowledge funding for the establishment and operation of the Environmental and Biofilm Mass Spectrometry Facility at Montana State University (MSU) through the Defense University Research Instrumentation Program (DURIP, Contract Number: W911NF0510255) and the MSU Thermal Biology Institute from the NASA Exobiology Program (Project NAG5-8807). Portions of this research were carried out at the Stanford Synchrotron Radiation Laboratory (SSRL), a national user facility operated by Stanford University on behalf of the US Department of Energy, Office of Basic Energy Sciences under Contract No. DE-AC02-76SF00515. The SSRL Structural Molecular Biology program is supported by the US Department of Energy, Office of Biological and Environmental Research, the US National Institutes of Health, National Center for Research Resources, Biomedical Technology program, and the US National Institute of General Medical Sciences (including P41GM103393). EB acknowledges support from a grant from the NASA Astrobiology Institute (NNA 15BB02A).
Supplementary Material
The Supplementary Material for this article can be found online at https://www.frontiersin.org/article/10.3389/fbioe.2015.00074/abstract
Abbreviations
EnoCa, enolase-1 from Chloroflexus aurantiacus; FIRST, floppy inclusion rigid substructure topography; 2-PGA, 2-phosphoglycerate; PEP, phosphoenolpyruvate; PAGE, polyacrylamide gel electrophoresis; PEG, polyethylene glycol; PDB, protein data bank; R.m.s.d.s, root-mean-square deviations; SDS-PAGE, sodium dodecyl sulfate polyacrylamide gel electrophoresis.
Footnotes
References
Abascal, F., Zardoya, R., and Posada, D. (2005). ProtTest: selection of best-fit models of protein evolution. Bioinformatics 21, 2104–2105. doi:10.1093/bioinformatics/bti263
Arnold, K., Bordoli, L., Kopp, J., and Schwede, T. (2006). The SWISS-MODEL workspace: a web-based environment for protein structure homology modelling. Bioinformatics 22, 195–201. doi:10.1093/bioinformatics/bti770
Babbitt, P. C., Hasson, M. S., Wedekind, J. E., Palmer, D. R., Barrett, W. C., Reed, G. H., et al. (1996). The enolase superfamily: a general strategy for enzyme-catalyzed abstraction of the alpha-protons of carboxylic acids. Biochemistry 35, 16489–16501. doi:10.1021/bi9616413
Bradford, M. M. (1976). A rapid and sensitive method for the quantitation of microgram quantities of protein utilizing the principle of protein-dye binding. Anal. Biochem. 72, 248–254. doi:10.1016/0003-2697(76)90527-3
Brewer, J. M. (1981). Yeast enolase: mechanism of activation by metal ions. CRC Crit. Rev. Biochem. 11, 209–254. doi:10.3109/10409238109108702
Brewer, J. M., Glover, C. V., Holland, M. J., and Lebioda, L. (1998). Significance of the enzymatic properties of yeast S39A enolase to the catalytic mechanism. Biochim. Biophys. Acta. 1383, 351–355. doi:10.1016/S0167-4838(98)00004-1
Castenholz, R. W. (1969). Thermophilic blue-green algae and the thermal environment. Bacteriol. Rev. 33, 476–504.
Chen, V. B., Arendall, W. B. III, Headd, J. J., Keedy, D. A., Immormino, R. M., Kapral, G. J., et al. (2010). MolProbity: all-atom structure validation for macromolecular crystallography. Acta Crystallogr. D Biol. Crystallogr. 66, 12–21. doi:10.1107/S0907444909042073
Chin, C. C., Brewer, J. M., and Wold, F. (1981). The amino acid sequence of yeast enolase. J. Biol. Chem. 256, 1377–1384.
Delano, W. L. (2002). The PyMOL Molecular Graphics System. Version 1.7.4. San Carlos, CA: Schrödinger, LLC.
Dokmanic, I., Sikic, M., and Tomic, S. (2008). Metals in proteins: correlation between the metal-ion type, coordination number and the amino-acid residues involved in the coordination. Acta Crystallogr. D Biol. Crystallogr. 64, 257–263. doi:10.1107/S090744490706595X
Emsley, P., Lohkamp, B., Scott, W. G., and Cowtan, K. (2010). Features and development of Coot. Acta Crystallogr. D Biol. Crystallogr. 66, 486–501. doi:10.1107/S0907444910007493
Faller, L. D., Baroudy, B. M., Johnson, A. M., and Ewall, R. X. (1977). Magnesium-ion requirements for yeast enolase activity. Biochemistry 16, 3864–3869. doi:10.1021/bi00636a023
Fothergill-Gilmore, L. A., and Michels, P. A. (1993). Evolution of glycolysis. Prog. Biophys. Mol. Biol. 59, 105–235. doi:10.1016/0079-6107(93)90001-Z
Gasteiger, E., Gattiker, A., Hoogland, C., Ivanyi, I., Appel, R. D., and Bairoch, A. (2003). ExPASy: the proteomics server for in-depth protein knowledge and analysis. Nucleic Acids Res. 31, 3784–3788. doi:10.1093/nar/gkg563
Gerlt, J. A., Babbitt, P. C., and Rayment, I. (2005). Divergent evolution in the enolase superfamily: the interplay of mechanism and specificity. Arch. Biochem. Biophys. 433, 59–70. doi:10.1016/j.abb.2004.07.034
Giotto, M. T. D., Hannaert, V., Vertommen, D., Navarro, M. V. D. S., Rider, M. H., Michels, P. A. M., et al. (2003). The crystal structure of Trypanosoma brucei enolase: visualisation of the inhibitory metal binding site III and potential as target for selective, irreversible inhibition. J. Mol. Biol. 331, 653–665. doi:10.1016/S0022-2836(03)00752-6
Green, G. A., Girardot, R., Baldacini, O., Ledig, M., and Monteil, H. (1993). Characterization of enolase from Clostridium difficile. Curr. Microbiol. 26, 53–56. doi:10.1007/BF01577243
Gupta, R. S., Mukhtar, T., and Singh, B. (1999). Evolutionary relationships among photosynthetic prokaryotes (Heliobacterium chlorum, Chloroflexus aurantiacus, cyanobacteria, Chlorobium tepidum and proteobacteria): implications regarding the origin of photosynthesis. Mol. Microbiol. 32, 893–906. doi:10.1046/j.1365-2958.1999.01417.x
Hannaert, V., Brinkmann, H., Nowitzki, U., Lee, J. A., Albert, M. A., Sensen, C. W., et al. (2000). Enolase from Trypanosoma brucei, from the amitochondriate protist Mastigamoeba balamuthi, and from the chloroplast and cytosol of Euglena gracilis: pieces in the evolutionary puzzle of the eukaryotic glycolytic pathway. Mol. Biol. Evol. 17, 989–1000. doi:10.1093/oxfordjournals.molbev.a026395
Hosaka, T., Meguro, T., Yamato, I., and Shirakihara, Y. (2003). Crystal structure of Enterococcus hirae enolase at 2.8 A resolution. J. Biochem. 133, 817–823. doi:10.1093/jb/mvg104
Ikai, A. (1980). Thermostability and aliphatic index of globular-proteins. J. Biochem. 88, 1895–1898.
Jacobs, D. J., Rader, A. J., Kuhn, L. A., and Thorpe, M. F. (2001). Protein flexibility predictions using graph theory. Proteins 44, 150–165. doi:10.1002/prot.1081
Jaenicke, R. (1991). Protein stability and molecular adaptation to extreme conditions. Eur. J. Biochem 202, 715–728. doi:10.1111/j.1432-1033.1991.tb16426.x
Kabsch, W. (2010). Xds. Acta Crystallogr. D Biol. Crystallogr. 66, 125–132. doi:10.1107/S0907444909047337
Kumar, S., and Nussinov, R. (2001). How do thermophilic proteins deal with heat? Cell. Mol. Life Sci. 58, 1216–1233. doi:10.1007/PL00000935
Kustrzeba-Wojcicka, I., and Golczak, M. (2000). Enolase from Candida albicans–purification and characterization. Comp. Biochem. Physiol. B Biochem. Mol. Biol. 126, 109–120. doi:10.1016/S0305-0491(00)00169-3
Larkin, M. A., Blackshields, G., Brown, N. P., Chenna, R., Mcgettigan, P. A., Mcwilliam, H., et al. (2007). Clustal W and Clustal X version 2.0. Bioinformatics 23, 2947–2948. doi:10.1093/bioinformatics/btm404
Larsen, T. M., Wedekind, J. E., Rayment, I., and Reed, G. H. (1996). A carboxylate oxygen of the substrate bridges the magnesium ions at the active site of enolase: structure of the yeast enzyme complexed with the equilibrium mixture of 2-phosphoglycerate and phosphoenolpyruvate at 1.8 A resolution. Biochemistry 35, 4349–4358. doi:10.1021/bi952859c
Lebioda, L., and Stec, B. (1988). Crystal structure of enolase indicates that enolase and pyruvate kinase evolved from a common ancestor. Nature 333, 683–686. doi:10.1038/333683a0
Lebioda, L., and Stec, B. (1991). Mechanism of enolase: the crystal structure of enolase-Mg2(+)-2-phosphoglycerate/phosphoenolpyruvate complex at 2.2-A resolution. Biochemistry 30, 2817–2822. doi:10.1021/bi00225a013
Lebioda, L., Stec, B., and Brewer, J. M. (1989). The structure of yeast enolase at 2.25-A resolution. An 8-fold beta + alpha-barrel with a novel beta beta alpha alpha (beta alpha)6 topology. J. Biol. Chem. 264, 3685–3693.
Lebioda, L., Stec, B., Brewer, J. M., and Tykarska, E. (1991). Inhibition of enolase: the crystal structures of enolase-Ca2(+)-2-phosphoglycerate and enolase-Zn2(+)-phosphoglycolate complexes at 2.2-A resolution. Biochemistry 30, 2823–2827. doi:10.1021/bi00225a013
Lineweaver, C. H., and Schwartzman, D. (2003). “Seckbach part of a series on cellular origins and life in extreme habitats,” in Origins, ed. J. Seckbach (Dordrecht: Kluwer Academic), 233–248.
Lineweaver, H., and Burk, D. (1934). The determination of enzyme dissociation constants. J. Am. Chem. Soc. 56, 658–666. doi:10.1021/ja01318a036
Miller, S. R. (2003). Evidence for the adaptive evolution of the carbon fixation gene rbcL during diversification in temperature tolerance of a clade of hot spring cyanobacteria. Mol. Ecol. 12, 1237–1246. doi:10.1046/j.1365-294X.2003.01831.x
Murshudov, G. N., Vagin, A. A., and Dodson, E. J. (1997). Refinement of macromolecular structures by the maximum-likelihood method. Acta Crystallogr. D Biol. Crystallogr. 53, 240–255. doi:10.1107/S0907444996012255
Pace, N. R. (1991). Origin of life–facing up to the physical setting. Cell 65, 531–533. doi:10.1016/0092-8674(91)90082-A
Pal-Bhowmick, I., Sadagopan, K., Vora, H. K., Sehgal, A., Sharma, S., and Jarori, G. K. (2004). Cloning, over-expression, purification and characterization of Plasmodium falciparum enolase. Eur. J. Biochem. 271, 4845–4854. doi:10.1111/j.1432-1033.2004.04450.x
Peak, M. J., Peak, J. G., Stevens, F. J., Blamey, J., Mai, X., Zhou, Z. H., et al. (1994). The hyperthermophilic glycolytic enzyme enolase in the archaeon, Pyrococcus furiosus: comparison with mesophilic enolases. Arch. Biochem. Biophys. 313, 280–286. doi:10.1006/abbi.1994.1389
Poyner, R. R., Laughlin, L. T., Sowa, G. A., and Reed, G. H. (1996). Toward identification of acid/base catalysts in the active site of enolase: comparison of the properties of K345A, E168Q, and E211Q variants. Biochemistry 35, 1692–1699. doi:10.1021/bi952186y
Rader, A. J., Hespenheide, B. M., Kuhn, L. A., and Thorpe, M. F. (2002). Protein unfolding: rigidity lost. Proc. Natl. Acad. Sci. U.S.A. 99, 3540–3545. doi:10.1073/pnas.062492699
Reed, G. H., Poyner, R. R., Larsen, T. M., Wedekind, J. E., and Rayment, I. (1996). Structural and mechanistic studies of enolase. Curr. Opin. Struct. Biol. 6, 736–743. doi:10.1016/S0959-440X(96)80002-9
Ronimus, R. S., and Morgan, H. W. (2003). Distribution and phylogenies of enzymes of the Embden-Meyerhof-Parnas pathway from archaea and hyperthermophilic bacteria support a gluconeogenic origin of metabolism. Archaea 1, 199–221. doi:10.1155/2003/162593
Schreier, B., and Hocker, B. (2010). Engineering the enolase magnesium II binding site: implications for its evolution. Biochemistry 49, 7582–7589. doi:10.1021/bi100954f
Schulz, E. C., Tietzel, M., Tovy, A., Ankri, S., and Ficner, R. (2011). Structure analysis of Entamoeba histolytica enolase. Acta Crystallogr. D Biol. Crystallogr. 67, 619–627. doi:10.1107/S0907444911016544
Schurig, H., Rutkat, K., Rachel, R., and Jaenicke, R. (1995). Octameric enolase from the hyperthermophilic bacterium Thermotoga maritima: purification, characterization, and image processing. Protein Sci. 4, 228–236. doi:10.1002/pro.5560040209
Sims, P. A., Menefee, A. L., Larsen, T. M., Mansoorabadi, S. O., and Reed, G. H. (2006). Structure and catalytic properties of an engineered heterodimer of enolase composed of one active and one inactive subunit. J. Mol. Biol. 355, 422–431. doi:10.1016/j.jmb.2005.10.050
Stec, B., and Lebioda, L. (1990). Refined structure of yeast apo-enolase at 2.25 A resolution. J. Mol. Biol. 211, 235–248. doi:10.1016/0022-2836(90)90023-F
Stellwag, E., Cronlund, M. M., and Barnes, L. D. (1973). Thermostable enolase from extreme thermophile Thermus aquaticus Yt-1. Biochemistry 12, 1552–1559. doi:10.1021/bi00732a014
Tamura, K., Dudley, J., Nei, M., and Kumar, S. (2007). MEGA4: molecular evolutionary genetics analysis (MEGA) software version 4.0. Mol. Biol. Evol. 24, 1596–1599. doi:10.1093/molbev/msm092
Tracy, M. R., and Hedges, S. B. (2000). Evolutionary history of the enolase gene family. Gene 259, 129–138. doi:10.1016/S0378-1119(00)00439-X
Vieille, C., and Zeikus, G. J. (2001). Hyperthermophilic enzymes: sources, uses, and molecular mechanisms for thermostability. Microbiol. Mol. Biol. Rev. 65, 1–43. doi:10.1128/MMBR.65.1.1-43.2001
Vinarov, D. A., and Nowak, T. (1998). pH dependence of the reaction catalyzed by yeast Mg-enolase. Biochemistry 37, 15238–15246. doi:10.1021/bi981047o
Wedekind, J. E., Reed, G. H., and Rayment, I. (1995). Octahedral coordination at the high-affinity metal site in enolase – crystallographic analysis of the mg-ii-enzyme complex from yeast at 1.9 angstrom resolution. Biochemistry 34, 4325–4330. doi:10.1021/bi00013a022
Winn, M. D., Ballard, C. C., Cowtan, K. D., Dodson, E. J., Emsley, P., Evans, P. R., et al. (2011). Overview of the CCP4 suite and current developments. Acta Crystallogr. D Biol. Crystallogr. 67, 235–242. doi:10.1107/S0907444910045749
Wold, F. (1971). “Enolase,” in The Enzymes, 3rd Edn, ed. P. D. Boyer (New York, London: Academic Press), 499–519.
Wold, F., and Ballou, C. E. (1957a). Studies on the enzyme enolase. I. Equilibrium studies. J. Biol. Chem 227, 301–312.
Wold, F., and Ballou, C. E. (1957b). Studies on the enzyme enolase. II. Kinetic studies. J. Biol. Chem 227, 313–328.
Xiong, J., Fischer, W. M., Inoue, K., Nakahara, M., and Bauer, C. E. (2000). Molecular evidence for the early evolution of photosynthesis. Science 289, 1724–1730. doi:10.1126/science.289.5485.1724
Yanyushin, M. F. (1988). Isolation and characterization of f1-atpase from the green nonsulfur photosynthesizing bacterium Chloroflexus aurantiacus. Biochemistry (Moscow) 53, 1120–1127.
Zhang, E., Brewer, J. M., Minor, W., Carreira, L. A., and Lebioda, L. (1997). Mechanism of enolase: the crystal structure of asymmetric dimer enolase-2-phospho-d-glycerate/enolase-phosphoenolpyruvate at 2.0 A resolution. Biochemistry 36, 12526–12534. doi:10.1021/bi9712450
Keywords: enolase, thermal stability, origin, evolution, hydropathy, green sulfur bacteria
Citation: Zadvornyy OA, Boyd ES, Posewitz MC, Zorin NA and Peters JW (2015) Biochemical and structural characterization of enolase from Chloroflexus aurantiacus: evidence for a thermophilic origin. Front. Bioeng. Biotechnol. 3:74. doi: 10.3389/fbioe.2015.00074
Received: 30 March 2015; Accepted: 08 May 2015;
Published: 01 June 2015
Edited by:
Noha M. Mesbah, Suez Canal University, EgyptReviewed by:
Luigi Mandrich, National Research Council, ItalyChiranjeevi Thulluri, Jawaharlal Nehru Technological University Hyderabad, India
Copyright: © 2015 Zadvornyy, Boyd, Posewitz, Zorin and Peters. This is an open-access article distributed under the terms of the Creative Commons Attribution License (CC BY). The use, distribution or reproduction in other forums is permitted, provided the original author(s) or licensor are credited and that the original publication in this journal is cited, in accordance with accepted academic practice. No use, distribution or reproduction is permitted which does not comply with these terms.
*Correspondence: John W. Peters, Department of Chemistry and Biochemistry, Montana State University, 230 Chemistry and Biochemistry Building, Bozeman, MT 59717, USA, john.peters@chemistry.montana.edu