Formic Acid Formation by Clostridium ljungdahlii at Elevated Pressures of Carbon Dioxide and Hydrogen
 Florian Oswald1*
 I. Katharina Stoll2
Michaela Zwick1
Sophia Herbig2
Jörg Sauer2
Nikolaos Boukis2
I. Katharina Stoll2
Michaela Zwick1
Sophia Herbig2
Jörg Sauer2
Nikolaos Boukis2  Anke Neumann1
- 1Technical Biology, Institute of Process Engineering in Life Sciences, Karlsruhe Institute of Technology, Karlsruhe, Germany
- 2Institute of Catalysis Research and Technology (IKFT), Karlsruhe Institute of Technology, Eggenstein-Leopoldshafen, Germany
Low productivities of bioprocesses using gaseous carbon and energy sources are usually caused by the low solubility of those gases (e.g., H2 and CO). It has been suggested that increasing the partial pressure of those gases will result in higher dissolved concentrations and should, therefore, be helpful to overcome this obstacle. Investigations of the late 1980s with mixtures of hydrogen and carbon monoxide showed inhibitory effects of carbon monoxide partial pressures above 0.8 bar. Avoiding any effects of carbon monoxide, we investigate growth and product formation of Clostridium ljungdahlii at absolute process pressures of 1, 4, and 7 bar in batch stirred tank reactor cultivations with carbon dioxide and hydrogen as sole gaseous carbon and energy source. With increasing process pressure, the product spectrum shifts from mainly acetic acid and ethanol to almost only formic acid at a total system pressure of 7 bar. On the other hand, no significant changes in overall product yield can be observed. By keeping the amount of substance flow rate constant instead of the volumetric gas feed rate when increasing the process pressure, we increased the overall product yield of 7.5 times of what has been previously reported in the literature. After 90 h of cultivation at a total pressure of 7 bar a total of 4 g L−1 of products is produced consisting of 82.7 % formic acid, 15.6 % acetic acid, and 1.7 % ethanol.
Introduction
Nowadays, most bulk chemicals are still based on fossil fuels, such as crude oil and natural gas. It is consensus that, due to dwindling resources and climate change, it is necessary to develop sustainable methods for the production of industrially relevant chemicals. In recent years, industrial exhaust gases, such as steel mill off-gas (Köpke et al., 2011) and synthesis gas (syngas), a mixture of H2, CO, and CO2, from gasification of biomass and waste streams, such as sewage sludge and municipal waste (Hammerschmidt et al., 2011; Rokni, 2015), as well as other C1 molecules came into focus as interesting substrates for biotechnological applications (Daniell et al., 2012; Bengelsdorf et al., 2013). Syngas fermentation uses acetogenic bacteria, a class of bacteria using a unique pathway (Müller, 2003) to combine two molecules of CO or CO2 via subsequent reactions into one molecule of acetyl-CoA (Diekert and Wohlfarth, 1994). Further conversion of acetyl-CoA yields acetate, ethanol, butyrate, butanol or 2,3-butandiol as natural products of this pathway. Of these, the formation of C2 molecules (acetate and ethanol) has the highest energy gain for acetogenic bacteria (Bengelsdorf et al., 2013) which are, therefore, the preferred products with reported concentrations of up to 59.3 g L−1 acetate (Kantzow and Weuster-Botz, 2016). A detailed view of the metabolic reactions of acetogenic bacteria can be found in Schuchmann and Müller (2014) or Bengelsdorf et al. (2013). Formic acid is a main intermediate of this pathway which has multiple industrial and commercial applications, such as feed preservation, textile and leather processing, latex coagulation, deicing of airfields, waste gas treatment and as a substitute for other inorganic and organic acids in cleaner formulations. Being a main product of anaerobic syngas fermentation, acetate can be used as carbon source by various organisms to produce substances of higher value. Interlinking anaerobic acetic acid production with aerobic production of malic acid (Oswald et al., 2016) or diesel fuels (Hu et al., 2016) are already shown feasible.
One parameter that limits productivity and growth of acetogenic microorganisms is the aqueous solubility of the sparingly soluble gases carbon monoxide and hydrogen. To achieve high productivity with those substrates, the mass transfer rate from the gaseous to the liquid phase is one of the limiting steps (Worden et al., 1997). Common approaches to enhance gas–liquid mass transfer are increasing the volumetric power input () or the volumetric gas feed rate (). Both leads to increased gas–liquid interfacial area due to smaller bubbles and to increased bubble residence times, thus increasing the volumetric gas–liquid mass transfer coefficient (kL a) (Bredwell and Worden, 1998). This approach, however, may not be economically feasible when producing low value products such as fuels (Bredwell et al., 1999). Gas–liquid mass transfer is commonly described by
with (c*−c) being the difference of saturation concentration and actual concentration of a compound at process conditions. Therefore, another possibility to increase gas–liquid mass transfer is to increase the solubility of the gaseous compound itself. This can be achieved by increasing the partial pressure of desired substances (Schmidt and Cooney, 1986). Applying Henry’s law of solubility of gaseous compounds in liquids to equation (1) results in (Vega et al., 1989a)
Where ci is the liquid concentration of compound i in M, Hi is the Henry’s solubility coefficient of i in M bar−1 and is the driving force expressed as difference in partial pressure of i in bar.
Some work addressing that approach has been done in the 1980s using Clostridium ljungdahlii (Vega et al., 1989b), Blautia producta (Vega et al., 1989a) and Clostridium sp. ATCC 29797, later described as Terrisporobacter glycolicus (Schmidt and Cooney, 1986). Vega et al. (1989b) report prolonged lag-phases in bottle experiments with C. ljungdahlii under increasing initial pCO and up to 2.53 bar absolute pressure and relate this to inhibition caused by increased levels of dissolved carbon monoxide. Comparable findings are reported for bottle experiments with B. producta growing on a gas mixture of 80 % CO and 20 % CO2 (Vega et al., 1989a). In 1993, the Department of Chemical Engineering of the University of Arkansas filed a report to the United States Department of Energy in which they describe continuous running cultivations with C. ljungdahlii in a stirred tank reactor (STR) under increased pressure with total system pressures up to 10.34 bar. They find that when the reactor is pressurized stepwise once the biomass starts to grow, no inhibitory effect of increased carbon monoxide partial pressure can be observed. Immediate pressurization of the STR resulted in reduced growth and productivity (Department of Chemical Engineering, University of Arkansas, 1993). For B. producta, Ko et al. (1989) calculated an inhibitory pCO of 0.81–1.01 bar employing a modified Monod-Model. Cultivation with only carbon dioxide and hydrogen in the gas stream would circumvent inhibition caused by carbon monoxide. For Acetobacterium woodii, studies with gas mixtures devoid of carbon monoxide can be found in Demler (2012) and Kantzow and Weuster-Botz (2016), which investigate the effect of increased but leave the effect of carbon dioxide partial pressure out of their consideration. Therefore, this work focuses on the effects of increased pressure on growth and product formation of C. ljungdahlii with a gas composition devoid of carbon monoxide. The aim of this work is to investigate if mass transfer limitation can be overcome and whether or not complete substrate utilization is possible by applying elevated pressure. Experiments in 1.5 L-scale are used to scale-up process parameters to 2.5 L-scale, where experiments at absolute system pressures of 1, 4, and 7 bar are conducted.
Materials and Methods
Culture Medium
If not stated differently, all chemicals are purchased from Carl-Roth (Germany). The organism used for this work is C. ljungdahlii DSM13528 which was kindly provided by the group of Peter Dürre, University of Ulm. Medium used for cultivation of C. ljungdahlii for both flask and bioreactor cultivation is based on Tanner (2007). It is prepared using strict anaerobic techniques and the detailed composition with 0.33 g ammonium chloride per liter medium can be found elsewhere (Oswald et al., 2016). The pH is adjusted to 5.9 using KOH before bottling. Bottles are anaerobized using a gas mixture containing 20 vol-% carbon dioxide in nitrogen (Air Liquide, France). After autoclaving at 121 °C, 1 g Cystein-HCl monohydrate and 5 g fructose per liter are added.
Cultivations in 1.5 L-Scale
Fermentations are conducted at 37 °C in Minifors bench-top stirred tank reactors (Infors-HT, Switzerland) as described in Oswald et al. (2016) but without a foam probe. Contraspum A 4050 HAC (Zschimmer und Schwarz, Germany) is used as an anti-foaming agent and one drop is added to the cultivation if found necessary. The gas flow rate in this scale is 43 mL min−1 (0.029 vvm). Gas composition used in this work is 53.3 vol-% H2 and 26.7 vol-% CO2 in nitrogen (Air Liquide, France). The headspace of the bioreactor is at atmospheric pressure. A stirrer set-up of two Rushton-Turbines and baffles inside the vessel ensures gas-liquid mixing at 800 min−1. Medium for bioreactor cultivations is prepared as described in Oswald et al. (2016). Bioreactors are inoculated with 10 % of their final volume of a pre-culture grown for 48 h at 37 °C with 5 g L−1 fructose as carbon and energy source.
Scale-Up to 2.5 L and Elevated Pressure
To ensure comparability of the results from 1.5 L-scale and 2.5 L-scale, geometric similarity between both scales needs to be given and important dimensionless numbers describing the process are kept constant. Figure 1 shows a schematic drawing of both reactor scales. The bioreactor for experiments in 2.5 L-scale is a stainless steel, double jacket vessel (VEB CLG – Chemieanlagenkombinat Leibzig-Grima, Germany) with an inner diameter D2.5 of 126 mm and a total volume of 4 L. It has been formerly used in high-pressure chemical catalysis. The total height of the internal space is 349 mm with a conical bottom of 54 mm height. For 1.5 L-scale experiments, a glass vessel from Infors with an inner diameter D1.5 of 110 mm, a total height of 270 mm, and a hemispherical bottom is used. With the fixed dimensions of the stainless steel vessel, the only possibility to keep d/D constant is by adjusting the stirrer diameter d2.5. Using the stirrer diameter from 1.5 L-scale d1.5 = 46 mm and the inner diameter of the glass vessel, d1.5/D1.5 calculates to 0.418. Transferring this to the measures of 2.5 L-scale results in d2.5 of 57.5 mm. The stirrer of the 2.5 L-scale is a proportional magnification of the stirrer in 1.5 L-scale.
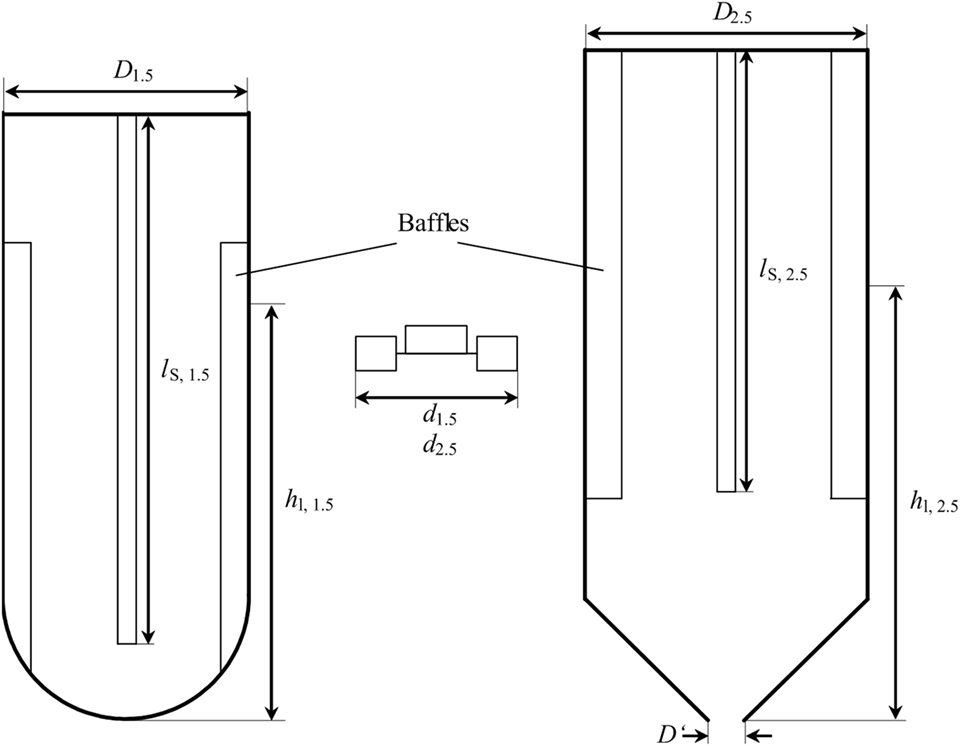
Figure 1. Schematic drawing of the stirred tank reactor used for 1.5 L scale (left) and 2.5 L scale (right). Between both is one of the two Rushton-Turbines used in each of the reactors. D1.5 = 110 mm, d1.5 = 46 mm, lS, 1.5 = 235 mm, hl, 1.5 = 176 mm, D2.5 = 126 mm, d2.5 = 52.7 mm, lS, 2.5 = 240 mm, hl, 2.5 = 234.6 mm. Filling level hl is without installed equipment (stirrer shaft, baffles, probes, sparger).
The geometric similarity representing stirrer positions would be 51.5 and 157 mm above the deepest part of the stainless steel vessel. As Figure 1 shows, the stirrer shaft (BüchiGlasUster, Switzerland) of the bigger scale does not reach into the conical part of the vessel. So a position of 51.5 mm above the deepest part of the reactor is not possible. Hence, the compromise is to calculate the stirrer positions, filling volume, and filing level from the cylindrical part of the vessel neglecting the conical bottom. Resulting stirrer positions are 105.5 mm and 211 mm above the deepest part of the vessel (including the conical part) and total filling level hl, 2.5 is 234.6 mm. This also affects the filling volume of the reactor without installed equipment, which is the volume of the 1.5 L-scale multiplied with (D2.5/D1.5)3 plus the volume of the conical part yielding a volume of 2.51 L.
Ju and Chase (1992) summarize different scale-up strategies from literature. Of those, the strategies used here are geometric similarity as well as constant kL a-value, stirrer speed and Ne number. Schlüter et al. (1992) state that if volumetric power input and volumetric gas feed rate are of the same value in both scales, then the volumetric mass transfer coefficient has the same value as well. Therefore, power input for 1.5 L-scale is measured as the difference in power uptake of stirring in air and stirring in 1.5 L of water and a gas feed rate of 0.029 vvm. Keeping Ne constant allows calculating the necessary stirrer speed at = constant to 757 min−1. The gas feed rate of the larger scale at one bar of absolute pressure calculates to 72 mL min−1.
The following pressure stages are investigated (in absolute pressure): 1, 4, and 7 bar at which the volumetric amount of substance flow rate is kept constant for all experiments. Gas is dispersed inside the reactor by a sintered metal plate at the end of a 1/4”-tube and pressurization of the bioreactor starts immediately after inoculation via closing the installed pressure regulator until the desired pressure is achieved. The medium composition is the same as for 1.5 L-scale and cultivation volume is 2.5 L. Each experiment is seeded with 10 % of the final volume of a 48 h, fructose grown culture. Cultivation temperature and pH-value are set to 37 °C and 5.9, respectively, and the stirrer speed and gas feed rate from above are applied. Maximum cultivation time is 90 h. Figure 2 shows the flow chart of the high-pressure reactor and its installed periphery. Mass flow of feed gas is controlled and regulated by a Coriolis force mass flow controller (Bronkhorst, Netherlands) and mass flow meter (MFM, Bronkhorst, Netherlands). Pressures higher than 1 bar absolute are regulated by a pressure regulator and sensory valve (Bronkhorst, Netherlands) positioned in the off-gas line behind the MFM. Off-gas composition is measured by a gas chromatograph (Shimadzu, Japan). Cultivation temperature is maintained via the double jacket and a thermostat (Haake, Germany) and the off-gas is cooled to minimize water loss through evaporation. A HPLC-pump (Bischoff, Germany) is necessary to control the addition of pH adjustment solutions through capillary tubes at pressures above 1 bar absolute. A six-port valve allows switching between 4 M H3PO4 and 4 M KOH. Both are kept under a nitrogen atmosphere. A second HPLC-pump (Bischoff, Germany) adds anti-foam agent (Zschimmer und Schwarz, Germany) in case the AF-electrode gives a signal. Gas streams are sterile filtered by a 0.2 μm sinter metal filter (Swagelok, Germany) before the feed gas enters the reactor and before the off-gas enters the pressure sensor. A check valve between the reactor and feed gas filter prevents liquid from the reactor to block the filter. ORP-probe (Corr Instruments, USA) and pH-probe (Corr Instruments, USA) for pressurized applications are mounted horizontally at half height through the sides of the reactor. The pH-probe is disinfected with isopropanol. It is installed after steam sterilizing the reactor at 121°C and before it is filled with medium due to a maximum temperature tolerance of the pH-probe of 80 °C.
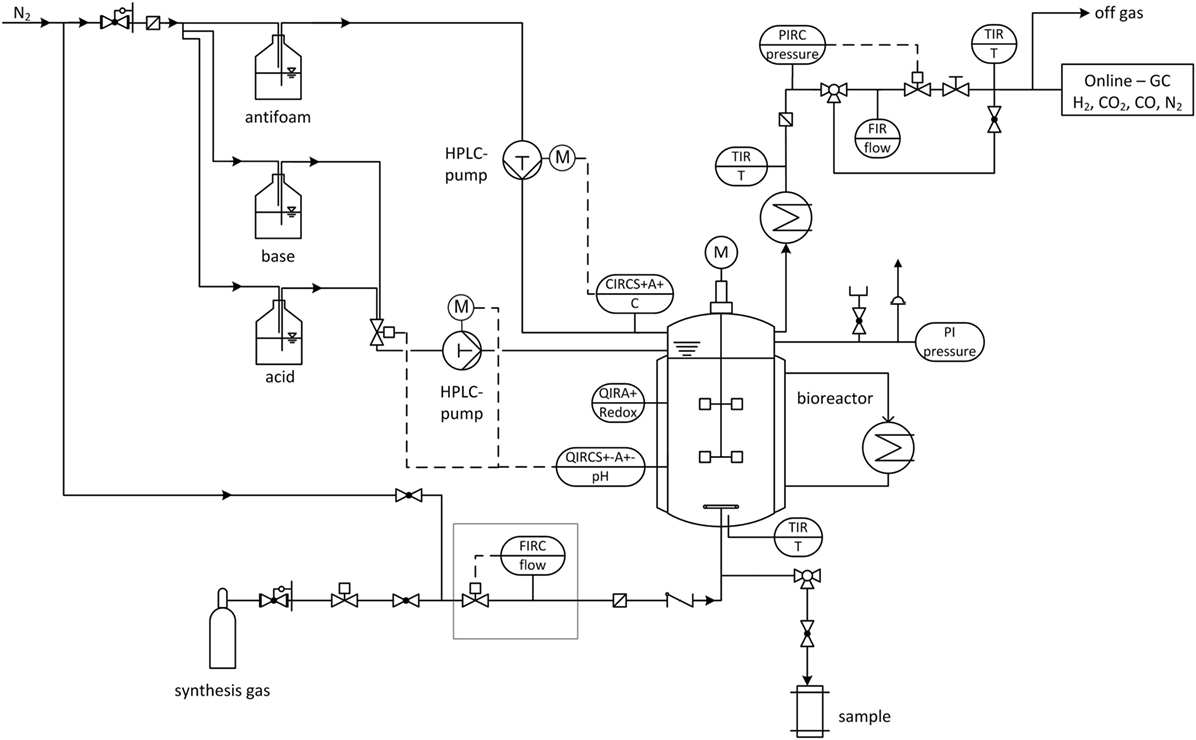
Figure 2. Flow chart of stirred tank reactor (STR) used for elevated pressure cultivations with installed periphery. FIRC, flow indication, recording and control; QIRCS+−A+−, pH indication, recording and control (pH probe); QIRA+, redox potential indication and recording (redox probe); CIRC, current indication, recording and control (AF-electrode); TIR, temperature indication and recording; PIRC, pressure indication, recording and control; FIR, flow indication and recording; PI, pressure indicator.
Analytics for all experiments with regard to off-gas and offline samples is conducted as described in Oswald et al. (2016). Formic acid concentration is determined using an enzymatic assay from Roche yellow line.
Results
Cultivations in 1.5 L-scale are conducted to establish a baseline for performance at atmospheric pressure with carbon dioxide and hydrogen as carbon end energy sources. The conditions of 1.5 L-scale are then transferred into 2.5 L-scale where experiments at absolute system pressures of 1, 4, and 7 bar are conducted.
Figure 3 shows the volumetric amount of substance flow rates in the off-gas of three fermentations in 1.5 L-scale. Initial carbon dioxide and hydrogen flow rates in the off-gas of 0.3 mmol min−1 L−1 (CO2) and 0.63 mmol min−1 L−1 (H2) continuously decrease until 60 h (CO2) and 63 h (H2), where they reach their local minimum of 0.18 mmol min−1 L−1 (CO2) and 0.35 mmol min−1 L−1 (H2), respectively. Here, C. ljungdahlii consumes 45 % of the ingoing hydrogen and 38 % of the ingoing carbon dioxide. From that point on, uptake rate of both gases decreases and reaches off-gas flow rates of 0.25 mmol min−1 L−1 for carbon dioxide and 0.49 mmol min−1 L−1 for hydrogen at the end of fermentation. Transferring the 1.5 L-scale to 2.5 L for pressurized experiments while keeping constant resulted in decreasing volumetric flow rates with increasing pressure. The volumetric amount of substance flow rates in off-gases from 2.5 L-scale are shown in Figure 4. Off-gas data from high-pressure fermentation at 1 bar of absolute pressure (HPF-1) shows a development comparable to the data of 1.5 L-scale in Figure 3. The three experiments summarized in HPF-1 (Figure 4) show some degree of variation in the development of hydrogen and carbon dioxide in the off-gas and thus have a higher standard deviation than the data from 1.5 L-scale. Off-gas data from high-pressure fermentations with 4 bar of absolute pressure (HPF-4) show a similar development as at 7 bar of absolute pressure (HPF-7). Hydrogen and carbon dioxide have a sharp decrease once the set pressure is reached and asymptotically increase to the initial flow rate. Pressure build up took 30 min for HPF-4 and 75 min for HPF-7. Complete consumption of substrates could not be achieved in any of the conducted fermentations.
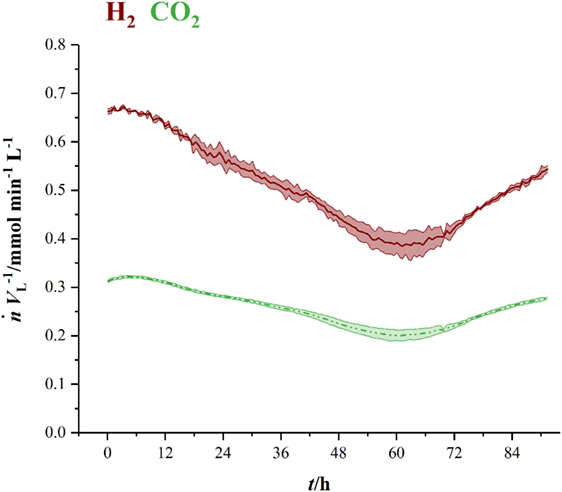
Figure 3. Amount of substance flow rates per liter medium for hydrogen (red, solid) and carbon dioxide (green, dashed) in the off-gas of 1.5 L-scale. Results are average values of three experiments. Standard deviation is indicated by the light colored area around the average lines.
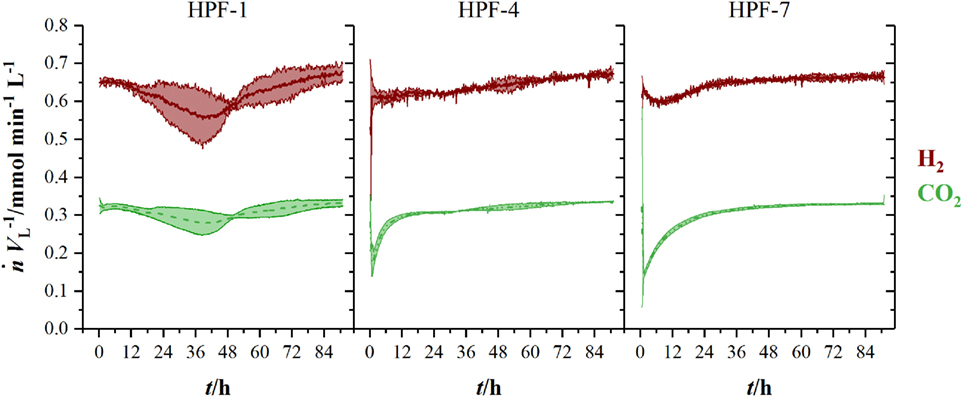
Figure 4. Amount of substance flow rates per liter medium for hydrogen (red, solid) and carbon dioxide (green, dashed) in the off-gas of 2.5 L-scale experiments. Results are average values of three experiments for HPF-1 and HPF-7 and two experiments for HPF-4. Numbers behind HPF indicate the absolute pressure of the fermentation in 2.5 L-scale. Standard deviation is indicated by the light colored area around the average lines.
Figure 5 shows the development of product concentrations over the course of the fermentations in 2.5 L-scale while Table 1 lists resulting product concentrations and consumed amount of substrates per liter reactor volume of experiments in 1.5 L-scale together with the results from HPF-1, HPF-4, and HPF-7. At atmospheric pressure, ethanol and acetic acid are the main products, their concentrations decrease with increasing pressure whereas formic acid concentration increases from final concentrations of 0.09 to 1.34 g L−1 at 4 bar and 3.23 g L−1 at 7 bar absolute pressure. Acetic acid production starts in all experiments immediately after inoculation while formic acid formation has its strongest increase between 12 and 28 h. The consumed amounts of substrates per liter reactor volume at atmospheric pressure in 2.5 L-scale are a third of the amounts in 1.5 L-scale. Whereas the overall consumption ratio E (consumed amount of substance divided by the total fed amount of substance in per cent) is about half the value from 1.5 L-scale. Comparing the biomass-specific uptake rates for hydrogen (qH2) and carbon dioxide (qCO2) shows only differences in the uptake of hydrogen. Experiments in HPF-1 show about twice the maximum uptake rates for hydrogen than the ones found for 1.5 L-scale. However, the replicates in HPF-1 divert significantly from each other as can be seen in the off-gas data in Figure 4. This results in rather high standard deviation. Despite the differences in overall consumption, the product yields based on consumed substrates (H2 and CO2) are quite similar with 0.67 g g−1 in 1.5 L-scale and 0.64 g g−1 in HPF-1. For experiments at 4 and 7 bar, no consumption data are available. As can be seen from the off-gas data in Figure 4, under pressurized conditions, no reasonable values for consumed substrates can be determined since the data resembles saturation curves for carbon dioxide at elevated pressures. Therefore, yields are additionally calculated based on totally fed substrates (aka overall YP/S). In 1.5 L-scale, an overall YP/S of 0.15 g g−1 is achieved whereas in 2.5 L-scale for HPF-1, HPF-4, and HPF-7 overall YP/S values of 0.05 g g−1, 0.04 g g−1, and 0.04 g g−1 are achieved, respectively. No significant increase in OD is observed at elevated pressures (data not shown).
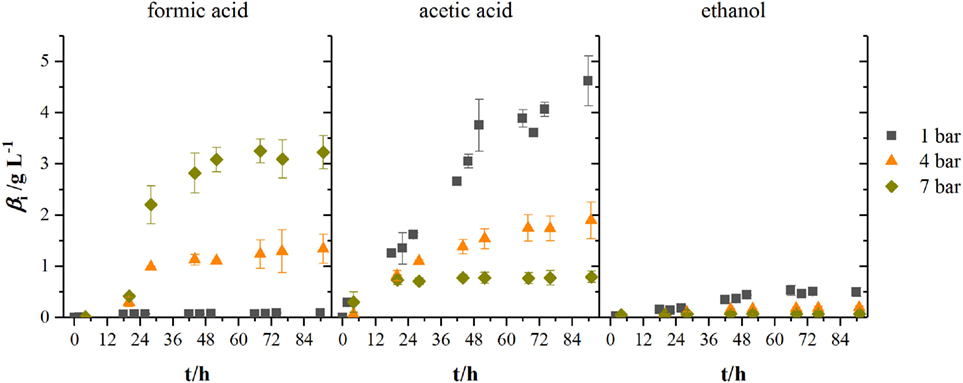
Figure 5. Development of product concentrations for formic acid, acetic acid, and ethanol at different headspace pressures. Results are average values of three experiments for HPF-1 (dark gray squares) and HPF-7 (dark yellow diamonds) and two experiments for HPF-4 (orange triangles). Numbers behind HPF indicate the absolute pressure of the fermentation in 2.5 L-scale.
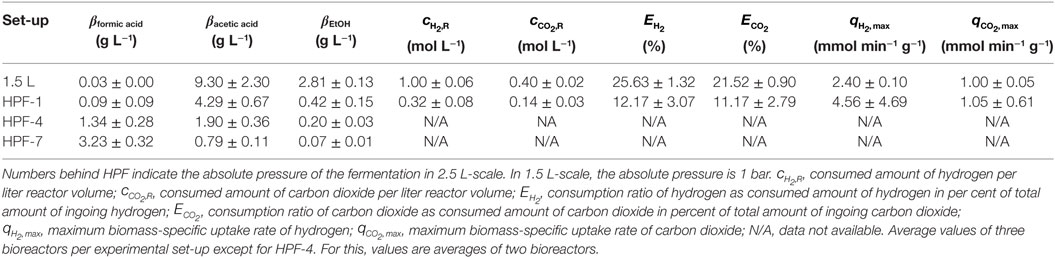
Table 1. Average values for products and consumed substrates from cultivations of Clostridium ljungdahlii with hydrogen and carbon dioxide as sole energy and carbon source at different pressures after 90 h of cultivation.
Due to the fact that in 2.5 L-scale the pH-probe is installed after the reactor is sterilized, contamination with Bacillus cereus can be found in all HPF cultivations. Blank cultivations without C. ljungdahlii inoculum but with the 0.1 g L−1 of fructose carried over from the pre-culture yield the same degree of contamination as the samples from experiments with C. ljungdahlii cells. Neither growth nor products can be found in these blank cultivations.
Discussion
Experiments in 1.5 L-scale are conducted at a kL a value of 10.2 10−3 s−1 (measured for oxygen in medium, data not shown) and since and are kept constant, the mass transfer coefficient should have the same value in 2.5 L-scale (Schlüter et al., 1992). Nevertheless, both scales do not show complete geometric similarity as outlined in the Section “Materials and Methods.” Those discrepancies from geometric similarity may explain the observed deviations in product concentration and substrate consumption between 1.5 and 2.5 L-scale at 1 bar absolute pressure. Supporting this are the YP/S values based on consumed substrates. For both scales, this yield is quite similar with the one from HPF-1 being only 4 % lower than the one found in 1.5 L-scale. That means that in both cases metabolic activity is similar since the same ratio of consumed substrates end up in products. Of far more interest in assessing the whole experimental set-up for 2.5 L-scale is the yield based on totally fed substrates during the fermentation. This value shows the overall conversion efficiency of the set-up and one aim of improving every process should be to bring this value as close to the yield based on consumed substrates as possible. For the case at hand, 15 % of gaseous substrates fed in 1.5 L-scale end up in products while in 2.5 L-scale only 5 % and at elevated pressures 4 % can be found in products. We interpret the high conformity of the values for 2.5 L-scale as indication that the found differences in substrate consumption and product concentration between scales at atmospheric conditions are due to incomplete geometric similarity and independent of absolute process pressure.
When looking at the product spectrum of the conducted experiments in Figure 5, the main thing that jumps the eye is that with increasing pressure the spectrum is shifted toward formic acid formation. At a total pressure of 7 bar almost no ethanol and only 0.8 g L−1 acetic acid are produced over the course of fermentation (see Figure 5) while a total of 3.2 g L−1 of formic acid is produced. Figure 6 shows the amount of substance ratios (xi = ci/Σci) of the products at the end of our cultivations at elevated pressure. It seems that at a of 2.13 bar (4 bar total pressure) formic acid and acetic acid are produced in equimolar amounts while at a of 3.73 bar (7 bar total pressure) values of x for formic acid and acetic acid seem to be inverted compared to experiments at atmospheric conditions. The data also suggest that in the range of from 0.5 to 3.37 bar (corresponding from 0.25 to 1.9 bar) there might be a linear relationship between xi and the substrate partial pressure. Increased formic acid production at elevated pressures with H2/CO2 is described by Bleichert and Winter (1994) for pure cultures of Methanobacterium formicicum and Methanobacterium palustre as well as for mixed cultures from sewage sludge at hydrogen partial pressures of more than 2 bar. Kantzow and Weuster-Botz (2016) and before them Peters et al. (1999) show that formic acid formation is linked to the hydrogen partial pressure in A. woodii. By shifting the hydrogen partial pressure from 1.4 to 2.1 bar, they increased final formic acid concentration after 74.4 h of cultivation from 4.2 to 7.3 g L−1 and increased the yield of formic acid per gram substrates fed of about 67 % (Kantzow and Weuster-Botz, 2016). Peters et al. (1999) report an increase in formic acid production for bottle experiments of 0.5 mM per 0.1 bar increase in initial . In A. woodii, the hydrogen dependent carbon dioxide reductase (HDCR) catalyzes the hydrogenation of CO2 with molecular hydrogen (Schuchmann and Müller, 2013) while in C. autoethanogenum, a close relative to C. ljungdahlii, the direct hydrogenation of CO2 with H2 is one of three possible reactions of the hydrogenase-formate dehydrogenase complex funneling CO2 into the methyl branch of the Wood–Ljungdahl pathway (Wang et al., 2013). The next reaction links formic acid and tetrahydrofolic acid (THF) in an ATP-consuming reaction. This poses as a bottleneck in the methyl branch since the specific activities of this and the following reactions of the methyl branch are lower than the one of the hydrogenase-formate dehydrogenase complex (Wang et al., 2013). As for the effect of increased substrate partial pressure, dissolved CO2 is in balance with the concentration of . Carbon dioxide can freely diffuse through the cellular membrane (Gutknecht et al., 1977) and immediately dissociates into and H+, thus acidifying the cytoplasmic pH. One consequence of that is a reduction in membrane potential (Eigenstetter and Takors, 2017) which results in reduced ATP yield from ATPase activity. Since acetogenic organisms are already at the energetic limit of life (Schuchmann and Müller, 2014) at these conditions, ATP formation is not high enough to provide enough energy for formyl-THF formation (Yang and Drake, 1990; Kantzow and Weuster-Botz, 2016). This yields to an accumulation of formic acid at increased substrate partial pressures and is in accordance with our finding that biomass formation is severely inhibited at increased partial pressures of carbon dioxide. Supporting this model further is the fact that in the work of Kantzow and Weuster-Botz (2016) with A. woodii no such severe effects are reported. The reason for this is that energy conservation is driven by a transmebrane gradient of sodium ions in A. woodii instead of a proton gradient (Spruth et al., 1995; Biegel and Müller, 2010). Therefore, a drop in internal pH will not result in immediate reduction of ATP formation.
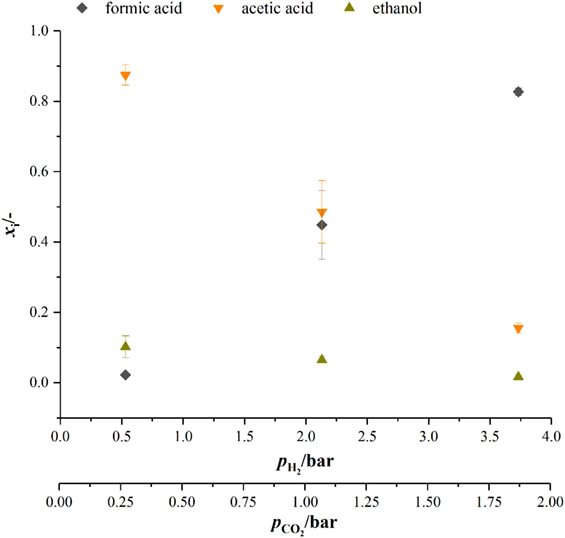
Figure 6. Amount of substance ratio for products at the end of cultivations at elevated pressure. dark gray diamonds, formic acid; orange upturned triangles, acetic acid; dark yellow triangles, ethanol.
Unfortunately, the only publications that state results from experiments with C. ljungdahlii at elevated substrate pressures so far do not report if formic acid production is increased at higher pressures. This may be because no formic acid is produced when working with CO containing gases at elevated pressures or more likely because the authors did not check for formic acid in their sample analytics. However, since we could not observe significant growth at 4 and 7 bar even without CO in the gas atmosphere growth inhibition at elevated pressures seems not to be linked to inhibitory effects of carbon monoxide alone, as reported by Vega et al. (1989b) and the Department of Chemical Engineering, University of Arkansas (1993).
At biological standard conditions, the formation of formic acid is scratch feasible. Increasing the partial pressure of hydrogen and carbon dioxide makes the reaction more favorable (Daniels, 1982), which in our opinion favors the direct hydrogenation of CO2 by the hydrogenase–formate-dehydrogenase complex. However, our results give that there is a non-linear relationship between formic acid formation and . For we get 17 mM bar−1 when increasing to 2.13 bar (4 bar absolute pressure) and 25.6 mM bar−1 when increasing further to 3.73 bar which is contrary to what Peters et al. (1999) report. They state a linear relationship of 0.5 mM formic acid produced per 0.1 bar increase in for A. woodii and A. carbinolicum (Peters et al., 1999).
In our cultivations at 4 and 7 bar, is 2.13 and 3.73 bar but volumetric power input and gas feed rate is lower than the ones used by Kantzow and Weuster-Botz (2016). From the data in their publication a yield of formic acid per fed substrates of 0.002 g g−1 can be calculated which is 14 % of what is reported here at similar with a overall YP/S for formic acid of 0.015 g g−1. This indicates that, despite the differences between 1.5 L-scale and 2.5 L-scale, working with constant yields a more substrate efficient process at elevated pressure than the classical approach of keeping constant does. While the approach of constant volumetric gas feed rate ensures constant kL a-values if is kept constant as well (Schlüter et al., 1992) even at elevated pressure (Maier et al., 2001), decreases with increasing pressure when is kept constant. The actual volumetric flow rates for each pressure stage in this work are 0.029 vvm (1 bar), 0.007 vvm (4 bar), and 0.004 vvm (7 bar). Under these conditions, the kL a-value cannot assumed to be equal in all pressure stages. But since kL is independent from pressure, an approximation for kL a at different pressures with = constant can be calculated by
The deviation of this equation can be found in the Supplementary Material. This equation has also been used in the work of Linek and Sinkule (1991). Approximation of kL a-values for oxygen in medium with equation (3) results in 4.0 10−3 s−1 at 4 bar and 2.8 10−3 s−1 at 7 bar. kL a-values for different gases are proportional to each other by the square root of the quotient of their diffusion coefficients (Kodama et al., 1976). However, the formation of formic acid is more substrate efficient at higher pressures when is kept constant although the gas–liquid mass transfer coefficient significantly decreases with increasing pressure.
Conclusion
Our experiments with C. ljungdahlii show that complete consumption of fed substrates could not be achieved by increasing the absolute system pressure although no clear statement about actual substrate consumption at elevated pressures is possible due to the reasons discussed earlier. However, our data show that although the product spectrum changes at increased substrate pressure, the overall product yield from fed substrates is quite similar for all pressure stages examined in 2.5 L-scale.
Increasing the absolute system pressure and, therefore, the partial pressure of hydrogen and carbon dioxide results in a shift of the product spectrum and formic acid becomes a product of significance. On the other hand, biomass formation decreased with increasing substrate pressures. Whether this inhibition of biomass growth is subject to an inhibitory effect of increased hydrogen partial pressures as assumed by Kantzow and Weuster-Botz (2016) or more likely due to inhibitory effects of increased dissolved carbon dioxide (Eigenstetter and Takors, 2017) remains a topic of interest for further investigations. It might be possible that with a stepwise increase in process pressure with a steady built-up of biomass negative effects of increased substrate pressures are avoidable. This has already been shown by the Department of Chemical Engineering, University of Arkansas (1993) with C. ljungdahlii and carbon monoxide containing gases to avoid inhibitory effects of increased dissolved carbon monoxide concentrations.
The approach presented here uses constant in all pressure stages and, therefore, the mass transfer coefficient decreases with each pressure step. However, yields of formic acid per fed substrate are 7.5 times higher than in processes with constant as published by Kantzow and Weuster-Botz (2016).
Further investigations on the influence of feed gas flow rate on the fed substrate based yield are necessary to increase substrate efficiency of anaerobic fermentation of gaseous carbon and energy sources. The complete usage of substrates is a crucial point in increasing the overall efficiency of such processes.
Nomenclature
| βI | Mass concentration of i |
| Driving force of mass transfer expressed as difference in partial pressure of i (bar) | |
| (c* − c) | Difference of saturation concentration and actual concentration of a compound at process conditions (mol L−1) |
| D1.5 | Inner diameter of reactor vessel in 1.5 L-scale (mm) |
| d1.5 | Stirrer diameter in 1.5 L-scale (mm) |
| D2.5 | Inner diameter of reactor vessel in 2.5 L-scale (mm) |
| d2.5 | Stirrer diameter in 2.5 L-scale (mm) |
| E | Consumed amount of substance divided by the total fed amount of substance (%) |
| Hi | Henry’s solubility coefficient of i (M bar−1) |
| hl 2.5 | Filling level in 2.5 L-scale (mm) |
| kLa | Volumetric mass transfer coefficient (s−1) |
| Volumetric amount of substance flow rate (mmol min−1 L−1) | |
| Volumetric power input (W L−1) | |
| Partial pressure of carbon dioxide (bar) | |
| Partial pressure of hydrogen (bar) | |
| Volumetric gas flow rate (vvm) | |
| xi | Amount of substance ratio calculated by xi = ci/Σci (−) |
| YP/S | Mass based product yield per substrate (g g−1) |
Author Contributions
FO: first idea and main design of experimental set-up for both scales. Scale-up from 1.5 to 2.5 L-scale. Supervision of experiments in 2.5 L-scale and execution of experiments in 1.5 L-scale. Sample analytics in all scales. Significant analysis and evaluation of results. Writing of the manuscript. IS: substantial performance of experiments and sample analytics in 2.5 L-scale. Critical revision of the manuscript. MZ: significant input on design of experimental set-up and supervision of experiments in 2.5 L-scale. Important input for evaluation of results and critical revision of the manuscript. SH: substantial input on reactor design and set-up of high-pressure vessel. Critical revision of the manuscript. JS: important support on the concept of the project and critical revision of the manuscript. NB: significant input on concept and experimental design in 2.5 L-scale. Critical revision of the manuscript. AN: substantial input on concept, experimental design, and evaluation of results. Critical revision of the manuscript.
Conflict of Interest Statement
The authors declare that the research was conducted in the absence of any commercial or financial relationships that could be construed as a potential conflict of interest.
Acknowledgments
We kindly thank Prof. Dr. Christoph Syldatk for his administrative and scientific support of this project. We also want to thank Stefan Henecka and Karl Weiss for their help with installing the high-pressure vessel and its periphery and Elena Hauer for her help during cultivations. The authors acknowledge the support by Deutsche Forschungsgemeinschaft and Open Access Publishing Fund of Karlsruhe Institute of Technology.
Funding
The work of FO was supported by a grant from the Ministry of Science, Research and the Arts of the State of Badem-Württemberg Az.: 33-7533-6-195/7/1 and Az. 33-7533-6-195/7/9 as part of the BW2 Graduate Program. We would like to thank the BMBF (Förderkennzeichen 03SFK2K0) and the Helmholtz-Gemeinschaft Deutscher Forschungszentren e.V for financing the main part of the R&D program.
Supplementary Material
The Supplementary Material for this article can be found online at http://www.frontiersin.org/articles/10.3389/fbioe.2018.00006/full#supplementary-material.
References
Bengelsdorf, F., Straub, M., and Dürre, P. (2013). Bacterial synthesis gas (syngas) fermentation. Environ. Technol. 34, 1639–1651. doi: 10.1080/09593330.2013.827747
Biegel, E., and Müller, V. (2010). Bacterial Na+-translocating ferredoxin:NAD+ oxidoreductase. Proc. Natl. Acad. Sci. U.S.A. 107, 18138–18142. doi:10.1073/pnas.1010318107
Bleichert, K., and Winter, J. (1994). Formate production and utilization by methanogens and by sewage sludge consortia – interference with the concept of interspecies formate transfer. Appl. Microbiol. Biotechnol. 40, 910–915. doi:10.1007/BF00173998
Bredwell, M., and Worden, R. (1998). Mass-transfer properties of microbubbles. 1. Experimental studies. Biotechnol. Prog. 14, 31–38. doi:10.1021/bp970133x
Bredwell, M. D., Srivastava, P., and Worden, R. M. (1999). Reactor design issues for synthesis-gas fermentations. Biotechnol. Prog. 15, 834–844. doi:10.1021/bp990108m
Daniell, J., Köpke, M., and Simpson, S. D. (2012). Commercial biomass syngas fermentation. Energies 5, 5372–5417. doi:10.3390/en5125372
Daniels, L. (1982). Comments on enzymatic synthesis of organic acids and alcohols from H2, CO2 and CO. Communications to the edtitor. Biotechnol. Bioeng. 24, 2099–2102. doi:10.1002/bit.260240916
Demler, M. (2012). Reaktionstechnische Untersuchung zur autotrophen Herstellung von Acetat mit Acetobacterium woodii. Dissertation, TU München.
Department of Chemical Engineering, University of Arkansas. (1993). High Pressure Synthesis Gas Conversion. Final Report. United States: Department of Energy.
Diekert, G., and Wohlfarth, G. (1994). Metabolism of homoacetogens. Antonie Van Leeuwenhoek 66, 209–221. doi:10.1007/BF00871640
Eigenstetter, G., and Takors, R. (2017). Dynamic modeling reveals a three-step response of Saccharomyces cervisiae to high CO2 levels accompanied by increasing ATP demands. FEMS Yeast Res. 17:1–11. doi:10.1093/femsyr/fox008
Gutknecht, J., Bisson, M. A., and Tosteson, F. C. (1977). Diffusion of carbon dioxide through lipid bilayer membranes: effects of carbonic anhydrase, bicarbonate, and unstirred layers. J. Gen. Physiol. 69, 779–794. doi:10.1085/jgp.69.6.779
Hammerschmidt, A., Boukis, N., Hauer, E., Galla, U., Dinjus, E., Hitzmann, B., et al. (2011). Catalytic conversion of waste biomass by hydrothermal treatment. Fuel 90, 555–562. doi:10.1016/j.fuel.2011.06.052
Hu, O., Chakraborty, S., Kumar, A., Woolston, B., Liu, H., Emerson, D., et al. (2016). Integrated bioprocess for conversion of gaseous substrates to liquids. Proc. Natl. Acad. Sci. U.S.A. 113, 3773–3778. doi:10.1073/pnas.1516867113
Ju, L.-K., and Chase, G. G. (1992). Improved scale-up strategies of bioreactors. Bioprocess Eng. 8, 49–53. doi:10.1007/BF00369263
Kantzow, C., and Weuster-Botz, D. (2016). Effects of hydrogen partial pressure on autotrophic growth and product formation of Acetobacterium woodii. Bioprocess Biosyst. Eng. 39, 1325–1330. doi:10.1007/s00449-016-1600-2
Ko, C. W., Vega, J. L., Clausen, E. C., and Gaddy, J. L. (1989). Effect of high pressure on a co-culture for the production of methane from coal synthesis gas. Chem. Eng. Commun. 77, 155–169. doi:10.1080/00986448908940178
Kodama, T., Goto, E., and Minoda, Y. (1976). Determination of dissolved hydrogen concentration and [KLa] in submerged culture vessels. Agric. Biol. Chem. 40, 2373–2377. doi:10.1271/bbb1961.40.2373
Köpke, M., Mihalcea, C., Liew, F., Tizard, J. H., Ali, M. S., Conolly, J. J., et al. (2011). 2,3-Butanediol production by acetogenic bacteria, an alternative route to chemical synthesis, using industrial waste gas. Appl. Environ. Microbiol. 77, 5467–5475. doi:10.1128/AEM.00355-11
Linek, V., and Sinkule, J. (1991). The influence of gas and liquid axial dispersion on determination of kL a by dynamic method. Trans. Inst. Chem. Eng. 69, 308–312.
Maier, B., Dietrich, C., and Büchs, J. (2001). Correct application of the sulphite oxidation methodology of measuring the volumetric mass transfer coefficient kL a under non-pressurized and pressurized conditions. Food Bioprod. Process. 79, 107–113. doi:10.1205/096030801750286267
Müller, V. (2003). Energy conservation in acetogenic bacteria. Appl. Environ. Microbiol. 69, 6345–6353. doi:10.1128/AEM.69.11.6345-6353.2003
Oswald, F., Dörsam, S., Veith, N., Zwick, M., Neumann, A., Ochsenreither, K., et al. (2016). Sequential mixed cultures: from syngas to malic acid. Front. Microbiol. 7:891. doi:10.3389/fmicb.2016.00891
Peters, V., Janssen, P. H., and Conrad, R. (1999). Transient production of formate during chemolithothrophic growth of anaerobic microorganisms on hydrogen. Curr. Microbiol. 38, 285–289. doi:10.1007/PL00006803
Rokni, M. (2015). Thermodynamic analyses of municipal solid waste gasification plant integrated with solid oxide fuel cell and stirling hybrid system. Int. J. Hydrogen Energy 40, 7855–7869. doi:10.1016/j.ijhydene.2014.11.046
Schlüter, V., Yonsel, S., and Deckwer, W.-D. (1992). Korrelation der O2-Stoffübergangskoeffizienten (kL a) in Rührreaktoren mit niederviskosen Fermentationsmedien. Chemie Ingenieur Technik 64, 474–475.
Schmidt, R. L., and Cooney, C. L. (1986). Production of acetic acid from hydrogen and carbon dioxide by Clostridium species ATCC 29797. Chem. Eng. Commun. 45, 61–73. doi:10.1080/00986448608911372
Schuchmann, K., and Müller, V. (2013). Direct and reversible hydrogenation of CO2 to formate by a bacterial carbon dioxide reductase. Science 342, 1382–1385. doi:10.1126/science.1244758
Schuchmann, K., and Müller, V. (2014). Autotrophy at the thermodynamic limit of life: a model for energy conservation in acetogenic bacteria. Nat. Rev. Microbiol. 12, 809–821. doi:10.1038/nrmicro3365
Spruth, M., Reidlinger, J., and Müller, V. (1995). Sodium ion dependence of inhibition oft he Na+-translocating F1F0-ATPase from Acetobacterium woodii. Probing the site(s) involved in ion transport. Biochim. Biophys. Acta 1229, 96–102. doi:10.1016/0005-2728(94)00192-8
Tanner, R. (2007). “Cultivation of bacteria and fungi,” in Manual of Enviromental Microbiology, 3rd Edn, eds C. J. Hurst, R. L. Crawford, J. L. Garland, D. A. Lipson, A. L. Mills, and L. D. Stetzenbach (Washington, DC: ASM Press), 69–78.
Vega, J. L., Clausen, E. C., and Gaddy, J. L. (1989a). Study of gaseous substrate fermentations: carbon monoxide conversion to acetate. 1. Batch culture. Biotechnol. Bioeng. 34, 774–784. doi:10.1002/bit.260340607
Vega, J. L., Prieto, S., Elmore, B. B., Clausen, E. C., and Gaddy, J. L. (1989b). The biological production of ethanol from synthesis gas. Appl. Biochem. Biotechnol. 2, 781–797. doi:10.1007/BF02936525
Wang, S., Huang, H., Kahnt, J., Mueller, A. P., Köpke, M., and Thauer, R. K. (2013). NADP-specific electron-bifurcating [FeFe]-hydrogenase in a functional complex with formate dehydrogenase in Clostridium autoethanogenum grown on CO. J. Bacteriol. 195, 4373–4386. doi:10.1128/JB.00678-13
Worden, R. M., Bredwell, M. D., and Grethlein, A. J. (1997). “Engineering issues in synthesis gas fermentations,” in Fuels and Chemicals from Biomass, ed. B. Saha (Washington, DC: American Chemical Society), 320–335. ACS Symposium Series.
Keywords: Clostridium ljungdahlii, high-pressure fermentation, acetogenic bacteria, acetic acid, formic acid, mass transfer
Citation: Oswald F, Stoll IK, Zwick M, Herbig S, Sauer J, Boukis N and Neumann A (2018) Formic Acid Formation by Clostridium ljungdahlii at Elevated Pressures of Carbon Dioxide and Hydrogen. Front. Bioeng. Biotechnol. 6:6. doi: 10.3389/fbioe.2018.00006
Received: 20 November 2017; Accepted: 15 January 2018;
Published: 12 February 2018
Edited by:
S. Venkata Mohan, Indian Institute of Chemical Technology (CSIR), IndiaReviewed by:
Deepti Agrawal, Indian Institute of Petroleum (CSIR), IndiaGopalakrishnan Kumar, Daegu University, South Korea
Copyright: © 2018 Oswald, Stoll, Zwick, Herbig, Sauer, Boukis and Neumann. This is an open-access article distributed under the terms of the Creative Commons Attribution License (CC BY). The use, distribution or reproduction in other forums is permitted, provided the original author(s) and the copyright owner are credited and that the original publication in this journal is cited, in accordance with accepted academic practice. No use, distribution or reproduction is permitted which does not comply with these terms.
*Correspondence: Florian Oswald, florian.oswald@kit.edu