Tsunami Hazard Analysis of Future Megathrust Sumatra Earthquakes in Padang, Indonesia Using Stochastic Tsunami Simulation
 Ario Muhammad
 Katsuichiro Goda
 Nicholas Alexander1
- 1Department of Civil Engineering, University of Bristol, Bristol, UK
- 2Department of Civil Engineering, University of Narotama, Surabaya, Indonesia
This study assesses the tsunami hazard potential in Padang, Indonesia probabilistically using a novel stochastic tsunami simulation method. The stochastic tsunami simulation is conducted by generating multiple earthquake source models for a given earthquake scenario, which are used as input to run Monte Carlo tsunami simulation. Multiple earthquake source models for three magnitude scenarios, i.e., Mw 8.5, Mw 8.75, and Mw 9.0, are generated using new scaling relationships of earthquake source parameters developed from an extensive set of 226 finite-fault models. In the stochastic tsunami simulation, the effect of incorporating and neglecting the prediction errors of earthquake source parameters is investigated. In total, 600 source models are generated to assess the uncertainty of tsunami wave characteristics and maximum tsunami wave height profiles along coastal line of Padang. The results highlight the influence of the uncertainty of the scaling relationships on tsunami simulation results and provide a greater range of tsunamigenic scenarios produced from the stochastic tsunami simulation. Additionally, the results show that for the future major earthquakes in the Sunda megathrust, the maximum tsunami wave height in Padang areas can reach 20 m and, therefore, significant damage and loss may be anticipated in this region.
Introduction
Located among three major plates, namely the Indian-Australian, the Pacific, and the Eurasian, Indonesia archipelago is one of the most seismically active regions in the world. In the last 20 years (1994–2014), 528 earthquakes occurred in Indonesia, i.e., about 26 earthquakes per year (United States Geological Survey (USGS), 2015). Sumatra Island is the most seismically active region since it is located at the interface between the Indian-Australian and Eurasian Plates. Two major seismic sources are the 1,900-km long Sumatran fault located along the center of Sumatra Island and the Sunda megathrust zone traversing more than 2,000 km along the western coast of Sumatra (Sieh and Natawidjaja, 2000). In the past two decades, several large earthquakes occurred along the Sunda megathrust including the Aceh-Andaman earthquake in December 2004 (Mw 9.15), the Nias earthquake in March 2005 (Mw 8.6), two earthquakes of Bengkulu in September 2007 (Mw 8.4 and 7.9), the Mentawai tsunamigenic earthquake in October 2010 (Mw 7.7), and the Indian Ocean earthquake in April 2012 (Mw 8.6). Two of the most devastating earthquake events among those were the 2004 Aceh-Andaman earthquake triggering large tsunamis along the coastal line of Sumatra, Thailand, Sri Lanka, and India with the casualties of more than 250,000 people and the 2005 Nias earthquake which killed 2,000 people (Hsu et al., 2006; Banerjee et al., 2007).
The 2004 Aceh-Andaman earthquake was caused by the 1,600-km long rupture of the Sunda megathrust starting from North of Simeulue Island to North of Andaman Islands (Meltzner et al., 2006). This failure led to another 400 km rupture of the megathrust fault in the southern part of Simeulue Island (see Figure 1) causing the Mw 8.6 2005 Nias earthquake (Briggs et al., 2006). A paleotsunami study based on a 1,000-year long record of tsunami deposits in North-West of Sumatra suggests that the occurrence interval of tsunamigenic earthquakes (Mw 9.15) from the Sumatra-Andaman region is about 600 years (Monecke et al., 2008). Although the devastating tsunami event might not occur in the next few centuries in the Sumatra-Andaman segment, the ruptures of the megathrust fault have increased the failure probability of the Mentawai segment of the Sunda megathrust areas (see Figure 1) which is located in South of the fault rupture areas of the 2004 and 2005 events (Nalbant et al., 2005; Chlieh et al., 2008; Sieh et al., 2008; Collings et al., 2012, 2013). The past seismicity in the Mentawai segment indicates that there were two major tsunamigenic events occurred in 1797 and 1833 (Mw ~8.8) that affected the coastal areas of Padang and Bengkulu. Geodetic and paleogeodetic studies indicate that the slip deficit accumulated in the Mentawai segment has already exceeded the slip occurred during the 1797 and 1833 earthquakes (Collings et al., 2013). A large earthquake in 2007 (Mw 8.4) that ruptured the Sunda megathrust near the 1833 rupture area was significantly smaller than the accumulated slip since the twin events of the 1797 and 1833 earthquakes (McCloskey et al., 2005; Nalbant et al., 2005). Hence, the possibility of earthquake and tsunami hazards in West of Sumatra from the Mentawai segment which has a recurrence interval of 200 years according to paleoseismological studies remains large (Sieh et al., 2008). In addition, the slip deficit is sufficient to generate a Mw 8.8–9.0 earthquake (Zachariasen et al., 1999; Sieh et al., 2008).
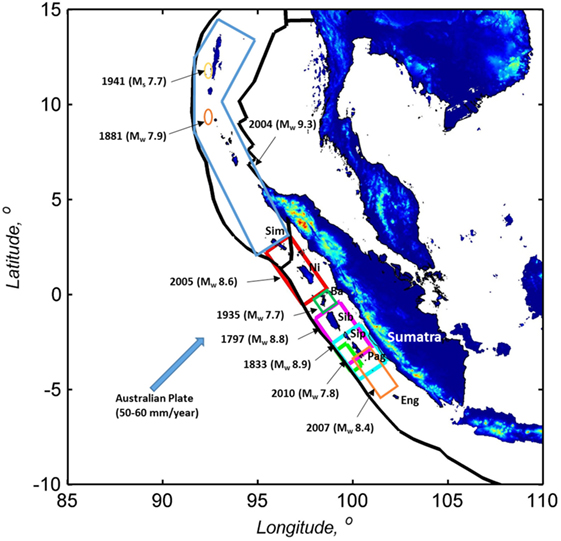
Figure 1. Historical recent seismic activities in the Sumatra areas (Sim: Simeulue, Ni: Nias, Ba: Batu Islands, Sib: Sibereut, Sip: Sipora, Pag: Pagai Islands, and Eng: Enggano).
Several earthquake source models have been developed with respect to the unruptured Mentawai segment (Borrero et al., 2006; Aydan, 2008; Griffin et al., 2016) and have been implemented to assess the earthquake and tsunami potential in several highly populated areas along the western coast of Sumatra, i.e., Padang, Painan, Bengkulu, and Pariaman (Borrero et al., 2006; McCloskey et al., 2008; Muhari et al., 2010, 2011). A wide range of rupture scenarios is essential for evaluating the earthquake and tsunami risk potential in coastal areas to capture worst (extreme) cases for emergency response preparedness and risk mitigation actions. However, except for the investigations by McCloskey et al. (2008) and Griffin et al. (2016), those studies implemented uniform slip models that oversimplify the earthquake source characteristics and considered a limited number of scenarios for future tsunamigenic events. On the other hand, McCloskey et al. (2008) considered the uncertainty of slip distribution by implementing the heterogeneous spatial distribution of slips based on a methodology proposed by Mai and Beroza (2002) and produced more than 100 scenarios to assess the tsunami hazards along the western coast of Sumatra. However, the events evaluated by Mai and Beroza (2002) were crustal earthquakes of magnitudes up to 8 and were not tsunamigenic. Recently, the Mai–Beroza method has been extended to apply to Mw 9.0 megathrust subduction earthquakes by adopting inverted source models from the 2011 Tohoku, Japan earthquake (Goda et al., 2014, 2015). Griffin et al. (2016) generated heterogeneous earthquake slips to assess tsunami hazard in Mentawai Islands based on the random slip modeling proposed by Gallovič and Brokešová (2004). Up to 15 million random slip models were generated using existing scaling relationships that were based on only seven subduction earthquake events in Sumatra and eventually 1,000 tsunami simulations from those slip models were further performed to assess the tsunami hazard in Mentawai Islands.
Moreover, those previous investigations for the Mentawai-Sunda subduction zone adopted the global empirical scaling relationships [e.g., Mai and Beroza (2002), Gallovič and Brokešová (2004), and Aydan (2008)] to generate only either deterministic fault geometry parameters (width and length) or slip distribution parameters without considering the uncertainty and relationships among earthquake source parameters. Recently, new probabilistic scaling relationships of fault geometry, slip statistics, and spatial slip heterogeneity parameters have been developed by Goda et al. (2016) using numerous inversion models (226 models) from the SRCMOD database (Mai and Thingbaijam, 2014) and can be used for tsunami hazard analysis. In those previous studies, the evaluation of regional earthquake source parameters from the finite-fault models of the past Sunda subduction earthquakes with respect to the global empirical relationships is also neglected. Hence, it is highly desirable to generate multiple earthquake source models by taking into account all relevant source parameters that are consistent with the regional source characteristics of the future tsunamigenic earthquakes in the Mentawai-Sunda zone.
Additionally, within the area of the Mentawai segment, Padang is one of the most anticipated areas to be affected by the tsunami compared to the other areas in the western coast of Sumatra. With the total population of 850,000 people, the social and economic impacts due to the future tsunamigenic earthquakes are high. The investigations considering multiple earthquake scenarios by McCloskey et al. (2008) and Griffin et al. (2016) only estimated the maximum tsunami height along the western coast of Sumatra and assessed the tsunami hazard in Mentawai Islands but excluded a rigorous evaluation in Padang areas. Moreover, the past tsunami hazard assessment studies in several important cities along the western coast of Sumatra, i.e., Padang, Painan, and Bengkulu, were performed using deterministic earthquake scenario approaches only (Borrero et al., 2006; Li et al., 2012). Therefore, it is important to apply the stochastic tsunami simulation method to assess the tsunami hazard in Padang probabilistically due to the future megathrust earthquakes in the Mentawai segment of the Sunda subduction zone.
The main objectives of this study are (1) to develop stochastic earthquake slip models for the future tsunamigenic earthquakes in the Mentawai segment of the Sunda subduction zone, (2) to evaluate the impact of stochastic earthquake slip on tsunami simulation results in terms of tsunami wave profiles and maximum tsunami height along the coastal line of Padang by considering the uncertainty and dependency of the earthquake source parameters, and (3) to assess the tsunami hazard in Padang using a wide range of earthquake scenarios generated from the novel stochastic tsunami simulation method. Extensive tsunami simulation for the future tsunamigenic earthquakes is conducted by developing a large number of stochastic earthquake slip models for different magnitude ranges. Three magnitudes, i.e., Mw 8.5, Mw 8.75, and Mw 9.0, are selected to develop stochastic source models. The earthquake source parameters from the finite-fault models of the past Sunda subduction earthquakes are first calculated and then compared with the global scaling relationships developed by Goda et al. (2016) to validate the applicability of the global models to the Sunda subduction zone. The verified scaling relationships are further used to generate the earthquake source models for tsunami simulation. Uncertainty and dependency of the earthquake source parameters are taken into account in producing earthquake source models stochastically which have not been implemented in the past studies of the tsunami hazard analysis in West of Sumatra. In total, 600 synthetic earthquake slip models are generated to obtain multiple realizations of maximum tsunami wave heights at various locations in Padang areas. For validation purposes, the simulated tsunami wave profiles for the Mw 9.0 scenario are used to compare with the results by Muhari et al. (2010) because they used Mw 8.92 to define their earthquake source scenario. The tsunami hazard analysis in Padang areas are further performed by evaluating the tsunami wave height profiles and the maximum tsunami wave height along the coastal line of Padang.
In this study, the tsunamigenic earthquake potential of the Mentawai segment in the Sunda subduction zone is first discussed. The earthquake source parameters from the finite-fault models of the past Sunda subduction are further evaluated to determine the applicability of the global scaling relationships for the Mentawai-Sunda subduction zone. A summary of the stochastic tsunami simulation used in this study is then presented, and the stochastic source models for the Mentawai-Sunda megathrust are further developed. Subsequently, the main tsunami simulation results using different earthquake source models in Padang areas are discussed. To demonstrate the tsunami simulation results in comparison to the previous work, the results for the Mw 9.0 scenario are presented first. The tsunami simulation results for the other scenarios are then discussed to evaluate the tsunami hazard potential in Padang areas. Finally, the key conclusions of this work are drawn.
Tsunami Potential of the Mentawawi-Sunda Megathrust Zone
Extensive paleogeodetic, geodetic, and numerical modeling studies suggest that the potential of megathrust tsunamigenic earthquakes in the Mentawai segment of the Sunda subduction zone is high (Natawidjaja et al., 2006; McCloskey et al., 2008; Collings et al., 2012, 2013). The past seismicity in the Mentawai segment indicates that the most destructive historical event in this segment occurred in 1833. The shaking was reported from Bengkulu to Pariaman and near Pagai Islands. Tsunamis were observed along the western coast of Sumatra extending from Pariaman to Bengkulu due to this event. Bengkulu and Indrapura areas were greatly affected by the 1833 tsunamigenic event. The tsunami heights reaching 3–4 m were recorded near Padang. Another historical earthquake event occurred in 1797 produced a destructive tsunami at Padang and nearby. The shaking was the strongest in living memory in Padang, and the tsunami flow depth in Padang was about 5 m (Natawidjaja et al., 2006).
Rupture scenarios of the 1797 and 1833 earthquakes were developed based on the seismotectonic features, geodetic, and paleogeodetic measurements (see Figure 2). The seismotectonic study by Newcomb and McCan (1987) concluded that the rupture of the 1833 earthquake extended ~300 km from near Enggano Island in South to Batu Islands in North with the earthquake size of Mw 8.7–8.8. A paleogeodetic study by Natawidjaja et al. (2006) based on the measurements of the coral microatoll uplift confirmed that the uplift between 1 and 3 m occurred over a 170-km long stretch of the Sumatran outer arc ridge. Elastic dislocation modeling of those uplift data yielded the slip prediction of 9–18 m between 2°S and 5°S. The 220-km long rupture extension from the southern part of the uplift was defined as the south-eastern boundary of the 1833 fault rupture. In addition, the north-western limit of the rupture was likely to be at 2°S; the end point may be extended as much as 160 km farther North-West with much smaller amounts of slip. The North-West extension of 160 km beyond the rupture of the 1833 event was likely to stop at 0.5°S. The earthquake size was predicted in the range of Mw 8.7–8.9. On the other hand, the records of coral and microatoll uplift due to the 1797 earthquake showed that the 1797 event preceded the 1833 giant earthquake by 37 years. The south-eastern limit of the rupture was at about 3.2°S since the south-eastern limit of the uplift due to the 1797 event was on South Pagai Island. The slip was estimated to be in the range of 4–8 m with the depth from 34 to 50 km. In addition, the magnitude of the earthquake was estimated to be in the range of Mw 8.5–8.7 (Natawidjaja et al., 2006).
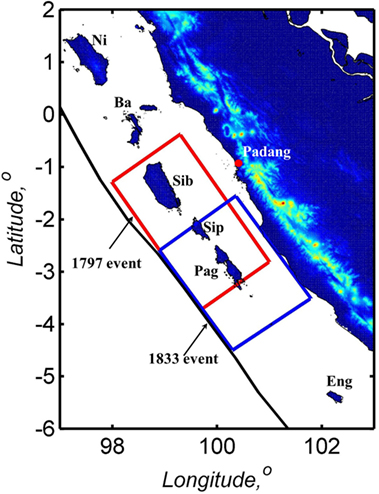
Figure 2. Geometry of earthquake source models of the 1797 and 1833 events (Ni: Nias, Ba: Batu Islands, Sib: Sibereut, Sip: Siora, Pag: Pagai Islands, and Eng: Enggano).
A recent significant earthquake occurred in the Mentawai segment was the Mw 8.4 12 September 2007 Bengkulu earthquake. Twelve hours later, a subsequent fault rupture produced another major earthquake of Mw 7.9. The geodetic and paleogeodetic modeling suggested that the rupture areas of these two events extended from North of Sipora Island at ~2°S to South of Pagai Islands at ~5°S. The maximum slip from this event is only a half of the maximum slip from the 1833 earthquake. Moreover, the total seismic moment released from the two earthquakes of Bengkulu in 2007 was significantly smaller than the 1833 rupture and the accumulated moment deficit since the last rupture in the Mentawai segment. Therefore, the potential for large tsunamigenic events in the Mentawai segment remains high (Konca et al., 2008). In addition, a 700-year sea-level change recorded in the corals of the Mentawai segment implies that the recurrence time of the major earthquakes, i.e., the sequence of the 1797 and 1833 earthquakes, is ~200 years (Sieh et al., 2008). At least two of the three ancient sequences began with events that were smaller than the main events and in this context, the 2007 earthquakes may be considered to be only the beginning of an episode of the rupture of the Sunda megathrust in the Mentawai segment (Sieh et al., 2008). The failure of the Mentawai segment may significantly affect the western coast of Sumatra specifically in Padang areas. With the plain topographic features and high population density in urban areas, Padang will face significant economic and social losses due to the future tsunamigenic event in the Mentawai segment of the Sunda subduction zone.
Earthquake Source Parameters for Sumatra Earthquakes
This study implements the stochastic tsunami simulation to assess the tsunami hazard in Padang areas. To run the stochastic tsunami simulation, earthquake source models need to be generated stochastically. Predicting the earthquake source parameters, i.e., the geometry of the fault, slip statistics, and spatial slip distribution parameters, are needed to generate earthquake source models. In order to generate the earthquake source parameters, the fault length (L), fault width (W), mean slip (Da), maximum slip (Dm), Box–Cox parameter (λ), correlation length along strike direction (Ax), correlation length along dip direction (Az), and Hurst number (H) of 19 finite-fault models of the past Sunda subduction earthquakes are calculated. The width, length, strike, and dip angles define the geometry of the fault plane, while the mean slip, maximum slip, and Box–Cox parameter characterize the slip statistics values. In addition, the correlation lengths and Hurst number are used to model the spatial heterogeneity of the slip values. Subsequently, the calculated earthquake source parameters of the past Sunda subduction earthquake are evaluated against the global scaling relationships developed by Goda et al. (2016). The global scaling relationships developed by Goda et al. (2016) will be adopted only if the calculated earthquake source parameters from the 19 finite-fault models of the Sunda subduction earthquakes are consistent with these global relationships. Otherwise, the global scaling relationship should be adjusted to account for the regional differences of the source parameters based on the finite-fault models of the past Sunda subduction earthquakes. Calculations of the earthquake source parameters of the finite-fault models from the past Sunda subduction earthquakes are based on the effective dimension analysis (Mai and Beroza, 2000), Box–Cox analysis, and spectral analysis (Mai and Beroza, 2002; Goda et al., 2014). The effective dimension analysis is carried out to calculate the width, length, mean slip, and maximum slip, while the Box–Cox analysis is used to characterize the probability distribution of the slip values. In addition, the spectral analysis is conducted to define the correlation lengths along dip and strike and the Hurst number. Figure 3 illustrates the procedures of earthquake source parameter estimation using the Konca et al. (2007) model from the 2007 Bengkulu earthquake event.
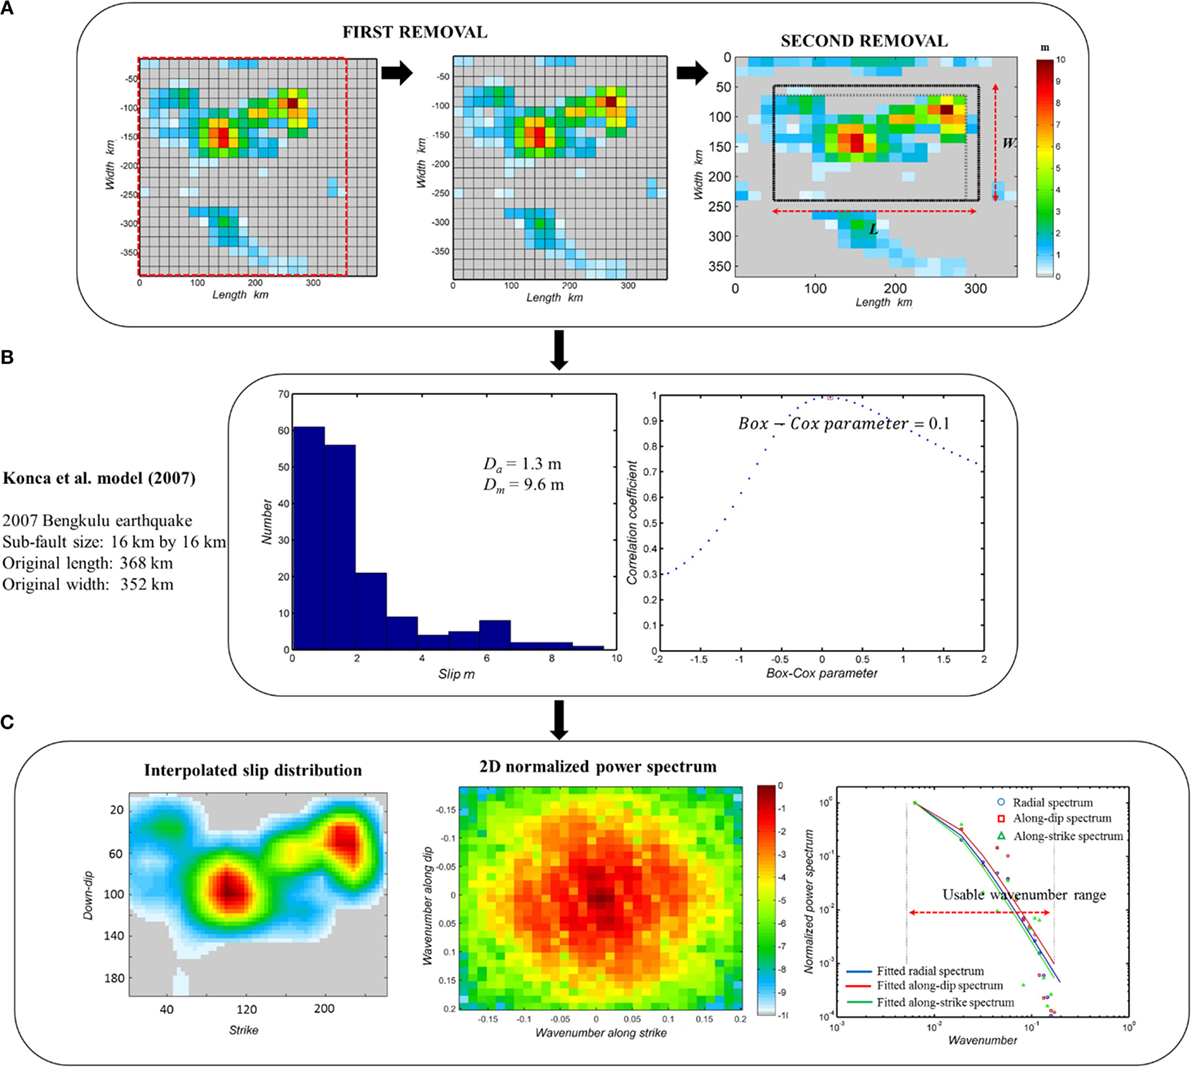
Figure 3. Procedures for source parameter estimation. (A) Effective dimension analysis. (B) Box–Cox analysis. (C) Spectral analysis.
First, the effective dimension analysis is carried out. The motivation to analyze the effective dimensions of the finite-fault models is because some of the finite-fault models have insignificant portions of slip located along the edges. The use of these insignificant portions may lead to overestimation of the rupture area and hence, it should be excluded from the source models. The insignificant portions of earthquake slip are removed in two steps. The first step is to simply trim the slip distribution when rows/columns having zero slip exist along the edges of the slip distribution. As shown in Figure 3A, three rows having zero slips are removed to produce a trimmed slip distribution. The second step is to determine the effective width and length by calculating the auto-correlation dimensions as defined by Mai and Beroza (2000). These dimensions, i.e., effective width and length, are then defined as W and L, respectively. Using the results from effective dimension analysis, the slip statistics parameters, Da and Dm, are calculated. The mean slip may be changed from the original mean slip due to the effective dimension analysis.
Second, using the effective dimension, the Box–Cox analysis is conducted to characterize the probability distribution of slip values within the fault plane by identifying the best power parameter (λ) to transform a non-normal random variable (X) to a normal random variable (Y) as presented in Eq. 1.
The Box–Cox parameters corresponds to the lognormal transformation if the λ = 0. The best power parameter (Box–Cox parameter) can be determined by calculating the linear correlation coefficient of the standard normal variable and the transformed variable of the slip values (after standardization). The Box–Cox parameter (λ) is then obtained based on the value that achieves the maximum linear correlation coefficient (see Figure 3B).
Third, Fourier spectral analysis is carried out to calculate spatial heterogeneity parameters of the slip, i.e., Ax, Az, and H. The Hurst number is used to characterize spectral decay as a function of wavenumber. Before carrying out spectral analysis, a cell-based grid of the finite-fault models is converted to a grid-based slip distribution and then the slip is interpolated using a selected grid spacing which is not smaller than one-fifth of the original grid resolution (left panel of Figure 3C). The interpolated grid-based slip distribution is then tapered using a Hanning window to control the edges of the rupture plane so that no significant slips occur along the rupture plane edges. Two-dimensional Fast Fourier Transform is calculated to obtain the 2D normalized power spectrum (middle panel of Figure 3C). The applicable wavenumber range for the spectral analysis is then defined by considering the original grid resolution and the characteristic size of the fault plane (right panel of Figure 3C). The circular average of the normalized wavenumber spectra is calculated, and the fractal dimension Df is defined based on the least squares fitting. The Hurst number is then calculated after converting from the fractal dimension (i.e., H = 3 − Df). Finally, Az and Ax are obtained by minimizing the norm between the along-dip/along-strike wavenumber spectrum and the analytical von Kármán model (Mai and Beroza, 2002) calculated using Eq. 2 by varying the correlation length along-dip/along-strike.
where P(k) is the power spectrum of von Kármán model and k is the wavenumber defined as, (Goda et al., 2016).
The results of estimated source parameters for the nineteen source models are shown in Table 1 and Figure 4. Fourteen from the 19 source models shown by model number 1–14 in Table 1 are part of the 226 models used in Goda et al. (2015). In Figure 4, scaling relationships for tsunamigenic earthquakes by Goda et al. (2016) are also included. These equations are summarized in Table 2, noting that they are indeed probabilistic prediction models that allow characterizing the prediction errors. In the equations, epsilon terms represent the prediction errors of the equations, and furthermore, their correlation coefficients are given in Table 3. The results shown in Figure 4 indicate that the estimated source parameters are in agreement with the scaling relationships; for most cases, the estimated parameters fall within the 16th to 84th percentile confidence interval of the prediction equations. Therefore, the use of the scaling relationships by Goda et al. (2016) for generating stochastic source models for the future tsunamigenic earthquakes in the Mentawai segment of the Sunda subduction zone can be justified. In Figure 4, the source parameters for the model 19 by Muhari et al. (2010) are shown with the red circle (see also Table 1). This model is used as a benchmark to be compared with stochastic tsunami simulation results in Padang areas.
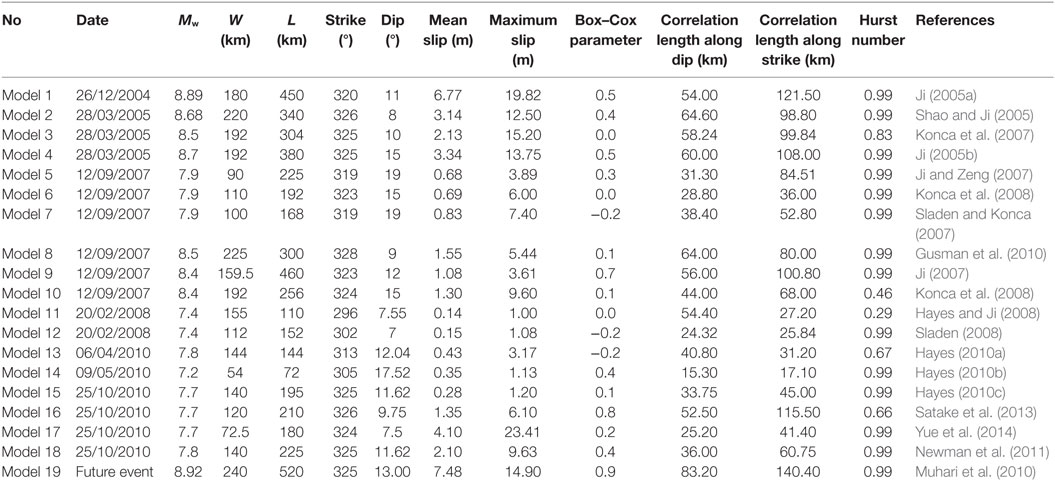
Table 1. Summary of earthquake source parameters for the 19 finite-fault models of the Sumatra subduction earthquakes.
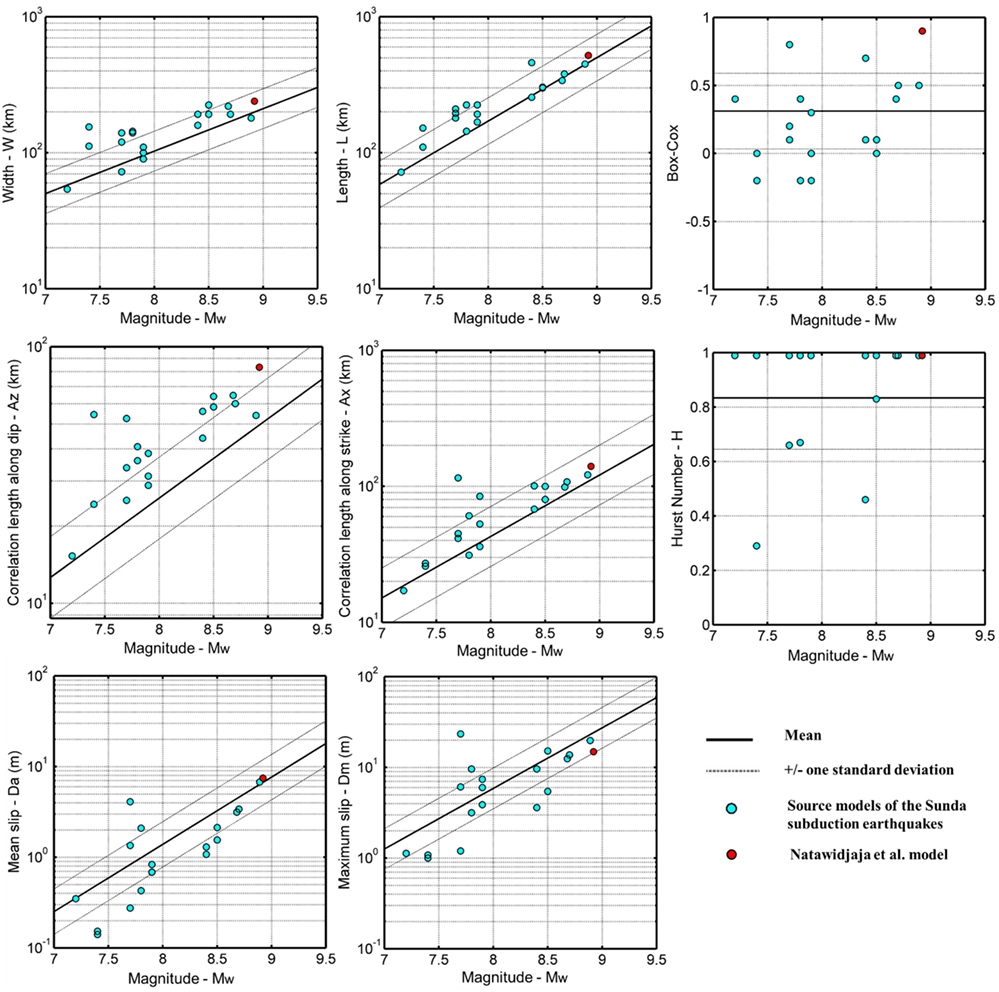
Figure 4. Comparison of the estimated source parameters for the 19 finite-fault models of the Sunda subduction earthquakes with the corresponding scaling relationships.
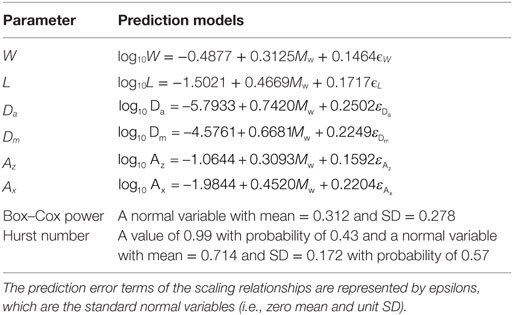
Table 2. Scaling relationships of the earthquake source parameters (Goda et al., 2016).
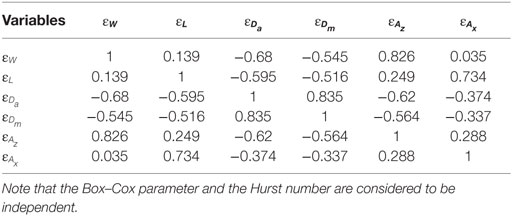
Table 3. Linear correlation coefficients of regression residuals of the scaling relationships for the six earthquake source parameters.
Stochastic Tsunami Simulation
The stochastic tsunami simulation can be conducted by generating multiple source models for a given earthquake scenario and by performing tsunami forward modeling iteratively. Figure 5 presents a computational flowchart of the stochastic tsunami simulation. In the following, detailed procedures of the stochastic tsunami simulation for the future tsunamigenic earthquake in the Mentawai segment of the Sunda subduction zone are explained.
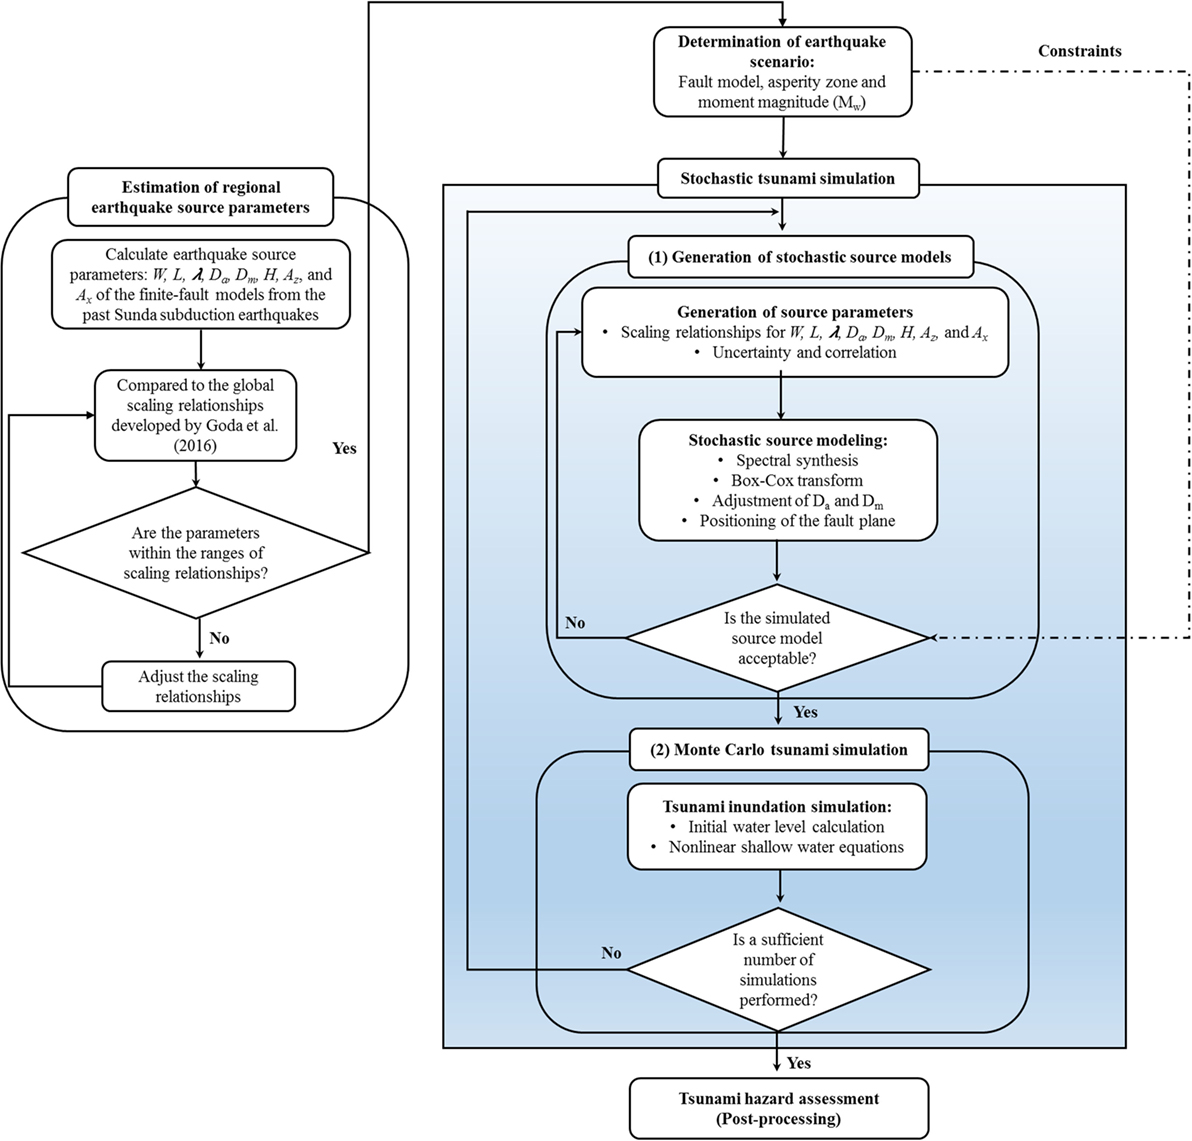
Figure 5. Flowchart of stochastic tsunami simulation.
Earthquake Scenarios and Fault Zone Model
Before running the stochastic tsunami simulation, earthquake scenarios (e.g., magnitude and source zone) need to be selected and a suitable fault rupture zone model (e.g., geometry and asperity zone) needs to be defined. The fault plane is used to model the source zone of the earthquake, while within the fault plane the so-called asperity zone is set up. When generating stochastic earthquake source models, the source zone of the earthquake is needed to define the area of earthquake source and the asperity zone is essential as the concentration region for certain amount of slip. In addition, the selected magnitude should be determined based on the purpose of the analysis. Since this work aims at assessing the tsunami hazards in Padang due to megathrust earthquakes from the Mentawai segment of the Sunda subduction zone, three magnitudes are considered: Mw 8.5, Mw 8.75, and Mw 9.0.
First, a possible source zone of the future tsunamigenic earthquakes in the Mentawai segment is defined based on source models for the past Sunda subduction earthquakes. The 19 source models of the past Sunda subduction earthquakes are used to determine the rupture areas for the future megathrust tsunamigenic earthquakes in the Mentawai segment (Table 1). The strike and dip angles of these models are typically in the range of 296° to 326° and 7° to 19°, respectively. A generic fault model covers the region of the Mentawai segment starting from North of Batu Islands to South of Enggano Island. The length and width of the Mentawai source zone are 920 and 250 km, respectively. The top-edge of the fault plane is located at a depth of 3 km. This depth is consistent with the past Mentawai finite-fault models developed for the 2010 Mentawai tsunamigenic earthquakes and the twin events of the 1797 and 1833 tsunamigenic Mentawai earthquakes which have the top-edge depth between 2 and 5 km (Newman et al., 2011; Satake et al., 2013; Philibosian et al., 2014; Yue et al., 2014). The fault plane has a constant strike angle of 325°. On the other hand, dip angles are varied depending on the depth. The dip angles for the depth from 3 to 10 km, from 10 to 17 km, from 17 to 29 km, and below 29 km are 8°, 10°, 12°, and 16°, respectively. These values are comparable to the slab models for the Sunda subduction zone produced by the USGS (Hayes et al., 2009, 2012). For stochastic source modeling and Monte Carlo simulation, the Mentawai source zone is discretized into 10 km by 10 km sub-faults. In stochastic source modeling, slip values that are consistent with considered spatial slip distribution features are generated.
Second, an asperity zone is set up within the fault plane of the source zone along with the required slip concentration range. The seismological knowledge of earthquake rupture in the target region must be reflected in the asperity zone. Basically, the asperity zone serves as crude constraints of the generated source model regarding the spatial distribution of earthquake slip within the fault plane. In generating the stochastic source models, a certain amount of slip must be concentrated within the target region. Generally, the determination of asperities of the future tsunamigenic earthquake in the Mentawai segment of the Sunda subduction zone is complex and involves large uncertainty (McCloskey et al., 2008; Philibosian et al., 2014). The interseismic coupling and coseismic slip modeling based on the paleogeodetic study confirm that the asperities in the Mentawai segment must be multiple. A future megathrust earthquake in the Mentawai segment may rupture similar to the scenarios of either the 1797 event or the 1833 event. This assumption is based on the paleogeodetic study that finds the potential of giant earthquakes is high in the Mentawai segment as the source earthquake region for the 1797 and 1833 events (Chlieh et al., 2008; Sieh et al., 2008). The asperity areas of the 1797 event are closer to Padang in comparison with those of the 1833 event (Philibosian et al., 2014). In addition, effects of the 1797 event in Padang in terms of ground shaking and flow depth were greater than the 1833 event. Therefore, the asperity zone of the future megathrust earthquake for tsunami hazard assessment in Padang is assumed to follow the asperity areas of the 1797 event (see Figure 6A).
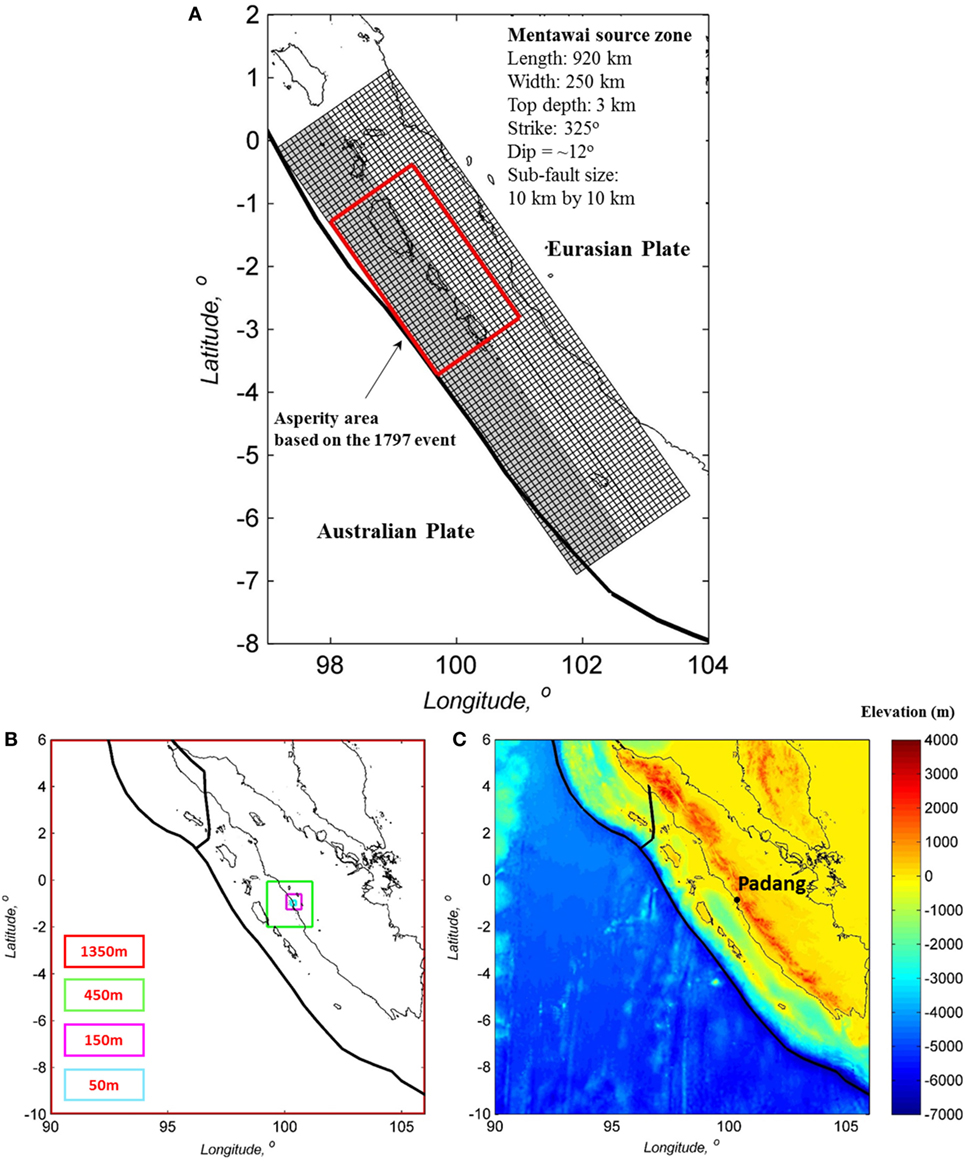
Figure 6. (A) Tsunami source zone. (B) Nested grid system for tsunami simulation in Padang. (C) GEBCO2014 bathymetry for the Sumatra region.
Stochastic Tsunami Simulation
Essentially, the stochastic tsunami simulation involves two main calculations, i.e., generation of stochastic source models and Monte Carlo tsunami simulation (Figure 5). First, earthquake source parameters, i.e., W, L, Da, Dm, λ, Az, Ax, and H, are generated using the prediction models (Tables 2 and 3). The uncertainty and correlation associated with the prediction models are taken into account in sampling the values of the earthquake source parameters from the multivariate normal distribution. To control the consistency of the generated earthquake source parameters, the simulated seismic moment (Mo = μWLDa, where μ is the rock rigidity which is set to 40 GPa) is compared with the target seismic moment defined by the scenario magnitude. The combination of W, L, and Da are calculated iteratively until the seismic moment criterion is satisfied (note: a tolerance of ±0.05 magnitude units is permitted).
Subsequently, a random slip field is generated using a Fourier integral method (Pardo-Iguzquiza and Chica-Olmo, 1993). The synthesized slip distribution is converted via Box–Cox transformation to achieve slip distribution with realistic positive skewness (Goda et al., 2014). To achieve the target mean slip Da and to avoid very large slip values exceeding the target maximum slip Dm, the transformed slip distribution is further adjusted. Next, the synthesized fault plane position is randomly located within the source region. The final synthesized earthquake slip model should be consistent with the seismotectonic features of the target region. For this purpose, two criteria for acceptance of the candidate slip model are implemented, i.e., the asperity area ratio of the candidate slip distribution is within the range of 0.2 and 0.3 and the simulated earthquake slip is more concentrated in the considered asperity region with the percentage range of 50–80%. Multiple slip distributions are generated iteratively until an acceptable source model is obtained which has all the expected features.
Once a realistic stochastic source model is generated, the initial water surface elevation is calculated using Okada (1985) and Tanioka and Satake (1996) formulae which consider the deformation due to both vertical and horizontal displacements of seafloor. Tsunami wave propagation is then evaluated by solving non-linear shallow water equations with run-up (Goto et al., 1997). The effects of surface roughness on tsunami flows are modeled through the Manning’s bottom friction formula with a uniform roughness coefficient of 0.025 m−1/3s. The fault rupture is assumed to occur instantaneously, while the duration of the simulation is set to 2 h and the time step for the simulation is 0.5 s, which satisfies the C.F.L. criterion for the bathymetry and elevation data for the Mentawi region.
For tsunami forward modeling, digital elevation model (DEM) and bathymetry data are needed. For the western coast of Sumatra, the bathymetry and elevation data are constructed from the publicly available data, i.e., GEBCO2014 (http://www.gebco.net/data_and_products/gridded_bathymetry_data/) and GDEM2 (https://asterweb.jpl.nasa.gov/gdem.asp). The nested grid systems of bathymetry and DEM having four resolutions are developed to assess the tsunami hazard in Padang due to the future tsunamigenic earthquakes in the Mentawai segment. The crudest grid is 1,350 m, while the finest grid is 50 m. To connect grid systems with different resolutions, two grids having different grid resolutions by a factor of 3 are considered. Therefore, the nested grid resolutions to carry out tsunami simulation in Padang are 1,350, 450, 150, and 50 m (Figure 6B). The 1,350 m region covers the entire region of West Sumatra.
The GEBCO2014 dataset is adopted for bathymetry data with the resolution of 30 arc-sec (~900 m). The bathymetry plot of the Sumatra region from GEBCO2014 is presented in Figure 6C. For DEM, the GDEM2 dataset having the resolution of 1 arc-sec (~30 m) is used. In this study, bathymetry data with a 50-m resolution are adopted to run the tsunami simulation in the shallow water and land regions. To develop such bathymetry datasets, GEBCO2014, GDEM2, and SRTM Water Body Data (SWBD), are merged by considering the resolution of 1 arc-sec (same as GDEM2). The merging of the datasets is conducted by simply substituting NaN (Not a Number) values (i.e., ocean areas) in GDEM2 with the GEBCO2014 data at the same coordinate, while all land elevations from the GEBCO2014 data are neglected. In addition, the coastal line data from SWBD are defined as “zero” in the merged dataset. Subsequently, linear interpolation is performed to produce a 1 arc-sec of the merged data. The merged and interpolated data are used to produce a 50 m resolution dataset along the coastal line of Padang areas. The use of the linear interpolation scheme is deemed as appropriate over other more complex schemes, such as spline interpolation, because at the near coastal line areas (where drastic changes of the spatial density of the data points are inevitable), complex interpolation methods may over-interpolate the topographical features.
Finally, the above simulation procedure is run iteratively until a sufficient number of acceptable source models are generated and their tsunami inundation heights at locations of interest are evaluated. The results from the Monte Carlo tsunami simulation are useful for evaluating variability of tsunami simulation results at different locations and for developing stochastic tsunami hazard maps (Goda et al., 2014).
Results and Discussion
The tsunami simulation results including the simulated tsunami wave height profiles and maximum tsunami heights along the coastal line are presented in this section by considering three magnitude scenarios (Mw 8.5, 8.75, and 9.0) and two cases ignoring and incorporating the uncertainty of the scaling relationships. The motivation to involve the uncertainty of the scaling relationships in the analysis is to assess the effect of incorporating the uncertainty of the scaling relationships to the tsunami simulation results. In addition, the height presenting in this section corresponds to the height of water flow above sea level. For each combination of magnitude scenario and uncertainty case, 100 stochastic source models are generated and used in Monte Carlo tsunami simulation. The stochastic tsunami simulation results from the Mw 9.0 scenario are used to investigate the sensitivity of the tsunami simulated wave profile and are compared with the reference results based on the Muhari et al. source model.
Tsunami Simulation Results: Mw 9.0 Scenario
Using the stochastic tsunami simulation results for the Mw 9.0 scenario, sensitivity analysis of the tsunami simulated wave profiles is carried out and presented in this section. The simulated tsunami wave profiles produced from Muhari et al. (2010) are used as a benchmark to demonstrate the tsunami simulation results. The earthquake source model considered by Muhari et al. (2010) is shown in Figure 7A. The model was developed based on the slip accumulation of the current locked zone in the Mentawai segment with the total sub-fault number of 348 and the sub-fault size of 20 km by 20 km. Its moment magnitude was Mw 8.92. The comparison results show that the Muhari et al. model is in agreement with the global scaling relationships (Figure 4). For each tsunami simulation run, tsunami waveforms are recorded at three points with the water depth of 5 m: Tabing (0.85°S and 100.34°E), Purus (0.88°S and 100.345°E), and Teluk Bayur (1°S and 100.38°E) as shown in Figure 9A. These points are selected because they were also considered by Muhari et al. (2010). In addition, the maximum tsunami wave height contours are recorded to investigate the inundated area in Padang.
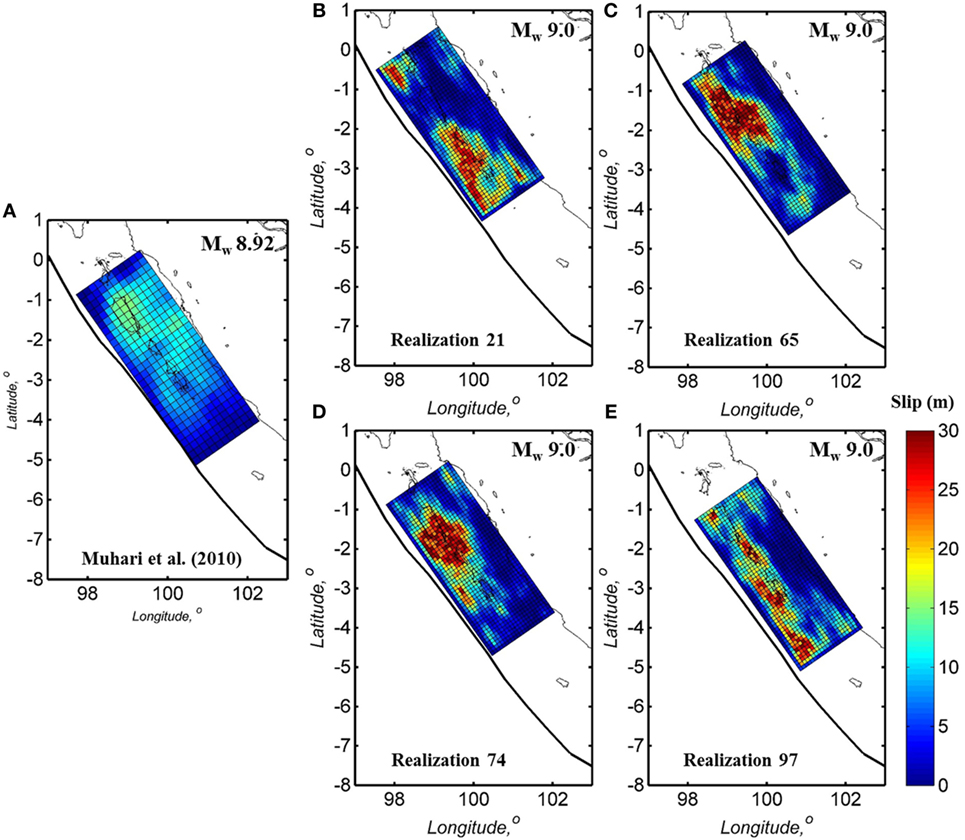
Figure 7. (A) Muhari et al. source model. (B–E) Stochastic source models for the future tsunamigenic earthquake scenario without considering the uncertainty of the scaling relationships.
Two sets of 100 stochastic source models are generated for the Mw 9.0 earthquake scenario to carry out the Monte Carlo tsunami simulation. The first set takes into account the uncertainty of the scaling relationships of the source models, while the second set does not. Figures 7 and 8 illustrate four realizations of the stochastic source models for the cases of including and excluding the uncertainty of the scaling relationships, respectively. The figures show that neglecting the uncertainty of the scaling relationships leads to identical dimensions (L and W) of the generated earthquake source models and the same slip statistics values for different realizations. For example, the generated values of Da and Dm for the Mw 9.0 scenario are 8 and 30 m, respectively, while the spatial slip distribution and location of the fault rupture within the overall source zone are varied. By contrast, incorporating the uncertainty of the scaling relationships results in variability of dimensions and slip statistics.
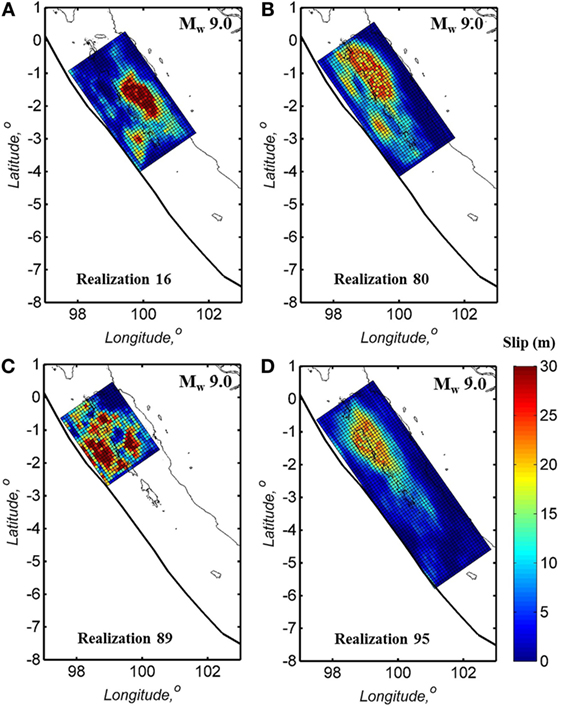
Figure 8. (A–D) Stochastic source models for the future tsunamigenic earthquake scenario by considering the uncertainty of the scaling relationships.
The tsunami wave profiles at three recording points produced from the 100 stochastic source models for the Mw 9.0 scenario generated without considering the uncertainty of the scaling relationships (Figure 7) are shown in the middle panels of Figures 9B–D, whereas similar results obtained based on the Muhari et al. source model are shown in the top panels of Figures 9B–D. The raw simulated data are shown with gray color and the median and 10th/90th percentiles of the simulated tsunami waveforms are illustrated with red line and blue line, respectively. Large variations in the temporal tsunami wave profiles are observed at the recording points 1 to 3 (P1 to P3). For instance, at the Teluk Bayur station (P3), the variations in the simulated results range from −5 to 15 m, while the range between the 10th and 90th percentiles varies from −5 to 12.5 m. These trends are also observed at the other two stations. The medians of the simulated tsunami wave profiles recorded at three stations demonstrate results that are comparable to the Muhari et al. model with the maximum tsunami height of about 5 m. In addition, the tsunami arrival time to the coastal areas of Padang based on the median simulation results and Muhari et al. results are also consistent, i.e., 20–25 min after the event. Furthermore, the tsunami simulation results based on the 100 stochastic source models generated by incorporating the uncertainty of the scaling relationships for the Mw 9.0 (Figure 8) are presented. The simulated tsunami wave profiles at three recording points are shown in the bottom panels of Figures 9B–D. In general, the medians of tsunami wave profiles are similar to those produced without considering the uncertainty of the scaling relationships. Large variations in tsunami wave heights are observed at those three points with the maximum tsunami height of 15 m. From the medians of the tsunami waveforms at three recording points, consistent tsunami waveforms compared to the Muhari et al. results are also demonstrated.
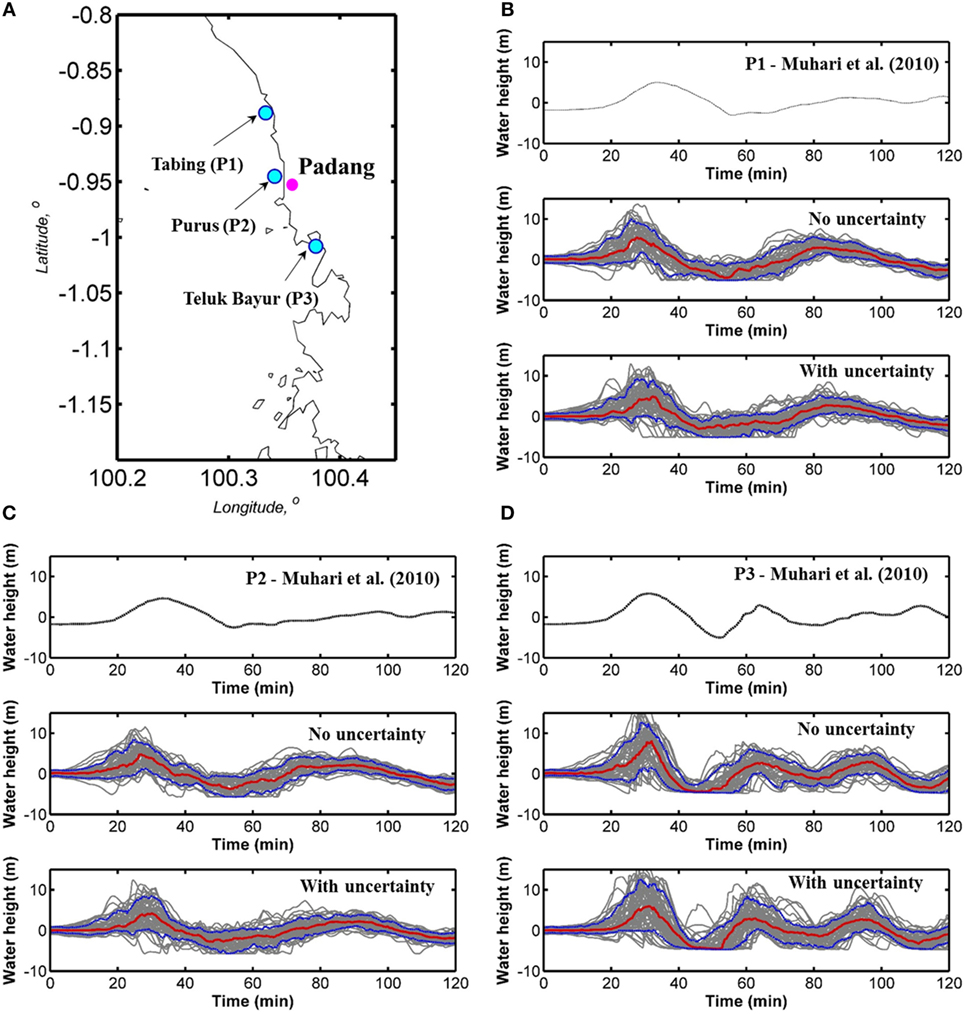
Figure 9. (A) Site location. (B) Tsunami wave profiles at the Tabing station (P1). (C) Tsunami wave profiles at the Purus station (P2). (D) Tsunami wave profiles at the Teluk Bayur station (P3).
To evaluate the differences of tsunami simulation results between excluding and including the uncertainty of the scaling relationships, 150 points are selected to record the maximum tsunami wave height along the coastal line of Padang starting from Tabing to Teluk Bayur (see Figure 10A). The median and the 10th/90th percentiles of maximum tsunami wave height profiles along the coastal line of Padang are shown in Figure 10B. In addition, the maximum tsunami wave height profiles from the 200 stochastic models excluding the uncertainty and including the uncertainty are presented in Figures 10C,D, respectively. The ranges between the 10th/90th percentiles of the maximum tsunami heights from those two cases show that the models with the uncertainty have greater variability in comparison to the models without the uncertainty. The range of the maximum tsunami wave height of the models considering the uncertainty is between 2.5 and 20 m, while the corresponding range for the models excluding the uncertainty is between 5 and 17.5 m. However, as observed from the tsunami wave profiles at the three recording stations, i.e., Tabing, Purus, and Teluk Bayur stations, the median of maximum tsunami wave profiles produced from these two calculation cases are similar (see black and green lines in Figure 10A).
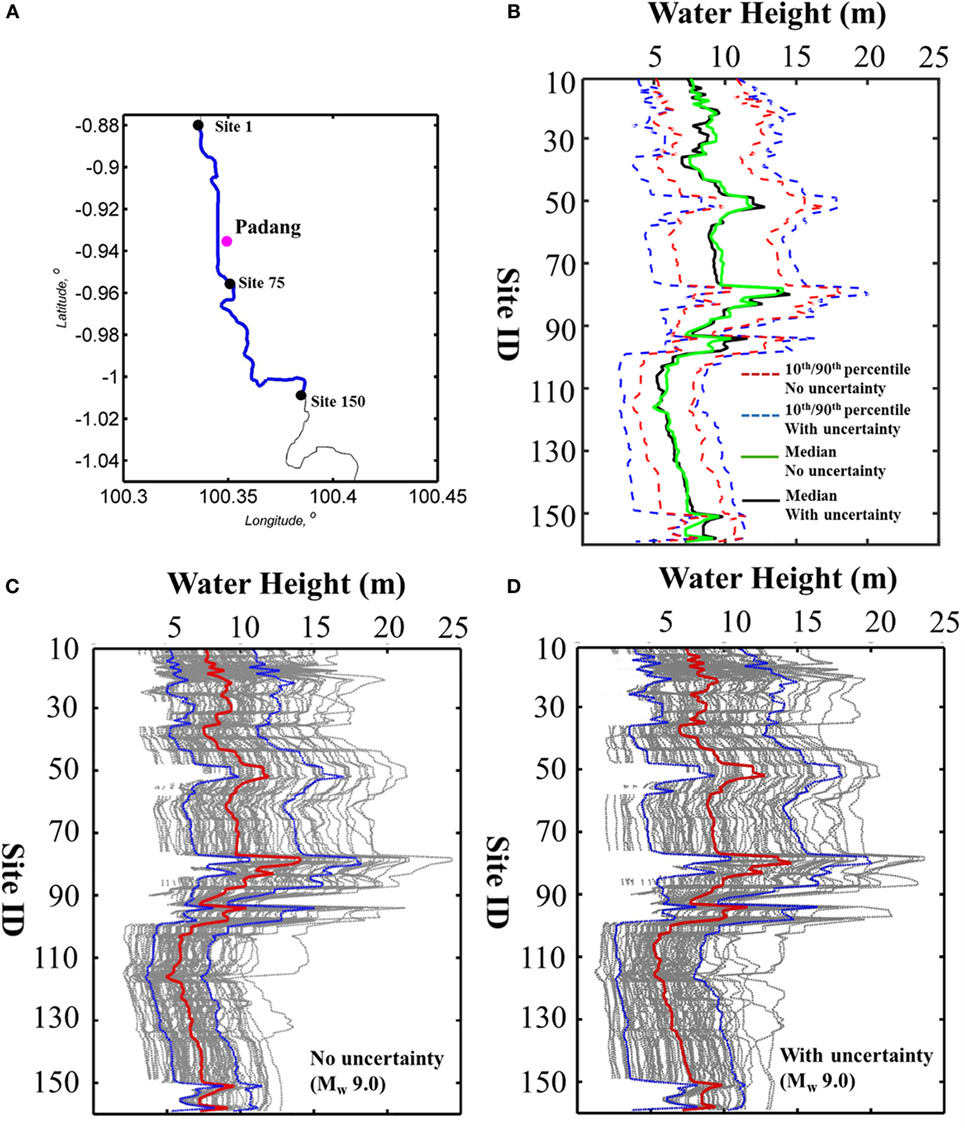
Figure 10. (A) Site location. (B) 10th/90th percentile of maximum tsunami wave height along the coastal line. (C) Maximum tsunami wave height profile along the coastal line without incorporating uncertainty. (D) Maximum tsunami wave height profile along the coastal line by incorporating uncertainty.
Tsunami Hazard Assessment in Padang: All Magnitude Scenarios
The tsunami simulation results produced from different magnitude scenarios are presented in this section. Figures 11–13 show the tsunami waveform results based on the stochastic source models for three scenario magnitudes, i.e., Mw 8.5, Mw 8.75, and Mw 9.0, both including and excluding the uncertainty of the scaling relationships recorded in Tabing, Purus, and Teluk Bayur stations, respectively. One hundred stochastic source models are used to run the tsunami simulation for each magnitude and uncertainty consideration (600 cases in total). In general, the large variation of wave amplitudes from the 10th and 90th percentile curves suggests that the earthquake slip model is an important source of uncertainty for the tsunami prediction. In addition, the tsunami waveforms from all three locations exhibit that the variation of tsunami wave heights increases with the magnitude. It can be seen that the 10th and 90th percentile curves vary significantly from the Mw 8.5 scenario to the Mw 9.0 scenario. For instance, at the Tabing station (P1), the percentiles range from −2 to 2 m for the Mw 8.5 scenario and the range increases to −5 to 10 m for the Mw 9.0 scenario. The median of the tsunami waveforms shows that the tsunami wave height increases by a factor of 2 for the increasing magnitude by 0.25 U. Additionally, the tsunami hazard in Padang areas can also be assessed from the maximum tsunami wave height along the coastal line of Padang areas (see Figure 10). These data show that the maximum tsunami wave height in Padang can reach 20 m in urban areas (Tabing–Purus) where many important public facilities exist (e.g., school, hospital, and gas station). Therefore, the economic and social losses can be significant.
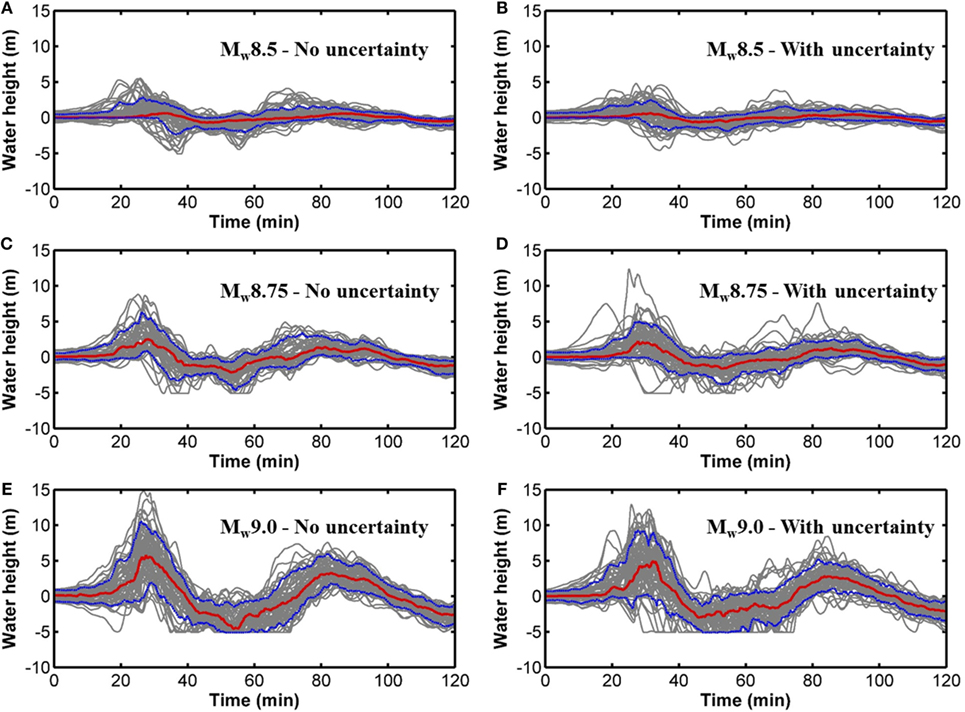
Figure 11. Tsunami wave profiles at the Tabing station (P1). (A) Mw 8.5 scenario without considering uncertainty. (B) Mw 8.5 scenario considering uncertainty. (C) Mw 8.75 scenario without considering uncertainty. (D) Mw 8.75 scenario considering uncertainty. (E) Mw 9.0 scenario without considering uncertainty. (F) Mw 9.0 scenario considering uncertainty.
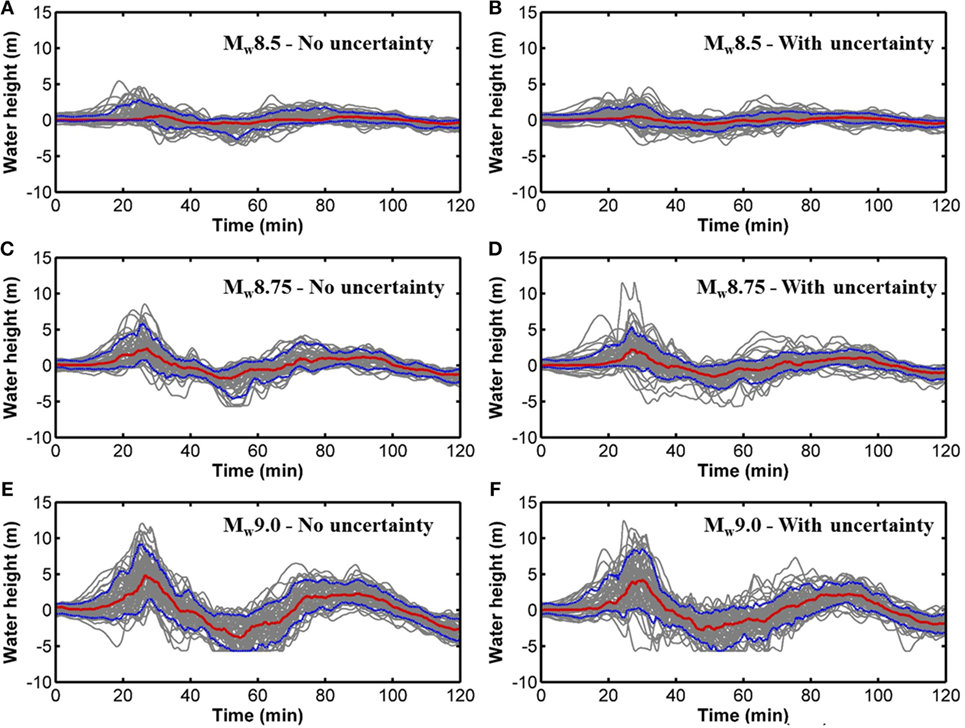
Figure 12. Tsunami wave profiles at the Purus station (P2). (A) Mw 8.5 scenario without considering uncertainty. (B) Mw 8.5 scenario considering uncertainty. (C) Mw 8.75 scenario without considering uncertainty. (D) Mw 8.75 scenario considering uncertainty. (E) Mw 9.0 scenario without considering uncertainty. (F) Mw 9.0 scenario considering uncertainty.
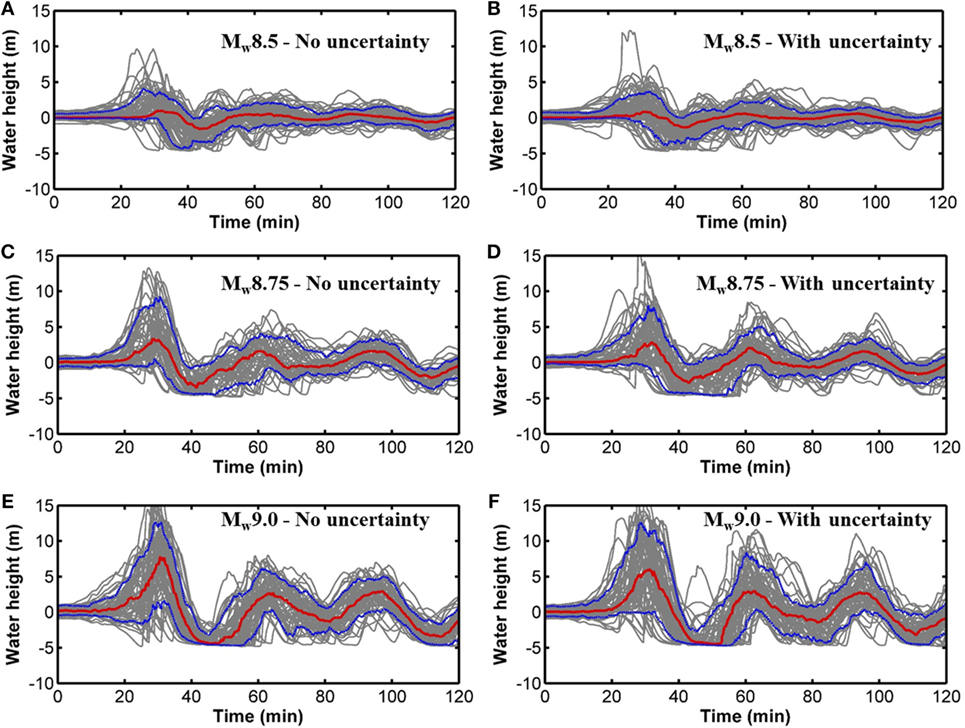
Figure 13. Tsunami wave profiles at the Teluk Bayur station (P3). (A) Mw 8.5 scenario without considering uncertainty. (B) Mw 8.5 scenario considering uncertainty. (C) Mw 8.75 scenario without considering uncertainty. (D) Mw 8.75 scenario considering uncertainty. (E) Mw 9.0 scenario without considering uncertainty. (F) Mw 9.0 scenario considering uncertainty.
Another important characteristic illustrated from the tsunami wave profiles for all scenarios is the feature of secondary waves (second and third waves) which are important to design an evacuation plan for the areas of interest. As presented at P1 and P3, the secondary wave heights for the scenarios of Mw 8.5 and Mw 8.75 are insignificant with the heights of below 1 m. However, the heights increase significantly when the Mw 9.0 scenario are considered. The medians of the second waves in Tabing and Purus areas (P1 and P2) reach ~3 m for both uncertainty considerations with the maximum height of 5 m for the 90th percentile. In the Teluk Bayur region (P3), the second and third waves increase drastically with the increasing magnitude. For instance, the maximum height from the 90th percentile of the second and third waves for the Mw 9.0 scenario without considering the uncertainty is ~5 m, while it is ~7.5 m for the case considering the uncertainty of the scaling relationships. The striking times of the second and third waves in those three locations are in the range of 60–90 min, respectively. With the expected maximum height of the secondary waves as much as 7.5 m within the period of 90 min after the earthquake, people living within the coastal region of Padang must evacuate earlier and stay out of the inundated areas otherwise the secondary waves may cause additional human loses. Moreover, by neglecting the uncertainty of the scaling relationships in generating the earthquake scenarios for the worst case (Mw 9.0), the tsunami hazard in terms of the maximum secondary wave heights is underestimated and hence, may oversimplify the evacuation plan in the target region.
The tsunami hazard evaluations using multiple scenarios show that Padang may face a significant risk due to the future tsunamigenic event from the Mentawai segment. In comparison to the multiple-earthquake scenario approach, a deterministic scenario is not complex and requires a less computational effort. Although the single scenario approach is straightforward to communicate with the hazard results with emergency officers and relevant stakeholders, the multiple-scenario approach can produce a greater range of tsunami scenarios and therefore, more informed decisions regarding evacuation and mitigation actions can be made. In addition, for the risk assessment, the worst scenarios may be more relevant for critical facilities, such as public evacuation facilities. It is critically important to capture the most devastating effect that may occur in the target region. Using the stochastic tsunami simulation approach, the worst scenario (Mw > 9.0 at different percentile levels) can be considered to predict the future tsunamigenic earthquake impact, and therefore, a probabilistic approach is recommended to be implemented for preparing a better tsunami mitigation system for the future event.
Conclusion
The main objective of this study was to assess the tsunami hazard in Padang due to the future tsunamigenic event from the Mentawai source region in terms of near-shore tsunami wave profiles and maximum tsunami wave height data along the coastal of Padang using a novel method namely stochastic tsunami simulation. Extensive tsunami simulation for the future tsunamigenic earthquakes was conducted by developing a large number of stochastic earthquake slip models for different magnitude ranges. The earthquake source parameters from the finite-fault models of the past Sunda subduction earthquakes were firstly calculated and then compared with the corresponding scaling relationships for global tsunamigenic earthquakes developed by Goda et al. (2016). The verified scaling relationships were further used to build the earthquake source models for tsunami simulation. Uncertainty and dependency of earthquake source parameters were taken into account in producing earthquake source models stochastically. In total, 600 synthetic earthquake slip models were generated to obtain multiple realizations of maximum tsunami wave heights at various locations in Padang areas. Three scenarios magnitudes, i.e., Mw 8.5, Mw 8.75, and Mw 9.0, were considered to generate the stochastic earthquake source models, while the asperity zone was based on the significant slip areas from the 1797 tsunamigenic event. The simulated tsunami wave profiles from the Mw 9.0 scenario were compared with the results from Muhari et al. (2010) that predicted the tsunami hazard in Padang areas using the earthquake source models developed from the slip accumulation. The tsunami hazard in Padang was further evaluated using the tsunami wave profiles and maximum tsunami wave height data based on 600 stochastic tsunami simulations.
The stochastic earthquake source models for the future tsunamigenic earthquake in the Mentawai segment of the Sunda subduction zone have been successfully developed and further used in stochastic tsunami simulation. The estimated median of the simulated tsunami wave profiles produced from stochastic tsunami simulation is acceptable in comparison to the results from Muhari et al. (2010). Incorporating the uncertainty of the scaling relationships results in a larger variability of tsunami hazard parameters in comparison to excluding the uncertainty of the scaling relationships. The magnitude of earthquake scenarios has significant influence on the hazard assessment. In particular, the tsunami hazard assessment in Padang indicated that this region may experience a significant tsunami event with the maximum inundation height of 20 m in main urban areas (Tabing-Purus). Therefore, it can be concluded that the tsunami risk potential in Padang is high due to the future tsunamigenic event from the Mentawai segment of the Sunda subduction zone. Importantly, multiple scenarios of tsunami simulation using the stochastic methodology can produce a greater range of tsunami scenarios and hence, can inform emergency officers and stakeholders of the tsunami risk for improving the better tsunami mitigation system in the target region.
Author Contributions
The three co-authors contributed equally to this work.
Conflict of Interest Statement
The authors declare that the research was conducted in the absence of any commercial or financial relationships that could be construed as a potential conflict of interest.
Acknowledgments
The first author is grateful to the Directorate General of Resources for Science, Technology and Higher Education, Ministry of Research, Technology and Higher Education of Indonesia which sponsor his PhD study. This work is also funded by the Engineering and Physical Sciences Research Council (EP/M001067/1). The bathymetry and elevation data for the Sumatra region were obtained from the GEBCO2014 database (http://www.gebco.net/data_and_products/gridded_bathymetry_data/) and the GDEM2 database (https://asterweb.jpl.nasa.gov/gdem.asp), respectively. The authors are grateful to Abdul Muhari, Hilman Natawidjaja, and Widjo Kongko who provide an earthquake source model for the future tsunamigenic event in the Mentawai segment and the bathymetry and elevation data for Padang.
References
Aydan, O. (2008). Seismic and tsunami hazard potentials in Indonesia with a special emphasis on Sumatra Island. J. Sch. Mar. Sci. Tech. 6, 19–38.
Banerjee, P., Nagarajan, B., Burgmann, R., and Pollitz, F. (2007). Coseismic slip distributions of the 26 December 2004 Sumatra-Andaman and 28 March 2005 Nias earthquakes from GPS static offsets. Bull. Seismol. Soc. Am. 97, S86–S102. doi:10.1785/0120050609
Borrero, J. C., Sieh, K., Chlieh, M., and Synolakis, C. E. (2006). Tsunami inundation modeling for western Sumatra. Proc. Natl. Acad. Sci. U.S.A. 103, 19673–19677. doi:10.1073/pnas.0604069103
Briggs, R. W., Sieh, K., Meltzner, A. J., Natawidjaja, D., Galetzka, J., Suwargadi, B., et al. (2006). Deformation and slip along the Sunda megathrust in the great 2005 Nias-Simeulue earthquake. Science 311, 1897–1901. doi:10.1126/science.1122602
Chlieh, M., Avouac, J. P., Sieh, K., Natawidjaja, D. H., and Galetzka, J. (2008). Heterogeneous coupling of the Sumatran megathrust constrained by geodetic and paleogeodetic measurements. J. Geophys. Res. 113, 1–31. doi:10.1029/2007JB004981
Collings, R., Lange, D., Rietbrock, A., Tilmann, F., Natawidjaja, D., Suwargadi, B., et al. (2012). Structure and seismogenic properties of the Mentawai segment of the Sumatra subduction zone revealed by local earthquake traveltime tomography. J. Geophys. Res. 117, B01312. doi:10.1029/2011JB008469
Collings, R., Rietbrock, A., Lange, D., Tilmann, F., Nippress, S., and Natawidjaja, D. (2013). Seismic anisotropy in the Sumatra subduction zone. J. Geophys. Res. Solid Earth. 118, 5372–5390. doi:10.1002/jgrb.50157
Gallovič, F., and Brokešová, J. (2004). On strong ground motion synthesis with k-2 slip distributions. J. Seismol. 8, 211–224. doi:10.1023/B:JOSE.0000021438.79877.58
Goda, K., Mai, P. M., Yasuda, T., and Mori, N. (2014). Sensitivity of tsunami wave profiles and inundation simulations to earthquake slip and fault geometry for the 2011 Tohoku earthquake. Earth Planet Space 66, 105. doi:10.1186/1880-5981-66-105
Goda, K., Yasuda, T., Mori, N., and Mai, P. M. (2015). Variability of tsunami inundation footprints considering stochastic scenarios based on a 2 single rupture model: application to the 2011 Tohoku earthquake. J. Geophys. Res. Oceans 120, 4552–4575. doi:10.1002/2014JC010626
Goda, K., Yasuda, T., Mori, N., and Maruyama, T. (2016). New scaling relationships of earthquake source parameters for stochastic tsunami simulation. Coastal Eng. J. 58, 40. doi:10.1142/S0578563416500108
Goto, C., Ogawa, Y., Shuto, N., and Imamura, F. (1997). Numerical Method of Tsunami Simulation with the Leap-Frog Scheme. IOC Manual. Paris, France: UNESCO. UNESCO, No. 35.
Griffin, J. D., Pranantyo, I. R., Kongko, W., Haunan, A., Robiana, R., Miller, V., et al. (2016). “Assessing tsunami hazard using heterogeneous slip models in the Mentawai Islands, Indonesia,” in Geohazards in Indonesia: Earth Science for Disaster Risk Reduction, eds P. R. Cummins and I. Meilano (London: Geological Society). Special Publications, 441.
Gusman, A. R., Tanioka, Y., Kobayashi, T., Latief, H., and Pandoe, W. (2010). Slip distribution of the 2007 Bengkulu earthquake inferred from tsunami waveforms and InSAR data. J. Geophys. Res. 115, B12316. doi:10.1029/2010JB007565
Hayes, G. P. (2010a). Updated Result of the Apr 6, 2010 Northern Sumatra Earthquake. Available at: http://equake-rc.info/SRCMOD/
Hayes, G. P. (2010b). Preliminary Result of the May 9, 2010 Mw 7.2 Northern Sumatra Earthquake. Available at: http://equake-rc.info/SRCMOD/
Hayes, G. P. (2010c). Result of the Oct 25, 2010 Mw 7.7 Southern Sumatra Earthquake. Available at: http://equake-rc.info/SRCMOD/
Hayes, G. P., and Ji, C. (2008). Preliminary Result of the Feb 20, 2008 Mw 7.4 Simeulue Earthquake. Available at: http://equake-rc.info/SRCMOD/
Hayes, G. P., Wald, D. J., and Johnson, R. L. (2012). Slab1.0: a three-dimensional model of global subduction zone geometries. J. Geophys. Res. 117, B01302. doi:10.1029/2011JB008524
Hayes, G. P., Wald, D. J., and Keranen, K. (2009). Advancing techniques to constrain the geometry of the seismic rupture plane on subduction interfaces a priori – higher order functional fits. Geochem. Geophys. Geosyst. 10, Q09006. doi:10.1029/2009GC002633
Hsu, Y. J., Simons, M., Avouac, J. P., Galetzka, J., Sieh, K., Chlieh, M., et al. (2006). Frictional afterslip following the 2005 Nias-Simeulue earthquake. Sumatra. Sci. 312, 1921–1926. doi:10.1126/science.1126960
Ji, C. (2005a). Preliminary Rupture Model for the December 26, 2004 Earthquake, off the West Coast of Northern Sumatra, Magnitude 9.1. Available at: http://neic.usgs.gov/neis/eq_depot/2004/eq_041226/neic_slav_ff.html
Ji, C. (2005b). Preliminary Result 05/03/28 (Mw 8.7), Sumatra Earthquake. Available at: http://www.tectonics.caltech.edu/slip_history/2005_sumatra/sumatra.html
Ji, C. (2007). Rupture Process of the Sep 12, 2007 Mw 8.4 Sumatra Earthquake: Phase II. Available at: http://www.geol.ucsb.edu/faculty/ji/big_earthquakes/2007/09/sumatra_seismic.html
Ji, C., and Zeng, Y. (2007). Preliminary Result of the Sep 12, 2007 Mw 7.9 Kepulauan Earthquake. Available at: http://equake-rc.info/
Konca, A. O., Avouac, J. P., Sladen, A., Meltzner, A. J., Sieh, K., Fang, P., et al. (2008). Partial rupture of a locked patch of the Sumatra megathrust during the 2007 earthquake sequence. Nature 456, 631–635. doi:10.1038/nature07572
Konca, A. O., Hjorleifsdottir, V., Song, T. A., Avouac, J. P., Helmberger, D. V., Ji, C., et al. (2007). Rupture kinematics of the 2005, Mw 8.6, Nias-Simeulue earthquake from the joint inversion of seismic and geodetic data. Bull. Seismol. Soc. Am. 97, S307–S322. doi:10.1785/0120050632
Li, L., Huang, Z., Qiu, Q., Natawidjaja, D. H., and Sieh, K. (2012). Tsunami-induced coastal change: scenario studies for Painan, West Sumatra, Indonesia. Earth Planet Sp. 64, 2. doi:10.5047/eps.2011.08.002
Mai, P. M., and Beroza, G. C. (2000). Source scaling properties from finite-fault-rupture models. Bull. Seismol. Res. Lett. 85, 1348–1357. doi:10.1785/0220140077
Mai, P. M., and Beroza, G. C. (2002). A spatial random field model to characterize complexity in earthquake slip. J. Geophys. Res. Solid. Earth 107, ESE 10-1–ESE 10-21. doi:10.1029/2001JB000588
Mai, P. M., and Thingbaijam, K. K. S. (2014). SRCMOD: an online database of finite source rupture models. Seismol. Res. Lett. 85, 1348–1357. doi:10.1785/0220140077
McCloskey, J., Antonioli, A., Piatanesi, A., Sieh, K., Steacy, S., Nalbant, S., et al. (2008). Tsunami threat in the Indian Ocean from a future megathrust earthquake west of Sumatra. Earth Planet. Sci. Lett. 265, 61–81. doi:10.1016/j.epsl.2007.09.034
McCloskey, J., Nalbant, S. S., and Steacy, S. (2005). Earthquake risk from co-seismic stress. Nature 434, 291. doi:10.1038/434291a
Meltzner, A. J., Sieh, K., Abrams, M., Agnew, D. C., Hudnut, K. W., Avouac, J. P., et al. (2006). Uplift and subsidence associated with the great Aceh-Andaman earthquake of 2004. J. Geophys. Res. 111, B02407. doi:10.1029/2005JB003891
Monecke, K., Finger, W., Klarer, D., Kongko, W., McAdoo, B. G., Moore, A. L., et al. (2008). A 1,000-year sediment record of tsunami recurrence in northern Sumatra. Nature 455, 1232–1234. doi:10.1038/nature07374
Muhari, A., Imamura, F., Koshimura, S., and Post, J. (2011). Examination of three practical run-up models for assessing tsunami impact on highly populated areas. Nat. Haz. Earth Syst. Sci. 11, 3107–3123. doi:10.5194/nhess-11-3107-2011
Muhari, A., Imamura, F., Natawidjaja, D. H., Diposaptono, S., Latief, H., Post, J., et al. (2010). Tsunami mitigation efforts with pTA in West Sumatra Province, Indonesia. J. Earthq. Tsunami 4, 341–368. doi:10.1142/S1793431110000790
Nalbant, S. S., Steacy, S., Sieh, K., Natawidjaja, D., and McCloskey, J. (2005). Seismology: earthquake risk on the Sunda trench. Nature 435, 756–757. doi:10.1038/nature435756a
Natawidjaja, D. H., Sieh, K., Chlieh, M., Galetzka, J., Suwargadi, B. W., Cheng, H., et al. (2006). Source parameters of the great Sumatran megathrust earthquakes of 1797 and 1833 inferred from coral microatolls. J. Geophys. Res. 111, B06403. doi:10.1029/2005JB004025
Newcomb, K. R., and McCan, W. R. (1987). Seismic history and seismotectonics of the Sunda arc. J. Geophys. Res. 92, 421–439. doi:10.1029/JB092iB01p00421
Newman, A. V., Hayes, G., Wei, Y., and Convers, J. (2011). The 25 October 2010 Mentawai tsunami earthquake, from real-time discriminants, finite-fault rupture, and tsunami excitation. Geophys. Res. Lett. 38, 1–7. doi:10.1029/2010GL046498
Okada, Y. (1985). Surface deformation due to shear and tensile faults in a half-space. Bull. Seismol. Soc. Am. 75, 1135–1154.
Pardo-Iguzquiza, E., and Chica-Olmo, M. (1993). The Fourier integral method: an efficient spectral method for simulation of random fields. Math. Geol. 25, 177–217. doi:10.1007/BF00893272
Philibosian, B., Sieh, K., Avouac, J. P., Natawidjaja, D. H., Chiang, H., Wu, C., et al. (2014). Rupture and variable coupling behavior of the Mentawai segment of the Sunda megathrust during the super cycle culmination of 1797 to 1833. J. Geophys. Res. Solid Earth 119, 7258–7287. doi:10.1002/2014JB011200
Satake, K., Nishimura, Y., Putra, P. S., Gusman, A. R., Sunendar, H., Fujii, Y., et al. (2013). Tsunami source of the 2010 Mentawai, Indonesia earthquake inferred from tsunami field survey and waveform modeling. Pure Appl. Geophys. 170, 1567–1582. doi:10.1007/s00024-012-0536-y
Shao, G., and Ji, C. (2005). Preliminary Result of the Mar 28, 2005 Mw 8.68 Nias Earthquake. Available from: http://www.geol.ucsb.edu/faculty/ji/big_earthquakes/2005/03/smooth/nias.html
Sieh, K., and Natawidjaja, D. H. (2000). Neotectonics of the Sumatran fault. Indonesia. J. Geophys. Res. Solid Earth. 105, 28295–28326. doi:10.1029/2000JB900120
Sieh, K., Natawidjaja, D. H., Meltzner, A. J., Shen, C. C., Cheng, H., Li, K. S., et al. (2008). Earthquake super cycles inferred from sea-level changes recorded in the corals of West Sumatra. Science 322, 1674–1678. doi:10.1126/science.1163589
Sladen, A. (2008). Preliminary Result 02/20/2008 (Mw 7.4), Simeulue Earthquake, Indonesia. Available at: http://www.tectonics.caltech.edu/slip_history/2008_n_sumatra/simeulue.html
Sladen, A., and Konca, A. O. (2007). Preliminary Result 09/12/2007 (Mw 7.9), Central Sumatra Earthquake. Available at: http://www.tectonics.caltech.edu/slip_history/2007_c_sumatra/c-sumatra.html
Tanioka, Y., and Satake, K. (1996). Tsunami generation by horizontal displacement of ocean bottom. Geophys. Res. Lett. 23, 861–864. doi:10.1029/96GL00736
United States Geological Survey (USGS). (2015). Latest Earthquakes. Available at: http://earthquake.usgs.gov/earthquakes/map/
Yue, H., Lay, T., Rivera, L., Bai, Y., Yamazaki, Y., Cheung, K. F., et al. (2014). Rupture process of the 2010 Mw7.8 Mentawai tsunami earthquake from joint inversion of near-field hr-GPS and teleseismic body wave recordings constrained by tsunami observations. J. Geophys. Res. Solid Earth. 119, 5574–5593. doi:10.1002/2014JB011082
Keywords: stochastic tsunami simulation, earthquake source modeling, uncertainty and sensitivity of tsunami hazard, Sunda megathrust, West Sumatra
Citation: Muhammad A, Goda K and Alexander N (2016) Tsunami Hazard Analysis of Future Megathrust Sumatra Earthquakes in Padang, Indonesia Using Stochastic Tsunami Simulation. Front. Built Environ. 2:33. doi: 10.3389/fbuil.2016.00033
Received: 21 September 2016; Accepted: 07 December 2016;
Published: 23 December 2016
Edited by:
Nikos D. Lagaros, National Technical University of Athens, GreeceReviewed by:
Filippos Vallianatos, Technological Educational Institute of Crete, GreeceDavid De Leon, Universidad Autónoma del Estado de México (UAEM), Mexico
Copyright: © 2016 Muhammad, Goda and Alexander. This is an open-access article distributed under the terms of the Creative Commons Attribution License (CC BY). The use, distribution or reproduction in other forums is permitted, provided the original author(s) or licensor are credited and that the original publication in this journal is cited, in accordance with accepted academic practice. No use, distribution or reproduction is permitted which does not comply with these terms.
*Correspondence: Ario Muhammad, ario.muhammad@bristol.ac.uk