Reducing Losses from Wind-Related Natural Perils: Research at the IBHS Research Center
 Christine D. Standohar-Alfano
 Heather Estes
 Tim Johnston
 Murray J. Morrison*
  Tanya M. Brown-Giammanco
- Insurance Institute for Business & Home Safety, Richburg, SC, USA
The capabilities of the Insurance Institute for Business & Home Safety (IBHS) Research Center full-scale test chamber are described in detail. This research facility allows complete full-scale structures to be tested. Testing at full-scale allows vulnerabilities of structures to be evaluated with fewer assumptions than was previously possible. Testing buildings under realistic elevated wind speeds has the potential to isolate important factors that influence the performance of components, potentially allowing for modifications to standard testing procedures that are commonly used to evaluate product performance. IBHS’ wind-related research is discussed, along with research examining natural perils that are highly affected by wind flows around a structure, such as wind-driven rain during high-wind events and firebrand exposures during wildfires. In addition, IBHS’ hail testing capabilities are described.
Introduction
In 2010, the Insurance Institute for Business & Home Safety (IBHS) opened its Research Center in Richburg, South Carolina. The purpose of the facility was to conduct realistic, objective, state-of-the-art research to reduce losses to infrastructure resulting from exposures to wind-related natural perils. Rather than conducting research on all potential perils that threaten the built environment, IBHS focused on filling research gaps where there was a lack of realistic scientific research and, therefore, where the new facility could have the largest impact. Based on this objective, the IBHS Research Center was designed to focus on four perils: high wind, hail, wind-driven rain, and wildfire. The central part of the IBHS Research Center is a large test chamber which allows for one- or two-story residential and small commercial buildings to be subjected to the four previously mentioned perils. The Research Center also has small-scale laboratory capabilities to further investigate the perils. The objective of the research is to identify ways to reduce losses for homeowners, business owners, insurance companies, and society at large. Research results can provide valuable information and visuals that can be used in public outreach and educational programs, providing information, which allows individuals to make informed decisions regarding effective mitigation strategies to protect their property, and providing guidance on how to implement these mitigation strategies. The following sections will describe the facility capabilities and core research being conducted in each of the four addressed perils.
High Wind
Wind loads on low-rise structures have been studied extensively over the past 35 years using model-scale wind tunnels. While these facilities have provided valuable information on wind loads that act on buildings, they are not as well suited for predicting performance of building components or evaluating how buildings fail when subjected to high winds. Moreover, determining the wind loads for extremely complex geometries or cavity flows, which are present for many types of building assemblies, is difficult to measure, if not impossible in many cases due to the small physical model sizes used in these facilities.
Due to increasing wealth and associated infrastructure in regions vulnerable to high winds, infrastructure losses have been increasing (Pielke et al., 2008). Understanding how structures are damaged and fail is critical in improving their performance and ultimately reducing losses. Post-event damage investigations have provided good information on building component failures, but it is often difficult to determine which component initiated failure. Component testing provides valuable information on the capacities of individual elements; however, there is a need for a better method to evaluate the overall performance of the complete structure under more realistic wind loading.
Identification of the vulnerable components, i.e., the weakest link(s), allows for targeted improvement of building codes and/or standards that will have the largest impact in improving the high-wind performance of both residential and commercial buildings. In addition, having specific knowledge of which components are the most likely to fail can allow for targeted, cost-effective mitigation or retrofit strategies to improve the performance of existing buildings subjected to high-wind events. The IBHS test chamber consists of an array of fans which are capable of creating a realistic simulation of the lowest portion of the atmospheric boundary layer (ABL). This capability allows IBHS to subject full-scale buildings to high-wind loads in a controlled, repeatable laboratory setting so that the actual performance of the building and its components can be evaluated.
Hail
There are approximately 3,000 hailstorms in the US every year, which typically cause $1–2 billion in damages annually (Changnon et al., 2009), with an increasing trend attributed to changing dollar values, growing wealth, and exposure of properties at risk from severe hail (Changnon et al., 2009; Roeder, 2012). Despite the high financial costs of hail events, injury and fatality rates are low, especially when compared to other natural hazards. Because of this, insurers are the primary party concerned with the increasing loss trends attributed to hail and in determining ways to reduce losses. Some impact-resistant (IR) roofing materials are available in the marketplace that can potentially reduce hail-related losses, but there are concerns regarding how those products are tested, and their long-term performance. As a result, there are several hail research thrusts running concurrently at IBHS to address the specific concerns of the insurance industry. These projects also have implications for roofing product manufacturers, as well as modeling and forecasting applications. The three primary research avenues undertaken at IBHS are: field investigations, small-laboratory testing, including standardized testing, and full-scale testing in the test chamber.
IBHS has conducted annual field experiments during active severe weather months in the Central Plains since 2012, to collect ground-truth hail data [e.g., Giammanco and Brown (2014) and Giammanco et al. (2015)]. The knowledge gained from field studies is used to improve testing using IBHS’ unique laboratory capabilities, which allows for investigations of realistic building damages caused by hail (Brown and Giammanco, 2013). Small-laboratory investigations examine the performance of products using several standard impact test methods. In addition, IBHS has developed capabilities to manufacture ice spheres (simulated hail) that replicate properties of real hailstones obtained from field investigations. Impacts from realistic ice spheres can be contrasted against impacts using projectiles prescribed in standardized test methods. Full-scale testing in the IBHS test chamber allows the field and small-laboratory testing to be applied to recreate realistic events, which allows researchers to evaluate full building systems in a controlled environment.
Wind-Driven Rain
Water entry through the building envelope can lead to damaged interiors, including the development of mold and structural degradation of building materials. Sparks et al. (1994) reported that a wind-driven rain incident on a residential building caused damage nearing the insured value of the building. High levels of interior damage often lead to prolonged periods in which a building is not usable, leaving occupants displaced and further contributing to high loss costs.
Prior to the development of IBHS’s wind-driven rain system, water entry research primarily existed in the form of field-based studies or laboratory and assembly scale studies utilizing models of individual roof and wall sections [e.g., Bitsuamlak et al. (2009) and Masters et al. (2010)]. The wind-driven rain capabilities at IBHS enable controlled experiments on complete full-scale structures. Studies have primarily focused on research to assess building vulnerabilities to water entry as a means to understand the potential for losses associated with high-wind rainstorms and determine effective mitigation strategies to reduce these losses by preventing or reducing water entry into a building. Thus, one of the key, foundational pieces of IBHS’s code-plus construction program, FORTIFIED Home™, includes the use of a sealed roof deck to prevent or reduce water entry if the primary roof cover is lost during high winds. IBHS is able to collect water that enters through the roof deck, attic vents, and penetrations on the exterior wall (e.g., doors and windows) of a test building. These capabilities allow for evaluation and comparison of specific components and mitigation strategies.
Wildfires
On average, the US experiences over 73,000 wildfires annually (United States Forest Service, 2016), burning millions of acres, destroying homes, and in some cases, causing injuries or fatalities of residents and/or firefighting personnel. Wildfire occurrence and intensity is increasing worldwide, with major wildfires occurring outside of the normal fire season (Short, 2015) stretching firefighting resources. There is continual interest in understanding wildfire hazards and mitigation strategies as communities continue to expand into the wildland–urban interface (WUI).
Ignition of a structure can be caused by direct flame contact from the primary fire front or flames from a spot fire, elevated levels of radiant heat, or by wind-blown firebrands (also referred to as embers) that ignite vegetation and/or other combustible fuels closer to the primary building (Potter and Leonard, 2010; Quarles et al., 2010). Post-fire investigations have demonstrated the importance of building ignitions resulting from wind-blown firebrands and not from flames from the wildfire itself. This mode was reported to account for two of every three structural ignitions during the 2007 Witch Creek fire in Southern California (Maranghides and Mell, 2009).
Researchers at IBHS are able to mimic a firebrand attack in a controlled, laboratory setting in order to assess structural vulnerability to this exposure. The risk of ignition from firebrand attacks depends on several factors, including the size and number of firebrands, the amount of combustible debris or other combustible materials in the vicinity of the building, duration of the firebrand attack, and environmental conditions. Experiments to evaluate (1) the vulnerability of buildings to firebrand exposure and (2) potential associated mitigation strategies, accounts for the majority of research at IBHS, since there is limited information available on the vulnerability of buildings to firebrand exposures. Likewise, there is limited coupling between current building codes and standards to firebrand exposure from wildfires (Maranghides and Mell, 2012). One cause of this knowledge gap is the lack of quantification of the firebrand exposure, resulting in an uncertain relationship between exposure and building ignition. The full-scale facilities at IBHS allow for realistic wildfire experiments that address the critical information needed to help mitigate wildfire hazards in WUI communities.
Large Test Chamber Facility Overview
The IBHS Research Center is located on a 99-acre campus in Richburg, SC, USA. The focus of the facility is the large test chamber which is capable of subjecting full-scale residential and small commercial structures to Category 3 hurricane winds, hail storms, wind-driven rain, and firebrand exposures. The flow through the test chamber is produced using 105, 1.68 m (5.5 ft) diameter vane-axial fans, each driven by a 261-kW (350 hp) motor. The goal of the test chamber was to develop a space where one- and two-story residential and small commercial structures could be tested at full scale. In conventional model-scale boundary layer wind tunnels, the cross section of test specimens is typically kept to less than 8% of the wind tunnel cross section to limit blockage effects (ASCE 49-12, 2012). To use this approach in the IBHS facility would require a test section so large that it would be economically unfeasible to achieve flow velocities sufficiently high to bring building components to failure. Instead, the IBHS test chamber uses an open-jet wind tunnel design where the test section is larger than the inlet jet, which reduces blockage effects compared to closed jet wind tunnel designs (Barlow et al., 1999). Buildings tested in the IBHS facility typically have blockage areas between 20 and 30% based on the inlet jet area, and the effects of blockage will be discussed in Section “Surface Pressure Measurements.”
Figure 1 presents a plan view of the IBHS test chamber. The test section has dimensions 44.2 m (145 ft) wide by 44.2 m (145 ft) long, with a clear interior height of 18.3 m (60 ft), while the inlet jet has dimensions of 19.8 m (65 ft) wide by 9.1 m (30 ft) tall. The inlet jet dimensions result in an overall contraction ratio of approximately 2:1. The outlet of the test chamber is about 10% larger than the inlet with a short diffuser section at the outlet. Test specimens are placed on a 16.8-m (55 ft) diameter turntable, which can rotate over a full 360°. The leading edge of the turntable is located 7.8 m (25.6 ft) downstream of the inlet jet. The inlet jet is divided into 15 independent cells, 5 cells spanning horizontally and 3 cells spanning vertically. The 5 lowest cells contain 9 fans each, with the remaining 10 cells having 6 fans each. The fan speed in each cell is controlled independently from the others using 15 variable frequency drives, allowing for shear flows across horizontal and vertical cells to be achieved. The speed of the fans can be updated as fast as 10 times a second with a maximum acceleration rate of 2.6 m/s2. At full power, code-equivalent 3-s gust wind speeds at 10 m (33 ft) up to approximately 58 m/s (130 mph) can be simulated, requiring about 30 MW of power.
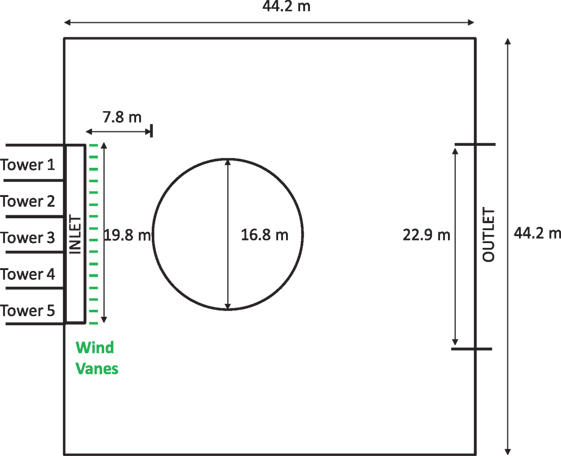
Figure 1. Plan view of the IBHS test chamber.
High Wind Research Capabilities
Turbulent wind flows around structures give rise to complex flow patterns in close proximity to low-rise structures. The interaction between building-generated vortices and free stream turbulence results in wind loads that have large spatial and temporal gradients. Model-scale wind tunnels have been shown to provide reasonably accurate wind loads on structures, but do have limitations with complex geometries or where small gaps or local flow fields significantly affect loads. The IBHS test chamber provides a unique opportunity to examine wind loads on components that are difficult to accurately reproduce in model scale.
In addition, the IBHS test chamber allows for the performance of building components, installed in the same way they would be in practice, to be evaluated under realistic wind loading. The true performance of different building components can then be compared to the expected performance from standard test methods. Based on these comparisons, improvements can be made in product evaluations. Since becoming operational in 2010, IBHS has conducted numerous studies to determine the wind loads on building components that cannot be well modeled in model-scale wind tunnels, such as asphalt shingles, multi-layer wall and roofing systems (Morrison and Cope, 2015), roof-mounted equipment (Morrison et al., 2013), and commercial standing seam metal roofing (Morrison and Reinhold, 2015).
As discussed in Section “Large Test Chamber Facility Overview,” the IBHS test chamber has a large test cross section; however, the test section is relatively short in the streamwise direction. As a result, the facility cannot naturally produce the mean flow and turbulence characteristics of the ABL. In fact, the correct replication of the ABL is one of the largest challenges of full-scale wind tunnels. In order to achieve an accurate simulation of the ABL, active and passive control elements are used. The three control elements used are active control of the fan speed to generate large-scale gusts, passive spires located in the lower and middle fan cells to inject small-scale turbulence, and active wind vanes that move horizontally, which injects lateral turbulence into the flow. Both the spires and the wind vanes are indicated in Figure 2.
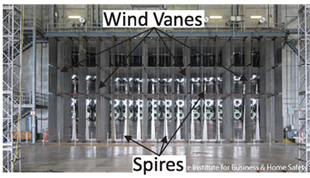
Figure 2. Photograph of the inlet of IBHS test chamber.
The ability of the IBHS test chamber to simulate realistic wind pressures was also evaluated as part of the facilities commissioning. A replica of the Texas Tech University Wind Engineering Field Research Laboratory (WERFL) experimental building was constructed and tested at the IBHS Research Center. Details of the WERFL experiments and building details can be found in Levitan and Mehta (1992a,b) and Lombardo (2009). Results from the IBHS test chamber were compared to both those from the WERFL building (Smith, 2010) and those from model-scale wind tunnel experiments on the WERFL building conducted at the boundary layer wind tunnel at the University of Western Ontario’s (UWO) boundary layer wind tunnel.
Boundary Layer Flow Characteristics
The flow characteristics in the IBHS test chamber were quantified using two multi-hole pressure probes manufactured by Turbulent Flow Instruments. The probes are capable of measuring the flow velocity in 3-components and were mounted on a gantry and traversed across the cross section of the wind tunnel 10.2 m (33.5 ft) downstream of the inlet to the test chamber. The work of Gartshore (1973) suggests that the flow and turbulence characteristics along the stagnation streamline significantly affect the separated shear layers on bluff bodies and their point of reattachment onto the body. Therefore, achieving realistic flow characteristics along the center line of the IBHS test chamber, between the leading edge of the turntable and the front of the building [downstream distances between 5.8 and 8.65 m (19 and 28.4 ft)], where the stagnation point is likely located, is critical in recreating realistic wind loads on test specimens. Figure 3 presents the mean and streamwise turbulence intensity (Iu) profiles at the centerline of the test chamber at 7.9 m (25.9 ft) downstream of the inlet. The mean velocity profile follows a target theoretical logarithmic boundary layer profile with roughness length zo = 0.01 m and matches TTU field data with a similar roughness length from Smith (2010), also shown in Figure 3. A slight deficit in the mean profile exists at the interface between the lower and middle cells of the fan array. At heights lower than 5 m (16.4 ft) there is good agreement between measured Iu in the IBHS test chamber and the theoretical profiles from Engineering Data Science Unit (1983). However, above 5 m (16.4 ft), Iu decreases much more rapidly than would be predicted from the theoretical profiles, with Iu being approximately 3% lower than the theoretical profile at 6 m (19.7 ft). The reduction of Iu at these heights corresponds to the location where the spires in the middle cells terminate.
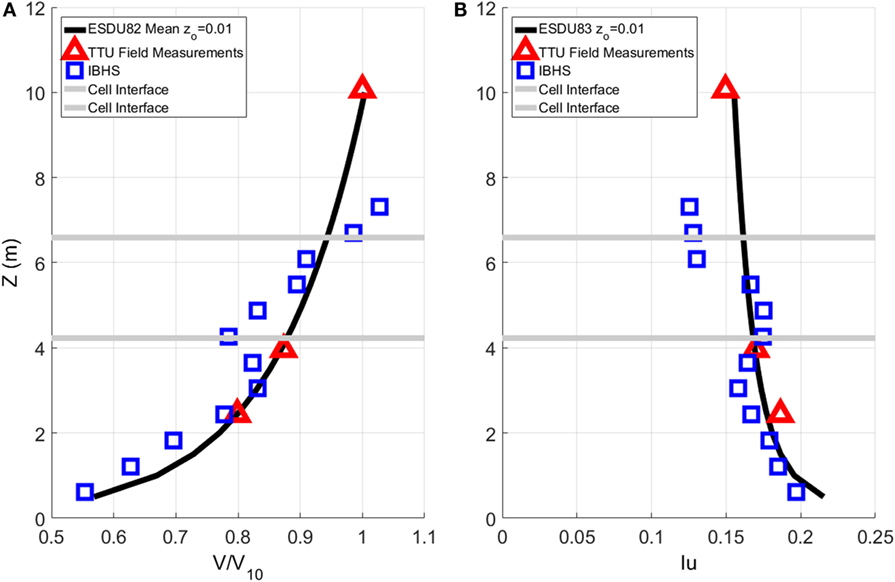
Figure 3. Streamwise development of the mean velocity profiles (A) and the streamwise turbulence intensity, Iu (B). ESDU 82 refers to Engineering Data Science Unit (1982), while ESDU 83 refers to Engineering Data Science Unit (1983).
In addition, the vertical velocity profiles measurements were conducted across the span of the IBHS test chamber to ensure mean uniformity of the incoming flow. Since the fan speed of each cell can be independently controlled, adjustments were made to the RPM of each cell to achieve horizontal uniformity cell-to-cell without the spires in place. In addition, measurements were conducted across the lower cells with the spires in place to examine the uniformity across the cell itself. Mean flow uniformity across the cells were found to be approximately ±3%.
Figure 4 presents the longitudinal power spectra at a vertical height of approximately 2.4 m (7.9 ft) above the ground at both the field site at TTU and in the IBHS test chamber. The active control elements within the IBHS test chamber are able to change the variance of the velocity over a specific frequency range. Since energy is being artificially added over a specific frequency range, normalization by the variance can skew the comparison between the IBHS theoretical and field measurements, particularly at higher frequencies. Therefore, the power spectra presented herein are normalized by the mean velocity squared, similar to Davenport (1961), rather than the variance of the velocity which is more common. Also included in Figure 4 are the generalized spectral models from Engineering Data Science Unit (1983). The match of the longitudinal spectra between the TTU field case and ESDU is quite good up to a wave number (F/V) of 0.1. The drop off of the field spectra is a result of the frequency response of the field instrumentation. Between wave numbers of 0.01 and 0.1, the IBHS data show a spectral gap where there is too little energy at these frequencies. At wave numbers greater than 0.1, the match is good, although the presence of the spires increases the amount of energy at smaller scales (as would be expected), creating too much fine-scale turbulence compared to the ESDU spectrum. The problem of too much fine-scale turbulence is quite common in model-scale wind tunnel experiments of low-rise buildings [see Tieleman (2003), for a discussion]. The amount of additional energy relative to the target power spectrum at higher frequencies in the IBHS test chamber is relatively small compared to the mismatch present in model-scale wind tunnel investigations [e.g., Kopp et al. (2005)]. However, unlike model-scale wind tunnel facilities, the IBHS test chamber is able to match the large turbulent scale through the active modulation of the fan speeds in time and movement of the wind vanes.
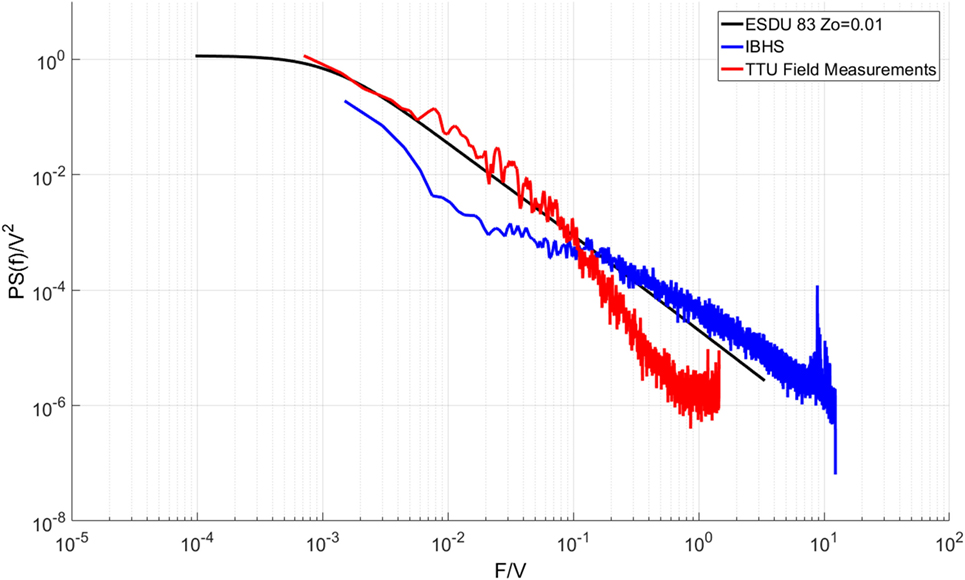
Figure 4. Streamwise velocity spectra, Puu, normalized by the streamwise velocity squared. ESDU 83 refers to Engineering Data Science Unit (1983).
Surface Pressure Measurements
Pressures measured in the IBHS test chamber were normalized using
where P is the surface pressure, P∞ is the static pressure within the test chamber and V is the 15 min mean velocity at roof height. Figures 5A–C presents a comparison of minimum surface pressures between IBHS, field data from TTU (Smith, 2010), and model-scale wind tunnel data from UWO. Overall, the match between minimum surface pressures from the IBHS test chamber to the field observations shows generally good agreement. The magnitude of the peak point pressures from IBHS lie in between those from field observations and model-scale wind tunnel results. Previous studies [e.g., Cohcran and Cermak (1992), Lin et al. (1995), and Xu and Reardon (1996)] have shown that peak point pressures under separation bubbles on the roof are typically under-estimated in model-scale wind tunnels, when compared to full-scale field observations.
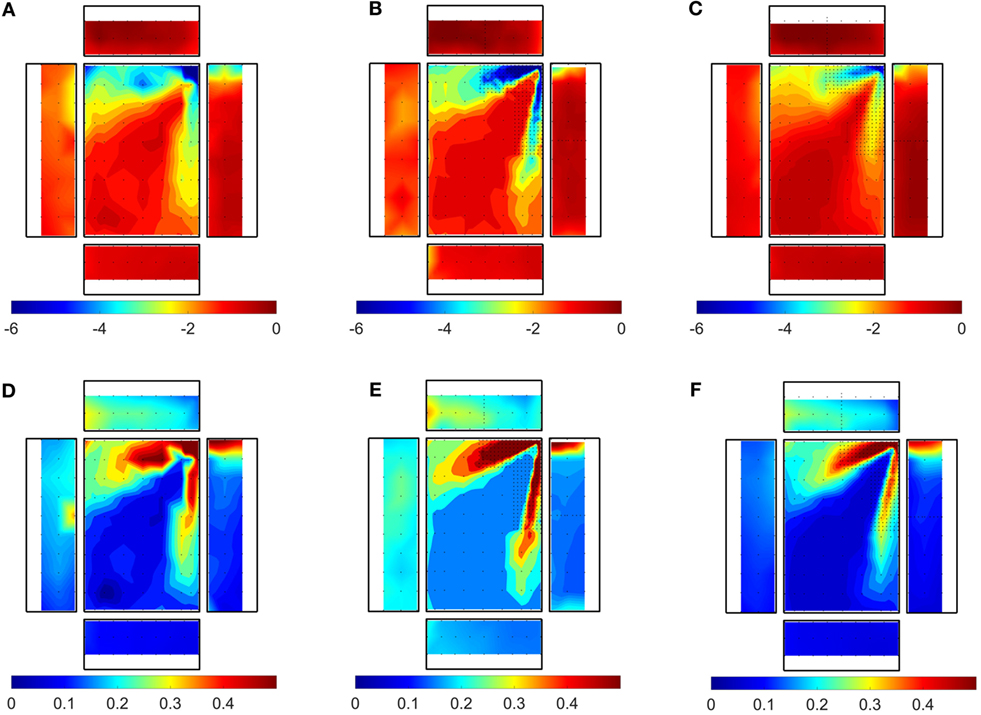
Figure 5. Comparison of pressure coefficient minima for a wind direction of 30° for (A) field data (Smith, 2010); (B) IBHS; (C) model-scale wind tunnel and SD pressure coefficients; (D) field data (Smith, 2010); (E) IBHS; and (F) model-scale wind tunnel.
A comparison of the standard deviation (SD) between IBHS, TTU field data, and model-scale wind tunnel data is shown in Figures 5D–F. Similar to the minimum pressures, the three studies match reasonably well along the edges of the roof (in the separation regions of the roof). However, the IBHS data have much higher fluctuations in the field of the roof after the reattachment points than both the field and model-scale wind tunnel studies. These higher SDs in the field of the roof may be a consequence of the spectral gap between wave numbers of 0.01 and 0.1; however, the exact cause has not been definitively identified.
For the wind angle shown in Figure 5, the blockage ratio relative to the inlet jet is approximately 32%. The mean windward wall pressures (not shown) are higher than would be expected from both field and model-scale wind tunnel experiments. These higher mean windward wall pressures are likely the result of blockage or the proximity of the building to the inlet of jet. While there are likely some blockage affects, the building surface pressures in the IBHS facility provide a good match to field observations particularly in the highest loaded regions of the building which are of primary interest when evaluating the performance of building components.
Figure 6 presents a comparison of mean pressure coefficients along the centerline of the building including the windward wall, roof, and leeward wall at a wind angle of 0°. Similar to the contour plots presented in Figure 5 there is generally good agreement between all three studies with the IBHS data typically between the model-scale wind tunnel data and the field data from Smith (2010) within the separated region on the roof. Beyond the reattachment point on the roof and the leeward wall, the mean pressure coefficients of the model-scale wind tunnel and IBHS data are similar, with the field data having larger suctions. The pressures of the model-scale wind tunnel data and field data have very good agreement along the windward wall, while the higher windward wall pressures in the IBHS are observed similar to the trends shown in Figure 5 discussed above.
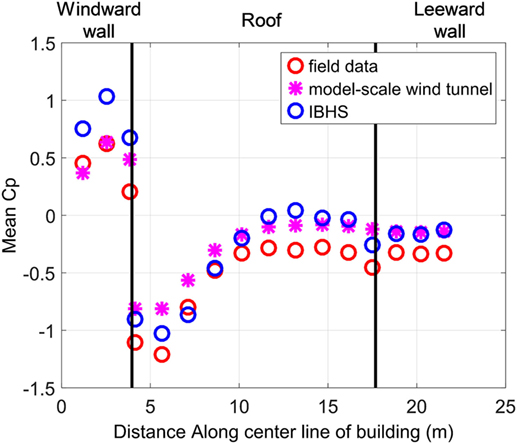
Figure 6. Comparison of mean pressure coefficients along the centerline of the building at a wind angle of 0°.
The uncertainty of mean pressure coefficients can be as high as 10% in model-scale wind tunnel studies, as discussed by Quiroga (2006). To the author’s knowledge, the uncertainty of field pressure coefficients has not been quantified. However, it is likely that they are larger than those in model scale. Overall, the minimum pressures are within approximately 10% of the field measurements at most locations on the roof. As such, it is reasonable to state that the IBHS test chamber is able to replicate realistic wind loads on structures within the uncertainty of the measurements, notwithstanding the effects of turbulence scale mismatches and blockage effects.
Installing additional passive flow control elements to improve the turbulence intensities above 6 m (19.7 ft) and reduce the spectral gap observed in the streamwise power spectrum was considered. However, the added blockage these elements would introduce would reduce the maximum wind velocity and reduce the ability of the test chamber to look at failures of elements at higher wind speeds. Given the good agreement in surface pressures, the benefit of any improvements in the flow field and resulting surface pressures would be small compared to the drawbacks of reducing the wind speeds. As a result, additional flow control elements have not been pursued further at this point.
Hail Research Capabilities
While improvements in severe weather warning times have provided increased safety for individuals, property losses attributed to hail have been rising in recent years (Changnon et al., 2009; Roeder, 2012). Existing test methods for rating the impact resistance of roofing products were based on studies conducted by Bilhelm and Relf (1937) and Laurie (1960). However, these methods did not always produce results consistent with field observations of damage from insurance claims adjustors, and results do not necessarily serve as predictors of real-world performance. The capabilities of the IBHS test chamber allow the performance of building components, installed in the same way they would be in practice, to be evaluated for realistic impacts, filling an existing knowledge gap. The true performance of different building components can then be compared to the expected performance from standard test methods.
The objective of the hail research program at IBHS is to properly understand natural hail characteristics and to replicate those in the small- and full-scale testing facilities, so building damage from hail impacts can be better understood and mitigated. Small-laboratory capabilities to assess building material performance include standardized impact test methods and replication of the properties of real hailstones. Hailstone properties can be further replicated for use in full-scale testing in the IBHS test chamber, where researchers can test full-scale residential and commercial structures to determine how building systems respond to hail impacts. Field research is conducted to collect data on the physical properties of hailstones and the environmental conditions that create them. This information is then incorporated into laboratory testing, to ensure realistic impact modes and energies are being simulated. These data can further be used to validate modeling and forecast applications, as well as for improving dual-polarimetric hail detection algorithm capabilities.
Field Research Program
Field research experiments are conducted during active severe weather months in the Central Plains to collect ground-truth hail data, which are used in modeling, forecasting, and hail detection applications, and are applied to improve small- and full-scale laboratory impact tests (Brown and Giammanco, 2013). The project is fully mobile and strives to collect measurements within 10–30 min after the time of hailfall. A database of more than 2,500 measured hailstones has been created through this work (Giammanco and Brown, 2014; Giammanco et al., 2015). Hail impact disdrometers (Figure 7A) (Giammanco and Brown, 2014), handheld compressive strength devices (Figure 8A) (Giammanco et al., 2015), and a 3D laser scanner (Giammanco et al., 2016) are used for data collection.
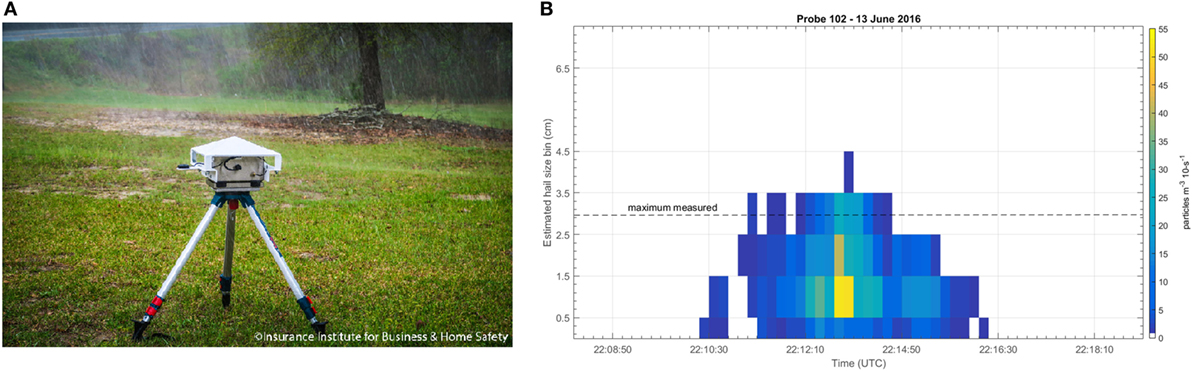
Figure 7. (A) IBHS hail impact disdrometer deployed in 2015 during the field program. (B) Impact magnitude and frequency from a deployment of the hail disdrometer.
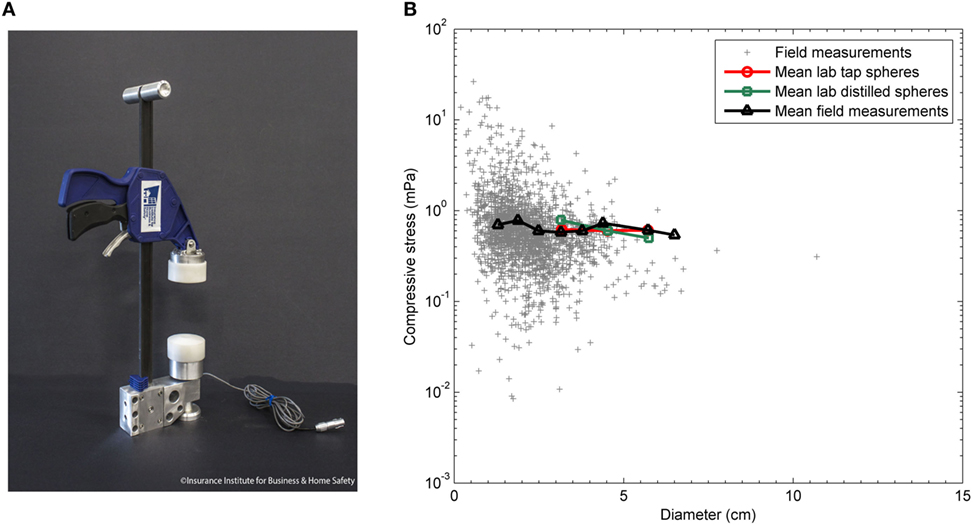
Figure 8. The two compressive force tests devices used by the IBHS field research program (A) and (B) comparison of field and laboratory compressive force values as a function of the measured maximum diameter (centimeters).
Impact disdrometers are rapidly deployable hail impact probes that capture a time history of hail size distributions and kinetic energies. They use a single piezoelectric disk to detect falling hail and/or rain (Mikhaylovskaya, 1964; Joss and Waldvogel, 1969; Kinnell, 1972). Laboratory calibrations of the probes are conducted prior to field deployments; however, if impact energies are similar between large raindrops and small hailstones, they cannot be differentiated within the data. Figure 7B provides an example of the type of data collected by the hail impact disdrometers. As shown in Figure 7B, the size of the rain or hail is plotted versus time with the colors showing the number of impacts of each size. The increased number of impacts per minute appears in the warmer colors, while the cooler colors represent fewer impacts during a specific bin of time. Figure 7B shows that as the swath passed over the disdrometer, the frequency of hail impacts increased, but the size of hail or rain remained consistent during the core of the swath, and settled out as the swath passed by. These data are used directly to influence kinetic energies used for impact testing of building materials (discussed in Section “Small-Laboratory Testing Capabilities”), and concentration data can be used for radar-based hail detection applications. In the future, impact concentrations and size distributions could be used to improve full-scale hailstorm simulations, as discussed further in Section “Full-Scale Testing Capabilities.”
To better assess the physical properties of hail, a handheld device, shown in Figure 8A, is used to measure the compressive strength of hailstones, which is expected to relate to the energy transferred to a building component which may cause damage (Giammanco et al., 2015). These data can be applied to improve testing capabilities in small-laboratory and full-scale production of hailstones to better match the strength characteristics of real hailstones. Improved characteristics of the test projectiles, coupled with improved kinetic energy estimates from the disdrometers and Heymsfield et al. (2014), will result in better testing and a better understanding of impact resistance and damage modes for building materials, when compared to the standard test methods discussed in Section “Small-Laboratory Testing Capabilities.” Figure 8B shows a comparison of field and laboratory compressive force values as a function of the measured diameter of the hailstone. The mean laboratory compressive strength measurements (red and green) are consistent with the mean field measurements (black). The gray points also show that field measurements can vary, and researchers are evaluating options to consistently recreate certain sizes, shapes, compressive strengths, and densities of projectiles to improve the standard impact test methods described in the next section.
Hailstones come in many different shapes and sizes and are often irregularly shaped. However, the size of a hailstone is typically reported as the largest dimension, which inherently implies a spherical shape. This assumption can lead to significant errors when calculating the density of hailstones. Furthermore, impact test standards, which are discussed in the next section, prescribe the use of spherical projectiles and, therefore, do not account for the aerodynamic effects that would result from tumbling of irregularly shaped objects, which ultimately affects impact kinetic energy. In addition to impact energy effects, it is unclear as to whether the shape of a hailstone affects the impact mechanics as a result of “spiky” features making contact with a building material instead of the smooth surface of a sphere. In September 2015, IBHS first used a handheld 3D laser scanner to accurately measure the shape, size, and volume of hailstones. When the volume of hailstones is calculated using the maximum diameter of a sphere, the calculated volume may be higher than field values (Giammanco et al., 2016). This difference is shown in Figure 9A where the volume of a scanned stone was 54% less than would have been predicted from the assumption of a sphere based on the maximum measured diameter. The collection of 3D models of hailstones can be used to create molds and artificial stones (Figure 9B). Coupled with disdrometer and hailstone strength data, the 3D model data can be used to improve product test standards to account for differences in shape, strength, density, and kinetic energy to better understand damage modes and real-world performance for different building materials.
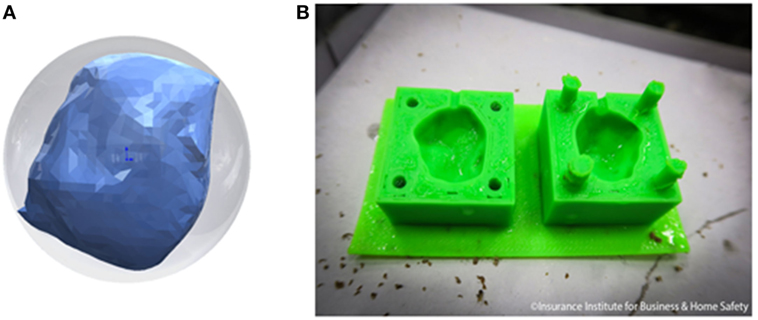
Figure 9. 3D model data (A) of a hailstone scanned using the handheld scanner system. A 3D printed cavity mold of this hailstone is also shown (B).
Small-Laboratory Testing Capabilities
IBHS hail research capabilities include small-laboratory standard test methods such as UL 2218 steel ball (Underwriters Laboratory, 2012) and FM 4473 (FM Approvals, 2005) pure ice ball impact tests, which assess the impact performance of new roofing materials available in the market. Both tests utilize four classes of spherical impact projectiles that range from Class 1 [3.18 cm (1.25 in.) diameter] to Class 4 [5.08 cm (2.00 in.) diameter]. The tests are intended to match the impact kinetic energy that a similarly sized spherical, high-density hailstone would have when falling at theoretical terminal velocity. Kinetic energies for projectiles range from 4.78 to 32.2 J depending on the size and type.
Current test programs are focused on asphalt shingles because of their large market share in residential steep-slope construction (approximately 80%). One drawback of the UL 2218 test method is the steel ball impacts create crushed granules which is an atypical damage mode for asphalt shingles, and which are not observed in post-event damage investigations. Crushed granules are rarely observed in the FM 4473 test method, which uses ice spheres as projectiles. Figure 10 provides a comparison of impact test results on new products, using (A) UL 2218, (B) FM 4473, and on an aged product using (C) ice spheres with dissolved carbon dioxide (CO2). Dissolving CO2 into the water prior to freezing introduces gas bubbles into the ice sphere, which reduces the density, thus creating ice spheres that more closely mimic natural hailstones, and better replicate field damage observations.
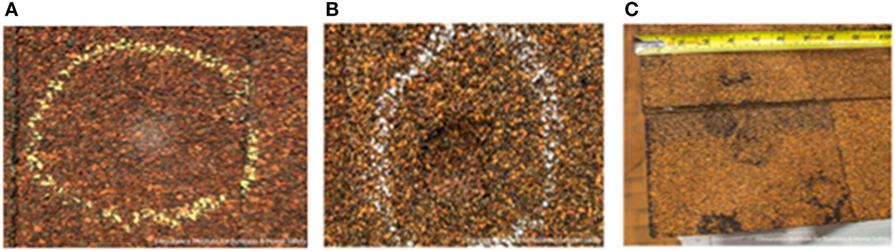
Figure 10. (A) Crushed granules on an asphalt shingle impacted with UL 2218 Class 4 steel ball. (B) Indented surface of an asphalt shingle impacted with FM 4473 Class 4 ice sphere. (C) Damage on a naturally aged two-year-old asphalt shingle impacted with multiple dissolved CO2 ice spheres. Reproduced from Giammanco et al. (2015).
While the FM 4473 test method produces more realistic damage modes compared to UL 2218, the pure ice spheres are created in silicone molds as part of the test method, which can result in inconsistent densities, shapes, bubble distributions, and micro fractures. Inconsistent impact modes have also been observed (hard and soft), which can cause different material responses. Ongoing research programs use knowledge gained from field measurements to guide laboratory ice ball production, with a goal of better simulating real-world impact damage modes. Improvements in simulating realistic damages will allow for improved small-laboratory and full-scale investigations, resulting in more representative tests that allow for better prediction of real-world performance.
In 2015, IBHS added a new Hail Machine (Figure 11) as a result of collaboration with Accudyne Systems Inc., which produces repeatable and controllable laboratory ice spheres. With this new capability, hailstone characteristics obtained from field data can be more easily replicated for use in small- and full-scale laboratory impact testing. Testing is ongoing to replicate the spread of data that is observed in the field (Figure 7), and to better understand the relationship between compressive strength and damage to materials. The IBHS Hail Machine also allows for rapid automated bulk production of ice spheres, which will improve efficiency and repeatability for full-scale testing programs.
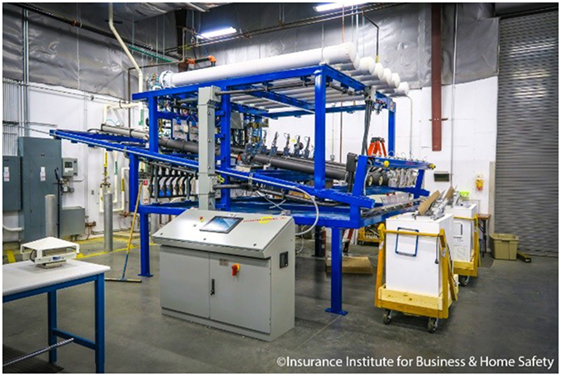
Figure 11. IBHS Hail Machine that was developed with Accudyne Systems Inc., to mass produce laboratory hailstones, which mimic material properties of natural hail.
As part of the commissioning of the Hail Machine, comparisons between compressive strength and density of natural hailstones and those produced with the machine have been made. Results have shown that the machine-produced stones better match the values found for real hailstones, and that they are more consistent and repeatable than ice spheres created using silicone molds following FM 4473. Although the hailstones produced from the Hail Machine are frozen from the outside in, rather than the natural formation which starts from the center and grows outward, the rapid freezing of the ice slug in the machine allows for the dissolved gas to remain within the ice. When compared to FM 4473 ice spheres frozen in molds, the density is more consistent from the machine since the 1-h freeze time is significantly less that the 48-h freeze time. Figure 12 compares compressive strength results for stones at various storage times at −12°C (10°F) to the mean and median compressive strength of natural hail. Machine settings and storage times and temperatures can be adjusted to create stones which are lower or higher in density, or lower or higher in compressive strength, and work is ongoing to better match field and lab data. Different control parameters on the Hail Machine and different storage times and conditions can also be used to drive different ice sphere impact modes (bounce, shatter, liquefy), which affect the coefficient of restitution. These controls will help researchers better understand how density and compressive strength relate to impact damages caused by hail.
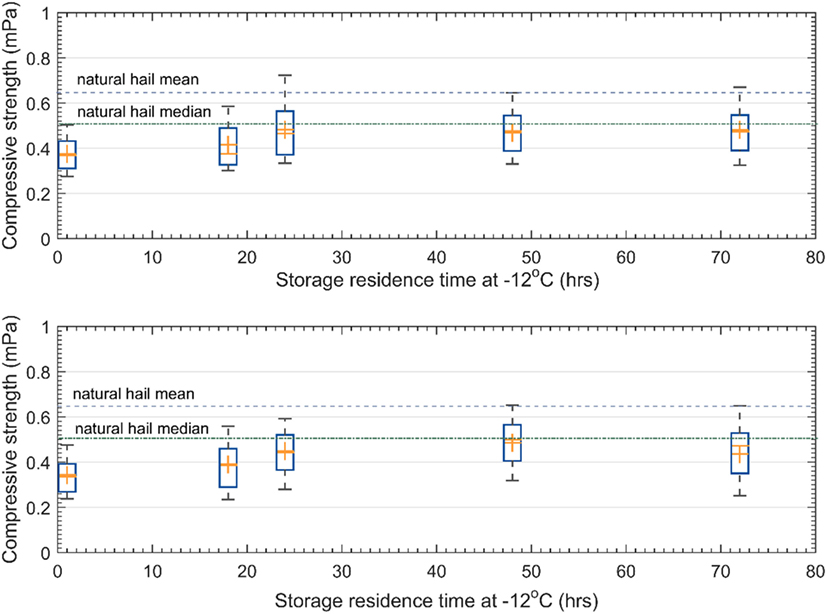
Figure 12. Using particular settings on the IBHS Hail Machine, lab-created ice spheres were stored at −12°C and tested to evaluate their compressive stress. These data compare compressive strength data to storage residence time for (top) 3.81 cm and (bottom) 5.08 cm ice speheres. The mean and median of the measured distribution of natural hailstones tested by IBHS from 2012–2015 field experiments are also shown.
Full-Scale Testing Capabilities
IBHS full-scale hail research capabilities include an impact test system in the test chamber, where various sizes of ice spheres can be propelled to create a realistic hailstorm. The IBHS test chamber is equipped with 72 impact barrels, grouped in sets of six, to create the hailstone propulsion cannons shown in Figure 13A. These cannons propel various sizes of lab-created ice spheres at full-scale test buildings (B) from 18.3 m (60 ft) above ground. Laboratory ice spheres ranging from 2.54 cm (1.00 in.) to 5.08 cm (2.00 in.) in diameter can be manually fed into the automated cannon firing system, which pneumatically projects the stones into the wind stream. Ice spheres are propelled at speeds such that impact kinetic energies are similar to the energies outlined in the UL 2218 and FM 4473 test methods. Therefore, the wind speeds in the test chamber can be left at idle or 6 m/s (14 mph) during full-scale hail testing. Previous studies (Morgan and Towery, 1976, 1977; Changnon et al., 2009) have indicated hailfall occurrences with wind speeds over 27 m/s (60 mph), which can lead to enhanced damage caused by higher energies in wind-blown hail. Future full-scale experiments could investigate the influence of increased wind speeds during hail impact testing, by increasing the propulsion speed and varying the angle of impact. The cannons in the chamber are modular and controllable such that impact energies and hailstone sizes can be adjusted for future testing based on field measurements of impact energies and size distributions using the hail disdrometers, or desired experimental plans.
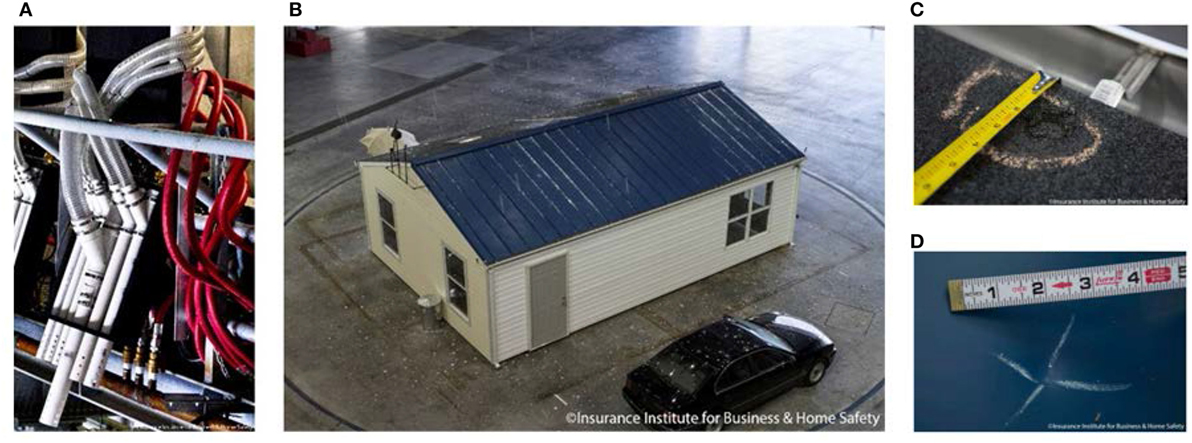
Figure 13. (A) One of 12 cannons, featuring 6 impact barrels, located in the test chamber at the IBHS Research Center. (B) IBHS full-scale hailstorm demonstration in 2013. (C) Damage on a 3-tab shingle on the test specimen. (D) Damage on the metal roof on the test specimen.
In 2013, a full-scale hailstorm demonstration was conducted in the IBHS test chamber, in which more than 9,000 laboratory ice spheres were made and projected at a full-scale residential building. The test building featured different materials or configurations in different quadrants of the roof (Figure 13B) to demonstrate the capabilities of the cannon system and ability to create realistic damage modes which included dents in aluminum gutters, cracks and tears in asphalt shingles (Figure 13C), and indentations of metal roof materials on the test building (Figure 13D). IR asphalt shingles were observed to have less severe damage than unrated shingles, and the metal roof was observed to have only cosmetic damage.
Future full-scale testing will include performance evaluations of different materials and systems, evaluations of cosmetic and functional damage modes, and evaluations of repair and replacement techniques. Ultimately, the knowledge gained through these kinds of tests could be applied to mitigate damage by selecting products with better impact performance, or effectively repair damage that may be seen during a typical supercell thunderstorm that produces hail, to reduce the need for expensive full roof cover replacements and potential loss of use.
Wind-Driven Rain Full-Scale Testing Capabilities
Water entry into a building can cause damage not only to exterior and interior finishes, but also to furniture and personal belongings. If not remedied quickly, extensive water entry can result in mold growth and/or prolonged loss of use, leading to even further loss costs. Because post-event damage investigations have reported that failure of the roof cover is commonly observed in hurricanes (Liu et al., 2010), the IBHS code-plus construction program, FORTIFIED Home™, requires the use of a sealed roof deck for residential construction to minimize water entry into the structure if the primary roof cover has failed. Evaluation of these systems, as well as other components vulnerable to water entry, has been limited in the past, primarily because of the inability to fully replicate complex building geometries. Inadequate modeling of these building geometries can affect the local aerodynamics close to the building which will affect the wetting of the building surfaces. The IBHS full-scale wind-driven rain system provides a unique capability to fill this gap. The primary goal of IBHS’ wind-driven rain research program is to better understand the vulnerabilities of roof systems and penetrations in exterior walls to the entry of wind-driven water. Research projects also focus on the effectiveness of mitigation strategies and help inform recommendations for incorporating effective methods into the FORTIFIED Home™ program.
The two primary design criteria for the wind-driven rain system were to create realistic rain droplet size distributions and raindrop deposition rates. Rain droplet size distribution targets were based on data collected during Hurricane Ike (Lopez, 2011), while a deposition rate of 203 mm/h (8 in/h) in 58 m/s (130 mph) winds was selected because of its use in ASTM Test Standards E331 (ASTM E331-00, 2016), E547 (ASTM E547-00, 2016), E1105 (ASTM E1105-15, 2015), and E2268 (ASTM E2268-04, 2016). Commercially available spray nozzles arranged in a 0.66 m by 0.61 m (2.2 ft × 2 ft) grid across the fan inlet were used. Grid spacing was selected to maximize water delivery uniformity. It is important to note that deposition rate is not equivalent to the wind-driven rain intensity, RWDR, which is the flux of water through a vertical plane, but is instead a function of several factors including building geometry and orientation. Straube and Burnett (2005) define the rain deposition rate as
where the driving rain factor DRF accounts for the interaction of wind and rain in undisturbed wind, θ is the angle between the wind vector and the vector normal to the building wall, rh is the rainfall rate through a horizontal plane, V(h) is wind velocity at some height h, and RDF is the building-dependent rain deposition factor, as defined for various building categories.
In the commissioning of the wind-driven rain system, Lopez (2011) utilized an OTT Parsivel disdrometer and precipitation imaging probe manufactured by Droplet Measurement Technologies to demonstrate that the installed gridded nozzle system can produce a wetting rate at the building facade of 203 mm/h (8 in/h) with a raindrop size distribution that matches well with historical literature (Marshall and Palmer, 1948; Best, 1950). However, historically, these data have been difficult to acquire in field settings due to the extreme environments present in tropical cyclones and thunderstorms so there are limited datasets for which comparisons can be done. Figure 14 provides an example of a droplet size distribution and concentration measured during a recent test series, where smaller droplets were produced in larger quantities than larger droplets for the wind speed, pump, and valve settings used. These types of data can be used to compare simulations. In addition to droplet sizes and concentrations, rainfall accumulation rates have been investigated using Parsivel disdrometers. Water flow rates of the wind-driven rain system affect the accumulated rainfall amount, as illustrated in Figure 15. These data were collected with varying valve settings, but a constant pump setting of approximately 60%. Both settings can be controlled based on the experimental design. As additional field data are collected in the future, or based on experimental design, droplets sizes, concentrations, and deposition rates can be altered by adjusting valve opening percentages and pump rates on the wind-driven rain system, and adjusting the wind speed records. The wind-driven rain system is explained in more detail in Lopez (2011) and summarized in Brown et al. (2015) and Quarles et al. (2012).
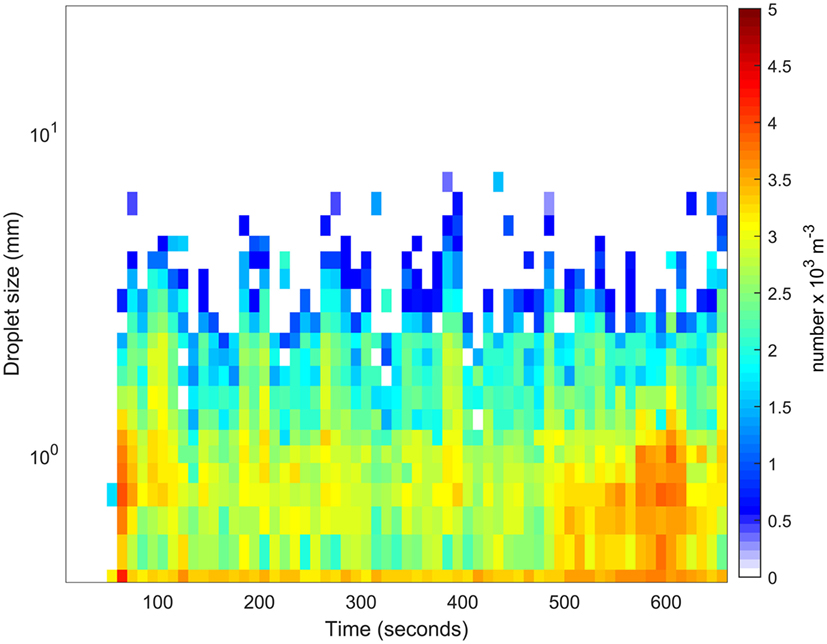
Figure 14. Time history of droplet size and concentrations during a test series using a 22 m/s (49 mph) constant wind speed.
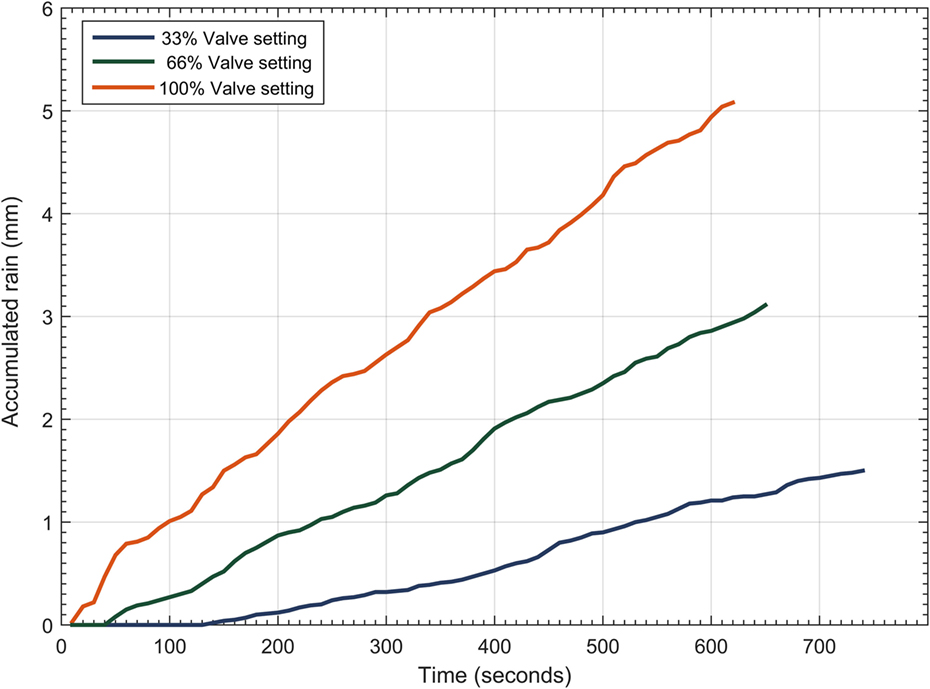
Figure 15. Rainfall accumulation rates as measured by a Parsivel disdrometer, as a function of flow rate for the wind-driven rain system at IBHS. The pump rate was held constant at approximately 60%.
The wind-driven rain system injects water into the wind stream in a horizontal trajectory, which is different from actual wind-driven rain that would likely have a greater vertical component. The system can accurately capture a real raindrop’s horizontal velocity component (Lopez, 2011), which is approximately equal to the wind speed, by injecting the droplets into the wind stream at fan level. However, rainfall created in the test chamber has a weaker vertical component than real rainfall as the fetch is too short for the horizontally injected rainfall to reach terminal velocity before reaching the test building, and therefore impacts the building at a more horizontal angle than would real rainfall. As a result, walls, which would be more protected from vertical rainfall by eaves or other overhangs in a real wind-driven rain scenario, would receive a greater amount of rainfall during testing.
Recent experiments have evaluated the efficacy of several sealed roof deck strategies allowed in the IBHS FORTIFIED Home™ program, such as those shown in Figure 16 (Brown et al., 2015; Johnston et al., 2016). These strategies, each evaluated individually, included double layer ASTM D226 Type II 30# felt underlayment and synthetic underlayment applied across the roof deck, modified bitumen and acrylic 10.2 cm (4 in.) tape applied at sheathing seams, and closed cell spray foam applied at panel-to-panel joints and sheathing seams on the interior of the roof. Water entry through vents has also been investigated (Quarles et al., 2012). In each of these studies, water collection systems such as those shown in Figure 17B were designed to capture and quantify water that entered the building (shown in Figure 17A) in different capture zones under the roof, or from different vents, windows, or doors on the test building. Using these systems, water weight, volume, and entry rates were determined, allowing for direct comparisons of the performance of sealing strategies and vent systems, which varied as a result of different wind speed and building orientations based on the geometry of the building.
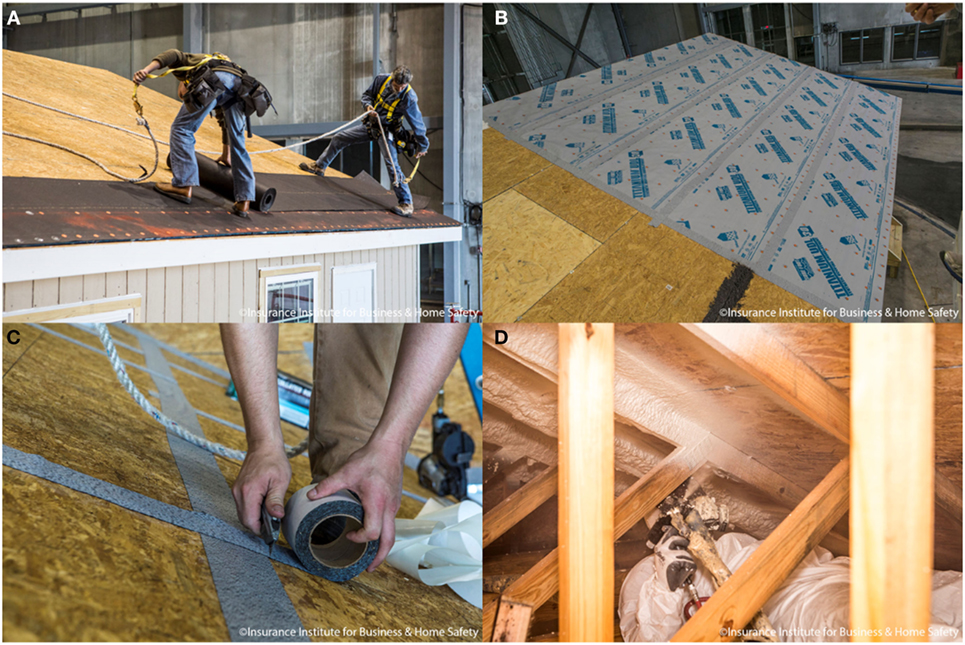
Figure 16. Roof deck sealing strategies included (A) double layer felt underlayment, (B) synthetic underlayment, (C) modified bitumen tape, and (D) closed cell spray foam.
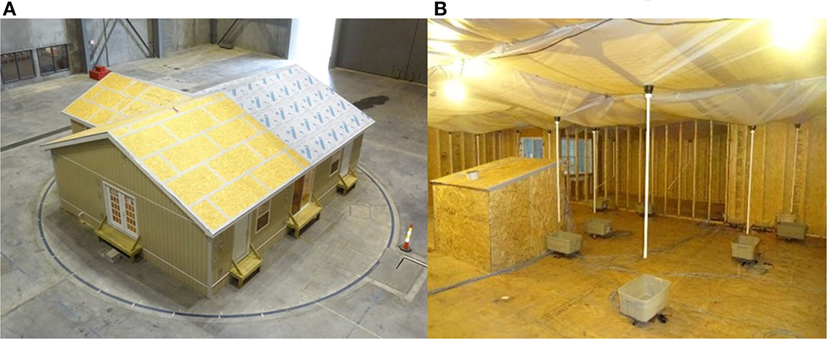
Figure 17. (A) Test building featuring two different sealed roof deck methods positioned on the turntable in the test chamber. (B) Water collection system allows water entry rates to be monitored in real time for different roof zones and penetrations.
Wildfire Full-Scale Testing Capabilities
As communities continue to expand into the WUI, the potential for property losses, injuries, and fatalities increases. In the past, research programs have focused on mitigation guidance, specifically the concept of defensible space surrounding a structure. Identification and evaluation of structural vulnerabilities has been limited, relying on post-event damage surveys and anecdotal information from fire officials. Similar to the wind-driven rain peril discussed in Section “Wind-Driven Rain Full-Scale Testing Capabilities,” experimental testing of systems and components has been limited primarily because of the inability to replicate complex building geometries, which will affect the local flow close to the building and, therefore, firebrand exposure and accumulation. The IBHS full-scale firebrand generator system provides a unique capability to fill this gap. The capabilities for studying the effects of wildfire include both small- and large-scale testing of structural ignition potential when exposed to firebrands, direct flame contact, or radiant heat. Results from experiments conducted add to the understanding of the relationship between firebrand exposure and building ignition, which is useful for developing mitigation strategies for individual buildings and communities.
A custom-made firebrand generator system, shown in Figure 18, was designed and manufactured at the IBHS Research Center to simulate a firebrand exposure similar to conditions observed in wildfires. The initial design was based on the generator developed at the National Institute for Standards and Technology (Manzello et al., 2008). To automate fuel delivery during testing, an auger system was developed. The fuel is comprised of a mixture of 80% pine wood chips and 20% wooden dowels that is dried to a moisture content of less than 10% before being placed in the hoppers shown on the left side of Figure 18 at point A. Beneath the hoppers, five augers (not shown) are used to feed the fuel into the auger feed lines shown at point B of Figure 18. The auger feed lines move the fuel to the generators at point C in Figure 18. Fuel is delivered intermittently to prevent the generators from overheating.
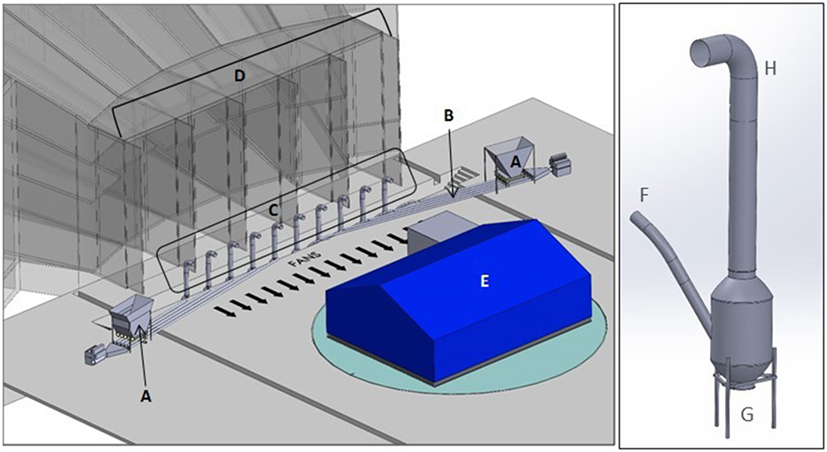
Figure 18. (A–E) Auger feed and firebrand generation system installed at the IBHS Research Center. The two hoppers are shown in (A); (B) indicates the auger feed lines which deliver fuel to the 10 generators indicated in (C); (D) is the fan array behind the generators; and (E) is a representative test building. (F–H) Schematic of the firebrand generators used in the wildfire experiments. (F) is the auger feed line which introduced the fuel into the generator; (G) is the location of the vertically oriented fan; and (H) is the exhaust chute.
The right side of Figures 18F–H illustrates one of the firebrand generators. The auger feed lines previously described connect to individual generators at point F. Fuel falls onto a metal grate (not shown) located over a burner inside the generator. Below the burner, a vertically oriented fan is placed on the bottom of the generator, indicated at point G on the right side of Figure 18. The fan introduces a vertical component of wind which pushes firebrands up and out of the exhaust into the wind stream of the test chamber at location H.
Figure 19 shows the operation of the firebrand generator system during testing. Experiments conducted using this system are unique compared to previous studies because of the ability to test full-sized buildings rather than individual components or two-dimensional assemblies, with exposure to realistic fluctuating boundary layer wind conditions (described in Section “Boundary Layer Flow Characteristics”), rather than constant winds. In addition, the effect of wind direction on the deposition of firebrands relative to the building geometry can be evaluated, allowing researchers to investigate where firebrands accumulate. This can be especially useful for complex building geometries where localized wind patterns can impact the location of maximum firebrand accumulation. Likewise, the performance of structural features subjected to a firebrand exposure can be assessed. Recent experiments have evaluated the ignition potential of wood and wood-plastic composite decking materials, vegetation materials, and roof and wall materials resulting from firebrand exposures. Firebrand entry though vents has also been investigated. Both quantitative and qualitative observations of entry, accumulation, and ignition are used to understand implications of firebrand exposures.
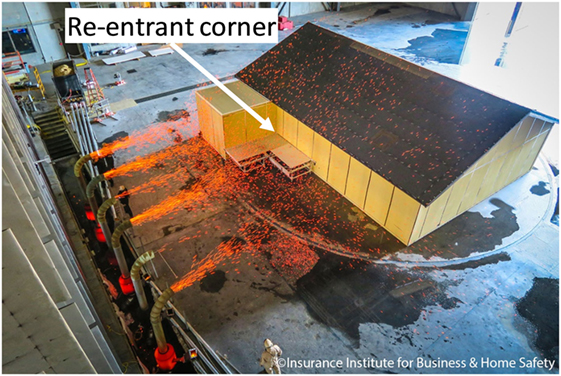
Figure 19. Firebrand exposure produced at the IBHS Research Center.
Accumulation of Firebrands
The accumulation of firebrands close to a structure is linked with ignition potential, so understanding the impact of wind speed and direction on firebrand accumulation in the vicinity of a structure is important in identifying vulnerable locations. Firebrand accumulation is typically evaluated using water-filled pans placed at select locations adjacent to a test building. The water quenches the firebrands, which are then collected, oven-dried, and weighed to determine spatial variations in accumulation. Observations during recent experiments indicated that re-entrant corners, shown in Figure 19, were an area with high firebrand deposition. Previous experiments at IBHS have also qualitatively investigated the location of maximum firebrand accumulation based on surface roughness immediately adjacent to a building. Firebrands on smooth surfaces were captured in the recirculation flow and able to settle further from the building. For rough surfaces, firebrands caught in the recirculation were captured in the rougher surface, resulting in areas of maximum accumulation immediately adjacent to the wall, which creates a higher risk of ignition and a subsequent flame contact and/or elevated amount of radiant heat.
Results from a recent accumulation study are shown in Figure 20. For each test, pans were placed at various locations along a test building. As expected, there was variability in the accumulation depending on building orientation, wind speed, and pan section [wall is immediately adjacent to the building; field is approximately 0.3 m (1 ft) from the building]. As indicated in Figure 20, a total of 13 different orientations were investigated in this given experiment. The orientation of the test building as shown in Figure 19 was designated as 90°. A clockwise rotation of the turntable allowed for an assessment of angles less than 90°. Similarly, for the larger angles investigated, the turntable was rotated counter-clockwise. The difference between 0°A and 0°B was the location of the re-entrant corner on the test building. In most cases, the accumulations for the wall sections were larger than the accumulations for the field sections, thus indicating greater vulnerability at locations immediately adjacent to the building. This is problematic, especially if the building is constructed with combustible materials that can directly ignite from a firebrand exposure. Likewise, a building can indirectly ignite if combustible material (i.e., vegetation, fences, etc.) near the building ignites from the firebrand exposure. These results highlight the importance of maintaining a non-combustible region immediately adjacent to a home or business.
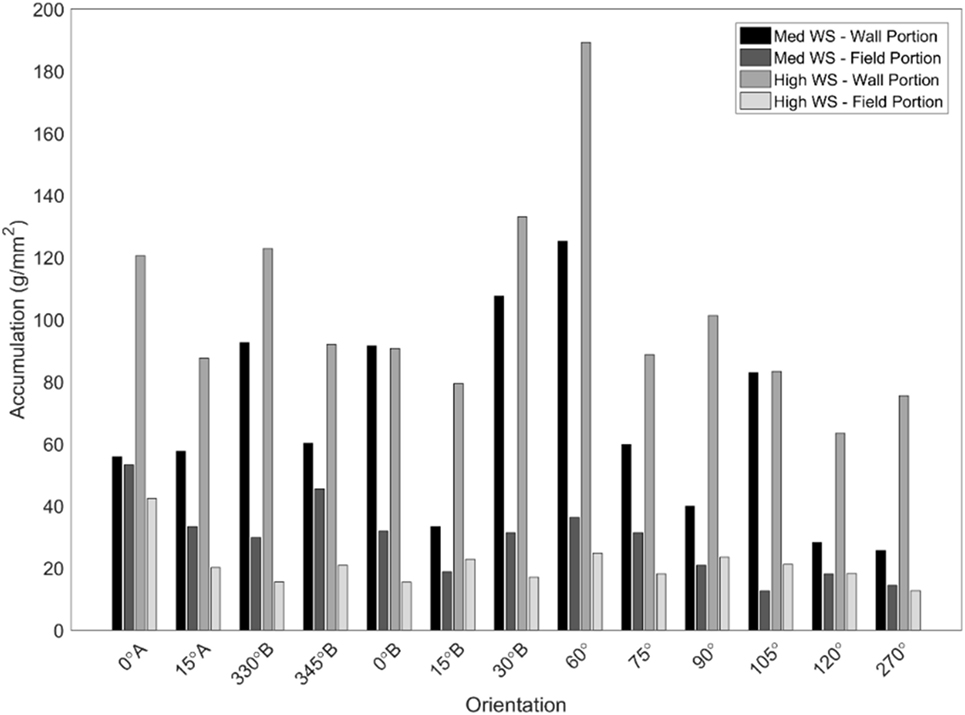
Figure 20. Firebrand accumulation by orientation, pan location, and wind speed.
Firebrand Characteristics
Representative samples of firebrands generated by IBHS were collected so they could be characterized by their mass and surface area to allow for comparison in future active wildfires. An example of firebrand characterization from recent IBHS experiments is shown in Figure 21. The firebrands produced at the IBHS Research Center are smaller than those observed by Manzello et al. (2011). However, this is compensated by the fact that the IBHS generators produced significantly more firebrands than the firebrand generators used by Manzello et al. (2011). Overall, the characterization of IBHS produced firebrands provided an initial assessment of the mass and size distribution. The fuel used in future research initiatives can be modified to better replicate the characterization of firebrands collected from active wildfires. Additionally, several recent tests at IBHS have included high resolution video of firebrand exposure in the vicinity of test buildings that will be used to track and count individual firebrands. This can be used to count firebrands impacting a specific location of a building or to count firebrands as they are generated from different fuels. This information, in conjunction with the mass and surface area of firebrands, can be used to estimate a firebrand mass flux (grams per square meter). Quantification of this variable will aid in the development of a WUI hazard scale that could be used to consistently quantify expected fire severity based on firebrand and fire exposure (Maranghides and Mell, 2012). By understanding the firebrand flux and resulting structural ignition, fragility curves could be developed for wildfire hazards.
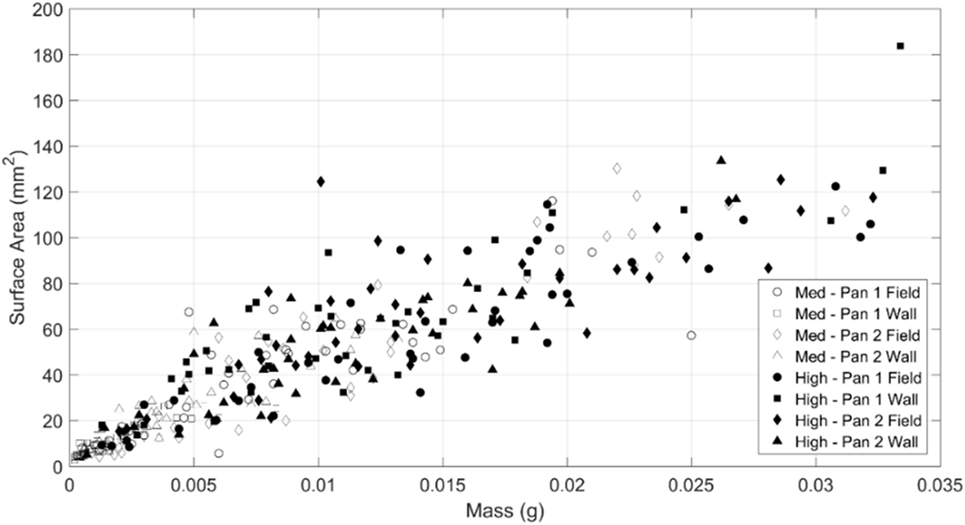
Figure 21. Mass versus surface area for firebrands collected from the firebrand generators.
Conclusion
Over the last 50 years, important advances have been made to improve the performance of both commercial and residential infrastructures subjected to wind-driven natural hazard events. Casualties in the US are dramatically lower for high-wind events than in developing countries around the world. Despite these improvements to the built environment, economic losses due to these natural perils have continued to increase (Pielke et al., 2008). Often, damage to a structure is severe enough to make it uninhabitable until repairs are made, resulting in social consequences for both individuals and communities at large.
Research programs at IBHS have focused on creating unique and realistic testing capabilities to improve understanding of real-world performance. Furthermore, these programs focus on identifying ways to make structures more resilient with the goal of reducing both the economic and social impact natural perils have both in the US and around the world. Research at the IBHS Research Center for high wind, hail, wildfire, and wind-driven rain aim to identify vulnerabilities in structures so that cost-effective mitigation strategies can be developed or identified. In addition, the performance simulated at the IBHS Research Center is compared to results from standardized testing and real-world observations, to facilitate improvements to standardized test methods. Future testing programs will address the effects of natural weathering, defining best practices for installation and maintenance, and distinguishing between cosmetic and functional damage modes, among other topics. Research results can be used in voluntary programs, such as FORTIFIED Home™, or in public policy, building codes and standards, and modeling applications. The insurance industry members that support IBHS can use findings in their underwriting and claims business practices, and society as a whole will benefit from reduced losses attributed to improved building performance.
Full-scale testing allows for a look at building system and component performance, something that is not often possible in model-scale testing. By using a combination of full-scale, small-scale, and field studies, research can be conducted to improve testing such that real-world performance can be better predicted and building systems improved to reduce losses.
Author Contributions
CS-A contributed to both experiments analysis and writing/approval of wildfire sections of the manuscript. HE contributed to both experiments analysis and writing/approval of hail sections of the manuscript. TJ contributed to analysis and writing/approval of wind-driven rain sections of the manuscript. MM contributed to experiments, analysis, and writing/approval of wind flow and wind pressures sections of the manuscript; in addition, wrote/approval introduction conclusions and facility overview sections. TB-G contributed to experiments and writing/approval of hail and wind-driven rain sections.
Conflict of Interest Statement
The authors declare that the research was conducted in the absence of any commercial or financial relationships that could be construed as a potential conflict of interest.
References
FM Approvals. (2005). Specification Test Standard for Impact Resistance Testing of Rigid Roofing Materials by Impacting with Freezer Ice Balls (FM 4473). West Glocester, RI: FM Approvals.
ASCE 49-12. (2012). Wind Tunnel Testing for Buildings and Other Structures. Reston, VA: American Society of Civil Engineers.
ASTM E1105-15. (2015). Standard Test Method for Field Determination of Water Penetration of Installed Exterior Windows, Skylights, Doors, and Curtain Walls, by Uniform or Cyclic Static Air Pressure Difference. West Conshohocken.
ASTM E2268–04. (2016). Standard Test Method for Water Penetration of Exterior Windows, Skylights, and Doors by Rapid Pulsed Air Pressure Difference. West Conshohocken, PA.
ASTM E331–00. (2016). Standard Test Method for Water Penetration of Exterior Windows, Skylights, Doors, and Curtain Walls by Uniform Static Air Pressure Difference. West Conshohocken, PA: ASTM International.
ASTM E547-00. (2016). Standard Test Method for Water Penetration of Exterior Windows, Skylights, Doors, and Curtain Walls by Cyclic Static Air Pressure Difference. West Conshohocken, PA.
Best, A. C. (1950). The size distribution of raindrops. Q. J. Roy. Meteorol. Soc. 76, 16–36. doi: 10.1002/qj.49707632704
Bilhelm, E. G., and Relf, E. F. (1937). The dynamics of large hailstones. Q. J. Roy. Meteorol. Soc. 63, 149–162. doi:10.1002/qj.49706326904
Bitsuamlak, G., Gan Chowdhury, A., and Sambare, D. (2009). Application of a full-scale testing facility for assessing wind-driven-rain intrusion. Build. Environ. 44, 2430–2441. doi:10.1016/j.buildenv.2009.04.009
Brown, T. M., and Giammanco, I. M. (2013). Multifaceted hail research initiative by IBHS. Interface 31, 5–8.
Brown, T. M., Quarles, S. L., Giammanco, I. M., and Brown, R. (2015). “Building vulnerability to wind-driven rain entry and effectiveness of mitigation techniques,” in Proceedings for 14th International Conference on Wind Engineering, Porto Alegre.
Changnon, S. A., Changnon, D., and Hilberg, S. D. (2009). Hailstorms across the nation: an atlas about hail and its damages. Champaign, IL: Illinois State Water Survey.
Cohcran, L. S., and Cermak, J. E. (1992). Full and model-scale cladding pressures on the Texas Tech University experimental building. J. Wind Eng. Ind. Aerod. 43, 1589–1600. doi:10.1016/0167-6105(92)90374-J
Davenport, A. G. (1961). The spectrum of horizontal gustiness near the ground in high winds. Q. J. Roy. Meteorol. Soc. 87, 194–211. doi:10.1002/qj.49708737208
Engineering Data Science Unit. (1982). Strong Winds in the Atmosphere Boundary Layer. Part 1: Mean-Hourly Wind Speeds, Data Item 82026. London, UK.
Engineering Data Science Unit. (1983). Strong Winds in the Atmosphere Boundary Layer. Part 2: Discrete Gust Speeds, Data Item 83045. London, UK.
Gartshore, I. S. (1973). The Effects of Free Stream Turbulence on the Drag of Rectangular Two-Dimensional Prisms. London, Canada: Boundary Layer Wind Tunnel Laboratory, 25.
Giammanco, I. M., and Brown, T. M. (2014). “Observation of hailstone characteristics in supercell and multicell thunderstorms,” in 94th Annual Meeting of the American Meteorological Society, Special Symposium on Severe Local Storms (Atlanta, GA). p. 1–12.
Giammanco, I. M., Brown, T. M., Grant, R. G., Dewey, D. L., Hodel, J. D., and Stumpf, R. A. (2015). Evaluating the hardness characteristics of hail through compressive strength measurements. J. Atmos. Ocean. Tech. 32, 2100–2113. doi:10.1175/JTECH-D-15-0081.1
Giammanco, I. M., Maiden, B. R., Estes, H. E., and Brown-Giammanco, T. M. (2016). Using 3-D laser scanning technology to create digital models of hailstones. Bull. Amer. Meteor. Soc. doi:10.1175/BAMS-D-15-00314.1
Heymsfield, A. J., Giammanco, I. M., and Wright, R. L. (2014). Terminal velocities and kinetic energies of natural hailstones. Geo. Phys. Res. Lett. 41, 8666–8672.
Johnston, T., Quarles, S. L., and Brown-Giammanco, T. M. (2016). “The effectiveness of roof-level selected secondary sealing strategies in minimizing water entry during high-wind and rain events,” in Proceedings for 4th American Association for Wind Engineering Workshop, Miami, FL.
Joss, J., and Waldvogel, A. (1969). Raindrop size distributions and sampling errors. J. Atmos. Sci. 26, 566–569. doi:10.1175/1520-0469(1969)026<0566:RSDASS>2.0.CO;2
Kinnell, P. I. A. (1972). The acoustic measurement of water drop impacts. J. Appl. Meteor. 11, 691–694. doi:10.1175/1520-0450(1972)011<0691:TAMOWD>2.0.CO;2
Kopp, G. A., Mans, C., and Surry, D. (2005). Wind effects of parapets on low buildings part 1. Basic aerodynamics and local loads. J. Wind Eng. Ind. Aerod. 93, 817–841. doi:10.1016/j.jweia.2005.08.006
Laurie, J. A. P. (1960). Hail and Its Effects on Buildings. Pretoria: Council for Scientific and Industrial Research.
Levitan, M. L., and Mehta, K. C. (1992a). Texas Tech field experiments for wind loads part I: meteorological instrumentation and terrain parameters. J. Wind Eng. Ind. Aerod. 43, 1565–1576. doi:10.1016/0167-6105(92)90372-H
Levitan, M. L., and Mehta, K. C. (1992b). Texas Tech field experiments for wind loads part II: building and pressure measuring system. J. Wind Eng. Ind. Aerod. 43, 1565–1576. doi:10.1016/0167-6105(92)90372-H
Lin, J. X., Surry, D., and Tieleman, H. W. (1995). The distribution of pressure near roof corners of flat roof low buildings. J. Wind Eng. Ind. Aerod. 56, 235–265. doi:10.1016/0167-6105(94)00089-V
Liu, Z., Pogorzelski, H., Masters, F., Tezak, S., and Reinhold, T. (2010). Surviving nature’s fury: performance of asphalt shingle roofs in the real world. Interface 28, 29–44.
Lombardo, F. T. (2009). Analysis and Interpretation of Thunderstorm Wind Flow and its Effects on a Bluff Body [PhD Dissertation]. Lubbock, TX: Texas Tech University.
Lopez, C. R. (2011). Measurement, Analysis, and Simulation of Wind Driven Rain. Gainesville, FL: The Graduate School of the University of Florida.
Manzello, S. L., Shields, J. R., Cleary, T. G., Maranghides, A., Mell, W. E., Yang, J. C., et al. (2008). On the development and characterization of a firebrand generator. Fire Saf. J. 43, 258–268. doi:10.1016/j.firesaf.2007.10.001
Manzello, S. L., Suzuki, S., and Hayashi, Y. (2011). Summary of Full-Scale Experiments to Determine Vulnerabilities of Building Components to Ignition by Firebrand Shower. NIST Special Publication 1126. Gaithersburg, MD: National Institute of Standards and Technology.
Maranghides, A., and Mell, W. (2009). A Case Study of a Community Affected by the Witch and Guejito Fires. NIST Technical Note 1635. Gaithersburg, MD: National Institute of Standards and Technology.
Maranghides, A., and Mell, W. (2012). Framework for Addressing the National Wildland Urban Interface Fire Problem – Determining Fire and Firebrand Exposure Zones using a WUI Hazard Scale. NIST Technical Note 1748. Gaithersburg, MD: National Institute of Standards and Technology.
Marshall, J. S., and Palmer, W. M. (1948). The distribution of raindrops with size. J. Meteorol. 5, 165–166. doi:10.1175/1520-0469(1948)005<0165:TDORWS>2.0.CO;2
Masters, F., Prevatt, D., and Gurley, K. (2010). Reduction of Wind-Driven Rain Intrusion through the Building Envelope. Tallahassee, FL: Florida Catastrophic Storm Risk Management Center.
Mikhaylovskaya, V. V. (1964). Theory of measuring the size of raindrops by acoustic method. Sov. Hydrol. Sel. Paper 1, 85–90.
Morgan, G. M., and Towery, N. G. (1976). On the role of strong winds in damage to crops and its estimation with a simple instrument. J. Appl. Meteorol. 8, 891–898. doi:10.1175/1520-0450(1976)015<0891:OTROSW>2.0.CO;2
Morrison, M. J., and Cope, A. D. (2015). “Wind Performance and evaluation methods of multi-layered wall assemblies,” in Proceeding of ASCE Structures Congress (Portland, OR), 2735–2748.
Morrison, M. J., Miccolis, C., and Reinhold, T. A. (2013). “Wind loads on small roof mounted air-conditioning units,” in Proceeding of the 12th Americas Conference on Wind Engineering (Seattle, WA).
Morrison, M. J., and Reinhold, T. A. (2015). “Performance of metal roofing to realistic wind loads and evaluation of current test standards,” in Proceeding of the 14th International Conference on Wind Engineering (Porto Alegre, Brazil).
Pielke, R. A. Jr., Gratz, J., Landsea, C. W., Collins, D., Saunders, M. A., and Musulin, R. (2008). Normalized hurricane damage in the United States: 1900-2005. Nat. Hazards Rev. 9, 29–42. doi:10.1061/(ASCE)1527-6988(2008)9:1(29)
Potter, M., and Leonard, J. (2010). “Spray system design for ember attack – research findings and discussion paper,” in CSIRO – Sustainable Ecosystems, Report No. EP103159, 1–27. Available from: http://www.bushfirecrc.com/sites/default/files/managed/resource/ember_attack_spray_research_report_final_0.pdf
Quarles, S. L., Brown, T. M., Cope, A. D., Lopez, C., and Fasters, F. J. (2012). “Water entry through roof sheathing joints and attic vents: a preliminary study,” in ATC-SEI Advances in Hurricane Engineering Conference (Miami, FL), 283–294.
Quarles, S. L., Valachovic, Y., Nakamura, G. M., Nader, G. A., and De Lasaux, M. J. (2010). Home Survival in Wildfire-Prone Areas: Building Materials and Design Considerations. Richmond, CA: University of California Agriculture and Natural Resources. ANR Publication 8393.
Quiroga, P. S. (2006). Uncertainty Analysis of Surface Pressure Measurements on Low-Rise Buildings [Masters Thesis]. London, ON: The University of Western Ontario.
Roeder, P. (2012). Severe Weather in North America: Perils Risks, and insurance. Munich, Germany: Munich RE.
Short, J. R. (2015). The West Is on fire – and the US Taxpayer Is Subsidizing It. The Conversation. Available at: https://theconversation.com/the-west-is-on-fire-and-the-us-taxpayer-is-subsidizing-it-47900.
Smith, D. (2010). Validation of Wind and Wind-Induced Pressure Data Collected at The Institute for Building and Home Safety’s State-of-the-Art Multi-Peril Applied Research and Training Facility. Lubbock, TX: Wind Science and Engineering Research Center.
Sparks, P. R., Schiff, S. D., and Reinhold, T. A. (1994). Wind damage to envelopes of houses and consequent insurance losses. J. Wind Eng. Ind. Aerod. 53, 145–155. doi:10.1016/0167-6105(94)90023-X
Straube, J. F., and Burnett, E. F. P. (2005). Building Science for Building Enclosures. Westford, MA: Building Science Press Inc.
Tieleman, H. W. (2003). Wind tunnel simulation of wind loading on low-rise structures: a review. J. Wind Eng. Ind. Aerod. 91, 1627–1649. doi:10.1016/j.jweia.2003.09.021
Underwriters Laboratory. (2012). UL 2218: Standard for Impact Resistance of Prepared Roof Covering Materials. Northbrook, IL: UL.
United States Forest Service. (2016). Managing Land – Fire. Available at: http://www.fs.fed.us/managing-land/fire
Keywords: damage, full-scale, hail, water ingress, wildfires, wind
Citation: Standohar-Alfano CD, Estes H, Johnston T, Morrison MJ and Brown-Giammanco TM (2017) Reducing Losses from Wind-Related Natural Perils: Research at the IBHS Research Center. Front. Built Environ. 3:9. doi: 10.3389/fbuil.2017.00009
Received: 01 October 2016; Accepted: 19 January 2017;
Published: 24 February 2017
Edited by:
Gregory Alan Kopp, University of Western Ontario, CanadaReviewed by:
Arindam Gan Chowdhury, Florida International University, USANigel Berkeley Kaye, Clemson University, USA
Copyright: © 2017 Standohar-Alfano, Estes, Johnston, Morrison and Brown-Giammanco. This is an open-access article distributed under the terms of the Creative Commons Attribution License (CC BY). The use, distribution or reproduction in other forums is permitted, provided the original author(s) or licensor are credited and that the original publication in this journal is cited, in accordance with accepted academic practice. No use, distribution or reproduction is permitted which does not comply with these terms.
*Correspondence: Murray J. Morrison, mmorrison@ibhs.org