Possible Failure Mechanism of Buildings Overturned during the 2011 Great East Japan Tsunami in the Town of Onagawa
 Panon Latcharote1*
 Anawat Suppasri1
 Akane Yamashita2
 Bruno Adriano1
Shunichi Koshimura1
Bruno Adriano1
Shunichi Koshimura1
 Yoshiro Kai3
Fumihiko Imamura1
Yoshiro Kai3
Fumihiko Imamura1
- 1International Research Institute of Disaster Science, Tohoku University, Sendai, Japan
- 2Earthquake Research Institute, University of Tokyo, Tokyo, Japan
- 3Department of Infrastructure Systems Engineering, Kochi University of Technology, Kochi, Japan
Six buildings were overturned in the town of Onagawa during the 2011 Great East Japan tsunami. This study investigates the possible failure mechanisms of building overturning during tsunami flow. The tsunami inundation depth and flow velocity at each overturned building were recalculated by using a tsunami numerical simulation and verified using a recorded video. The overturning moment is a result of hydrodynamic and buoyancy forces, whereas the resisting moment is a result of building self-weight and pile resistance force. This study aimed to demonstrate that the building foundation design is critical for preventing buildings from overturning. The analysis results suggest that buoyancy force can generate a larger overturning moment than hydrodynamic force, and the failure of a pile foundation could occur during both ground shaking and tsunami flow. For the pile foundation, pile resistance force plays a significant role due to both tension and shear capacities at the pile head and skin friction capacity between the pile and soil, which can be calculated from 18 soil boring data in Onagawa using a conventional method in the AIJ standards. In addition, soil liquefaction can reduce skin friction capacity between the pile and soil resulting in a decrease of the resisting moment from pile resistance force.
Introduction
During the 2011 Great East Japan earthquake and tsunami, many buildings were seriously damaged by a combination of ground shaking, tsunami flow, debris impact, and soil liquefaction. After the 2011 Great East Japan tsunami, overturned buildings were found unexpectedly in two locations: (1) six buildings [i.e., five reinforced concrete (RC) buildings and one steel-frame building] in the town of Onagawa in Miyagi Prefecture and (2) two buildings in the city of Miyako in Iwate Prefecture. This study focused on the overturned buildings in Onagawa because of the comprehensiveness of the building-related information, soil information, and tsunami simulation results. These overturned buildings were built more than 30 years ago over filled soil foundations. A field survey revealed that one of the six overturned buildings in Onagawa was built on a shallow foundation, and the other buildings had a pile foundation; one of the buildings was overturned and moved 70 m from its original position (Suppasri et al., 2012; Latcharote et al., 2014). Based on inundation data, these overturned buildings were fully (or at least nearly) submerged and overturned by the following possible causes: (a) hydrodynamic force, including debris effects; (b) buoyancy force; and (c) weakened foundation associated with soil instability (Yeh et al., 2013). Therefore, the maximum inundation depth exceeded the height of all overturned buildings in Onagawa, and it was assumed that those buildings were overturned during the overtopping tsunami flow.
The one famous instance of an overturned RC building occurred in 1946 following an Aleutian tsunami, in which an 18-m-tall lighthouse at a ground elevation of 10 m was overturned by a 30-m tsunami. In Japan, building overturning had not been reported in previous earthquakes and subsequent tsunamis and thus was not considered in building foundation design. However, building overturning is now considered in the design guidelines for building foundations (Architectural Institute of Japan, 2001), particularly for tsunami evacuation buildings. In recent years, the seismic performance design of pile foundations has considered the rocking of pile caps and the negative friction of piles to resist the uplift of buildings. During tsunami flow, building overturning can occur as a result of lateral force (hydrodynamic force) and uplift force (buoyancy force), the latter of which depends on the dimensions from the top of the window opening to the ceiling in buildings. Based on the surveyed data, most of the piles were likely broken by tension and shear failures at the pile head and insufficient friction between the pile and soil, including the effect of soil liquefaction, which caused the piles to be easily pulled out of the ground. During soil liquefaction, the soil shear strength is decreased, thereby decreasing the shaft resistance (skin friction) between the pile surface and soil around the pile (Fraser et al., 2013). This decreased shaft resistance would allow the greater vertical movement of the piles while in the ground. The piles would then be pulled from the ground more easily when the building is subjected to uplift and lateral forces from tsunami flow and debris impact, which were significant in Onagawa due to the extreme inundation depth (Fraser et al., 2013). Soil liquefaction changed the soil properties and caused a loss of skin friction capacity between the pile and soil because of the loosening of soil around the pile.
Therefore, the building foundation would be the main consideration of building overturning in Onagawa. The overturning mechanism of these overturned buildings has been thoroughly investigated in previous studies, such as Ishida et al. (2015), Tokimatsu et al. (2016), and Yeh and Sato (2016), and few design considerations have been suggested. This study investigates the overturning mechanism in different ways and also considers the effect of soil liquefaction, which can result in a decrease of skin friction capacity between the pile and soil. Based on experimental studies of geotechnical problems, this study suggests a conventional method to evaluate the approximate skin friction capacity when soil liquefaction occurs. The possible failure mechanism of the overturned buildings can then be investigated by comparing the overturning moment and resisting moment. The results of this study can be used to improve the recommendations for building foundation design in a building design code.
Characteristics of Five Overturned Buildings
Our survey team observed that most of six overturned buildings in Onagawa had shifted away from sea and thus appeared to be overturned by striking wave. The tsunami force is estimated to be many tons per square meter with a long-period wave (e.g., 30 min), which led to a prolonged interaction of tsunami flow acting on these overturned buildings. The water released from the uppermost floors of the buildings generated uplift force, which caused a large overturning moment with hydrodynamic force. Small openings were observed in these overturned buildings, which could also generate large uplift force. However, there was sufficient time for water to flow inside the buildings because of the long-period wave. Thus, only the accumulated air between the top of the windows and the ceiling generated buoyancy force (Suppasri et al., 2013). The survey team also stated that most of the piles were probably pulled out and broken at the pile head as a result of ground shaking, hydrodynamic force, buoyancy force, and soil liquefaction. Five overturned buildings (i.e., Buildings A, B, C, D, and E) in Figure 1 were analyzed in this study, and the characteristics of each overturned building are provided below.
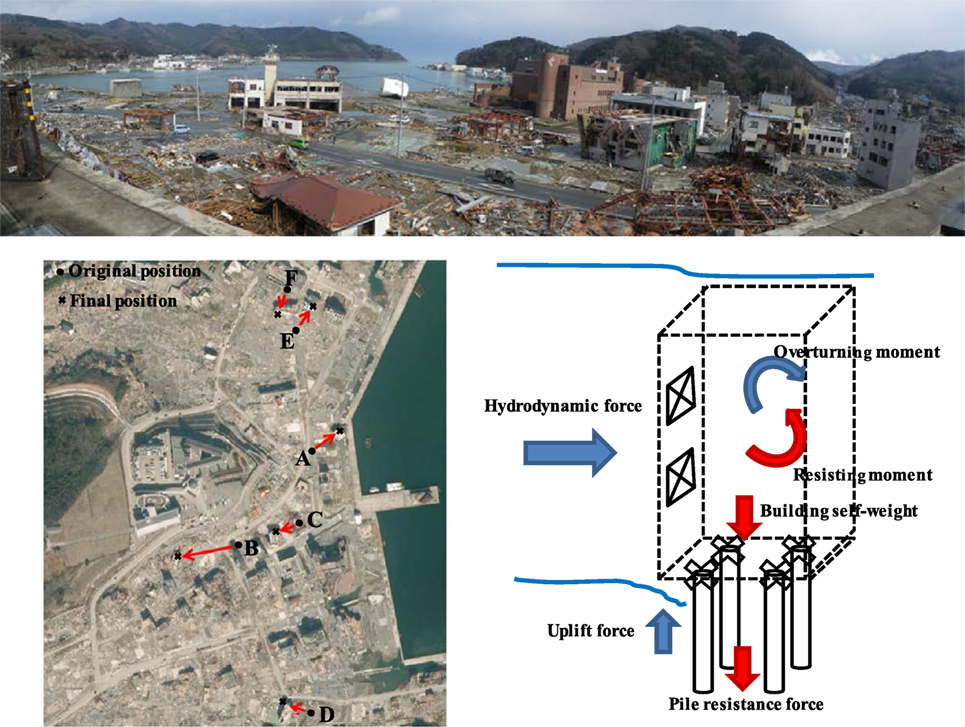
Figure 1. Six overturned buildings in the town of Onagawa and free-body-diagram of building overturning. Note: taken by our survey team in March 29, 2011 at the town of Onagawa and Google Earth.
Building A
Building A is believed to have been built between 1965 and 1970 adjacent to the shoreline (Onagawa, 2013). It was used as a repair shop of fishing boats in the past but was being used as a commercial store before the tsunami (Onagawa, 2013). The building was submerged by 0.4 m of seawater at high tide for many months after the tsunami due to the residual subsidence from the earthquake. The building was a three-story RC structure with a mat foundation on hard ground, as shown in Figure 2A. Small openings were observed on the face of this building subject to tsunami flow. As shown in Figure 1, this building overturned seaward, but it is expected that the initial failure was landward (consistent with the other buildings) and this building was then moved during tsunami return flow to its final position (Fraser et al., 2013). On the other hand, the building may have been overturned seaward by the receding wave (Onagawa, 2013). Due to the mat foundation, only building self-weight could provide a resisting moment against the overturning moment from hydrodynamic and buoyancy forces.
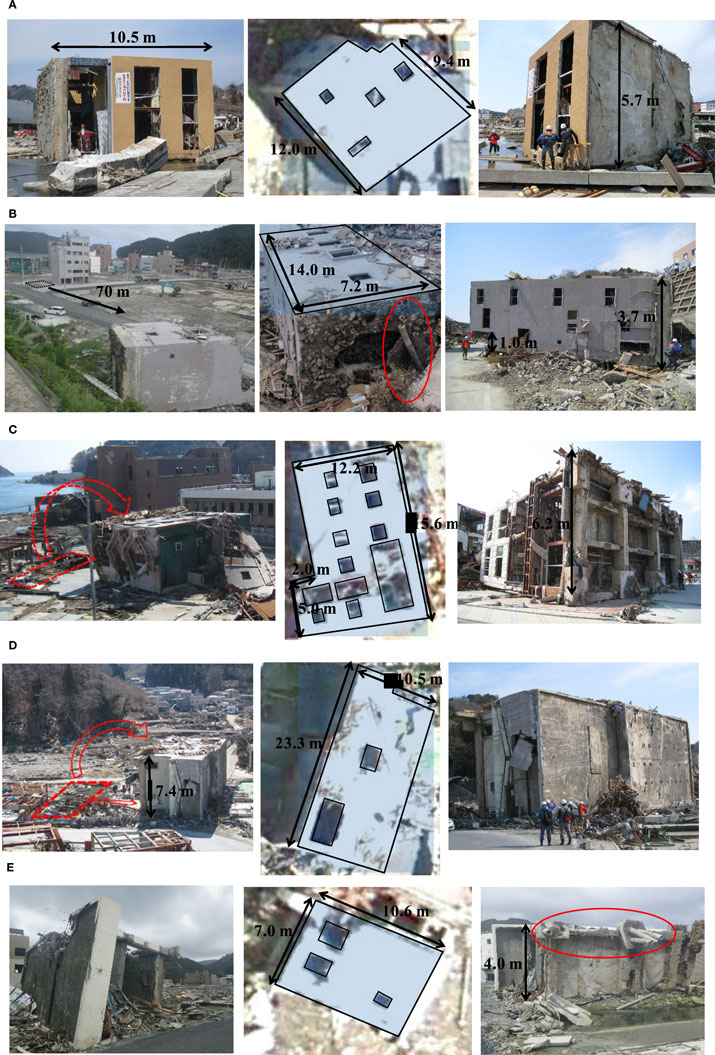
Figure 2. The characteristics of five overturned buildings in the town of Onagawa. (A) Building A, (B) Building B, (C) Building C, (D) Building D, and (E) Building E. Note: taken by our survey team in March 29, 2011 and July 9, 2011 at the town of Onagawa.
Building B
Building B is believed to have been built between 1955 and 1975 based on its type of foundation (Nikkei BP Company, 2011). It was an accommodation building with a four-story RC structure and a pile foundation, as shown in Figure 2B. The pile foundation had 32 hollow concrete pipe piles with a pile diameter of 20 cm. This building was moved 70 m from its original position. As shown in Figure 2B, some piles were pulled from the ground, and some were broken under the foundation. Twelve of the 32 piles under the foundation appear to have been effective in resisting the overturning moment (Kabeyasawa et al., 2012). No spiral reinforcing bar was observed inside the piles, but six longitudinal reinforcing bars were observed inside each pile. The settled ground around a neighboring building indicated the occurrence of soil liquefaction (Tokimatsu et al., 2012).
Building C
Building C is believed to have been built between 1980 and 1985 (Onagawa, 2013). The building was used as an accommodation facility in the past but was being used as offices for private business and accommodations for sailors before the tsunami (Onagawa, 2013). The building was moved approximately 10–16 m from its original location by the tsunami (Onagawa, 2013). The building was submerged by 0.2 m of seawater at high tide for a short period after the tsunami. It was a four-story steel-frame building with a pile foundation, as shown in Figure 2C. The pile foundation had 8 pile caps with 20 piles having a diameter of 25 cm. Most hollow concrete pipe piles failed at the connection to the pile cap under the foundation unless one pile on the upper right was pulled out. A spiral reinforcing bar and six longitudinal reinforcing bars were observed inside each pile, and the six reinforcing bars had ruptured. This building was constructed from steel frames and ALC walls; thus, building self-weight was less than that of RC buildings. This building was floated, carried away and then overturned by tsunami flow, and most of the piles were broken at their joints with the pile caps (Tokimatsu et al., 2012).
Building D
Building D is believed to have been built between 1965 and 1975 (Nikkei BP Company, 2011). It was used as a refrigerated warehouse with a two-story RC structure and a pile foundation, as shown in Figure 2D. The pile foundation had six pile caps with four piles with a diameter of 20 cm in each pile cap. All piles were broken at the pile caps. No spiral reinforcing bar was observed inside the piles, but six longitudinal reinforcing bars were observed inside each pile. This building was floated more than 1 m and moved approximately 7 m, and all piles were ruptured at or near the joints (Tokimatsu et al., 2012). No pile remained connected to the pile caps, suggesting a higher level of shear in the overturning motion than was experienced in the other overturned building with a pile foundation (Fraser et al., 2013). This building was lifted by the hydrostatic buoyancy off of its pile foundation, which did not have tension capacity due to the minimal reinforcing steel (Chock et al., 2013). In addition, it was lifted off its original site and carried over a low wall before being deposited approximately 15 m inland from its original location (Chock et al., 2013).
Building E
Building E is believed to have been built in 1980 (Onagawa, 2013). It was a police box on the first floor and a rest area on the second floor (Onagawa, 2013). The building was overturned near its present location and then moved to its present location by the receding wave (Onagawa, 2013). Some damage from floating debris can be observed on the upper part of the building. The building was submerged by 0.3 m of seawater at high tide for a short period after the tsunami. The building was a two-story RC building with a pile foundation, as shown in Figure 2E. The pile foundation had 6 pile caps with 14 piles having a diameter of 25 cm, and most of the piles were pulled out of the ground. No spiral reinforcing bar was observed inside the piles, but six longitudinal reinforcing bars were observed inside each pile. The settled ground near a neighboring building indicates that liquefaction occurred (Tokimatsu et al., 2012).
Factors Influencing Building Overturning
Tsunami Inundation
Based on a video recorded from the rooftop of a building in Onagawa, a thorough analysis of the tsunami inundation was conducted using numerical modeling and measurements (Adriano et al., 2016). Numerical tsunami simulations were performed to reproduce the calculated time series of tsunami flow using the tsunami source model proposed by the Cabinet Office, Government of Japan. The simulations demonstrate that the maximum inundation depth due to the first incoming wave was over 16 m, and more than 500 buildings were washed away by this first wave, which is consistent with the video data (Adriano et al., 2016). The source model was verified with the observed tsunami inundation depth and flow velocity interpreted from the video record including the measured depth of maximum tsunami inundation of 30 points from tsunami watermark and the inundation area measured by field survey and satellite image analysis (Adriano et al., 2016). This study extended this reliable source model of tsunami numerical simulations to reproduce the waveforms of tsunami inundation depth and flow velocity at each overturned building. Then, these waveforms were used to estimate hydrodynamic and buoyancy forces in time series in order to investigate the possible mechanism of building overturning.
The tsunami inundation depth and flow velocity in the time series at each overturned building validated by the interpretation of the video data are shown in Figure 3. The peak inundation depth and peak flow velocity occurred at different times, which could result in the induction of large hydrodynamic force at any time during the striking or receding wave. Figure 3A shows the calculated time series of the tsunami inundation depth and flow velocity in 2014 (Adriano et al., 2014). In this 2014 simulation, the maximum inundation depth was not consistent with the video analysis, although the maximum flow velocity was somewhat consistent. Figure 3B shows the calculated time series of the tsunami inundation depth and flow velocity in 2016, including the crustal deformation (Adriano et al., 2016). In this 2016 simulation, the maximum inundation depth was consistent with the video analysis, whereas the maximum flow velocity was lower than that of the video analysis. However, these numerical tsunami simulations were generated by the tsunami source model, which is typically used to reproduce tsunami propagation for all affected areas in Japan after the 2011 Great East Japan tsunami. This source model is not specific to only the studied area in Onagawa, which makes it different from other reverse models that attempt to be consistent with the video evidence. In this study, sets of inundation depth and flow velocity from both 2014 and 2016 simulations were used to estimate hydrodynamic and buoyancy forces.
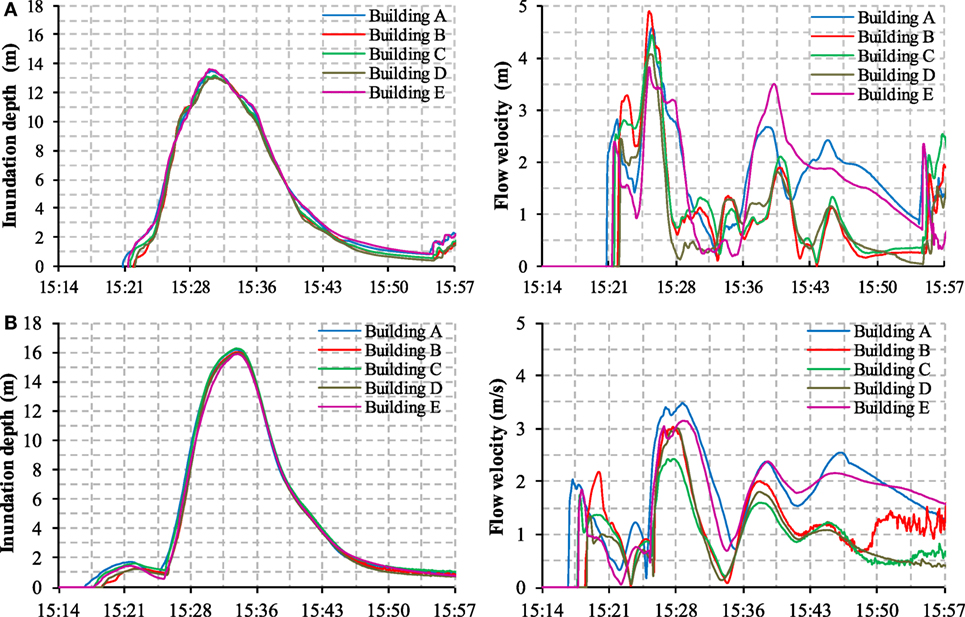
Figure 3. Tsunami inundation depth and flow velocity from 2014 and 2016 simulations. (A) 2014 simulation and (B) 2016 simulation.
Hydrodynamic Force
The overturning moment is partially the result of hydrodynamic force, which can be calculated from the inundation depth and flow velocity, as shown in Figure 3. This study assumed that these overturned buildings were surrounded by water and had a minimum unbalanced hydrostatic force, i.e., a minimum tsunami load. For each overturned building, hydrodynamic force (Fd) was applied as a uniform load over the depth of tsunami flow (Federal Emergency Management Agency, 2011) as
where ρs is the density of salt water with sediment (1,200 kg/m3), Cd is the drag coefficient (2.0), B is the building width in the plane normal to the direction of flow, h is the inundation depth or building height, and u is the flow velocity.
Buoyancy Force
The overturning moment is also partially the result of buoyancy force, which can be calculated from the inundation depth shown in Figure 3. For each overturned building, buoyancy force (Fb) was set equal to the water weight of the residual air space inside it, which also depends on the opening ratio. A residual air space ratio (Cb) of 0 indicates that the entire building was filled with water, whereas a residual air space ratio of 1.0 indicates that no water entered the building, expressed as
where ρs is the density of salt water with sediment (1,200 kg/m3), Cb is the residual air space ratio varying with the relative volume of entrapped air inside the building (0.0–1.0), g is the gravitational acceleration (9.81 m/s2), B is the building width, D is the building depth, and h is the inundation depth or building height.
Building Self-Weight
The resisting moment is also partially the result of building self-weight, which can be calculated from the weight per unit area of the RC and steel buildings. The concrete density is typically 2,400 kg/m3. In this study, the weight per unit area of the RC buildings is assumed to be 14 kPa, whereas the weight per unit area of the steel buildings is assumed to be 8 kPa.
Pile Resistance Force
The resisting moment is also partially the result of pile resistance force, which can be calculated from the pile and soil. From the damage observed in the overturned buildings with a pile foundation, two possible cases of pile damage were identified: tension or shear failure at the pile heads and pulling of the pile from the ground.
Tension and Shear Capacities
In the case of tension failure, pile resistance force (RTC) can be calculated from the fracture strength of the PC steel wire (Fu) inside the pile and from the shear strength of the pile section (Qu) for the case of shear failure. Tokimatsu et al. (2016) suggested the tension and shear capacities of piles in a pile foundation based on the catalog specifications.
Skin Friction Capacity
Eighteen soil boring data were obtained from the Onagawa office to represent the soil profiles of overturned buildings with pile foundations, as shown in Figure 4. The coastal area in Figure 4A (covered by the red-dashed line) was largely filled by soil (Onagawa, 1960). A soil boring data contains soil layers, such sand, gravel, silt, and clay, and N value, as shown in Figure 4B. In the case of pulling a pile out of the ground, pile resistance force (RTC) is calculated from skin friction capacity (Qs) between the pile and soil based on the recommendations for the design of building foundations (Architectural Institute of Japan, 2001) as
where τst is the friction stress in a sand layer, Ls is the length of a sand layer, τct is the friction stress in a clay layer, Lc is the length of a clay layer, and φp is the peripheral length of a pile. In this equation,
where αp is the adhesive factor (0.5–1.0), Lf is the length index (0.7–1.0), and Cu is the average undrained shear strength.
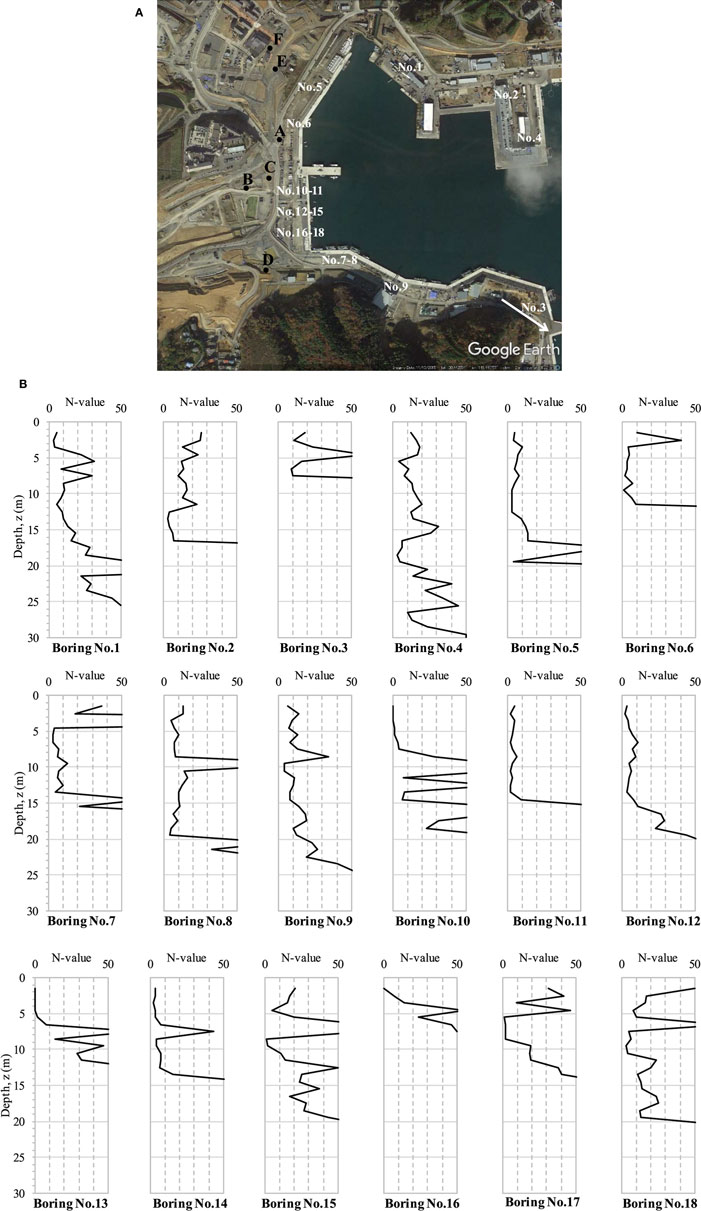
Figure 4. 18 soil boring data in the town of Onagawa. (A) 18 boring locations (Google Earth). (B) Standard penetration test (SPT)-N value.
The adhesive factor (αp) varies with the ratio of undrained shear strength and effective overburden pressure of silt and clay, whereas the length index (Lf) varies with the ratio of the layer thickness and the pile diameter.
Soil Liquefaction
In general, the evaluation of soil liquefaction during ground shaking and its effects on a pile foundation are highly complex because the seismic ground motion at the site must be considered. In addition, the dissipation of pore-water pressure and lateral ground spreading must be considered to investigate their effects on the soil–pile interaction, which could be caused by the main shock before the tsunami arrival. Therefore, the liquefaction process might be completed before the tsunami arrival and the shear strength of the soil might have recovered by the dissipation of pore-water pressure. However, it may take longer for the soil to regain its shear strength so it might occur within the several tens of minutes between the main shock and tsunami arrival, such as with the repeated occurrence of soil liquefaction in New Zealand within a year due to the September 2010 Canterbury earthquake and the February 2011 Christchurch earthquake.
Because soil liquefaction is an interaction between soil and water, it takes time for the soil and water to slide out. Based on field surveys after two earthquakes in Japan, Mizutani (2008) reported that the soil liquefaction process took considerably longer than the ground shaking process. In the case of the 1964 Niigata earthquake, the sand boiling started after the ground shaking ended, and a large amount of soil boiling was observed for more than 10 to several tens of minutes. In the case of the 1983 Japan Sea earthquake, there was a report of a large sand boil hole with a diameter of 8 m and a depth of 1.5 m that sprayed soil with to a height of 10 m (Japanese Geotechnical Society, Tohoku Branch, 1986), and the outflow of water lasted for more than half a day. Therefore, the direct damage caused by strong ground shaking occurs over several tens of seconds, whereas the indirect damage caused by soil liquefaction requires much more time, and thus is responsible for minimal or no fatalities.
Yeh et al. (2013) suggested that soil liquefaction due to strong ground shaking of the earthquake that had occurred approximately 40 min prior to the tsunami arrival may have further promoted overturning failure. Fraser et al. (2013) also suggested that although any evidence of liquefaction was washed away in the tsunami, it may have contributed by loosening the soil around the piles prior to the overturning motion. Although, the liquefaction process in Onagawa is still not fully understood, it is worth considering the effect of soil liquefaction based on a building design standard because the 2011 tsunami arrived at Onagawa within approximately 40 min of its initiation, when soil liquefaction could not have been negligible. In this study, cases with and without soil liquefaction will be analyzed and compared.
Effect of Soil Liquefaction on Skin Friction Capacity
The possibility of soil liquefaction might not have been considered in the design of these overturned buildings because the effect of soil liquefaction on pile foundation had likely not been clearly described. Many factors influence the occurrence of soil liquefaction, such as the earthquake magnitude, peak ground acceleration, and soil condition. The Technical Standard Manual for Building [Building Center of Japan (BCJ), 2007] proposed the determination of soil conditions, such as liquefaction hazards. It suggested that soil liquefaction can occur in sandy soil based on four conditions, including alluvium within 20 m from the ground surface, saturated soil, less fine particles, and a lower N value. In this study, a conventional method based on the AIJ standards was used to evaluate the effect of soil liquefaction on the pile foundations. Based on the recommendations for design of building foundations (Architectural Institute of Japan, 2001), a description of the soil properties in this conventional method can be used to calculate the safety factor of each soil layer against the occurrence of soil liquefaction. This safety factor indicates the potential for soil liquefaction, which can cause a loss of skin friction between the soil and pile and result in a reduction of total pile resistance force.
Because boring data were not available at the exact location of each overturned building, skin friction capacity was evaluated from 18 boring data in an adjacent area. The majority of the filled soil at these 18 boring locations contains sand and gravel, which can cause a loss of skin friction between the pile and soil when soil liquefaction occurs. With this assumption, the conventional method was sufficient to calculate skin friction capacity when soil liquefaction occurs. Based on the report from field surveys after the 2011 Great East Japan tsunami (National Institute for Land and Infrastructure Management (NILIM) and Building Research Institute (BRI) in Japan, 2012), a sample calculation of skin friction capacity from this conventional method for boring No. 1 in Figure 4 is shown in Table 1. Skin friction capacity (Qs) can be calculated from the friction stress of the pile in sand and clay layers. The objective of this conventional method is to evaluate skin friction capacity when soil liquefaction occurs , as shown in Table 1. The soil parameters in Table 1 are explained in Table 2. The cyclic resistance ratio (CRR) and cyclic stress ratio (CSR) were used to calculate the safety factor (FS), which can determine skin friction capacity during soil liquefaction as
where M is the earthquake magnitude, αmax is the peak ground acceleration, and γd is the stress reduction factor, which equal to 1 − 0.015z.
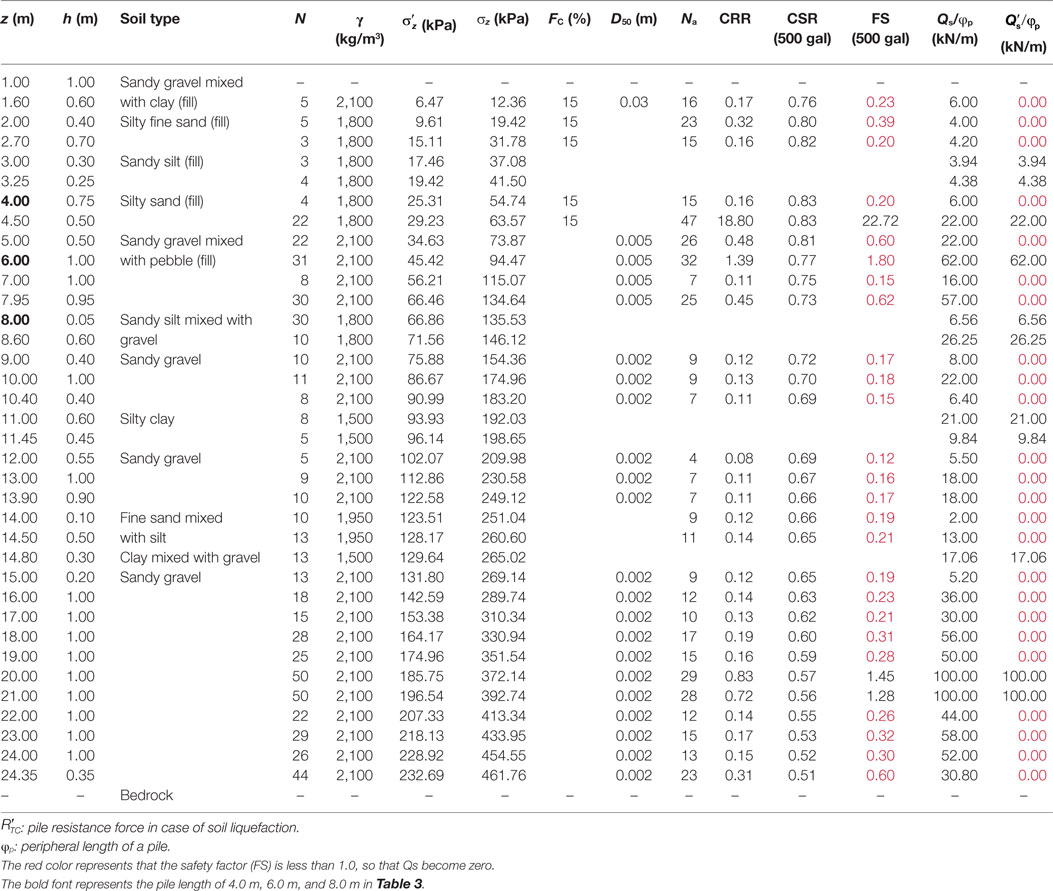
Table 1. Evaluation of skin friction capacity for boring No. 1.
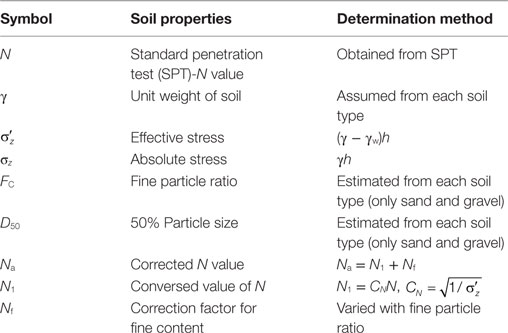
Table 2. Description of each parameter (Architectural Institute of Japan, 2001).
The CRR can be estimated from the N value of the standard penetration test, and the CSR can be estimated from the peak ground acceleration and earthquake magnitude. As noted above, sand and gravel may cause a loss of skin friction capacity between the pile and soil when soil liquefaction occurs. As shown in Table 1, skin friction capacity becomes 0 if the safety factor is less than 1. Total pile resistance force of each pile was calculated by the summation of all soil layers multiplied by the peripheral length of a pile. To calculate the resisting moment from pile resistance forces, the load distribution on the pile group was considered for the summation of all piles. From these 18 boring data in the adjacent area, skin friction capacity in each pile length was evaluated, resulting in a decrease of total pile resistance force, as shown in Table 3. The overturning moment from hydrodynamic and buoyancy forces and the resisting moment from building self-weight and pile resistance force were considered to investigate possible overturning mechanisms in the next section.
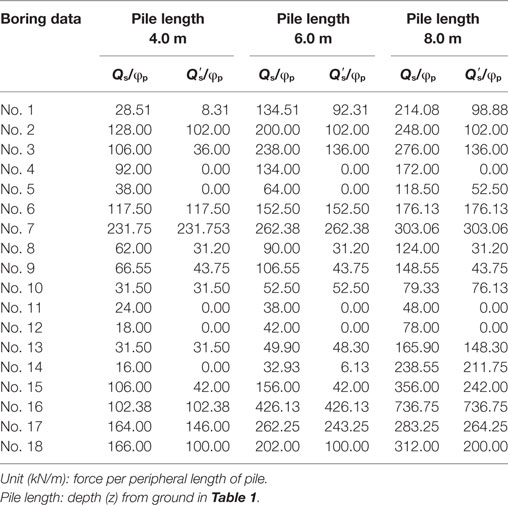
Table 3. Skin friction capacity of 18 soil boring data for each pile length.
Possible Overturning Mechanism
When investigating the possible mechanism of each overturned building, the overturning moment is the result of hydrodynamic and buoyancy forces, whereas the resisting moment is the result of building self-weight and pile resistance force. For a pile foundation, all of the piles could fail during the ground shaking due to large base shear force between the pile heads and pile caps; thus, the overturned buildings could resist tsunami flow using only their building self-weight. These overturned buildings floated and then moved from their original positions, so buoyancy force rapidly exceeded building self-weight after overturning. However, all piles may also have still been in good condition to resist tsunami flow after the ground shaking. Thus, two possible mechanisms of these overturned buildings with pile foundation are tension failure at the pile heads and pulling of the piles out of the ground.
Potential Shear Failure of Piles during Ground Shaking
For low-rise regular buildings, equivalent static seismic loads are sufficient to consider base shear force instead of dynamic loads during the ground shaking. The equivalent static seismic loads can be calculated based on a response spectrum analysis using natural period. Based on the AIJ Recommendations for Loads on Buildings (Architectural Institute of Japan, 2004), a simplified method can be used to evaluate the equivalent static seismic loads from the observed response spectrum at the site and an approximation of natural period (T1) for each overturned building. Therefore, the approximate base shear force (VB) can be calculated as
where Sa is the acceleration response at the base of the foundation, g is the gravitational acceleration (9.81 m/s2), W is building self-weight, and αh is the ratio of steel-frame height to total building height (h).
The base shear force was compared with total shear capacity of the piles in Section “Tension and Shear Capacities” to investigate the potential shear failure of the piles during ground shaking using a safety factor between total shear capacity (∑Qu) and base shear force (VB). Table 4 shows the calculation of total shear capacity and base shear force for Buildings B, C, D, and E. The acceleration response (Sa) was obtained from the response spectrum in Ishinomaki city that was provided by NIED, which is the nearest available data to Onagawa [National Research Institute for Earth Science and Disaster Resilience (accessed 2016)]. Based on the safety factor, all piles of Building D failed during the ground shaking due to large base shear force between the pile heads and pile caps, whereas all piles of Buildings C and E were still in a sufficiently good condition to resist tsunami. In addition, some piles of Building B could have failed during the ground shaking because the safety factor is close to 1.00, as shown in Table 4.
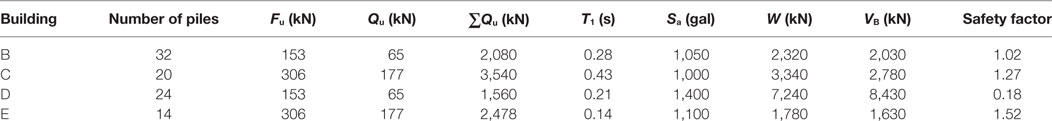
Table 4. Total shear capacity (∑Qu) and base shear force (VB) at pile foundation.
Overturned Buildings Resisted by Only Building Self-Weight
The possible overturning mechanism of Buildings A and D was investigated by comparing the overturning moment calculated from hydrodynamic force (Fd) and buoyancy force (Fb) to the resisting moment calculated from building self-weight (W). Building A had a mat foundation, and all piles of Building D failed during the ground shaking, as shown in Figure 5. Figure 6A shows the tsunami inundation depths and flow velocities at Buildings A and D in the 2014 and 2016 simulations. The residual air space ratio (Cb) was estimated based on the condition of larger buoyancy force than building self-weight, as shown in Figure 6B. The residual air space ratios for Buildings A and D were approximately 0.6 and 0.4, respectively. Figure 6C shows the time series of the overturning moment (Md and Mb) and the resisting moment (Mw).
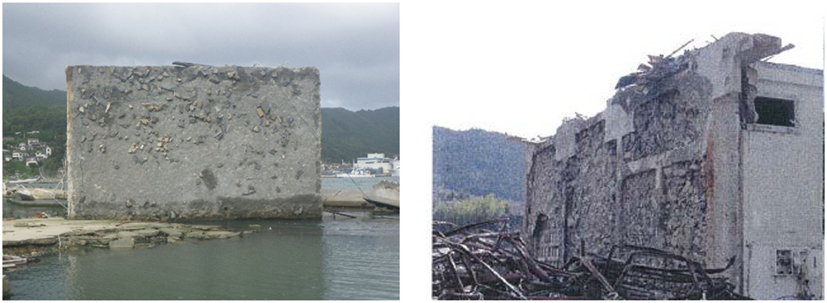
Figure 5. Mat foundation of Building A and pile foundation of Building D. Note: taken by our survey team in March 29, 2011 at the town of Onagawa.
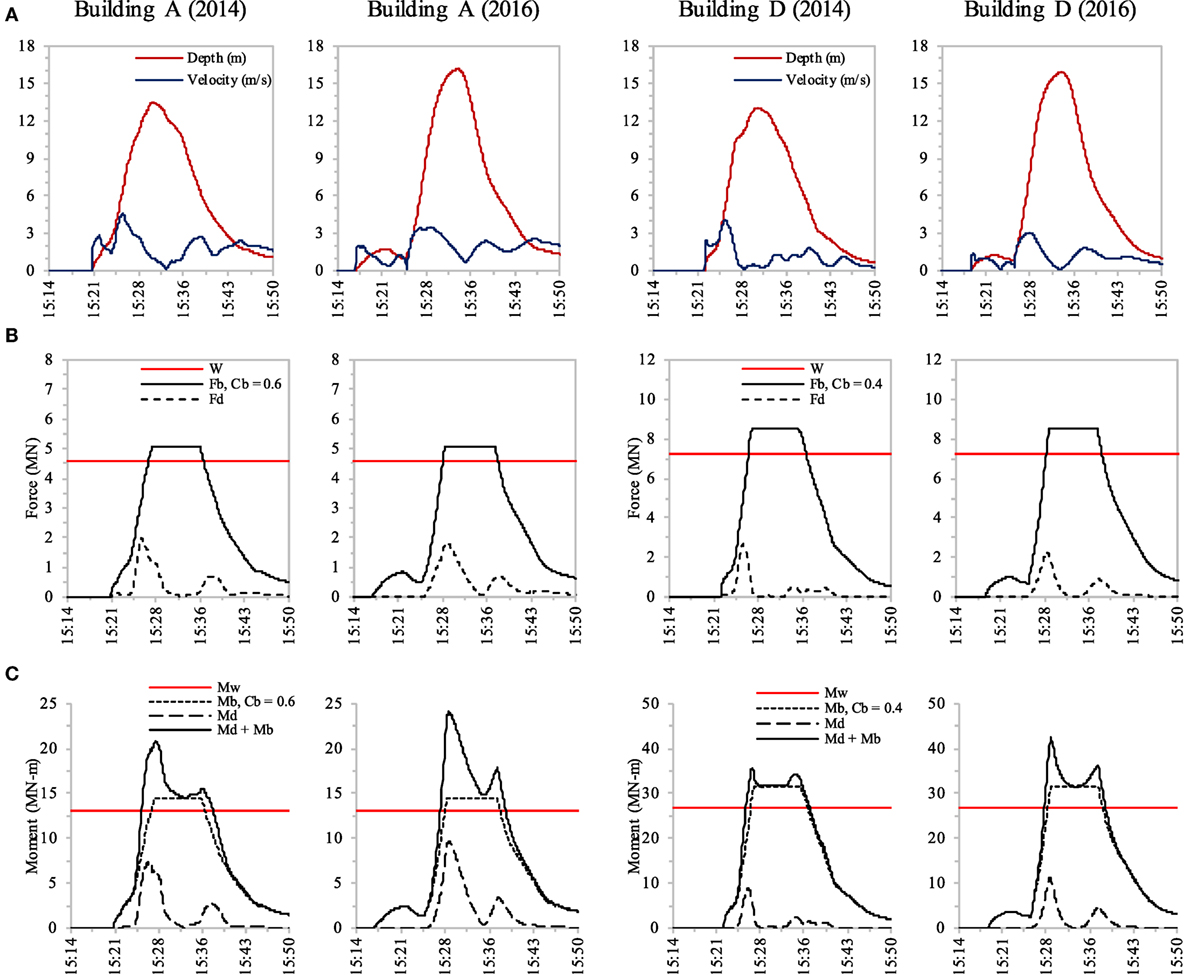
Figure 6. Analysis results of Buildings A and D from 2014 and 2016 simulations. (A) Tsunami inundation depth and flow velocity. (B) Building self-weight, buoyancy force, and hydrodynamic force. (C) Resisting moment from building self-weight and overturning moment from hydrodynamic and buoyancy forces.
As shown in Table 5, a comparison of Building A based on the 2014 simulation reveals that the peak overturning moment (Md + Mb) that occurred at 15:28 was 1.59 times higher than the resisting moment (Mw), whereas a comparison based on the 2016 simulation suggests that the peak overturning moment that occurred at 15:29 was 1.84 times higher than the resisting moment. The peak overturning moment in the 2014 simulation occurred when the inundation depth was 10.60 m and the flow velocity was 2.83 m/s2, whereas the maximum depth and velocity of 13.50 m and 4.57 m/s2, respectively, occurred at different times, as shown in Figure 6A. The peak overturning moment in the 2016 simulation occurred when the inundation depth was 11.43 m and the flow velocity was 3.48 m/s2, whereas the maximum depth of 16.18 m occurred at different times, as shown in Figure 6A. Building A was only 10.5 m tall; thus, it was overturned when the tsunami flow exceeded the top of the building.
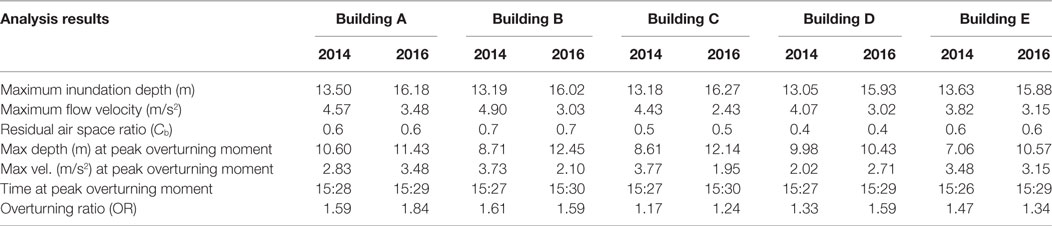
Table 5. Analysis results of all overturned buildings.
All piles of Building D failed during the ground shaking by shear failure between the pile heads and pile caps, in which the shear strength of a pile (Qu) was 65 kN, as shown in Table 4. As shown in Table 5, a comparison of Building D based on the 2014 simulation reveals that the peak overturning moment (Md + Mb) that occurred at 15:27 was 1.33 times higher than the resisting moment (Mw), whereas a comparison based on the 2016 simulation suggests that the peak overturning moment that occurred at 15:29 was 1.59 times higher than the resisting moment. The peak overturning moment in the 2014 simulation occurred when the inundation depth was 9.98 m and the flow velocity was 2.02 m/s2, whereas the maximum depth and velocity of 13.05 m and 4.07 m/s2, respectively, occurred at different times, as shown in Figure 6A. The peak overturning moment in the 2016 simulation occurred when the inundation depth was 10.43 m and the flow velocity was 2.71 m/s2, whereas the maximum depth and velocity of 15.93 m and 3.02 m/s2, respectively, occurred at different times, as shown in Figure 6A. Building D was 10.5 m tall; thus, it was overturned when the tsunami flow was lower than the top of the building.
Another observation is that buoyancy force could generate an overturning moment larger than hydrodynamic force, particularly for Building D, as shown in Figure 6C. After building overturning occurred at 15:28, these buildings floated and then moved from their original positions such that buoyancy force was immediately greater than building self-weight, as shown in Figure 6B.
Tension Failure of Piles Caused by Overturning Moment
The overturning mechanism of Building C was investigated by comparing the overturning moment calculated from hydrodynamic force (Fd) and buoyancy force (Fb) to the resisting moment calculated from building self-weight (W) and pile resistance force (RTC). Building C had a pile foundation and all of the piles failed by tension failure at the pile heads, except for one pile at the top-right pile cap, as shown in Figure 7. Figure 8A shows the tsunami inundation depth and flow velocity at Building C in the 2014 and 2016 simulations. The residual air space ratio (Cb) was approximately 0.5, as estimated based on the condition of larger buoyancy force than building self-weight, as shown in Figure 8B. Figure 8C shows the time series of the overturning moment (Md and Mb) and the resisting moment (Mw and Mr).
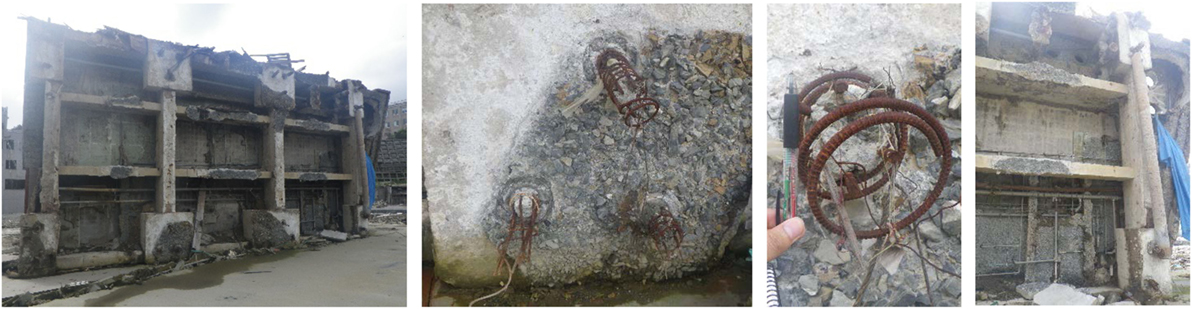
Figure 7. Pile foundation of Building C (one pile pulled out of ground). Note: taken by our survey team in March 29, 2011 at the town of Onagawa.
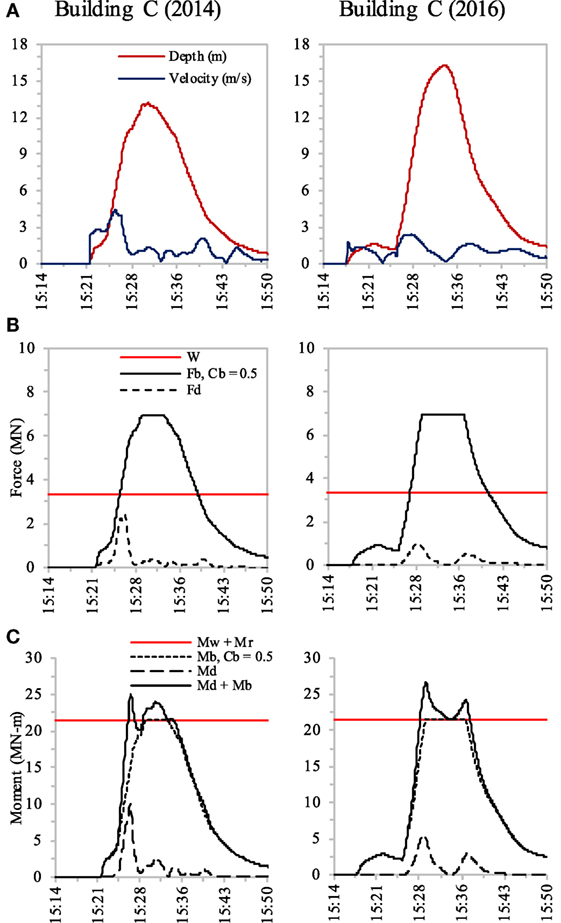
Figure 8. Analysis results of Building C from 2014 and 2016 simulations. (A) Tsunami inundation depth and flow velocity. (B) Building self-weight, buoyancy force, and hydrodynamic force. (C) Resisting moment from building self-weight and pile resistance force, and overturning moment from hydrodynamic and buoyancy forces.
For Building C, the pile foundation failed during tsunami flow through the observed tension failure between the pile heads and pile caps in which the tensile strength of a pile (Fu) was 307 kN, as shown in Table 4. The effective piles out of the 20 piles were used to calculate the resisting moment (Mr), with 4.0-m moment arm on the pile group equal to the pile length, as shown in Figure 7. As shown in Table 5, a comparison of Building C based on the 2014 simulation reveals that the peak overturning moment (Md + Mb) that occurred at 15:27 was 1.17 times higher than the resisting moment (Mw + Mr), whereas a comparison based on the 2016 simulation suggests that the peak overturning moment that occurred at 15:30 was 1.24 times higher than the resisting moment. The peak overturning moment in the 2014 simulation occurred when the inundation depth was 8.61 m and the flow velocity was 3.77 m/s2, whereas the maximum depth and velocity of 13.18 m and 4.43 m/s2, respectively, occurred at different times, as shown in Figure 8A. The peak overturning moment in the 2016 simulation occurred when the inundation depth was 12.14 m and the flow velocity was 1.95 m/s2, whereas the maximum depth and velocity of 16.27 m and 2.43 m/s2, respectively, occurred at different times, as shown in Figure 8A. Building C was 14.2 m tall; thus, it was overturned when tsunami flow was lower than the top of the building.
Buoyancy force could generate an overturning moment equal to the resisting moment, as shown in Figure 8C. Therefore, although hydrodynamic force could generate a smaller overturning moment than buoyancy force, the additional overturning moment from hydrodynamic force had a significant impact on building overturning.
Pulling out of Piles including Effect of Soil Liquefaction
The overturning mechanisms of Buildings B and E were investigated by comparing the overturning moment calculated from hydrodynamic force (Fd) and buoyancy force (Fb) to the resisting moment calculated from building self-weight (W) and pile resistance force (RTC). Building B had a pile foundation, and 12 piles were pulled out of the ground, as shown in Figure 9, whereas 20 piles might have failed as a result of base shear force during the ground shaking because the safety factor was close to 1.00, as shown in Table 4. Building E had a pile foundation, and all piles were pulled out of the ground except for one pile that failed in tension, as shown in Figure 9. Figure 10A shows the tsunami inundation depths and flow velocities at Buildings B and E in the 2014 and 2016 simulations. The residual air space ratio (Cb) was estimated based on the condition of larger buoyancy force than building self-weight, as shown in Figure 10B. The residual air space ratios for Buildings B and E were approximately 0.7 and 0.6, respectively. Figure 10C shows the time series of the overturning moment (Md and Mb) and the resisting moment (Mw and Mr).
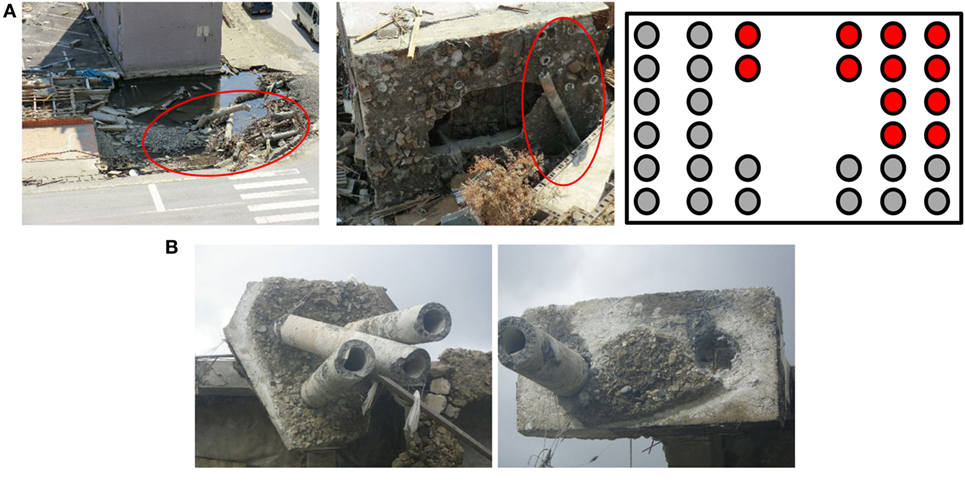
Figure 9. Pile foundation of Buildings B and E. (A) Red circles are 12 piles pulled out of ground, and gray circles are 20 piles broken during ground shaking. (B) Only one pile failed in tension. Note: taken by our survey team in March 29, 2011 at the town of Onagawa.
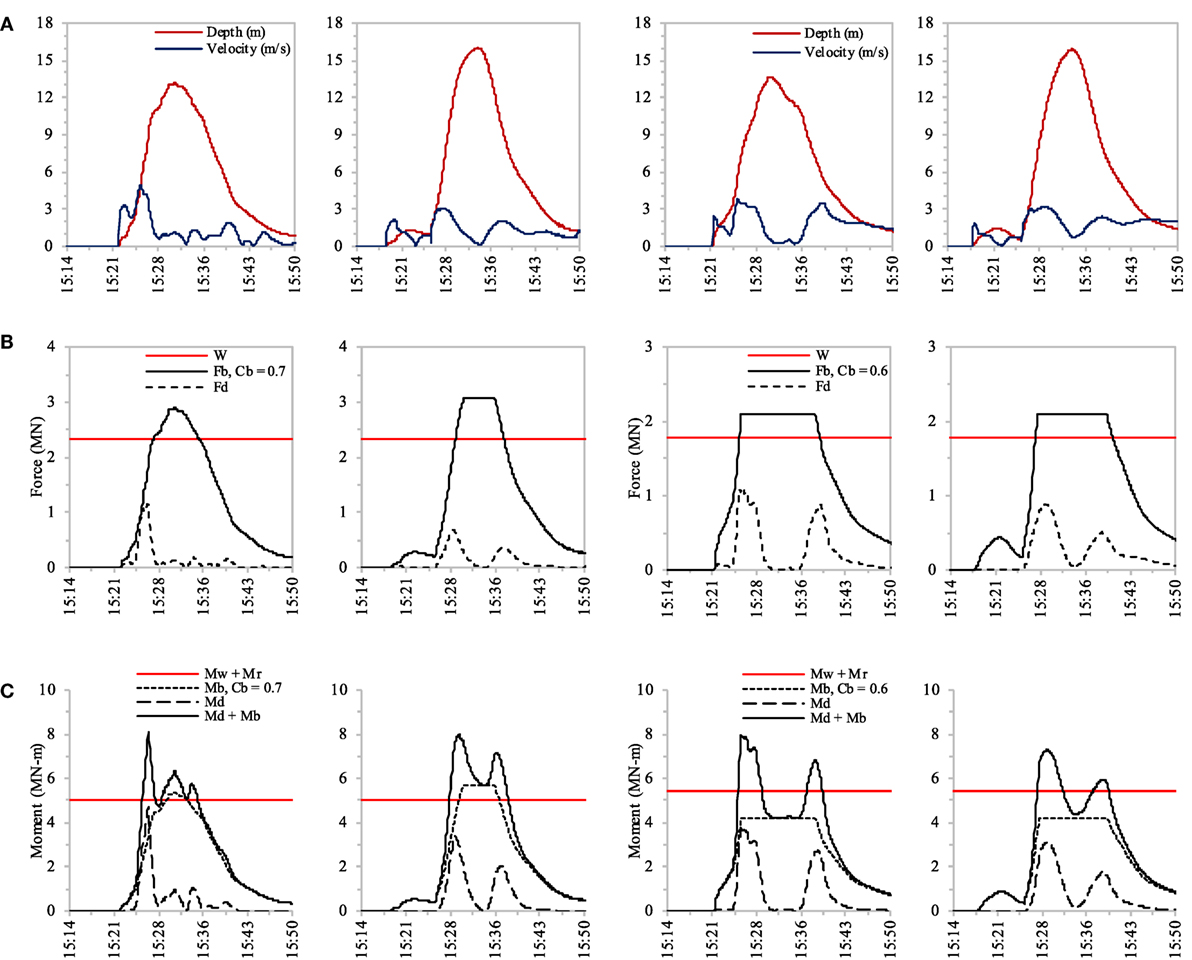
Figure 10. Analysis results of Buildings B and E from 2014 and 2016 simulations. (A) Tsunami inundation depth and flow velocity. (B) Building self-weight, buoyancy force, and hydrodynamic force. (C) Resisting moment from building self-weight and pile resistance force, and overturning moment from hydrodynamic and buoyancy forces.
For Building B, boring No. 11 at the nearest location and the assumed pile length of 6 m were used to calculate skin friction capacity (Qs) of a pile, which was 38 kN/m, for a pile diameter of 20 cm, as shown in Table 3. As shown in Table 5, the comparison of Building B based on the 2014 simulation reveals that the peak overturning moment (Md + Mb) that occurred at 15:27 was 1.61 times higher than the resisting moment (Mw + Mr), whereas the comparison based on the 2016 simulation suggests that the peak overturning moment that occurred at 15:30 was 1.59 times higher than the resisting moment. The peak overturning moment in the 2014 simulation occurred when the inundation depth was 8.71 m and the flow velocity was 3.73 m/s2, whereas the maximum depth and velocity of 13.19 m and 4.90 m/s2, respectively, occurred at different times, as shown in Figure 10A. The peak overturning moment in the 2016 simulation occurred when the inundation depth was 12.45 m and the flow velocity was 2.10 m/s2, as the maximum depth and velocity of 16.02 m and 3.03 m/s2, respectively, occurred at different times, as shown in Figure 10A. Building B was 14.0 m tall; thus, it was overturned when tsunami flow was lower than the top of the building.
For Building E, boring No. 5 at the nearest location and the assumed pile length of 6 m were used to calculate skin friction capacity (Qs) of a pile, which was 64 kN/m, for a pile diameter of 25 cm, as shown in Table 3. As shown in Table 5, the comparison of Building B based on the 2014 simulation in reveals that the peak overturning moment (Md + Mb) that occurred at 15:26 was 1.47 times higher than the resisting moment (Mw + Mr), whereas the comparison based on the 2016 simulation suggests that the peak overturning moment that occurred at 15:29 was 1.34 times higher than resisting moment. The peak overturning moment in the 2014 simulation occurred when the inundation depth was 7.06 m and the flow velocity was 3.48 m/s2, whereas the maximum depth and velocity of 13.63 m and 3.82 m/s2, respectively, occurred at different times, as shown in Figure 10A. The peak overturning moment in 2016 occurred when the inundation depth was 10.57 m and the flow velocity was 3.15 m/s2, whereas the maximum depth and velocity were 15.88 m and 3.15 m/s2, respectively, occurred at different times, as shown in Figure 10A. Building E was 7.0 m tall; thus, it was overturned when tsunami flow exceeded the top of the building.
The overturning ratio (OR) in Table 5 can be calculated from the ratio between the peak overturning moment and the peak resisting moment. For each of 18 soil boring data, skin friction capacity (Qs) is shown in Table 3 for pile lengths of 4.0, 6.0, and 8.0 m and including the effect of soil liquefaction . However, the conventional method to evaluate the effect of soil liquefaction tends to overestimate liquefaction hazards (Chen et al., 2016). These 18 boring data were used to evaluate the potential of overturning for Buildings B and E based on the ORs, which can be classified as no possibility, low possibility, medium possibility, or high possibility.
Table 6 shows the ORs of Buildings B and E in the 2014 and 2016 simulations considering the pile length and soil liquefaction. For all pile lengths, only boring No. 7 can provide safety from building overturning because the OR was less than 1.00 and including the effect of soil liquefaction. On the other hand, boring No. 11 provided the high possibility of building overturning for all pile lengths and including the effect of soil liquefaction. For borings No. 16 and No. 17, safety can be obtained using pile lengths of 6.0 and 8.0 m instead of 4.0 m, as was used in boring No. 3. However, building overturning could occur at boring No. 3 with pile lengths of 6.0 and 8.0 m in the case of soil liquefaction. Nevertheless, increasing the pile length can reduce the OR when neglecting the effect of soil liquefaction. In particular, for boring No. 14, increasing the pile length from 4.0 and 6.0 m to 8.0 m can prevent building overturning by changing the classification from high possibility to no possibility.
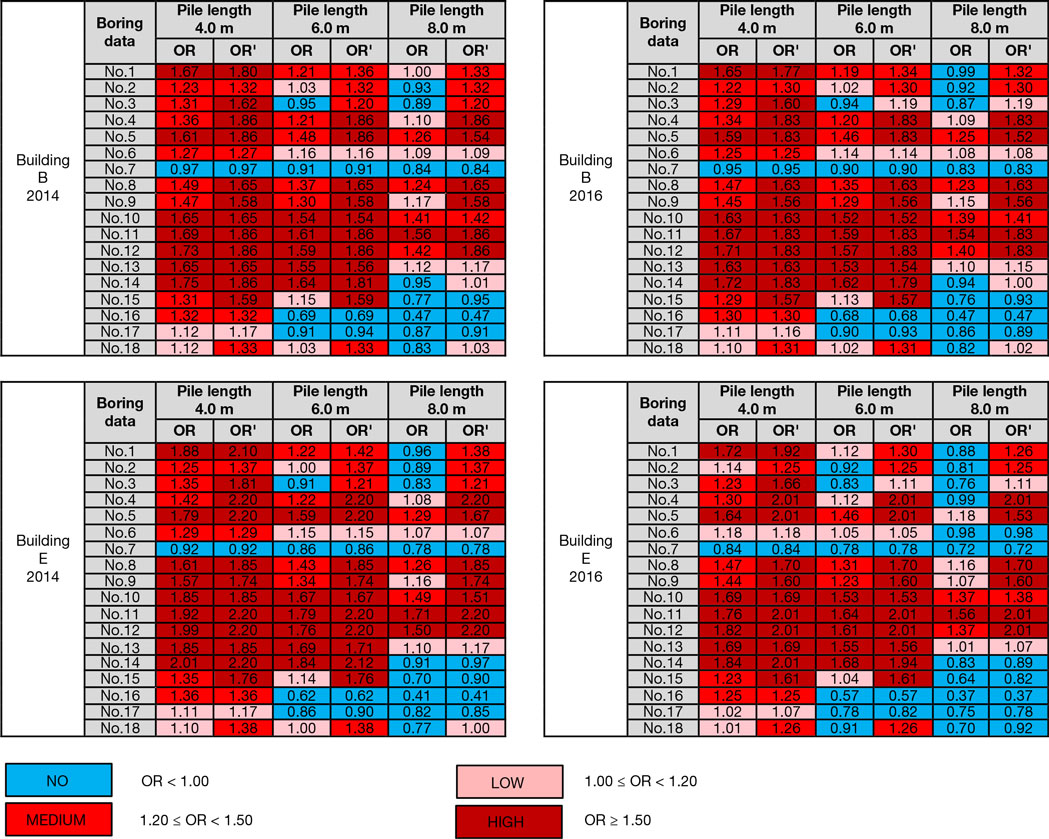
Table 6. Overturning ratio (OR) of Buildings B and E for each soil boring data.
The effect of soil liquefaction generally increased the ORs for most of 18 soil boring data. However, the ORs for borings No. 6 and No. 16 were the same with and without soil liquefaction because soil liquefaction could not decrease of skin friction capacity. In the case of soil liquefaction, increasing the pile length could not affect the potential for building overturning in several borings, such as No. 2, No. 4, No. 8, No. 9, No. 11, and No. 12, because skin friction capacity is constant for all pile lengths, as shown in Table 3. In some borings, such as No. 2 and No. 3 with a pile length of 8.0 m, the OR exceeded 1.00 when soil liquefaction occurred because skin friction force was small and decreased significantly, as shown in Table 3.
Conclusion
Based on the surveyed data, the overturning mechanism of buildings in tsunami can be investigated by comparing the overturning moment induced by hydrodynamic and buoyancy forces and the resisting moment induced by building self-weight and pile resistance force. For a pile foundation, the potential for the shear failure of the piles at the pile head during the ground shaking can be analyzed based on the simplified method in a building design standard. In this study, building overturning was investigated based on three possible mechanisms:
1. Building overturning due to hydrodynamic and buoyancy forces that were resisted by only building self-weight, such as in Buildings A and D.
2. Tension failure of piles at the pile head caused by the overturning moment, such as in Building C.
3. Pulling of the piles from the ground including the effect of soil liquefaction, including in combination with shear failure during the ground shaking in Building B and combination with tension failure during tsunami flow in Building E.
The analysis results of all overturned buildings indicated that buoyancy force could generate a larger overturning moment than hydrodynamic force, particularly for Buildings C and D. Previous studies indicated that the opening ratio had a significant effect on buoyancy force. However, the criterion that uses opening ratio should not be proposed in building design codes because it is difficult to estimate the volume of water inside the building during tsunami flow based on the size of the opening. This study focused on the performance of building foundations during earthquake and subsequent tsunami, including ground shaking, soil liquefaction, and tsunami inundation. The possible failure mechanism of these overturned buildings was investigated based on the residual performance from the earthquake and the sequential damage from the tsunami. The results suggested that a new criterion of building foundation design should be proposed in a building design guideline to prevent building overturning. In this criterion, the building performance should be evaluated from sequential scenarios of an earthquake and tsunami. The building foundation design should consider the states of the art of both earthquake and tsunami engineering. Otherwise, the evaluation of building performance will be misleading.
Soil liquefaction is a consequence of the earthquake that may reduce the performance of building foundation to resist building overturning during the tsunami. Due to soil liquefaction, the loss of skin friction capacity between the pile and soil could occur in most of 18 soil boring data, resulting in a decrease of the resisting moment calculated from pile resistance force. However, these 18 soil boring data are located near the shoreline and not in the precise locations of the overturned buildings, which contain a considerable amount of sand from filling and sediment. This might be a reason why there was a possibility of building overturning at most of 18 soil boring data. In addition, skin friction capacity including the effect of soil liquefaction was calculated by the conventional method in a building design standard. The accuracy of the evaluation of the effect of soil liquefaction could be improved by using a more advanced method, such as soil dynamic analysis.
Author Contributions
PL did a contribution on investigating the possible mechanisms of overturned buildings in Onagawa based on the surveyed and simulated data. He wrote all parts in this manuscript. AS did a contribution on collecting the surveyed data of the characteristics of overturned buildings in Onagawa after the 2011 Great East Japan earthquake and tsunami. He wrote some part of the building characteristics. AY did a contribution on studying on building design codes. She suggested a method to evaluate pile resistance force from the Japanese standard for building foundation design and the survey report after the 2011 earthquake and tsunami. BA did a contribution on performing tsunami inundation simulation. He calculated the waveform at each overturned building to evaluate hydrodynamic and buoyancy forces during tsunami flow. SK has supported Bruno for tsunami inundation simulation in Onagawa. He provided the video evidence that was used for verifying the simulation. YK has supported AY because of his expertise in building design engineering. FI has supported PL for overall images of this manuscript and gave very useful comments.
Conflict of Interest Statement
The authors declare that the research was conducted in the absence of any commercial or financial relationships that could be construed as a potential conflict of interest.
Acknowledgments
The authors express their sincere gratitude to the anonymous reviewers for their valuable suggestions, Prof. Nobuo Shuto of Tohoku University and the government office in the town of Onagawa for providing soil boring data, and the cooperation of other members of our survey team, including Dr. Erick Mas and Dr. Hideomi Gokon. This research was funded by the Reconstruction Agency of the Government of Japan, JSPS Grant-in-Aid for Young Scientists (B) “Applying developed fragility functions for the Global Tsunami Model (GTM)” (No. 16K16371), the Willis Research Network, and Tokio Marine & Nichido Fire Insurance Co., Ltd. through IRIDeS, Tohoku University.
References
Adriano, B., Hayashi, S., Gokon, H., Mas, E., and Koshimura, S. (2016). Understanding the extreme tsunami inundation in Onagawa town by the 2011 Tohoku earthquake, its effects in urban structures and coastal facilities. Coast. Eng. J. 58, 1640013. doi:10.1142/S0578563416400131
Adriano, B., Mas, E., and Koshimura, S. (2014). “Tsunami inundation features verification through numerical modeling and video analysis: case study of Onagawa town on the 2011 Tohoku earthquake,” in Proc., Asia Oceania Geosciences Society 11th Annual Meeting, Sapporo.
Architectural Institute of Japan. (2001). Recommendations for Design of Building Foundations. Tokyo, Japan: Architectural Institute of Japan, 486.
Architectural Institute of Japan. (2004). Chapter 7 Seismic Loads. Tokyo: AIJ Recommendations for Loads on Buildings, 652.
Building Center of Japan (BCJ). (2007). Technical Standard Manual for Building (In Japanese). Tokyo, Japan: Building Center of Japan.
Chen, J., Takeyama, T., Otani, H., Fujita, K., and Hori, M. (2016). A framework for assessing liquefaction hazard for urban areas based on soil dynamics. Int. J. Comput. Methods 13, 1641011–1641011. doi:10.1142/S0219876216410115
Chock, G., Carden, L., Robertson, I., Olsen, M., and Guangren, Y. (2013). Tohoku tsunami-induced building failure analysis with implications for U.S. tsunami and seismic design codes. Earthquake Spectra 29, S99–S126. doi:10.1193/1.4000113
Federal Emergency Management Agency. (2011). Guidelines for Design of Structures for Vertical Evacuation from Tsunamis. Washington: FEMA, 158.
Fraser, S., Raby, A., Pomonis, A., Goda, K., Chian, S. C., Macabuag, J., et al. (2013). Tsunami damage to coastal defences and buildings in the March 11th 2011 Mw9.0 Great East Japan earthquake and tsunami. Bull. Earthquake Eng. 11, 205–239. doi:10.1007/s10518-012-9348-9
Ishida, M., Tokimatsu, K., and Inoue, S. (2015). “Overturning of buildings induced by tsunami run-up at Onagawa in the 2011 Great Tohoku Earthquake,” in Proc., 6th International Conference on Earthquake Geotechnical Engineering, Christchurch.
Japanese Geotechnical Society, Tohoku Branch. (1986). Damage Survey Report of the 1983 Sea of Japan Earthquake (In Japanese). Sendai, Japan: Japanese Geotechnical Society, 297.
Kabeyasawa, T., Okuda, Y., Fukai, A., Fukuyama, H., Kato, H., Ishihara, T., et al. (2012). “Evaluation of lateral and buoyant forces on reinforced concrete buildings by the tsunami of the 2011 East Japan earthquake,” in Proc., 15th World Conference in Earthquake Engineering, Lisbon.
Latcharote, P., Suppasri, A., Yamashita, A., Adriano, B., Koshimura, S., Kai, Y., et al. (2014). “Mechanism and stability analysis of overturned buildings by the 2011 Great East Japan earthquake and tsunami in Onagawa town,” in Proc., 14th Japan Earthquake Engineering Symposium. Chiba, 108–117.
Mizutani, T. (2008). “Lesson 13 soil liquefaction, principle of natural disaster: disaster case studies (In Japanese),” in National Research Institute for Earth Science and Disaster Resilience (NIED). Available at: http://dil.bosai.go.jp/workshop/
National Institute for Land and Infrastructure Management (NILIM) and Building Research Institute (BRI) in Japan. (2012). Report on field surveys and subsequent investigations of building damage following the 2011 off the pacific coast of Tohoku earthquake. Build. Res. Data 136, 6.2–32–6.2–40.
National Research Institute for Earth Science and Disaster Resilience (NIED). (n.d.). Strong-Motion Seismograph Networks (K-NET, KiK-net). Available at: http://www.kyoshin.bosai.go.jp/ (accessed November 24, 2016).
Nikkei BP Company. (2011). Lessons from the Great East Japan earthquake disaster: city and architecture part (In Japanese). Nikkei Archit. Sect. 207, 32–38.
Onagawa. (2013). Onagawa Guide: Industrial Promotion Division of Onagawa (In Japanese). Onagawa Tourism Association.
Suppasri, A., Koshimura, S., Imai, K., Mas, E., Gokon, H., Muhari, A., et al. (2012). Damage characteristic and field survey of the 2011 Great East Japan tsunami in Miyagi prefecture. Coastal Eng. J. 54, 1250005. doi:10.1142/S0578563412500052
Suppasri, A., Shuto, N., Imamura, F., Koshimura, S., Mas, E., and Yalciner, A. C. (2013). Lesson learned from the 2011 Great East Japan tsunami: performance of tsunami countermeasures, coastal buildings, and tsunami evacuation in Japan. Pure Appl. Geophys. 170, 993–1018. doi:10.1007/s00024-012-0511-7
Tokimatsu, K., Ishida, M., and Inoue, S. (2016). Tsunami-induced overturning of buildings in Onagawa during 2011 Tohoku earthquake. Earthquake Spectra 32, 1989–2007. doi:10.1193/101815EQS153M
Tokimatsu, K., Tamura, S., Suzuki, H., and Katsumata, K. (2012). Building damage associated with geotechnical problems in the 2011 Tohoku Pacific Earthquake. Soils Found. 52, 956–974. doi:10.1016/j.sandf.2012.11.014
Yeh, H., and Sato, S. (2016). Tsunami effects on buildings and coastal structures. J. Disaster Res. 11, 662–669. doi:10.20965/jdr.2016.p0662
Keywords: building overturning, Onagawa, tsunami flow, pile foundation, soil liquefaction
Citation: Latcharote P, Suppasri A, Yamashita A, Adriano B, Koshimura S, Kai Y and Imamura F (2017) Possible Failure Mechanism of Buildings Overturned during the 2011 Great East Japan Tsunami in the Town of Onagawa. Front. Built Environ. 3:16. doi: 10.3389/fbuil.2017.00016
Received: 12 December 2016; Accepted: 17 February 2017;
Published: 16 March 2017
Edited by:
Solomon Tesfamariam, University of British Columbia, CanadaCopyright: © 2017 Latcharote, Suppasri, Yamashita, Adriano, Koshimura, Kai and Imamura. This is an open-access article distributed under the terms of the Creative Commons Attribution License (CC BY). The use, distribution or reproduction in other forums is permitted, provided the original author(s) or licensor are credited and that the original publication in this journal is cited, in accordance with accepted academic practice. No use, distribution or reproduction is permitted which does not comply with these terms.
*Correspondence: Panon Latcharote, panon@irides.tohoku.ac.jp