An Information-Theoretic Approach for Indirect Train Traffic Monitoring Using Building Vibration
 Susu Xu
 Lin Zhang
 Pei Zhang
 Hae Young Noh
- 1Department of Civil and Environmental Engineering, Carnegie Mellon University, Pittsburgh, PA, USA
- 2Tsinghua-Berkeley Shenzhen Institute, Tsinghua University, Shenzhen, China
- 3Department of Electrical and Computer Engineering, Carnegie Mellon University, Silicon Valley, CA, USA
This paper introduces an indirect train traffic monitoring method to detect and infer real-time train events based on the vibration response of a nearby building. Monitoring and characterizing traffic events are important for cities to improve the efficiency of transportation systems (e.g., train passing, heavy trucks, and traffic). Most prior work falls into two categories: (1) methods that require intensive labor to manually record events or (2) systems that require deployment of dedicated sensors. These approaches are difficult and costly to execute and maintain. In addition, most prior work uses dedicated sensors designed for a single purpose, resulting in deployment of multiple sensor systems. This further increases costs. Meanwhile, with the increasing demands of structural health monitoring, many vibration sensors are being deployed in commercial buildings. Traffic events create ground vibration that propagates to nearby building structures inducing noisy vibration responses. We present an information-theoretic method for train event monitoring using commonly existing vibration sensors deployed for building health monitoring. The key idea is to represent the wave propagation in a building induced by train traffic as information conveyed in noisy measurement signals. Our technique first uses wavelet analysis to detect train events. Then, by analyzing information exchange patterns of building vibration signals, we infer the category of the events (i.e., southbound or northbound train). Our algorithm is evaluated with an 11-story building where trains pass by frequently. The results show that the method can robustly achieve a train event detection accuracy of up to a 93% true positive rate and an 80% true negative rate. For direction categorization, compared with the traditional signal processing method, our information-theoretic approach reduces categorization error from 32.1 to 12.1%, which is a 2.5× improvement.
1. Introduction
The transportation system is an important component of a city’s built environment and closely related to the quality of people’s daily life. However, the occurrence of traffic events, if poorly managed, will affect the efficiency of overall transportation systems (Weisbrod et al., 2003; Kittelson, 2010). One example is related to railroad crossings. When trains pass by, traffic must stop at the intersection, resulting in congestion and an increase in fuel consumption and travel time. Therefore, real-time sensing and monitoring of traffic events plays a vital role in transportation control and city management.
However, current practices of traffic events monitoring require dense deployment of dedicated sensors that are costly both for deployment and maintenance. Traditionally sensing systems have relied on directly instrumented systems (Zhang et al., 2004; Lynch and Loh, 2006; Purohit et al., 2011; Sun et al., 2012; Nunes et al., 2015). In particular, dedicated traffic sensors are developed and deployed in many cities (e.g., vehicle detection loops and traffic camera monitoring system are often used to monitor traffic events) (Nadeem et al., 2004; Gubbi et al., 2013; Kostakos et al., 2013). The demand of these dedicated sensors will increase with the increasing need to understand and optimize transportation systems. Furthermore, these systems are designed as “silo” systems, requiring one system to monitor each aspect of traffic, and thus further increasing costs.
Meanwhile, with the increasing need of structural health monitoring, many of these buildings are being instrumented with vibration sensors to monitor their health (Ellingwood and Tallin, 1984; Doebling et al., 1996; Li et al., 2004; Sohn et al., 2004; Lynch and Loh, 2006; Gentile and Saisi, 2007). The collected building vibrations also contain the structural vibration induced by ambient traffic events (Zheng et al., 2013). Most information about the traffic events is carried by vibrations on the roadway and thus coupled with the buildings through the ground. In this paper, we present an algorithm using the building vibrations to monitor the train traffic around the buildings. In general, existing structural health monitoring systems collect building vibrations with sampling rate around 100–1,000 Hz (Sohn et al., 2004; Lynch and Loh, 2006). Our algorithm is developed to focus on the frequency range around 0–100 Hz, which falls within the typical structural vibration monitoring range. In this paper, our algorithm and evaluation results show that it is feasible to monitor the train traffic using ambient building vibration. By utilizing the existing building vibration monitoring systems, the need (and thus costs) of dedicated traffic monitoring systems will be significantly reduced. In general, this research provides an example showing the feasibility to expand the utilization of building sensor systems for multiple purposes. With the development of smart cities, more sensor systems will be deployed. These kinds of multiple utilizations will reduce the overall cost of the smart city sensing systems and/or improve robustness through redundancy.
To monitor traffic events using building vibrations, we need to understand how buildings respond to traffic events. We focus on two research challenges in this approach. First, the complexity of propagation media makes it difficult to apply physics-based methods, e.g., modal analysis, which requires detailed prior knowledge about the building. Second, the deployment of vibration sensor systems on different buildings does not obey the same criterion. Finally, the data are very noisy because of effects from human activities, machinery inside the building, etc.
To address these challenges, our approach uses causality between the vibrations in various locations of a building to represent the building vibration pattern, then detects and infers the train events around the building by looking at the response of the building vibration pattern to the train events. Causal analysis characterizes causality between pairs of signals. Recent advances in causal analysis show a new perspective to analyze the causality between signals in an information-theoretic approach and have been applied in data compression, economic analysis, and neuroscience (Marko, 1973; Zhao et al., 2003; Permuter et al., 2008, 2011; Quinn et al., 2011; Zheng et al., 2013). The information-theoretic approach extracts the information exchanging between two locations of sensors as features to depict the vibration patterns in the corresponding physical interval. As a data-driven method, our approach eliminates the requirement for detailed prior knowledge about the structure. Meanwhile, causal analysis can extract the direction and amount of information flow between pairs of vibration signals. Thus, we can detect the changes in information flow between multiple sensor pairs to extract building’s response to ambient events. This method also provides physical insights about the effects of the excitation events on building vibration.
Our approach includes three steps: data collection, event detection, and event inference. First, we collect building vibration data from multiple sensors. Second, the time of traffic events, which is the time interval when train pass by the building in our case, can be detected based on features extracted by wavelet analysis and is effective for decomposing non-stationary signals. Third, we infer the types of traffic events, which are direction of train moving in our study, by causal analysis using information theory and machine learning techniques.
We evaluate our results through the vibration sensing system deployed in the 11-story tall building at Tsinghua University, Beijing, China, for over 1 month. This building experiences periodic nearby passing trains that are the target of this study. In particular, we focus on both the detection and the directional estimation accuracy of our algorithm under different conditions.
In this paper, we have three key contributions as follows:
• We introduce a train event monitoring method using commonly deployed vibration sensors for building health monitoring.
• We analyze noisy building vibration patterns using an information-theoretic approach and mining the information conveyed in the noisy vibration signals.
• We evaluate the algorithm through field experiments conducted for more than 1 month in an 11-story real building under train events.
The rest of the paper is organized as follows: Section 2 focuses on physical insights of vibration propagation and information exchanges inside building. Section 3 introduces our algorithm to detect when the train event happens and infer the direction of train in further steps. Section 4 shows the implementation of sensor system, results and analysis of vibration signals collected in an 11-floor building with periodic passing trains. Finally, Section 5 summarizes the conclusion.
2. Physical Insight for Causal Analysis of Building Vibration
To better understand the problem, we discuss how building vibrations are induced by passing trains and propagate inside building structures and then explain how these vibrations can be analyzed as information exchanges using information-theoretic approaches. Here, we assume that a train moves with a constant speed when passing by the building, and dynamic characteristics of the building structure remain constant (i.e., no damage is incurred by the train-induced vibrations).
On the physical side of wave propagation, current studies on train-induced building vibration have focused on analyzing and predicting the effects of train-induced excitations on building structures using two main approaches: physics-based methods and data-driven methods. Physics-based methods use the physical principles of wave propagation to analytically or numerically analyze the effects of train-induced vibrations on buildings (Ahmad and Al-Hussaini, 1991; Hall, 2003; Adam and Von Estorff, 2005; Ju, 2009). However, these methods often make simplified assumptions to reduce the number of parameters (such as homogeneous propagation medium or require detailed prior knowledge about the ground and building structures). They may not be suitable in practice due to complex urban space and building structure. Data-driven methods are developed for analyzing structural response to train events based on historical train-induced vibration data. These approaches do not require detailed priori structural information but may lack physical insights for observed phenomena (i.e., we can observe correlation but not physical causation) (Bahrekazemi, 2004; Xia et al., 2005).
In our scenario, the train excitation, which is a moving load source (as Figure 1A shows), generates body waves and surface waves in the ground that travel to nearby buildings (Balendra et al., 1989; Chua et al., 1995; Hao et al., 2001; Hall, 2003; Lin et al., 2005; Kouroussis et al., 2014), as shown in Figure 1B. The waves propagate inside a building in both vertical and horizontal directions. In each story, the vertical waves propagating through the building consist of two parts: up-going and down-going components (Bahrekazemi, 2004). The vibration propagates through columns to the adjacent stories, but there exists time difference between arrivals of waves from columns near the train and away from the train. As soon as these shear waves arrive at the next story, the horizontal waves begin to disperse through the floor from the column location. These waves are mixed with the reflected waves from the boundaries. The amplitudes, frequencies, phases, and other dynamic features of these waves vary with the characteristics of train excitations and building structure medium that they have traveled through. Similar constructs can be used in other sensing applications as well (Mokaya et al., 2015, 2016; Lederman et al., 2017a,b).
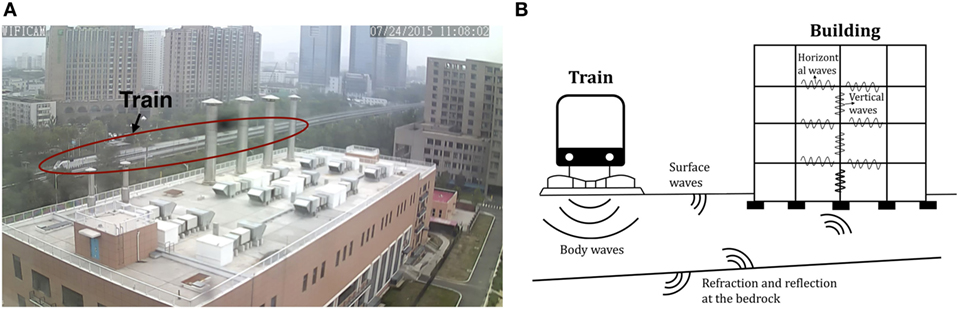
Figure 1. (A) Train is passing by Rohm building (photo taken by the camera installed on the top of Rohm building); (B) physical insights of wave propagation from train to building.
Thus, the wave propagation from one place to another can be interpreted as an information exchange (or information flow) about building structures and train excitations between these two places inside a building. If the characteristics of the train excitation change (e.g., direction), the generated waves also change (e.g., time-frequency contents, phases, and delays). Since different waves have different properties (e.g., speed, attenuation, and reflection), the corresponding information exchange pattern between the two locations may also change. As mentioned above, this study assumes that the structural characteristics remain the same over time and thus does not contribute to the changes in information exchange.
This paper exploits the idea of representing wave propagation as information exchanges to introduce a new method that infers train event characteristics from building vibration response. This method uses an information-theoretic approach to characterize the information exchange relationship between the wave signals collected from each pair of sensors, referred to as the causality between the signals. In particular, the concept of directed information is introduced to quantify the amount of exchanged information from one location to another, through investigating the wave propagation between them. This paper is the first work to infer ambient traffic conditions based on building vibration response. This approach allows buildings to understand surrounding events in a cost-effective way using vibration monitoring systems that commonly exist in buildings (e.g., for seismic activity or serviceability monitoring). In addition, the advantages of data-driven approach lie in the less requirement of a priori knowledge about physical properties of building structure. For different buildings, the absolute value of directed information between sensors will change with different natural frequency and damping ratio. However, our method focuses on the changes in the directed information value, instead of their absolute values, to infer train events. Thus, the algorithm is robust across different buildings.
3. Causal Analysis-Based Train Traffic Monitoring Algorithm
We introduce an information-theoretic algorithm to infer ambient traffic events using the causal relationship between vibration responses of building structures. This algorithm consists of three steps as shown in Figure 2: (1) collect building vibration data from different locations (Section 3.1), (2) detect the time interval of a train passing by the building using wavelet features (Section 3.2), and (3) infer the event characteristics based on directed information (Section 3.3).
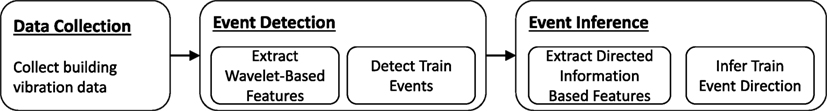
Figure 2. Framework of the algorithm.
3.1. Data Collection
In this section, building vibration responses are collected to characterize nearby train activities. Vertical acceleration responses are measured using accelerometers installed at various locations of building floors. We need at least two sensors for two reasons: (1) the algorithm for event detection combines data from multiple sensors to mitigate the effect of noise from specific concentrated areas; (2) the directed information represents the information exchanges between each pair of signals. More sensors provide higher spatial resolution for information flow patterns, which lead to more accurate and robust event inference. The locations of sensor deployment are suggested as (1) deploy on the upper floors: upper floors tend to have stronger train-induced vibrations (Xia et al., 2005); (2) spread out sensors: this mitigates the noise from concentrated areas; and (3) avoid areas with machines (e.g., elevator and fan) to reduce machine-induced vibration. Each measurement of sensor i at time t is denoted as xi(t). These vibration signals are preprocessed by being quantized into S levels for computational efficiency when calculating the directed information in Section 3.3. The exchanged information between different locations of building is extracted from pairs of preprocessed vibration data.
3.2. Event Detection
To characterize the train event, the algorithm first detects the time interval during which a train passes by the building, referred to as an event. The wavelet transform is used to capture the characteristics of train-induced building vibration. We extract the features by combining the wavelet coefficients of vibration signals collected from all sensors on each floor. Based on the wavelet-based features, the train event is detected using machine learning techniques.
3.2.1. Extract Wavelet-Based Features
The building vibration signals are analyzed using wavelet transform to extract features that are sensitive to train excitations. Train-induced building vibrations are often non-stationary in nature, meaning that their statistical characteristics change over time. Thus, conventional signal analysis methods such as Fourier transform and auto-regressive modeling are not suitable. In contrast, wavelet transform uses wavelet bases that are localized in both time and frequency to represent signals. This allows wavelet transform to represent the time evolution of the frequency contents of the non-stationary signals. In addition, many classes of functions can be represented by wavelets in a compact way (Coifman et al., 1992). This compactness results in easier event detection because fewer features can represent the event of interest. Wavelet analysis has been widely applied as a promising tool to extract structural dynamic characteristics in structural health monitoring and other related fields (Chang, 1999; Hera and Hou, 2004; Taha et al., 2006; Noh and Kiremidjian, 2009; Noh et al., 2009, 2011, 2012; Mirshekari et al., 2015, 2016a,b; Pan et al., 2015a,b, 2016; Lam et al., 2016). Similarly, we use wavelet to extract structural dynamic characteristics that change with train activities.
The wavelets are generated from a mother wavelet, Ψ(t), by scaling and time-shifting:
where s is the scale factor and τ is the time-shift factor. Then, the wavelet transform of the vibration signal xi(t) with respect to the wavelet function Ψ(t) is defined as
where represents the conjugate function of Ψs,τ(t).
Since the signals are oscillatory, the average of wavelet coefficients over a small time window in each scale is used as features for each sensor data. For every time window, the feature is a vector with the length of the number of scales used for the analysis multiplied by the number of sensors. The size of the time window and the number of scales are determined empirically and discussed with more details in Section 4.2.3.
3.2.2. Detect Train Events
Machine learning algorithms are used to classify the extracted features at every time window as train event or no event. In particular, we considered Support Vector Machine (SVM) and Random Forest as classifiers. SVM maps the features in the original finite-dimensional space into a higher-dimensional space, presumably making the classification easier in the new space when the decision boundary is non-linear (Cortes and Vapnik, 1995). SVM is also robust to noise by allowing outliers to be misclassified (i.e., ignore some data for classification if they are likely to be outliers). This allows us to classify data while rejecting outliers at the same time without using additional outlier detection methods. Random Forest is a decision tree style algorithm that uses randomized subsets of features to train a forest of decision trees and chooses the mode of their outputs as classification result (Liaw and Wiener, 2002). The wavelet-based features of each time window are input to classifiers. The corresponding training labels are whether the train events happen in each time window. The classifiers learn the mapping between the features and the labels using the training dataset. Then with input feature of a new testing sample, the classifiers determine whether the corresponding building response in the time window is influenced by the train event.
3.3. Event Inference
When a train event is detected, directed information between each pair of sensor signals is used for inferring the characteristics of the train event. The directed information quantifies information exchange patterns or causality relationship among vibration signals at multiple locations in the building as features. Then, classification method is used to categorize the event characteristics.
3.3.1. Extract Directed Information-Based Features
The causality relationship between vibrations at different sensor pairs represents the information exchange patterns between these signals. Conventional vibration signal analysis methods often extract vibration characteristics from each sensor individually. But these methods demand dense implementation of sensors for fine-grained understanding of the structure and events (Pines and Lovell, 1998; Lynch and Loh, 2006; Kim et al., 2007; Xu et al., 2016). In contrast, the causal analysis extracts relational information between different sensors’ measurements, which provides richer information than that from only a single sensor measurement. The causality inferred from vibration signal represents the directionality of wave propagation in the structure under various loading conditions. Analyzing the vibration data directly to infer wave propagation information is difficult in practice due to a high level of noise. To this end, we utilize information theory to quantify the causal relationship. The information theory is based on the probabilistic modeling of information (or uncertainties) in random variables (or processes). Thus, this approach is suitable for dealing with noisy vibration signals with high uncertainties.
Directed information quantifies the causality between two stochastic processes (i.e., a sequence of random variables) using an information-theoretic approach. A key measure in information theory is entropy, which quantifies the amount of uncertainties (or lack of information) in random variables (Jaynes, 1957; Anderson, 2008). For example, let X and Y be random numbers representing the numbers from tossing fair 4-sided and 12-sided dies, respectively. X has higher predictability than Y. Thus, the entropy of X is smaller than the entropy of Y. When the two random variables or processes are dependent (i.e., knowledge of one process provides information about the other process and vice versa), mutual information can quantify the shared information between them (Comon, 1994; Schreiber, 2000). For example, let another random variable Z = 1 if Y = 1 and Z = 0 otherwise. Then knowing Y increases the predictability of Z and vice versa because of the shared information between them. This shared information is computed as the gained information (or reduction in uncertainties) about one variable due to knowing the other variable, typically referred to as mutual information. Mutual information is a symmetric measure (i.e., the gained information about Y by knowing Z is same as the gained information about Z by knowing Y). On the other hand, directed information is an asymmetric measure that quantifies the directionality in the dependency between two stochastic processes, quantitatively depicting the causality (or feedback) relationship between them (Massey, 1990).
In our problem, we define two stochastic processes Xi(t) and Xj(t) to represent building vibrations at sensor locations i and j, respectively, and then define the directed information between them using their joint probability density function (PDF). If Xi(t) and Xj(t) are independent, their joint PDF is equivalent to the product of their marginal distributions for all times n1, … , nN,
where and represent the collections of Xi(t) and Xj(t), respectively, for t = n1, … , nN. Then, the mutual information of Xi and Xj (I(Xi; Xj)) is quantified as the distance (or information discrepancy) between the joint PDF and the product of the marginals by using the concept of Kullback–Leibler divergence (Dhillon et al., 2003; Veyrat-Charvillon and Standaert, 2009) (i.e., the mutual information measures the degree of dependency). The distance here represents the information gain that we revised our belief from Xi and Xj are independent to that Xi and Xj are dependent:
Mutual information is always non-negative. And mutual information will be zero when Xi(t) and Xj(t) are independent. This mutual information does not represent any directionality in information flow. To introduce directionality, an alternative factorization in terms of the joint PDF is proposed. This factorization can represent the information feedforward and feedback (Massey, 1990):
where and . If we consider Xi as an input and Xj as an output, and correspond to information feedback and feedforward, respectively.
Similar to the definition of the mutual information where we compare the true joint PDF to the PDF computed as if the processes are partial dependent, the directed information from Xi to Xj is defined as the information discrepancy between the true joint PDF and the PDF computed as if Xi depends on Xj but not vice versa. Thus, the directed information is defined as
The directed information is smaller than or equivalent to the mutual information. When Xj does not depend on Xi, , and directed information is equal to the mutual information. Note that . With transform on equation (6), the directed information can also be expressed using entropy and conditional entropy:
where
The entropy and here are functionals of the discrete distribution of variables and for k ∈ {1, … , N}. When estimating directed information, we use equation (7) for computational efficiency, instead of equation (6) that involves estimating joint PDF. The entropy values are estimated using the minimax rate-optimal estimators under l2 loss (Jiao et al., 2013, 2015). The minimax estimator minimizes the maximum loss function between estimator and functional of real distribution. The loss function is l2 norm of difference between estimator and functional of real distribution. We use empirical D-tuple joint distribution based on the collected data to estimate the functionals of real distribution, and it has been proved that empirical joint distribution of D-tuple converges to the true joint distribution (Jiao et al., 2013, 2015). The estimator converges faster and has less mean square error than conventional MLE (Maximum Likelihood Estimator) (Jiao et al., 2015).
Using the building vibration data collected from different locations, directed information between all the sensor measurement pairs is computed to obtain the causality between them. Based on the known sensor locations, we can construct the building vibration pattern graph under different train events. The difference between the directed information from sensor i to j and their inverse directed information (i.e., directed information from sensor j to i) is defined as feature. If the feature has a high absolute value, the information exchange from sensor i to j has strong directionality. The feature with value close to zero represents weak directionality.
Since the directed information is computed at every time point, the feature dimension is high when data sampling frequency is high. Thus, we use windows to segment the original directed information features and take an average value for each window. The window sizes are determined empirically as investigated in Section 4.3.2.
3.3.2. Infer Train Event Characteristics
This paper uses different train direction to illustrate the event characteristics. The train direction is classified using the directed information based features extracted from multiple sensor measurement pairs. Supervised machine learning approach is used for this purpose. The main challenge of our problem is the high dimensionality of the directed information based feature. When the number of training sample is relatively small, the classification algorithm performance may become unstable. To address this challenge, we use kernel support vector machine for classification (Cristianini and Shawe-Taylor, 2000; Scholkopf and Smola, 2001). This method has an advantage in handling high-dimensional data.
4. Evaluation
In this section, we evaluate our algorithm by deploying our system in an 11-story building with a light rail line running 100 m away. During a 3-month period, we collected approximately 10 GB of vibration data, and 450 hours of video for ground truth. The vibration data are collected from four groups of sensors deployed on the 11th floor of building. Then, we extract wavelet-based features and use machine learning to detect the time interval of a passing train. Finally, with the detected time interval, we extract the information exchanges inside building during train passing to infer the directions of train.
4.1. Rohm Building Experiment Setup
We evaluate our algorithm for 1 month on a train-building system with nearby light rails. Here, we give a brief description of the data collection system.
The deployment is done in the newly completed Rohm building at the Tsinghua University campus located in Beijing China. It is an 11-story building with 3 basement levels, totaling 3,50,000 ft2. The building houses the Electronic Engineering Department of Tsinghua, and about 1,000 occupants work in the building. This building is located around 80–140 m away from a railway (10 trains per day) and Beijing light-rail line 13 (1 million daily riders, 5–11 min between two trains), respectively. These lines provide a regular active excitation to the building. The left side of Figure 3 shows a top down view of the deployed building. The center of the figure shows the train track location, and the right side of the figure shows the photos of the sensor (top), light rail track (middle), and the outside view of the building (bottom).
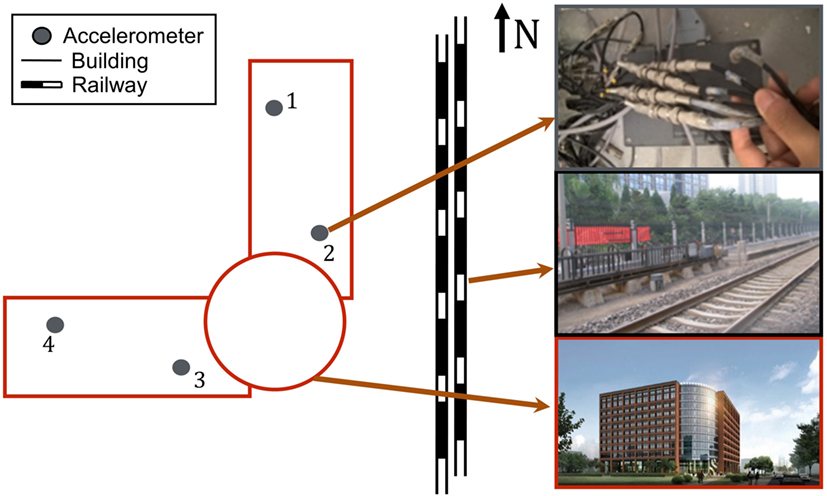
Figure 3. Building, location of train track, and sensor deployment (vertical view).
The building is deployed with 40 high-quality accelerometers. These sensors are embedded in the floor of the building to monitor vibrations. The network of accelerometers is distributed over the building to record its vibration at different locations and directions. The accelerometers are divided into 16 groups and deployed on the 1st, 5th, 8th, and 11th (top) floor of the building, with 4 groups on each floor. These sensors are deployed at the same location per floor (approximate location shown on left side of Figure 3). Coaxial wires are used to connect the sensors to a data collector on each floor, which sends the vibration data to a central server through local area networks. In this experiment, we utilized only the 11th floor sensors as it gives the largest swing and highest sensitivity to our measurements. We collected data on weekdays from June to August in 2015.
The precision of our single-axis sensor is 10−5 m/s2, with highest sample rate of 1,024 samples per second. In our experiments, we collected data at 200 Hz totaling 400 million data points through the period of the experiment due to storage limitations.
There are trains passing by building in two opposite directions daily: from North to South, and from South to North. About 70 trains with heavy loadings including cargo and thousands of passengers pass by the building daily. Throughout the experiment, we observed roughly 1,200 train passes. These vibrations are not strong enough to be directly perceived by humans.
4.2. Event Detection Results and Discussion
This section presents the train event detection results. We first characterize the wavelet-based features extracted from building vibration signals under different train events. Then, we explain how to find the ground truth for evaluation using camera data. Finally, the accuracies of event detection using two machine learning techniques are presented and discussed.
4.2.1. Characterization of Wavelet-Based Features
In this section, we show the characteristics of the data to better understand the signals. We first show both the time and frequency domain of vibration signals through a train event. Then, we show our wavelet transform technique provides multi-resolution to show the existence of train event around building by capturing characteristics of vibration.
We give an example of signal segment in Figure 4 to illustrate the general nature of the captured signal. The data are collected from 4 sensor groups described above at the time when a train is passing. Based on the camera data, we manually labeled the train passing time at 32–48 s. As Figure 4 shows, the measured vibration signals are quite noisy, and the train event is not obvious well bellow the noise floor as to make it not immediately visible. This is due to the high amount of environmental noise in the setting including outside traffic, heating and cooling systems of the building, weather, building occupants, etc.
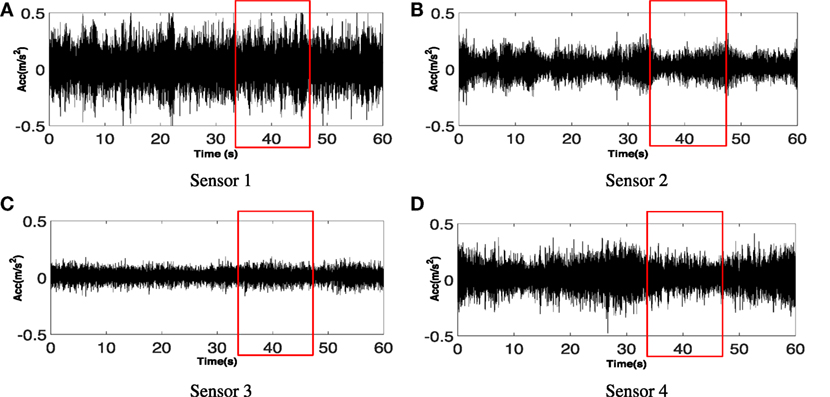
Figure 4. Vibration signals for 60 s collected from 4 sensors deployed on the 11th floor as shown in Figure 3. The train passed by the building at 32–48 s (as red boxes show). The building vibration due to train is not obviously visible due to the background noise. (A) Sensor 1. (B) Sensor 2. (C) Sensor 3. (D) Sensor 4.
Figure 5 shows the same raw signals using Short-time Fourier Transform (STFT) with window length of 0.25 s. Although the general vibration frequency of current building is visible in this figure, the train event cannot be seen from the time-frequency features. This is due to the fact that short-time Fourier Transform decomposes signals in fixed frequency resolution while the train generates multiple frequencies. Note that although the low frequency area (around 10 Hz) in Fourier spectrum of sensor 3 signal shows high energy values indicating an event happening at around 40–42 s, using this feature would incur frequent false positives and negatives because (1) the time duration of high energy area is short; (2) there exists many other peaks of similar magnitude and durations; and (3) the high energy area does not appear in the spectrum of any other three sensors. Although the window size for STFT may be tuned for each frequency to optimize the visibility of the peak, it is difficult to apply different window size for different frequencies for STFT, and it requires multiple parameter tunings which makes the algorithm inefficient.
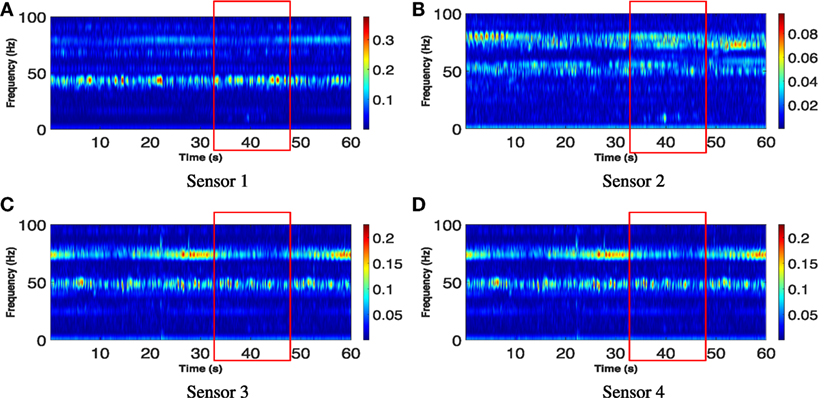
Figure 5. Short-time Fourier Transform (STFT) of vibration signals shown in Figure 4. The red boxes show the time duration of train passing. Similar to the vibration signal, the train event is not obviously visible. (A) Sensor 1. (B) Sensor 2. (C) Sensor 3. (D) Sensor 4.
Wavelet analysis results of two vibration data series produced by 4 sensors using Continuous Wavelet Transform (CWT) are shown in Figure 6. Here, we choose scale from 1 to 32, which includes general frequency of Rohm building vibration of 10–80 Hz. The larger coefficients indicate stronger similarity between the signal and the analyzing function. As Figure 6 shows, the wavelet coefficient under the train event is significantly higher than wavelet coefficient at the time with no passing trains (compared to the raw time-domain signal in Figure 4 and short Fourier transform shown in Figure 5). In particular, the coefficient corresponding to the train passing event is most prominent from 8 to 24 in scale. The result shows the advantage of wavelet analysis in detecting the train-induced slight changes of vibration signals.
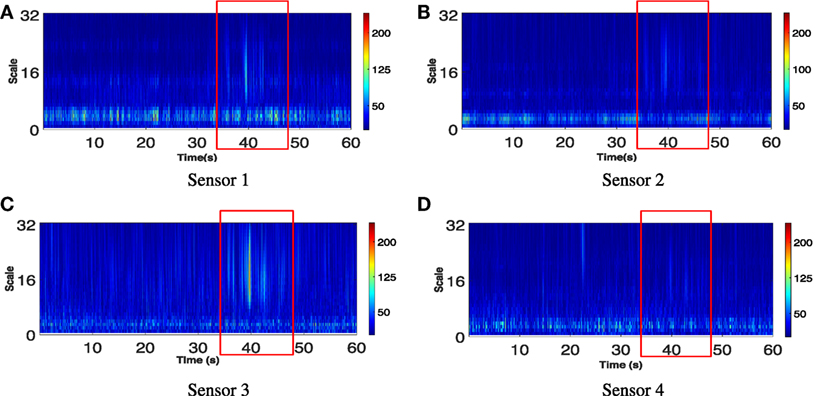
Figure 6. Wavelet coefficients (scaled from 1 to 32) of the building vibration signals shown in Figure 4. The red boxes show the time duration of train passing. The train event is clearly visible in the data from all four sensors between 38 and 45 s. (A) Sensor 1. (B) Sensor 2. (C) Sensor 3. (D) Sensor 4.
4.2.2. Train Event Labeling
To perform the evaluation, we need to properly label the segments of the vibration input using ground truth (video). In our case, we recorded the train passing time as the time when the head of train arrive at one side of building, until the time that the end of train leave the other side of building. In our experiments, we observed that it took 12–20 s for a train to pass by the building depending on its speed and length. This time interval recorded by visual inspection may not represent the “true” time interval when the vibration excited by train will influence the building. This is due to the difference of speed of visual light vs. ground vibration, and different strength of influence due to the ground composition. We calculate and remove this time delay interval by using cross-correlation to calculate the delay time between when the train passed by the building and when the building got affected.
To obtain the ground truth of the train passing, we recorded a total of 450 hours of usable video (image capture shown in Figure 1A). Using the video, we obtained manually a binary observation sequence indicating whether the train passes by the building at each time fragment of 1 s and its direction. Then, we divided the vibration data into fragments of the same length and use average wavelet coefficients over scale 8–24 as the indicator, which contains the information about the influence from train. Through calculating the cross-correlation between observation sequence and influence sequence, the time shift with which the maximum cross-correlation value appears is regarded as the maximum possible delay between the two sequences. Because of the velocity and length of train changes, the total time of train passing by the building is also different. Here, we calculated the ratio of delay time to total time length to see the distribution of delay time. Figure 7 shows the histogram of delay time ratio’s distribution. Specifically, Figures 7A,B separately show the relationship between delay time and directions of the train. As expected, the train from south to north tends to get positive delay time ratio and the train from north to south tends to get negative delay time ratio. We can use these factors to calibrate the delay time based on visual time and delay time and get the ground truth about when the vibration of building was affected by train.
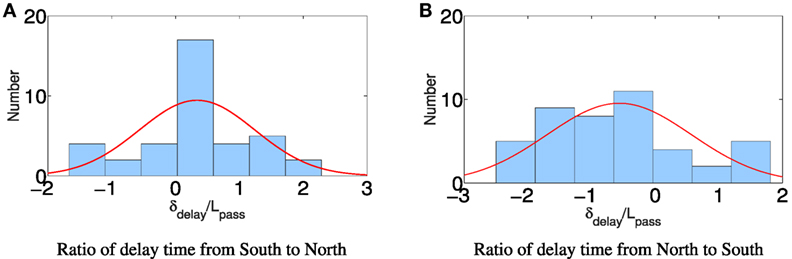
Figure 7. The histogram of 82 cases’ ratio of delay time to total time of train passing, which is calculated by cross-correlation. Y-axis represents the number of cases, X-axis represents the ratio of delay time to total time length, and red line is the pdf curve of corresponding fitting normal distribution. (A) Ratio of delay time from South to North. (B) Ratio of delay time from North to South.
4.2.3. Train Event Detection Results
Using the wavelet results, we input the extracted wavelet coefficient as features to classification model to detect whether the train passed by or not at corresponding time interval.
After extracting the wavelet coefficient as features, we use supervised classification on time fragment for train event detection. Here, we considered Support Vector Machine (SVM) and Random Forest (RF) as classifiers.
The average of wavelet coefficients over different time fragments are calculated as features on each scale and each sensor. For every time unit, we extracted the average wavelet coefficients over scale 8 to scale 24 from each sensor. Thus, we will have t × 4 dimensional features, where t is the number of time unit. For the training set, the output is a binary label sequence indicating whether there is a train passing during corresponding time or not.
As a baseline to our algorithm described in the previous section, we extract dynamic frequency domain features to identify the effect from traffic events. This is extracted using Fourier analysis. We analyzed the peak frequencies with a moving window of 1 s on the vibration data. We calculate the corresponding power spectral density and record the frequency and PSD of the 5 largest peaks.
Our dataset includes the vibrational data collected in the building and video ground-truth data. The dataset was down selected to only include train passing through without light rail passing within 1 min before and after to simplify the problem. This includes 55 cases when there is a passing train and 60 cases when there is no passing train. 90 (45 train, 45 no train) samples are used to train binary classification models, and the remaining 25 cases are used to test the accuracy of classification models. We labeled the samples by combining collected visual data and delay time.
With sample rate of 200 Hz and around 16-s long-time series, the number of features is always much higher than sample number, which is unbalanced and makes it difficult to train models. As discussed in Section 3, we use a sliding time window to increase training accuracy. Figure 8 shows the classification accuracy of the two algorithms (SVM vs. RF) using both feature selection methods (wavelet and Fourier) over time. The performance of random forest is better than that of a tuned support vector machine. The optimal window length is around 0.25 s. We can see that when we use all wavelet coefficients during train pass by as features, the accuracy is low due to small number of training samples compared to number of feature. And when the window length is too long (e.g., 1 s), the accuracy also decreases because at this window length some information begins to be lost for event detection.
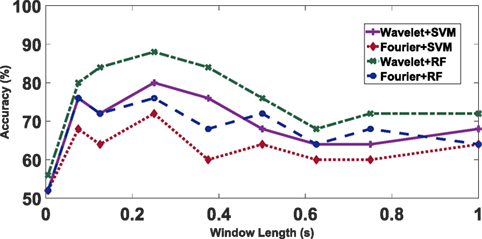
Figure 8. The figure shows how accuracy of different methods changes with increasing window length. “Wavelet+*” represents we use wavelet analysis to extract feature; “Fourier+*” represents using Fourier analysis to extract feature; and SVM and RF represent the classification method Support Vector Machine and Random Forest, respectively.
Figure 8 also compares the two feature selection methods, one is based on wavelet analysis and another is based on Fourier analysis. We see that the accuracy of wavelet-based feature is consistently higher than the accuracy to use Fourier-based feature. The highest accuracy (wavelet with random forest) of 88% is achieved at window length of 0.25 s based on features of wavelet coefficient and Random Forest classification models.
We further present the confusion metric of the prediction result and ground truth in Table 1. From the table, we see that the train passing event is correctly classified 93.3% of the time, corresponding to 6.7% false negative. Similarly, the no train is classified correctly 80% of the time, corresponding to 20% false positive. This is likely due to the location of the testing building being next to both rail and large roads. The effect of the train event is fairly similar to existence of other large traffic. Thus, during training, we only identified tests that have effect and no train and did not train the difference between other large traffic events (trucks, buses, etc.). This similarity raises the false positive events.
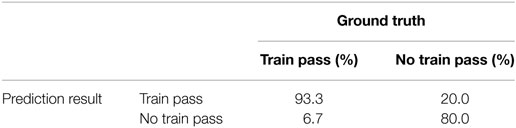
Table 1. The true positive, true negative, false positive, and false negative of train event detection.
To see the sensitivity of the detection due to the system, we also analyzed the effect of sample rate on train event detection accuracy. By subsampling the vibration signals from a sample rate of 200 Hz, we simulate collecting vibration data with sample rate of 100, 50, 25, and 1 Hz. As Figure 9 shows, when the sample rate is low, e.g., 1 Hz, the highest train event detection accuracy is only about 56%, which is close to 50% accuracy baseline of blind classification. When the sample rate increases to 25 Hz, the accuracy achieved 84%, which is 28% higher than the accuracy on sample rate of 1 Hz. However, with sample rate increases further to 50 and 100 Hz, the accuracy drops. This is likely due to that the majority of train vibration information exists in the lower frequencies, i.e., near 25 Hz. For example, this could include general rumbling created by the train, or a cart in the hallway. However, for increased accuracy, the distinctive features of the train vs. no train passing are at higher frequencies. The initial drop in accuracy could be due to the increased noise introduced initially at the mid frequencies.
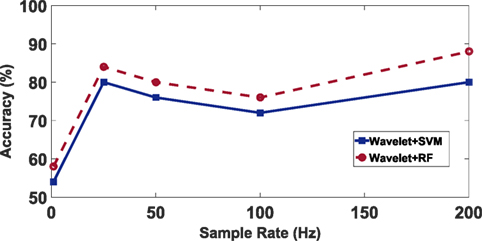
Figure 9. Accuracy under different sample rates based on (1) red line: wavelet coefficients as features and Support Vector Machine as classification model; (2) blue line: wavelet coefficients as features and Random Forest as classification model.
4.3. Event Direction Inference Results and Discussion
In addition to the existence of the train events, we further explore the results of directional inference of the train through the use of directed information between the multiple sensors.
4.3.1. Characterization of Directed Information Features
In order to characterize beyond the existence of the train, we explore the directionality of the train event. In this evaluation, we use the same 4 sensors on the 11th floor of the building recording vertical vibration to investigate their influence on each other (see Figure 3). These 4 sensors will have 6 paired combinations (sensor 1 vs 2, sensor 1 vs 3, sensor 1 vs 4, sensor 2 vs 3, sensor 2 vs 4, and sensor 3 vs 4). First, we found that the building vibration patterns without a passing train are rather random and show no consistent patterns in directed information results. Thus, there is no inherent bias in the information propagation without the train.
In our case, the signals will be quantized into 10 levels before calculating directed information. The algorithm introduced in Section 3 can detect the time and duration of train events automatically. Then, we extract the vibration signals during train events and quantize these signals. In general, to effectively estimate the directed information, a large number of quantization level is desirable, since with large quantization levels, the signal amplitude range for each quantization level is small (i.e., higher signal resolution) such that more information contained in difference between signals can be extracted. However, this level cannot be too large because of the limitation of . m is the sufficient sample number for calculating directed information between two signals and m < n, where n is the total sample number. So we decided maximum quantization level of 10 based our current total sample number and reorganized the data of sensor 1 and 2 into two m × (n − m) matrix. The matrix will be input to calculate the directed information along time series.
We constructed the vibration pattern with train in two different directions, northbound and southbound. Here, we use simple threshold to find the direction of information exchange between sensor pairs based on the extracted directed information and inverse-directed information. For example, given sensor 1 and sensor 2, if the absolute value of I(1 → 2) − I(1 → 2) is less than threshold, we regard the case as no directionality in the information exchanges between sensor 1 and sensor 2. If I(1 → 2) − I(2 → 1) is large than the threshold, we regard the direction is from sensor 1 to sensor 2; If I(2 → 1) − I(1 → 2) is larger than the threshold, the direction will be from sensor 2 to sensor 1.
Figure 10 shows the dominant vibration patterns when there are trains passing by the building in different directions. Figure 10A shows the northbound train, and Figure 10B shows the vibration pattern for the southbound train. The arrow shows the direction of the propagation of information using directed information. More than 40% N–S cases have the same pattern as Figure 10A shows, and more than 45% northbound cases have the same pattern as Figure 10B. Other patterns follow this general trend. For the northbound trains, the vibration is first observed from the southern end of the building (sensors 2–4) and propagates to the northern part of the building. For the southbound trains, the vibration information propagates from east (sensors 2 and 3) to west (sensor 4).
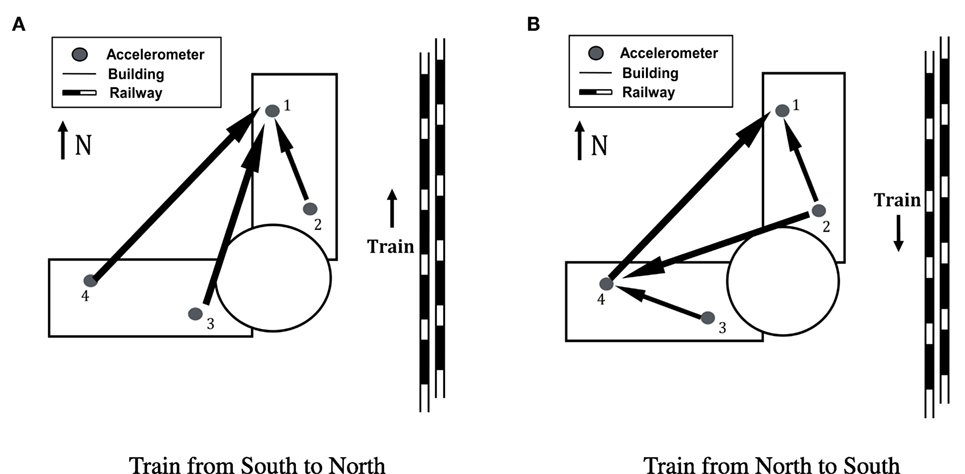
Figure 10. (A) Directions of information propagation among 4 sensor groups on the 11th floor when a train passes from South to North; (B) directions of information propagation among 4 sensor groups on the 11th floor when a train passes from North to South.
Over the whole train passing process, the building vibration is a very complex process with coupling of excitation source and structure properties. In the process of wave propagation, the reflection, interference, and diffraction between wave and structures are very complicated. Besides, the train here is a moving line excitation source, which makes the vibration pattern extracted based on the overall process of train passing more complex. It is hard to predict the vibration patterns inside building intuitively by matching them with the train direction. However, since the time of wave arrivals on different sensors varies with trains’ direction, we can conclude that the vibration patterns are different under different directions of train passing by the building. The change of pattern revealed in two causal graphs demonstrates not only the event’s influence on the building’s vibration characteristics but also how the building reacts to different kinds of vibration in different ways.
4.3.2. Train Event Inference Results
Based on extracted directed information features, we used a classification model to predict the directionality of train events. Here, we label each sample using the direction of the passing train during the corresponding time interval. We also need to decide the optimal window length of generating samples: when the window length is too short, the uncertainty of value of directed information will affect the extracted feature significantly; when the window length is too long, we may lose the details about the response of information exchanges inside building to train events during the time window. In our method, support vector machine is applied to classify the direction based on the extracted directed information features.
To evaluate our classification system, Figure 11 shows the accuracy to infer the direction of train passing by the building using different sliding window lengths. The red line shows the results of our directed information approach, while the blue line uses cross-correlation coefficients between sensor pairs. The results show that the accuracy decreases with large window lengths. That is because longer window length loses time resolution of features. Figure 11 also shows that given the same classification method, our directed information-based features achieve the directional accuracy of up to 86.9%, compared to 66.9% when using the cross-correlation-based method. This corresponds to a 2.5× reduction in error.
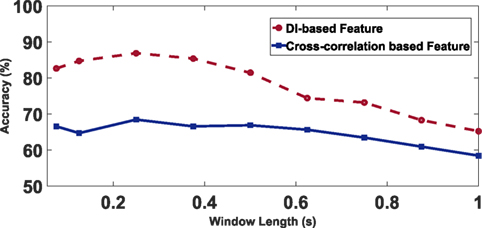
Figure 11. Accuracy of train direction prediction: (a) red line: using directed information as features; (b) blue line: using cross-correlation coefficients features.
In this paper, we evaluate the robustness of our algorithm to some factors (e.g., weather condition, temperature, indoor people activity, other traffic noise, etc.), by collecting data on different days and different time of a day with various temperature, noise level, peoples activity, and weather conditions, including rainy, sunny, and cloudy weather. Figures 12A,B show the algorithm accuracy for different temperature level and time of the day, respectively. Although the temperature may cause changes on the physical properties of building structure, we found that our algorithm is robust to temperature variations, as shown in Figure 12A. In addition, the weather pattern was fairly consistent over a day and closely correlated with temperature, which implies that our method is also robust to weather. For Figure 12B, the accuracy starts decreasing at the beginning of business hours around 7:00 a.m. and then starts increasing around noon time and then reaches the maximum value around 5:00 p.m. This may be due to indoor activity and outside traffic noise during business hours. On weekdays, indoor people activities are very frequent during 9:00 a.m. to 5:00 p.m. The traffic on the road between Rohm building and train track is particularly busy during the afternoon. There are several other factors may also affect the performance of the algorithm, such as wind speed, which can be potential future work for this project.
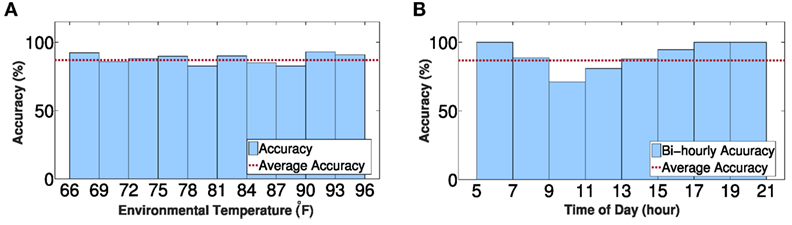
Figure 12. Accuracy of train direction prediction (A) under different environmental temperatures between 66 and 96°F; (B) at different time of day from 5:00 a.m. to 9:00 p.m.
5. Conclusion
In this paper, we present a method to detect and characterize train events through an information-theoretic approach using a building’s vibration responses. We represent vibration propagation in the building structure as information exchanges in signals using directed information measure. Our event detection method first identifies time of train passing using wavelet-based features. Then, directed information estimators are used to study the building’s vibration characteristics under different train event conditions (southbound vs. northbound trains). We evaluated our method using an 11-story building located near a light rail line and achieved 93% true positive rate and 80% true negative rates for train event detection. The directions of passing trains were inferred with accuracy of 86.9%, which is a 2.5× reduction in error compared to conventional method.
The directed information based on causal analysis provides a new perspective in analyzing building dynamics, with which traditional physics-based analysis can be coupled, for further improvement. While this paper focuses on the passing of trains, it can similarly be applied to other significant traffic events in the surrounding environment.
Author Contributions
All authors have worked on developing the concept and deploying the system. In particular, SX and HN mostly focused on overall algorithm, modeling, and conducting experiment. LZ and PZ mostly focused on data acquisition and experimentation aspects of the work. All authors have worked on writing and revising the paper.
Conflict of Interest Statement
The authors declare that the research was conducted in the absence of any commercial or financial relationships that could be construed as a potential conflict of interest.
Acknowledgments
The authors gratefully thank Jiantao Jiao, Junwei Fu, Xiangxiang Xu, and Weiwei Jiang for their help on collecting data and discussion about information theory.
Funding
This work was partially funded through generous supports from the National Science Foundation #1149611, Intel, Nokia, and the University Transportation Center (# DTRT13-G-UTC26). The contents of this report reflect the views of the authors, who are responsible for the facts and the accuracy of the information presented herein. This document is disseminated in the interest of information exchange. However, the funding agencies assume no liability for the contents or use thereof.
References
Adam, M., and Von Estorff, O. (2005). Reduction of train-induced building vibrations by using open and filled trenches. Comput. Struct. 83, 11–24. doi: 10.1016/j.compstruc.2004.08.010
Ahmad, S., and Al-Hussaini, T. (1991). Simplified design for vibration screening by open and in-filled trenches. J. Geotech. Eng. 117, 67–88. doi:10.1061/(ASCE)0733-9410(1991)117:1(67)
Bahrekazemi, M. (2004). Train-Induced Ground Vibration and Its Prediction. Ph.D. thesis, Royal Institute of Technology.
Balendra, T., Chua, K., Lo, K., and Lee, S. (1989). Steady-state vibration of subway-soil-building system. J. Eng. Mech. 115, 145–162. doi:10.1061/(ASCE)0733-9399(1989)115:1(145)
Chua, K., Lo, K., and Balendra, T. (1995). Building response due to subway train traffic. J. Geotech. Eng. 121, 747–754. doi:10.1061/(ASCE)0733-9410(1995)121:11(747)
Coifman, R. R., Meyer, Y., and Wickerhauser, V. (1992). “Wavelet analysis and signal processing,” in In Wavelets and Their Applications, eds J. S. Byrnes, J. L. Byrnes, K. A. Hargreaves, and K. Berry (Boston: Citeseer), 153–178.
Comon, P. (1994). Independent component analysis, a new concept? Signal Process. 36, 287–314. doi:10.1016/0165-1684(94)90029-9
Cortes, C., and Vapnik, V. (1995). Support vector machine. Mach. Learn. 20, 273–297. doi:10.1007/BF00994018
Cristianini, N., and Shawe-Taylor, J. (2000). An Introduction to Support Vector Machines and Other Kernel-Based Learning Methods. Cambridge, UK: Cambridge University Press.
Dhillon, I. S., Mallela, S., and Modha, D. S. (2003). “Information-theoretic co-clustering,” in Proceedings of the Ninth ACM SIGKDD International Conference on Knowledge Discovery and Data Mining (Washington, DC: ACM), 89–98.
Doebling, S. W., Farrar, C. R., Prime, M. B., and Shevitz, D. W. (1996). Damage Identification and Health Monitoring of Structural and Mechanical Systems from Changes in Their Vibration Characteristics: A Literature Review. Technical Report. NM, USA: Los Alamos National Laboratory.
Ellingwood, B., and Tallin, A. (1984). Structural serviceability: floor vibrations. J. Struct. Eng. 110, 401–418. doi:10.1061/(ASCE)0733-9445(1984)110:2(401)
Gentile, C., and Saisi, A. (2007). Ambient vibration testing of historic masonry towers for structural identification and damage assessment. Constr. Build. Mater. 21, 1311–1321. doi:10.1016/j.conbuildmat.2006.01.007
Gubbi, J., Buyya, R., Marusic, S., and Palaniswami, M. (2013). Internet of things (IoT): a vision, architectural elements, and future directions. Future Gener. Comput. Syst. 29, 1645–1660. doi:10.1016/j.future.2013.01.010
Hall, L. (2003). Simulations and analyses of train-induced ground vibrations in finite element models. Soil Dyn. Earthquake Eng. 23, 403–413. doi:10.1016/S0267-7261(02)00209-9
Hao, H., Ang, T., and Shen, J. (2001). Building vibration to traffic-induced ground motion. Build. Environ. 36, 321–336. doi:10.1016/S0360-1323(00)00010-X
Hera, A., and Hou, Z. (2004). Application of wavelet approach for ASCE structural health monitoring benchmark studies. J. Eng. Mech. 130, 96–104. doi:10.1061/(ASCE)0733-9399(2004)130:1(96)
Jaynes, E. T. (1957). Information theory and statistical mechanics. Phys. Rev. 106, 620. doi:10.1103/PhysRev.106.620
Jiao, J., Permuter, H. H., Zhao, L., Kim, Y.-H., and Weissman, T. (2013). Universal estimation of directed information. IEEE Trans. Info. Theory 59, 6220–6242. doi:10.1109/TIT.2013.2267934
Jiao, J., Venkat, K., Han, Y., and Weissman, T. (2015). Minimax estimation of functionals of discrete distributions. IEEE Trans. Info. Theory 61, 2835–2885. doi:10.1109/TIT.2015.2412945
Ju, S.-H. (2009). Finite element investigation of traffic induced vibrations. J. Sound Vib. 321, 837–853. doi:10.1016/j.jsv.2008.10.031
Kim, S., Pakzad, S., Culler, D., Demmel, J., Fenves, G., Glaser, S., et al. (2007). “Health monitoring of civil infrastructures using wireless sensor networks,” in 6th International Symposium on Information Processing in Sensor Networks (Cambridge, MA: IEEE), 254–263.
Kittelson, M. J. (2010). The Economic Impact of Traffic Crashes. Ph.D. thesis, Georgia Institute of Technology.
Kostakos, V., Ojala, T., and Juntunen, T. (2013). Traffic in the smart city: exploring city-wide sensing for traffic control center augmentation. IEEE Internet Comput. 17, 22–29. doi:10.1109/MIC.2013.83
Kouroussis, G., Connolly, D. P., and Verlinden, O. (2014). Railway-induced ground vibrations – a review of vehicle effects. Int. J. Rail Transp. 2, 69–110. doi:10.1080/23248378.2014.897791
Lam, M., Mirshekari, M., Pan, S., Zhang, P., and Noh, H. Y. (2016). “Robust occupant detection through step-induced floor vibration by incorporating structural characteristics,” in Dynamics of Coupled Structures, eds M. Allen, R. L. Mayes, and D. Rixen, Vol. 4 (Orlando: Springer), 357–367.
Lederman, G., Chen, S., Garrett, J. H., Kovačević, J., Noh, H. Y., and Bielak, J. (2017a). Track monitoring from the dynamic response of a passing train: a sparse approach. Mech. Syst. Signal Process. 90, 141–153. doi:10.1016/j.ymssp.2016.12.009
Lederman, G., Chen, S., Garrett, J., Kovačević, J., Noh, H. Y., and Bielak, J. (2017b). Track-monitoring from the dynamic response of an operational train. Mech. Syst. Signal Process. 87, 1–16. doi:10.1016/j.ymssp.2016.06.041
Li, Q., Wu, J., Liang, S., Xiao, Y., and Wong, C. (2004). Full-scale measurements and numerical evaluation of wind-induced vibration of a 63-story reinforced concrete tall building. Eng. Struct. 26, 1779–1794. doi:10.1016/j.engstruct.2004.06.014
Lin, C., Wang, J.-F., and Chen, B. (2005). Train-induced vibration control of high-speed railway bridges equipped with multiple tuned mass dampers. J. Bridge Eng. 10, 398–414. doi:10.1061/(ASCE)1084-0702(2005)10:4(398)
Lynch, J. P., and Loh, K. J. (2006). A summary review of wireless sensors and sensor networks for structural health monitoring. Shock Vib. Dig. 38, 91–130. doi:10.1177/0583102406061499
Marko, H. (1973). The bidirectional communication theory – a generalization of information theory. IEEE Trans. Commun. 21, 1345–1351. doi:10.1109/TCOM.1973.1091610
Massey, J. (1990). “Causality, feedback and directed information,” in Proc. Int. Symp. Inf. Theory Applic.(ISITA-90) (Waikiki: Citeseer), 303–305.
Mirshekari, M., Pan, S., Bannis, A., Lam, Y. P. M., Zhang, P., and Noh, H. Y. (2015). “Step-level person localization through sparse sensing of structural vibration,” in Proceedings of the 14th International Conference on Information Processing in Sensor Networks (Seattle, WA: ACM), 376–377.
Mirshekari, M., Pan, S., Zhang, P., and Noh, H. Y. (2016a). “Characterizing wave propagation to improve indoor step-level person localization using floor vibration,” in SPIE Smart Structures and Materials + Nondestructive Evaluation and Health Monitoring, ed. J. P. Lynch (Las Vegas, NV: International Society for Optics and Photonics), 980305.
Mirshekari, M., Zhang, P., and Noh, H. Y. (2016b). “Non-intrusive occupant localization using floor vibrations in dispersive structure: poster abstract,” in Proceedings of the 14th ACM Conference on Embedded Network Sensor Systems CD-ROM (Stanford, CA: ACM), 378–379.
Mokaya, F., Lucas, R., Noh, H. Y., and Zhang, P. (2015). “Myovibe: vibration based wearable muscle activation detection in high mobility exercises,” in Proceedings of the 2015 ACM International Joint Conference on Pervasive and Ubiquitous Computing (OSAKA: ACM), 27–38.
Mokaya, F., Lucas, R., Noh, H. Y., and Zhang, P. (2016). “Burnout: a wearable system for unobtrusive skeletal muscle fatigue estimation,” in Information Processing in Sensor Networks (IPSN), 2016 15th ACM/IEEE International Conference on (Vienna, VA: IEEE), 1–12.
Nadeem, T., Dashtinezhad, S., Liao, C., and Iftode, L. (2004). “Trafficview: a scalable traffic monitoring system,” in Mobile Data Management, 2004. Proceedings. 2004 IEEE International Conference on (Milan: IEEE), 13–26.
Noh, H., and Kiremidjian, A. (2009). “On the use of wavelet coefficient energy for structural damage diagnosis,” in Proc. the 10th International Conference on Structural Safety and Reliability (Osaka, Japan), 3942–3947.
Noh, H., Lignos, D., Nair, K., and Kiremidjian, A. (2009). “Application of wavelet based damage sensitive features for structural damage diagnosis,” in Proceedings of the 7th International Workshop on Structural Health Monitoring (Stanford, CA, USA), 2011–2018.
Noh, H. Y., Lignos, D. G., Nair, K. K., and Kiremidjian, A. S. (2012). Development of fragility functions as a damage classification/prediction method for steel moment-resisting frames using a wavelet-based damage sensitive feature. Earthquake Eng. Struct. Dyn. 41, 681–696. doi:10.1002/eqe.1151
Noh, H. Y., Nair, K. K., Lignos, D. G., and Kiremidjian, A. S. (2011). Use of wavelet-based damage-sensitive features for structural damage diagnosis using strong motion data. J. Struct. Eng. 137, 1215–1228. doi:10.1061/(ASCE)ST.1943-541X.0000385
Nunes, D. S., Zhang, P., and Silva, J. S. (2015). A survey on human-in-the-loop applications towards an internet of all. IEEE Commun. Surv. Tutorials 17, 944–965. doi:10.1109/COMST.2015.2398816
Pan, S., Mirshekari, M., Noh, H. Y., and Zhang, P. (2015a). “Structural sensing system with networked dynamic sensing configuration,” in Proceedings of the 14th International Conference on Information Processing in Sensor Networks (Seattle, WA: ACM), 344–345.
Pan, S., Wang, N., Qian, Y., Velibeyoglu, I., Noh, H. Y., and Zhang, P. (2015b). “Indoor person identification through footstep induced structural vibration,” in Proceedings of the 16th International Workshop on Mobile Computing Systems and Applications (Santa Fe: ACM), 81–86.
Pan, S., Mirshekari, M., Zhang, P., and Noh, H. Y. (2016). “Occupant traffic estimation through structural vibration sensing,” in SPIE Smart Structures and Materials + Nondestructive Evaluation and Health Monitoring, ed. J. P. Lynch (Las Vegas, NV: International Society for Optics and Photonics), 980306.
Permuter, H. H., Kim, Y.-H., and Weissman, T. (2008). “On directed information and gambling,” in IEEE International Symposium on Information Theory (Toronto: IEEE), 1403–1407.
Permuter, H. H., Kim, Y.-H., and Weissman, T. (2011). Interpretations of directed information in portfolio theory, data compression, and hypothesis testing. IEEE Trans. Info. Theory 57, 3248–3259. doi:10.1109/TIT.2011.2136270
Pines, D. J., and Lovell, P. A. (1998). Conceptual framework of a remote wireless health monitoring system for large civil structures. Smart Mater. Struct. 7, 627. doi:10.1088/0964-1726/7/5/007
Purohit, A., Sun, Z., Mokaya, F., and Zhang, P. (2011). “Sensorfly: controlled-mobile sensing platform for indoor emergency response applications,” in Information Processing in Sensor Networks (IPSN), 2011 10th International Conference on (Beijing, BJ: IEEE), 223–234.
Quinn, C. J., Coleman, T. P., Kiyavash, N., and Hatsopoulos, N. G. (2011). Estimating the directed information to infer causal relationships in ensemble neural spike train recordings. J. Comput. Neurosci. 30, 17–44. doi:10.1007/s10827-010-0247-2
Scholkopf, B., and Smola, A. J. (2001). Learning with Kernels: Support Vector Machines, Regularization, Optimization, and Beyond. Cambridge, MA: MIT Press.
Schreiber, T. (2000). Measuring information transfer. Phys. Rev. Lett. 85, 461. doi:10.1103/PhysRevLett.85.461
Sohn, H., Farrar, C. R., Hemez, F. M., Shunk, D. D., Stinemates, D. W., Nadler, B. R., et al. (2004). A Review of Structural Health Monitoring Literature. 1996–2001. Report No. LA-13976-MS. Los Alamos, NM: Los Alamos National Laboratory.
Sun, Z., Purohit, A., Pan, S., Mokaya, F., Bose, R., and Zhang, P. (2012). “Polaris: getting accurate indoor orientations for mobile devices using ubiquitous visual patterns on ceilings,” in Proceedings of the Twelfth Workshop on Mobile Computing Systems & Applications (San Diego, CA: ACM), 14.
Taha, M. R., Noureldin, A., Lucero, J., and Baca, T. (2006). Wavelet transform for structural health monitoring: a compendium of uses and features. Struct. Health Monit. 5, 267–295. doi:10.1177/1475921706067741
Veyrat-Charvillon, N., and Standaert, F.-X. (2009). “Mutual information analysis: how, when and why?” in Cryptographic Hardware and Embedded Systems-CHES 2009, eds C. Clavier and K. Gaj (Lausanne: Springer), 429–443.
Weisbrod, G., Vary, D., and Treyz, G. (2003). Measuring economic costs of urban traffic congestion to business. Transp. Res. Rec. J. Trans. Res. Board 1839, 98–106. doi:10.3141/1839-10
Xia, H., Zhang, N., and Cao, Y. (2005). Experimental study of train-induced vibrations of environments and buildings. J. Sound Vib. 280, 1017–1029. doi:10.1016/j.jsv.2004.01.006
Xu, S., Zhang, L., Zhang, P., and Noh, H. Y. (2016). “An indirect traffic monitoring approach using building vibration sensing system: poster abstract,” in Proceedings of the 14th ACM Conference on Embedded Network Sensor Systems CD-ROM (Stanford, CA: ACM), 374–375.
Zhang, P., Sadler, C. M., Lyon, S. A., and Martonosi, M. (2004). “Hardware design experiences in zebranet,” in Proceedings of the 2nd International Conference on Embedded Networked Sensor Systems (Baltimore, MD: ACM), 227–238.
Zhao, F., Liu, J., Liu, J., Guibas, L., and Reich, J. (2003). Collaborative signal and information processing: an information-directed approach. Proc. IEEE 91, 1199–1209. doi:10.1109/JPROC.2003.814921
Zheng, Y., Zhang, L., Zhang, P., and Noh, H. (2013). Understanding environmental effect on building vibration for structural health monitoring using event detection and causal analysis, International Workshop on Structural Health Monitoring 2013 “A Roadmap to Intelligent Structures”, Stanford, CA, USA.
Keywords: train traffic monitoring, building vibration, information theory, causal analysis, wavelet analysis, indirect sensing, directed information, wave propagation
Citation: Xu S, Zhang L, Zhang P and Noh H (2017) An Information-Theoretic Approach for Indirect Train Traffic Monitoring Using Building Vibration. Front. Built Environ. 3:22. doi: 10.3389/fbuil.2017.00022
Received: 05 August 2016; Accepted: 28 March 2017;
Published: 03 May 2017
Edited by:
Dryver R. Huston, University of Vermont, USAReviewed by:
Hilmi Luş, Boğaziçi University, TurkeyGuirong (Grace) Yan, Missouri University of Science and Technology, USA
Copyright: © 2017 Xu, Zhang, Zhang and Noh. This is an open-access article distributed under the terms of the Creative Commons Attribution License (CC BY). The use, distribution or reproduction in other forums is permitted, provided the original author(s) or licensor are credited and that the original publication in this journal is cited, in accordance with accepted academic practice. No use, distribution or reproduction is permitted which does not comply with these terms.
*Correspondence: Susu Xu, susux@andrew.cmu.edu