Simulation of Time-Varying Spatially Uniform Pressure and Near-Surface Wind Flows on Building Components and Cladding
 Seraphy Y. Shen1
 Forrest J. Masters
 Henry. L. Upjohn II
 Jon Sinnreich
- 1EIT, Stantec Consulting Services, Baton Rouge, LA, USA
- 2Department of Civil and Coastal Engineering, University of Florida, Gainesville, FL, USA
- 3Special-Lite Inc., Decatur, MI, USA
This paper describes a new full-scale (FS) testing apparatus for conducting performance evaluations of FS building envelope systems. The simulator can generate spatially uniform, time-varying pressure conditions associated with Saffir–Simpson Hurricane Wind Scale Category 5 winds while compensating for large air leakage through the specimen and also operate a high-speed wind tunnel, both with dynamic control. This paper presents system details, operating characteristics, and an early case study on the performance of large sectional door systems under wind pressure loading. Failure mechanisms are discussed, and finite element modeling is validated for two specimens. It demonstrates successful dynamic load control for large component and cladding systems, as well as simulation of flows near the building surface. These capabilities serve to complement other FS wind tunnel facilities by offering tools to generate ultimate load conditions on portions of the building. Further, the paper successfully demonstrates the utility of combining physical testing and computational analysis as a matter of routine, which underscores the potential of evolving FS testing to encompass cyber–physical approaches.
Introduction
Damage to building envelope components (e.g., windows, roofs, and doors) can lead to adverse internal pressurization and water ingress (Minor, 2005; Gurley and Masters, 2011). Ensuring adequate performance of these components is critical to maintaining the integrity of a building and ultimately reducing cascading failures modes. In the past, building envelope components were treated as architectural components (Rosowsky and Schiff, 2003). Today, structural performance requirements are enforced in most high wind areas. Products are assessed by rational engineering analysis to ensure that structural behavior does not exceed specified limit states. In most cases, products are evaluated experimentally using standardized testing procedures, e.g., ASTM E1233 (ASTM, 2006), ASTM E330 (ASTM, 2009), ASTM E1996 (ASTM, 2012), ASTM E1886 (ASTM, 2013), AS/NZS 1170.2:2011 (AS/NZS 1170.2:2011, 2011), and BS EN 12211:2016 (BS EN 12211:2016, 2016), which apply simplified loading conditions for a few representative cases of wind–structure interaction.
This approach ensures that products are consistently evaluated from one laboratory to the next with the trade-off that “real” dynamic loading is simplified. For example, the cyclic wind pressure loading sequence specified in IBC (2012) is derived from rainflow-counting analysis of boundary layer wind tunnel pressure coefficient data. Rainflow-counting, which applies the Palmgren–Miner rule (Miner, 1945; Golos and Ellyin, 1987), does not consider low cycle fatigue and the effects of loading sequence (Li et al., 2001; Mahendran, 2003). In addition to the simplification of actual wind loading, the installation of test specimens for the standard tests deviates from the actual boundary conditions in the field, which may influence structural behavior and further separate test results from actual field conditions (Kopp et al., 2010).
Despite the widespread use of standardized testing methods, numerous post-storm damage assessments have found recurring patterns of damage across a wide spectrum of product types (FEMA, 2005; Ginger et al., 2007; Gurley and Masters, 2011; Kopp et al., 2012). These observations underscore the need for new diagnostic tools to validate the performance of component and cladding in high wind regions. A promising approach is FS testing of building systems, which evaluates the performance of complete buildings systems that do not require alteration of boundary conditions or interfaces with other systems.
This paper presents technical details of a new large-scale wind load simulator that recreates dynamic wind and wind pressure records. A case study demonstrating its utility in investigating the performance of building components and cladding under extreme loads is presented, which includes complementary finite element analysis (FEA).
Background
The wind load simulator was inspired by the BRERWULF system developed at the British Research Establishment (Cook et al., 1988) and its successor, the pressure loading actuator (PLA) system developed by Kopp et al. (2010) at the University of Western Ontario (now Western University). A PLA can simulate realistic wind pressure records for a wide range of loading conditions expected to occur on nominally sealed low-rise buildings. It monitors pressure in the test chamber and uses a PID control to proportion a mix of fan exhaust and return to the test chamber in order to “follow” a target pressure time history. Air leakage in/out through the specimen is compensated for through valve ports to the open atmosphere. Under optimal conditions and tuning, waveforms with frequency content up to 8 Hz can be recreated in a nominally sealed chamber. Further, individual units can be synchronized to apply spatially varying loads over a larger specimen (Morrison, 2010).
Pressure loading actuators have become standard tools for wind engineering research. In one of the first studies, Cook (1992) tested single-ply roofing systems under dynamic wind pressure loads using BREWULF and observed that the dynamic responses were non-linear and frequency-dependent. Cook also compared the test results using BREWULF to simple cyclic test results and indicated that quasi-static assumption was not appropriate for single-ply roofing systems. More recently, Morrison (2010) and Henderson et al. (2013) conducted testing on a gable roof and hip roof with toe-nailed roof-to-wall connections, respectively. Henderson and Ginger (2011) simulated cyclonic wind loads to pierced fixed corrugated steel roofing systems. This study continues this work using a new class of PLA designed for testing of large specimens that exhibit a large degree of leakage. The next section provides technical details of its operation. A case study on the performance of rolling doors then follows.
New Large-Scale Dynamic Wind Pressure Simulator
Design Considerations
In September 2009, the University of Florida and Special-Lite, Inc. began the design of a large-scale dynamic wind load simulator to replicate intense hurricane wind loading, i.e., Category 5 hurricanes, to load large/FS building components. The simulator was designed to apply spatially uniform, time-varying pressures on the specimen surface. The simulator was specifically designed for large cladding and component systems for a large range of leakage conditions. The new system differs from the PLA in three significant ways. First, the entire system was integrated to expedite destructive testing of large cladding and component systems (~40 m2) and designed to operate continuously to recreate the entire record of a tropical cyclone. Second, the system was designed to operate over a wide range of leakage conditions and changes in volume caused by specimens deflecting out-of-plane. Third, the test chamber can be bypassed to drive air through a high-speed wind tunnel that is under control of the same damper control system.
Components
Four principal components comprise the simulator (Figure 1A): a fan, the ducting, a control system, and the pressure chamber. The fan (Figure 1B) is a centrifugal blower that can generate a maximum pressure of 22.4 kPa (90″ WC) at an airflow rate of 2,832 m3/min (100,000 CFM). The pressure and flow requirements were determined from simulations of airflow movements in/out of the pressure chamber based on the Helmholtz model described in Oh (2004) and assumptions about air leakage through the test specimens. The pressure coefficient data used to estimate the requirements were obtained from generic wind tunnel models archived in the National Institute of Standard and Technology (NIST) Aerodynamics Database. Details about the wind tunnel models can be found in Ho et al. (2003) (see generic model test 2, exposure: open country).
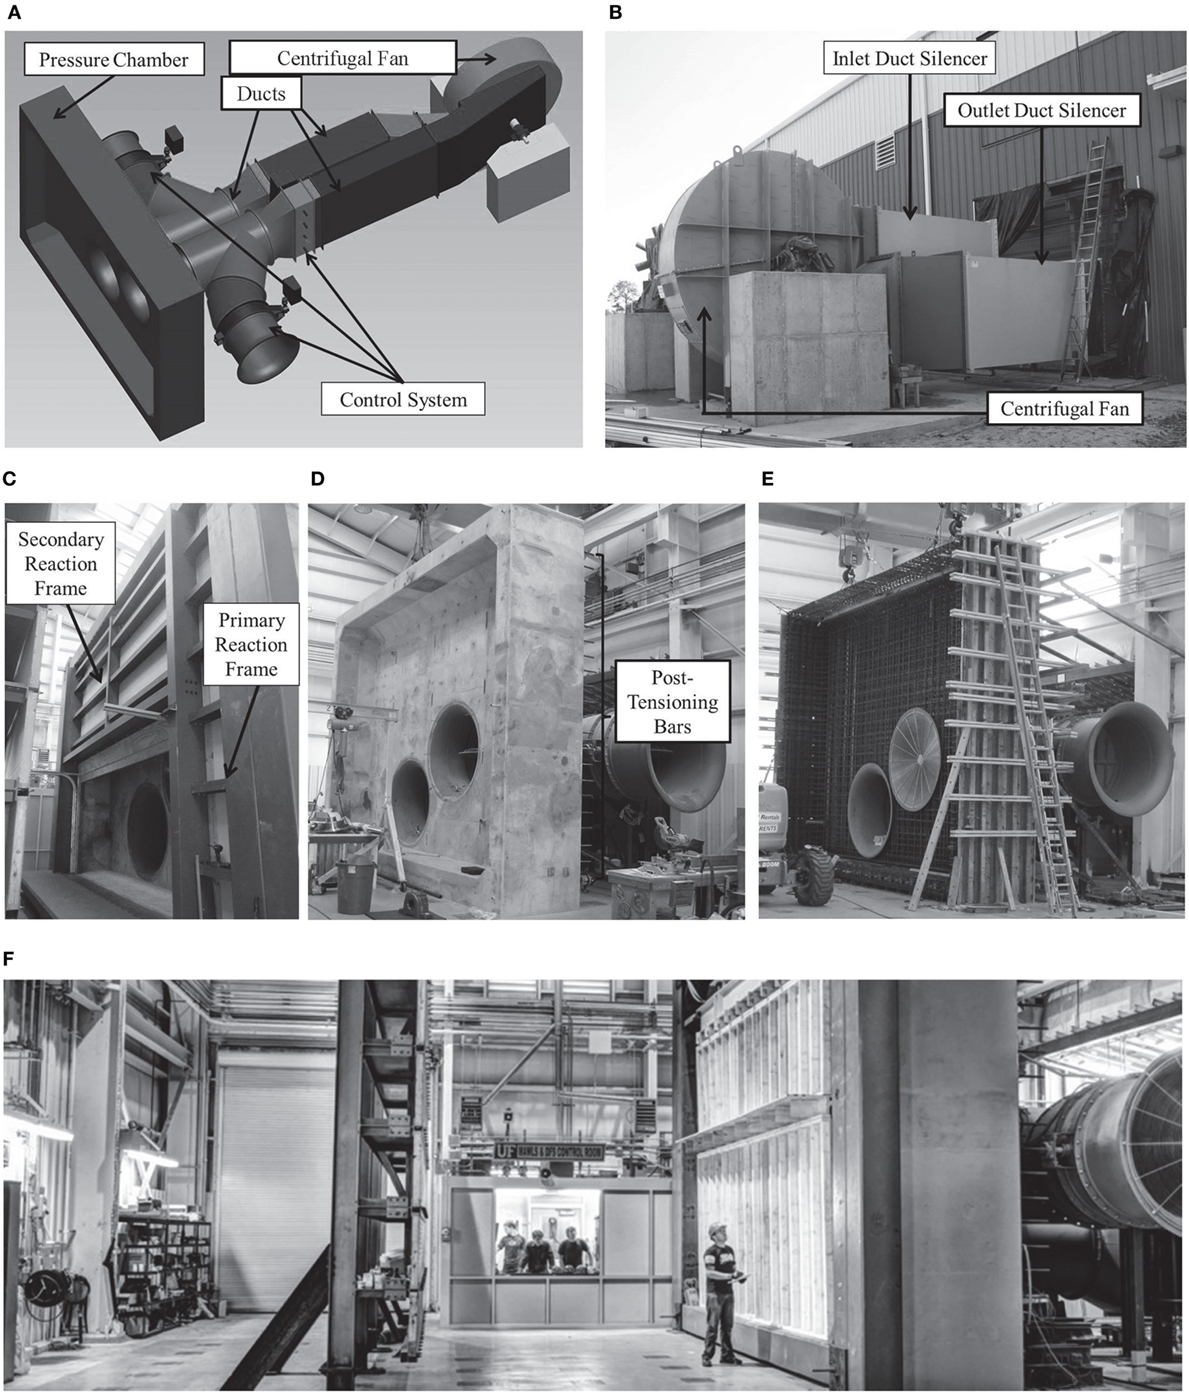
Figure 1. The new large-scale dynamic wind pressure simulator: (A) 3D rendering of the simulator; (B) fan system and duct silencers; (C) reaction frame system; (D) pressure chamber; (E) steel reinforcement; and (F) specimen preparation in the pressure chamber with the impact wall free-standing to the left.
A Caterpillar 3512 DITA diesel prime mover load rated for 1,818 HP at 1,750 RPM drives the fan. A Renold torsional vibration control coupling (model no. SAE 21 SM 60 RB 3.86) is attached to the flywheel of the prime mover to transfer power to a 0.5-m (21″) Wichita Air Clutch (Model 6-12-382-313-9), which engages the fan driveshaft. The dimensions of the ducts connecting the fan and the pressure chamber are 9.5 mm (3/8″) thickness and 1,524 mm (60″) internal diameter. Two VAW duct silencers (Figure 1B) reduce the noise by 20 dBA upstream and downstream of the fan.
Flow is controlled by five dampers (valves): four butterfly dampers and a custom-built fast-acting opposed blade louver damper. The butterfly dampers change the flow configuration so that positive or negative pressure can be applied to the specimen or alternatively bypass the chamber to drive air through a high-speed wind tunnel section. The louver damper modulates the system resistance (i.e., the operating point on the fan curve), which changes the airflow in/out of the pressure chamber and thus causes a corresponding change in the pressure acting on the specimen.
Two Honeywell Model Z transducers measure absolute pressure inside the test chamber. A custom analog computer monitors the pressure measurements, and a bus-powered isolated data acquisition module (NI USB-6218) interfaces between the measured pressure and the computer. The computer sends commands to an analog servo that actuates the hydraulic cylinder driving the louver damper. The control/feedback process is continuous; only analog feedback/control was implemented (i.e., no A/D or D/A). The control system allows the user to select a step-and-hold input (i.e., simply setting a pressure level to be maintained indefinitely), input from a function generator (for example, a sine wave with defined mean, amplitude, and frequency), or a time-varying signal (input file containing the time history of a measured or simulated wind storm pressure signal).
The test specimen is mounted in the reaction frame (Figure 1C) clamped to the open side of the pressure chamber (Figure 1D), which is 7.3 m wide × 5.5 m high × 1 m deep (24 ft × 18 ft × 3 ft). The reaction frame attaches to the reinforced concrete pressure chamber, which has 13 t of mild steel reinforcement (Figure 1E) and 25 mm (1″) diameter post-tensioning bars (Figure 1D) to minimize concrete cracking.
The reaction frame system, which mounts to the pressure chamber opening, consists of primary and secondary reaction frames (Figure 1C). The primary frame resists the catenary forces developed from the test specimen subjected to wind pressure loading. The primary frame is made of HSS 406 mm × 406 mm × 9.5 mm (16″ × 16″ × 3/8″) and has a lateral force capacity of 150 kN/m (10 kip/ft). The primary frame is fixed, while the secondary reaction frame can be removed and resized to accommodate the dimensions of the specimen.
Simulator Validation
Dynamic Pressure Simulation
The fidelity of the pressure simulator for both positive and negative pressure modes was evaluated for sinusoidal pressure input that varied by mean, amplitudes, and frequency. The pressure box was sealed with an impact wall that typically free-stands outside the box to stop debris originating from specimens tested under positive pressure (Figure 1F). It allows for minor leakage at the corners of the wall. Spectral analysis was used to compare the peak power of the target frequency input and output data and generate Bode plots of the results (Figure 2) to evaluate the performance of the system “as-is” to establish a baseline without additional tuning or modifications to increase the fidelity, e.g., reduce the air volume in the chamber, isolating the control system to the open loop on the opposed blade damper to perform a sine sweep, adjusting the PID parameters for the specific application, or tuning the leakage to align the range of the damper movement to optimize controllability. The initial test run was conducted 1,200 RPM, i.e., the “high idle” speed of the diesel motor. A subsequent test run at 1,600 RPM, with the atmospheric butterfly dampers open 40% was also performed (Figures 2C, D). The figures show that the simulator can nominally produce a 1-Hz bandwidth without modifying the system, which is consistent with observations during the commissioning of the system. Higher resolution (on the order of 2–3 Hz) should be possible applying the changes described above.
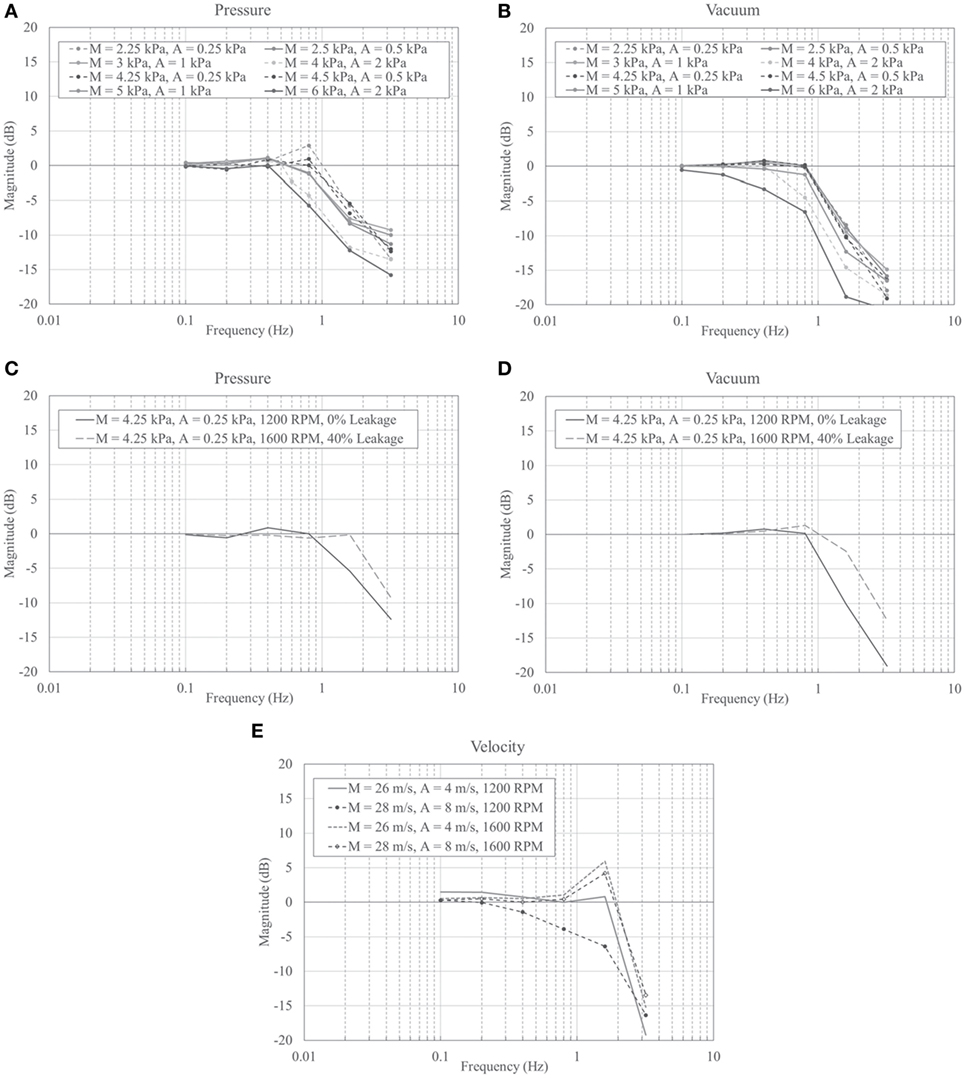
Figure 2. Bode plots for no-leakage (impact wall sealing the pressure box), 1,200 RPM fan speed positive pressure (A) and negative pressure (B) sine wave function for various mean (M) and amplitude (A) settings, and no-leakage/artificial leakage comparison for positive pressure (C) and negative pressure (D) sine wave function with mean of 4.25 kPa (89 psf) and amplitude of 0.25 kPa (5 psf); simulator run at 1,200 RPM with 0% artificial leakage and 1,600 RPM with 40% artificial leakage induced by partial opening of atmospheric outlet (C) or inlet (D) butterfly valves; and for velocity (E) sine wave function for various mean (M) and amplitude (A) settings.
The primary purpose of the simulator is to recreate pressure time histories obtained from the boundary layer wind tunnel of field measurements on real buildings, thus the fidelity of the pressure simulator was also evaluated by recreating a pressure time history from a generic wind tunnel scale model. The pressure signal was calculated using the wind pressure coefficient (Cp) data from model m31 archived in the NIST Aerodynamics Database. The wind tunnel model is a 1:100 scale model of a 3:12 slope gable-roofed building with a 24 m × 38 m (80 ft × 125 ft) rectangular plan and a 9.8 m (32 ft) eave height. The exposure for this wind tunnel model is open country. The wind pressure coefficient is defined as
where p is the pressure measured at a specific location on the model surface, pref is the pressure measured at a reference location (atmospheric pressure), ρ is the density of air, and vref is the velocity measured at the reference location. The pressure coefficient data at the location (expressed in terms of tap numbers) with the largest instantaneous peak Cp were extracted for use in this study. Figure 3A shows the location of the tap and the incident wind angle, and Figure 3B shows the time history of Cp data with a peak value of −7.5.
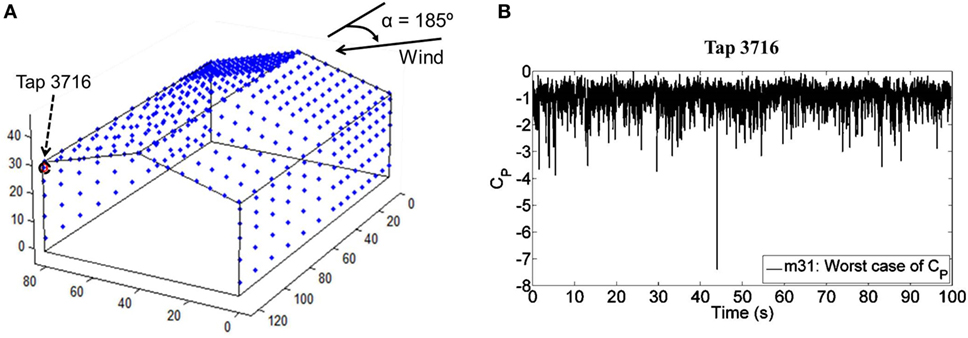
Figure 3. National Institute of Standard and Technology database wind tunnel model and tap locations: (A) the location of Tap 3716 where the maximum Cp was recorded and the incident wind direction; and (B) the time history of the Cp data for Tap 3716.
The Cp data were scaled to FS pressures for seven intensity levels that correspond to ASCE 7 (2010) basic wind speeds of 60, 65, 70, 75, 80, 85, and 90 m/s. The sampling frequency of the NIST model data (fM) is 500 Hz at an eave height mean wind speed (VM) of 9 m/s (29.5 ft/s). The basic wind speed was converted to an open-exposure mean velocity using a gust factor of 1.5. The model-scale time increment was converted to its FS counterpart for each basic wind speed value from the reduced frequency relationship:
The dynamic performance of the simulator was assessed by simulating wind pressure time histories that were filtered using a third-order Butterworth filter. Positive pressure sequences were simulated using the 1 and 2 Hz cutoff time histories. Negative pressure sequences were simulated using the 2 and 3 Hz cutoff time histories. In all cases, the simulator demonstrates a good ability to replicate the peak loads, which is a key consideration in designing FS experiments.
Figure 4 shows a plot of two of the pressure simulations (at 2 Hz cutoff) for seven intensity levels. A 10-s transition time was interleaved between each level, and each intensity level lasted 1 min with the exception of level 7 (46 s).
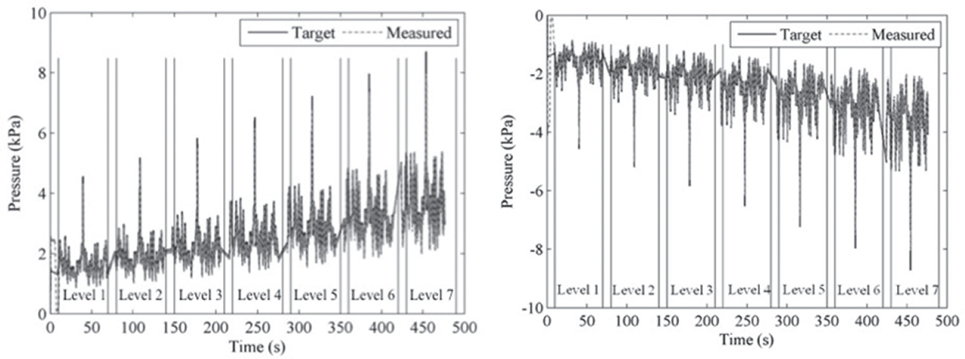
Figure 4. Time histories of target and measured wind pressure at seven intensity levels for two load conditions (2 Hz positive and negative cutoff, respectively). The target pressure represents the pressure that is desired to replicate using the pressure simulator, and the measured pressure represents the actual pressure achieved in the pressure chamber.
The solid black line represents target time-varying pressure derived from the NIST database, and the dash-dot gray line describes the pressure measured in the pressure chamber. Table 1 compares the desired and measured statistics for the simulated wind pressure time history at intensity levels 1 and 7. The statistics agree well, and the mean absolute error percentage averages are 4.5 and 1.5% for the four cases at levels 1 and 7, respectively. Overall, the simulator shows an acceptable fidelity for recreating these time histories.
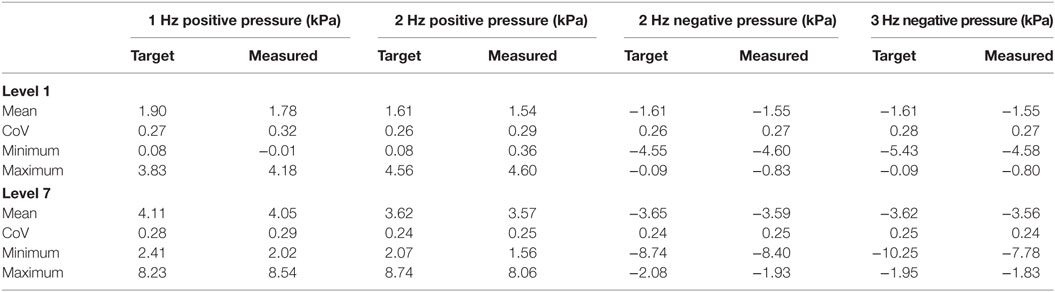
Table 1. Statistics of the target and measured wind pressure at intensity levels 1 and 7.
Dynamic Velocity Simulation
In the velocity simulation mode, the pressure chamber is bypassed so that air moves from the exterior intake through the blower and into the high-speed wind tunnel, which consists of a setting chamber, a contraction duct, a test section, and a diffuser. The test section cross-section area is 213 cm wide × 38 cm tall (7 ft × 1.25 ft). The bottom part of the test section is removable to accommodate roof samples, and it has a dimension of 243 cm long × 182 cm wide (8 ft × 6 ft). Wind velocity measurements were obtained from a Pitot tube upwind of the test section.
Using the same procedure as described in Section “Dynamic Pressure Simulation,” a spectral analysis was performed to compare the peak power of the target frequency input and output data and generate Bode plots of the results (Figure 2E). As with the pressure simulator validation, testing was conducted at 1,200 and 1,600 RPM. Additionally, wind velocity data collected from Hurricane Katrina by the Florida Coastal Monitoring Program were resampled at four intensity levels with mean wind velocity = 15, 25, 35, and 45 m/s. Figure 5 shows these velocity simulations. Fan RPMs were varied: levels 1 and 2 correspond to a rotational speed of 1,200 RPM, level 3 corresponds to 1,450 RPM, and level 4 corresponds to 1,700 RPM. In Figure 5, the solid black line represents the input (or “target”) velocity signal, and the dash-dot gray line describes the measured signal. It can be seen that the simulator follows the target signal well. Table 2 lists the statistics of the input and measured wind velocity time histories. It is seen that the means, coefficients of variation, and the maximum values agree well. The mean absolute error percentages vary from 7.6% down to 1.6% for the four levels.
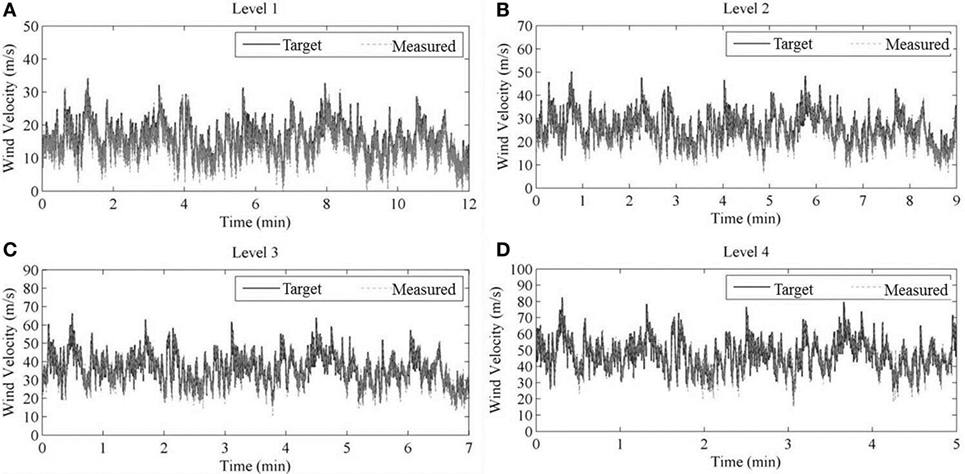
Figure 5. Comparison between the target and measured wind velocity time histories at four levels. (A) Level 1. (B) Level 2. (C) Level 3. (D) Level 4.
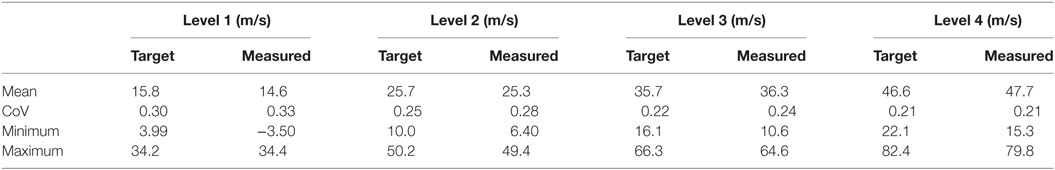
Table 2. Statistics of the input and measured wind velocity at four levels.
Case Study: Sectional Door Systems
This section describes early testing using the simulator to (a) demonstrate that the practicality of conducting FEA in conjunction with FS testing and (b) conduct data acquisition during live tests. The test subjects were sectional (garage) door systems, such as the kind that are used in fire stations and other critical facilities. As these were the first tests in the pressure chamber, the experimental design was chosen to minimize safety risks to personnel and to incrementally evaluate the capabilities of the system. Thus, step-and-hold functions patterns were applied in lieu of dynamic loads, and the loads were applied into the frame to prevent debris from flying into the testing arena. Response to dynamic loading is not addressed here but will be the subject of future studies.
FS Testing
Five commercial sectional doors from different manufacturers were evaluated. Dimensions of the doors spanned from 4.9 to 5.2 m in width and 3.7 to 4.8 m in height. Corresponding design pressures ranged from 2.0 to 2.6 kPa and 2.2 to 3.1 kPa in positive and negative pressure, respectively. Doors were installed to manufacturers’ published guidelines, with the float between the roller and track being kept to less than 5 mm.
Generally, a sectional door used in hurricane-prone regions consists of five principal structural components: door panels, stiles, reinforcing beams (U-bars), hinges, and rollers (Figure 6). The stiles and U-bars provide the primary resistance to out-of-plane loading. Specimens were instrumented as follows:
1. Eight Micro-Measurement C2A-06-250LW-350 strain gages were attached on eight U-bars at their mid-spans (Figure 7A) to measure the longitudinal strain.
2. An OptiTrack Flex-3 motion-capture camera measured displacement by recording the 3D coordinates of traceable spheres attached on U-bars at their mid-spans with sub-millimeter accuracy (Figure 7B).
3. Three SDI Tri-axial 70148-00B-EA00C load cells were installed between the door jamb and the reaction frame of the simulator (Figure 7A). The load cells were located around the rollers at bottom, middle, and top of the specimen (Figure 7A).
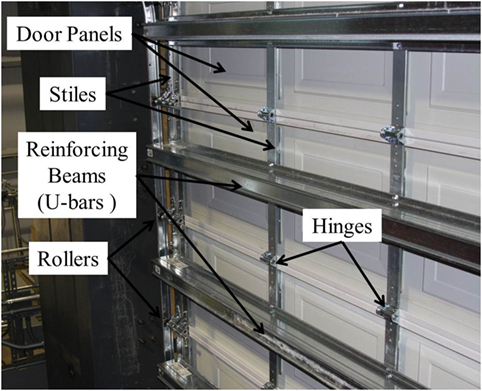
Figure 6. Principal components of a typical sectional door used in hurricane-prone regions.
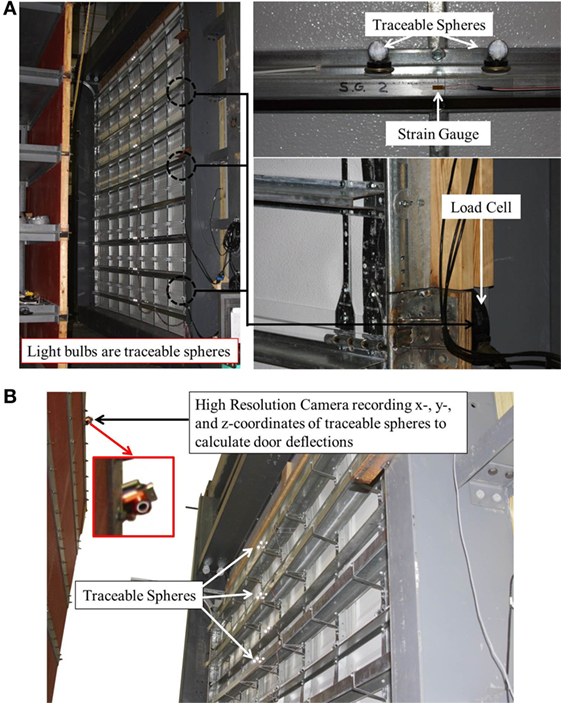
Figure 7. Instruments used in experimental testing: (A) an overview of instrumentations on Door 4 with focused view of traceable spheres, strain gage, and load cell and (B) an illustration on the deflection measurements.
A step-and-hold pressure sequence was applied to each test specimen until failure occurred. Each specimen was assembled and mounted in the pressure chamber according to the installation manual provided by the manufacturer. The door jamb was connected to the reaction frame of the pressure chamber so that their connection would not fail before the failure of the test specimen (i.e., the jamb was attached to a rigid assembly).
Loads were increased in 0.5 kPa (10 psf) increments for each step. Once the desired load was achieved, it was held for ~5 min and then released back to zero. After releasing the load, the operability (i.e., the ability of the door to be cycled upwards or downwards along the tracks) of the specimen was checked. This cycle repeated until a catastrophic failure occurred or was imminent or the door lost its operability. The following failure modes were observed:
1. Local buckling of U-bars, i.e., visible plastic deformation.
2. Disengagement of door panels from the tracks, i.e., separation of the rollers attached at the back of door panels from the tracks.
3. Adhesive failure between stiles and door panels.
The adhesive failure mode appeared to largely be a cosmetic issue and did not affect the overall structural rigidity or operability, thus it was not deemed sufficient damage to stop a test. Individual performance of each door is described below. Note that strain and displacement data are plotted for the pressure intensity level leading up to failure.
• Door 1 (Figure 8A) exhibited a large area of adhesive failure (Figure 8B). After holding the load at −2.0 kPa (−42 psf) for 5 min, the load was released. No obvious plastic deformations were observed for the door panels and other components, and the door was still operable. Between −4.0 kPa (−84 psf) and −4.5 kPa (94 psf), significant local buckling of U-bars was observed, followed by disengagement failure (Figure 8C). Figure 9A presents the pressure–strain and pressure–displacement relationships of Door 1. The strain responses increased almost linearly with the applied load. Note that the strains measured at locations 2 and 5 (i.e., strains at mid-span of the U-bars at the top of door panels 1 and 4) show a sudden change in curvature when the negative pressure was increased from −1.4 kPa (−30 psf) to −1.9 kPa (−40 psf). A possible reason for the change may be the significant adhesive failure during the fourth load step. The displacement–load relationship is almost linear. Studying Figure 9A, note that the adhesive failure of Door 1 affects the strains but has negligible influence on displacements.
• Door 2 (Figure 8D) exhibited a high resistance to static pressure. When the load was increased in Step 12 from −5.5 kPa (−115 psf) to −6.0 kPa (−125 psf), the bottom three U-bars buckled, and disengagement of the bottom four panels from the tracks followed immediately (Figure 8E). Strain and displacement measurements increased linearly with the applied negative pressure (Figure 9B). Fewer displacement measurements are plotted in Figure 9B than the other doors because some of the traceable spheres were not tracked successfully during FS testing on Door 2.
• Door 3 (Figure 8F) exhibited the first sign of damage when the load was increased from −2.0 kPa (−42 psf) to −2.5 kPa (−52 psf). A popping sound was heard, and a small separation between door panels and stiles was noted. Door 3 was able to operate after releasing the pressure from −2.5 kPa (−52 psf). During the next step from −2.5 kPa (−52 psf) to −3.0 kPa (−63 psf), a significant disengagement failure from door panels 2 through 8 was observed (Figure 8G). Measured strains and displacements show a linear relationship with applied negative pressure (Figure 9C). The bottom and top panels (panels 1 and 9) had smaller strain and displacement responses compared to the others, which could be a factor causing disengagement failure of panels 2 through 8.
• Door 4 (Figure 8H) failed in the range of −6.0 kPa (−125 psf) to −6.5 kPa (−136 psf). Significant local buckling failure was observed on the mid-span of the U-bars for door panels 2 through 8 (Figure 8I), and disengagement failure followed (Figure 8J). Strain and displacement responses exhibit an almost linear relationship with applied load (Figure 9D).
• Door 5 (Figure 8K) exhibited an adhesive from −3.5 kPa (−73 psf) to −4.0 kPa (−84 psf) (Figure 8L), but it did not affect the operability of the door. When the load reached −4.5 kPa (−94 psf), local buckling occurred on all U-bars except the top one (Figure 8M). Testing on Door 5 was stopped at −4.5 kPa (−94 psf). No disengagement failure followed, since −4.5 kPa (−94 psf) is the upper limit of the ninth step. With the load increased, the strain and displacement responses increased linearly (Figure 9E).
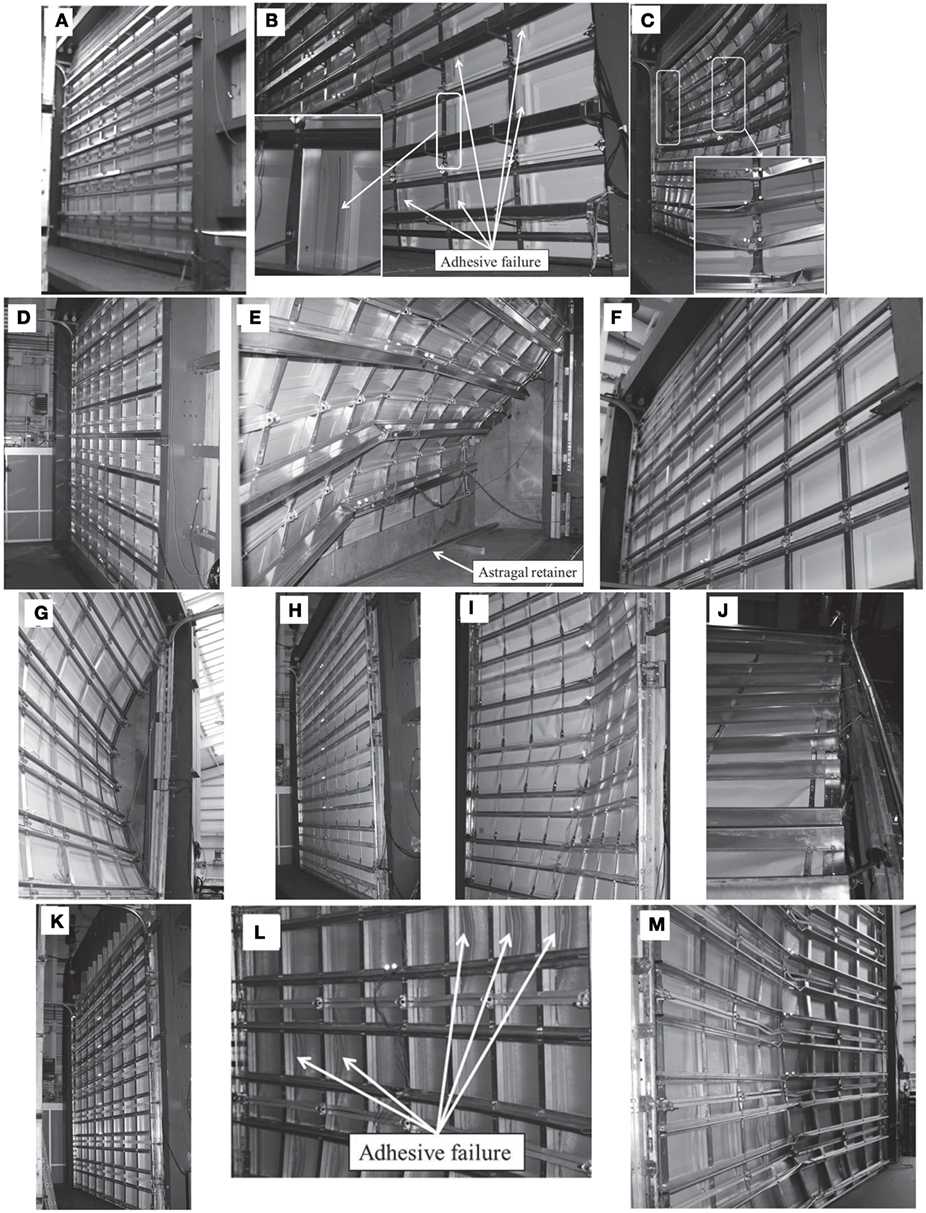
Figure 8. Door 1 (A) before testing, (B) at adhesive failure, and (C) at catastrophic failure; Door 2 (D) before testing and (E) at catastrophic failure; Door 3 (F) before testing and (G) at catastrophic failure; Door 4 (H) before testing, (I) at catastrophic failure showing local buckling of U-bars, and (J) at catastrophic failure showing disengagement of rollers from the tracks; and Door 5 (K) before testing, (L) at adhesive failure, and (M) at catastrophic failure.
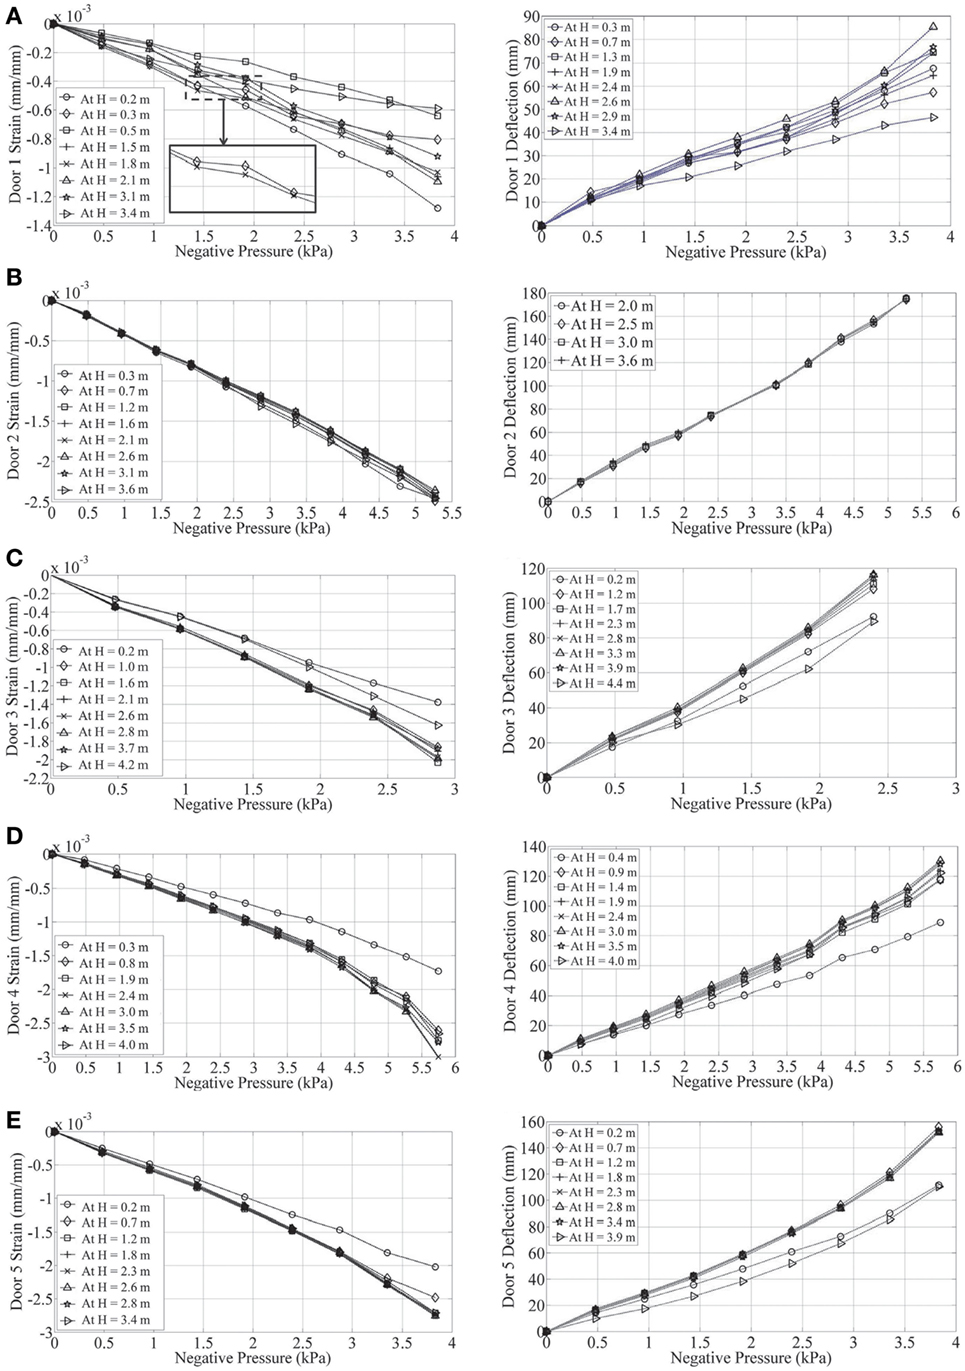
Figure 9. Measured pressure–strain relationships and pressure–displacement relationships for Doors 1–5 [(A–E), respectively] at multiple locations. All strains and displacements are measured at center span (see Figure 7A) at the height indicated in the legend.
Local buckling of U-bars usually led to disengagement failure (Doors 1, 2, and 4); therefore, tests on Doors 1, 2, and 4 were stopped at the occurrence of disengagement failure. Examination after testing on each door specimen presented extreme bending and yielding of roller shafts occurring for Doors 1–4 that had disengagement failure. Summarizing, the failure sequence can be described as: local buckling of U-bars reduced the stiffness of the door and therefore resulted in excessive deflections of door panels, which caused large reaction forces at the rollers constrained in the tracks. The reaction forces produced large moments on the roller shafts and caused their yielding, which prompted the disengagement failure. While Door 3 did not have local buckling failure of U-bars, under that same vacuum load, it showed larger strain and displacement responses compared to the others. Its failure sequence skipped the first step of local buckling mentioned above. Table 3 lists the negative pressure of these specimens at failure compared to their test pressure. According to Florida Building Code Testing Application Standard 202-94 (FBC, 2010), the test pressure for garage doors should be 1.5 times of their design pressure. Door 3 had catastrophic failure of disengagement at a pressure lower than its test pressure.
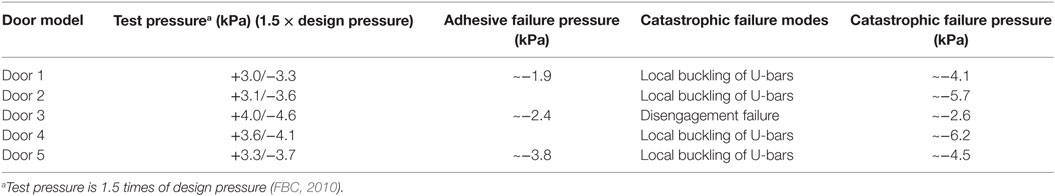
Table 3. Summary of the pressure at failure of test specimens.
Finite Element Analysis
Full-scale experimental testing is an ideal method to understand the performance of a structure under a certain load condition (Sinno, 2008; Morrison, 2010; Aly et al., 2013; etc.). However, due to the inherent time and expense of testing, it is impractical to test many scenarios. Therefore, FEA was applied to complement physical testing to determine its effectiveness to capture the performance of a multi-component system under wind loading. The thought process was that if an FEA model could be quickly validated, it would open up the possibility of predicting performance of new testing configurations (e.g., the same specimen, but with a prescribed construction defect) to inductively research performance on a small set of specimens.
Door 2 was selected for modeling (Figure 10) because it exhibited local buckling failure of U-bars and disengagement failure of door panels as well as the highest failure pressure/test pressure ratio. The FEA model was created in ADINA 8.8 (ADINA, 2011), which accounted for contact constraints, material non-linearity, and second-order effects.
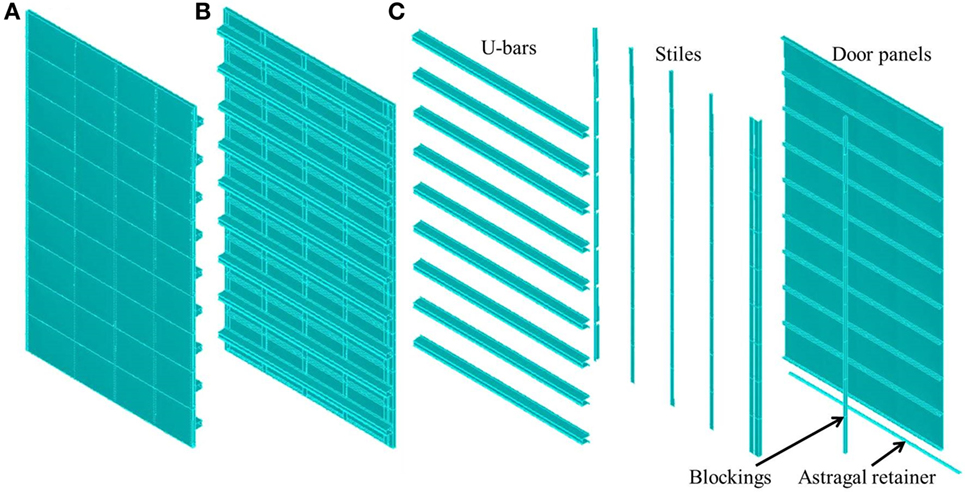
Figure 10. Symmetrical model of Door 2: (A) from a front view; (B) from a back view; and (C) with its components.
The main components of the FE model include the door panels, stiles, and U-bars (modeled as 4-node elastic-perfect plastic steel shell elements), wood blocking (modeled as an 8-node linear-elastic solid element), and the astragal retainer (modeled as a 4-node elastic-perfect plastic aluminum shell element). To simulate the constraints of the door in experimental testing, boundary conditions as described below were used for the model: symmetrical boundary conditions were applied along the vertically spanning centerline. The effects of hinges connecting adjacent door panels were modeled using corresponding constraints at the hinge locations. The connection between the astragal retainer and the bottom door panel, and fasteners used in the physical door (e.g., fasteners connecting U-bars to stiles, and fastener connecting blockings to stiles) were modeled as rigid links, constraining the linked nodes so that they move together when the model deforms. Contact boundary conditions were used between surfaces wherever there were no constraints, but contact might occur (i.e., the bottom of one door panel and the top of the panel below it). As a preliminary model, two simplifications were made in the boundary conditions:
1. The adhesive connecting stiles to door panels was modeled as rigid links.
2. The rollers were not included in the FEA model, and instead the constraints from them were treated as boundary conditions along the sides of the model.
The material properties of door panels, stiles, and U-bars were provided by the manufacturer. For the blocking material, properties of No. 2 southern yellow pine were elastic modulus E = 9,804 MPa (1,422 ksi), density ρ = 554 kg/m3 (34.5 lb/ft3), and Poisson’s ratio μ = 0.33. For the aluminum, the properties were E = 68,948 MPa (10,000 ksi), ρ = 2,685 kg/m3 (167.6 lb/ft3), μ = 0.33, and yielding strength σyield = 276 MPa (40 ksi), respectively. The same load measured during the experiment was applied on the model.
Figure 11 shows the catastrophic failure of Door 2 and FEA model results, which are nearly identical. The FEA captured successive failures states, i.e., local buckling of U-bars at −5.5 kPa (−115 psf) followed by a disengagement failure at −5.7 kPa (−120 psf). The comparisons between FEA and experimental results in strain and displacement responses are shown in Figure 12. The load limit in Figure 12 is −5.3 kPa (−110 psf) to be consistent with the plot showing experimental measurements. From the strain and displacement comparisons, the following can be seen: (a) FEA results match well with experimental measurements in both strain and displacement responses of Door 2 and (b) the difference between FEA results and experimental measurements at larger loads is more than that at smaller loads. Differences may be attributed to the repeated step-and-hold loading pattern causing material fatigue (e.g., connecting fasteners, roller shafts, etc.) and therefore decreasing the structural stiffness; simplifications in boundary conditions might miss the deformation at the roller/track interface. These results clearly demonstrate the value of combining FEA with FS testing. This success is an important finding for the field, which today is still heavily reliant on empirical data or simplified closed-form solutions to predict behavior.
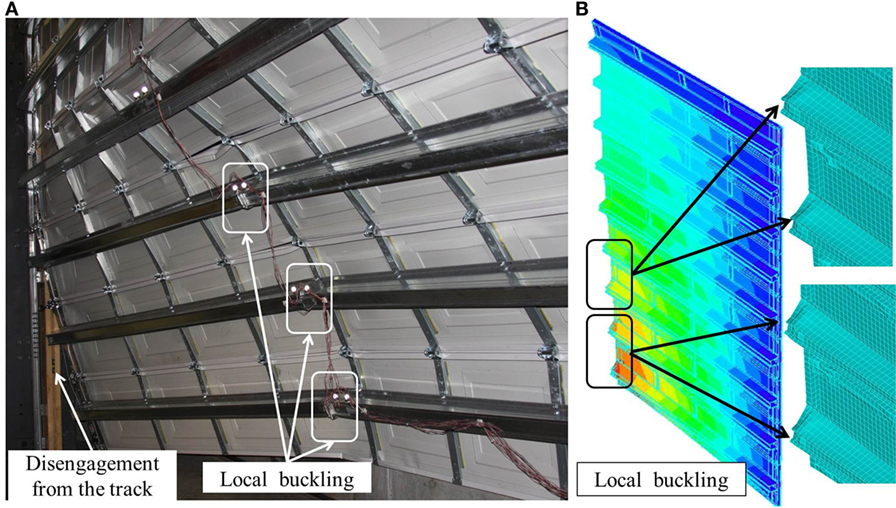
Figure 11. Catastrophic failure of Door 2: (A) in experimental testing—buckling followed by disengagement from the track and (B) in finite element analysis—analysis that ends when buckling occurs.
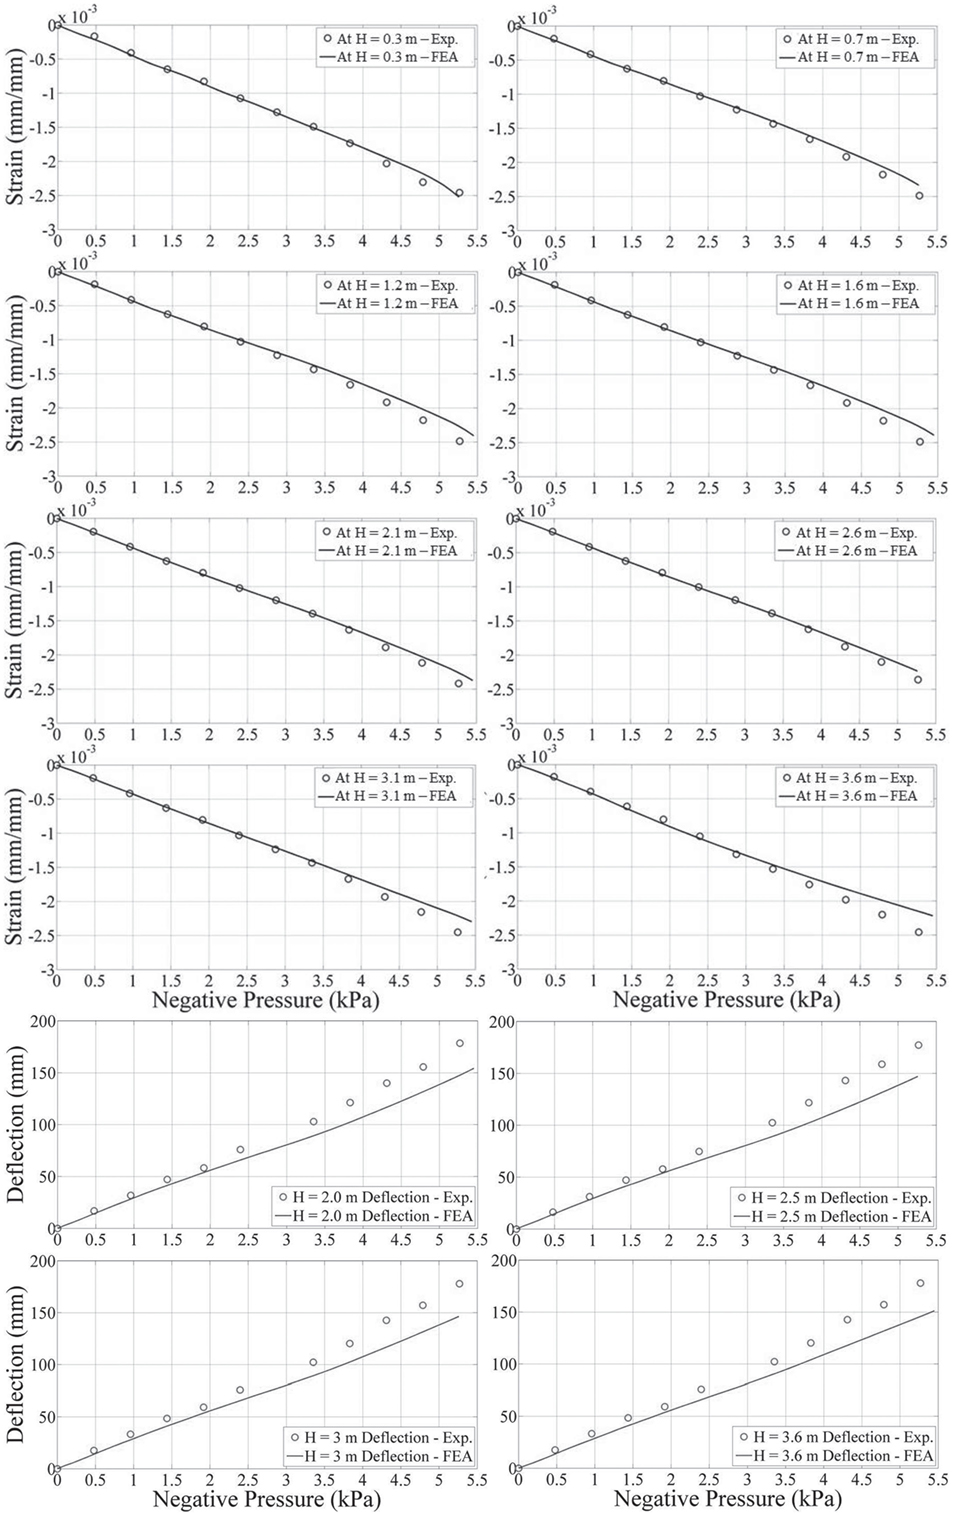
Figure 12. Strain and displacement comparisons between finite element analysis (FEA) results and experimental measurements.
Conclusion
This paper presents a new large-scale dynamic wind pressure simulator developed at the University of Florida. The simulator was designed to produce wind pressures associated with a SSHWS Category 5 hurricane to test FS building components. The simulator showed an acceptable fidelity to replicate time-varying wind pressure loads up to ~1 Hz, without additional modification (e.g., adjustment of tuning parameters in the closed-loop control system to improve fidelity or modification of leakage conditions). The system can be widely applied to a wide range of wind engineering applications, including out-of-plane loading of components and cladding. FS experiments on whole as-installed systems provide more realism but at a much greater cost than component level testing. Further, this paper demonstrated the practical use of FEA to quickly model the specimen. This approach, combining FS experimental testing and numerical analysis, offers a reliable and cost-efficient way to determine the fragility of building components under various hazard intensities and is ideally suited for a performance-based engineering approach (e.g., McCullough and Kareem, 2011).
Author Contributions
SS assisted with the design of the testing apparatus and performed the computational analysis and FEA. FM facilitated the overall design and construction of the testing apparatus and provided overall coordination for the experimental testing. HU led the design team. JS assisted with the performance testing.
Conflict of Interest Statement
The authors declare that the research was conducted in the absence of any commercial or financial relationships that could be construed as a potential conflict of interest.
Acknowledgments
The authors wish to acknowledge Special-Lite Inc. for sponsoring research and development. Additional support was provided by Oak Ridge National Laboratory through the Southeast Region Research Initiative (SERRI), as well as the Florida Building Commission. The authors would also like to thank Jimmy Jesteadt, Alex Esposito, Ken Bowditch, Brian Rivers, and Dr. Gary Consolazio for their assistance in experimental testing and finite element analysis.
References
ADINA. (2011). ADINA Theory and Modeling Guide Volume 1: ADINA Solids & Structures. Watertown, MA: ADINA R&D Inc.
Aly, A. M., Chowdhury, A. G., and Erwin, J. (2013). Design and fabrication of a new open jet electric-fan wall of wind facility for coastal research. Coast. Hazards. 29, 137–148. doi: 10.1061/9780784412664.014
AS/NZS 1170.2:2011. (2011). Structural Design Actions – Part 2: Wind Actions. Sydney, NSW: SAl Global Limited under licence from Standards Australia Limited.
ASCE 7. (2010). ASCE Standard, Minimum Design Loads for Buildings and Other Structures. Reston, VA: ASCE Standard 7-10.
ASTM. (2006). Standard Test Method for Structural Performance of Exterior Windows, Doors, Skylights, and Curtain Walls by Cyclic Air Pressure Differential. Philadelphia: ASTM E1233.
ASTM. (2009). Standard Test Method for Structural Performance of Exterior Windows, Doors, Skylights and Curtain Walls by Uniform Static Air Pressure Difference. Philadelphia: ASTM E330.
ASTM. (2012). Specification for Performance of Exterior Windows, Curtain Walls, Doors, and Impact Protective Systems Impacted by Windborne Debris in Hurricanes. Philadelphia: ASTM E1996.
ASTM. (2013). Standard Test Method for Performance of Exterior Windows, Curtain Walls, Doors, and Impact Protective Systems Impacted by Missile(s) and Exposed to Cyclic Pressure Differentials. Philadelphia: ASTM E1886.
Cook, N. J. (1992). Dynamic response of single-ply membrane roofing systems. J. Wind Eng. Ind. Aerod. 42, 1525–1536. doi:10.1016/0167-6105(92)90161-3
Cook, N. J., Keevil, A. P., and Stobart, R. K. (1988). Brerwulf – the big bad wolf: I’ll huff and I’ll puff and I’ll blow your house down! J. Wind Eng. Ind. Aerod. 29, 99–107. doi:10.1016/0167-6105(88)90149-3
FBC. (2010). Criteria for Testing Impact & Nonimpact Resistant Building Envelope Components Using Uniform Static Air Pressure. Washington, DC: FBC TAS 202-94, International Code Council Inc.
FEMA. (2005). Summary Report on Building Performance: 2004 Hurricane Season. Washington, DC: FEMA 490.
Ginger, J. D., Henderson, D. J., Leitch, C. J., and Boughton, G. N. (2007). Tropical Cyclone Larry: estimation of wind field and assessment of building damage. Aust. J. Struct. Eng. 7, 209–224.
Golos, K., and Ellyin, F. (1987). Generalization of cumulative damage criterion to multilevel cyclic loading. Theor. Appl. Fract. Mech. 7, 169–176. doi:10.1016/0167-8442(87)90032-2
Gurley, K. R., and Masters, F. J. (2011). Post-2004 hurricane field survey of residential building performance. Nat. Hazards Rev. 12, 177–183. doi:10.1061/(ASCE)NH.1527-6996.0000044
Henderson, D. J., and Ginger, J. D. (2011). Response of pierced fixed corrugated steel roofing systems subjected to wind loads. Eng. Struct. 33, 3290–3298. doi:10.1016/j.engstruct.2011.08.020
Henderson, D. J., Morrison, M. J., and Kopp, G. A. (2013). Response of toe-nailed, roof-to-wall connections to extreme wind loads in a full-scale, timber-framed, hip roof. Eng. Struct. 56, 1474–1483.
Ho, T. C. E., Surry, D., and Morrish, D. (2003). NIST/TTU Cooperative Agreement – Windstorm Mitigation Initiative: Wind Tunnel Experiments on Generic Low Buildings. London, ON: The Boundary Layer Wind Tunnel Laboratory, The University of Western Ontario, 106.
Kopp, G., Morrison, M., Gavanski, E., Henderson, D., and Hong, H. (2010). ‘Three Little Pigs’ project: hurricane risk mitigation by integrated wind tunnel and full-scale laboratory tests. Nat. Hazards Rev. 11, 151–161. doi:10.1061/(ASCE)NH.1527-6996.0000019
Kopp, G. A., Morrison, M. J., and Henderson, D. J. (2012). Full-scale testing of low-rise, residential buildings with realistic wind loads. J. Wind Eng. Ind. Aerod. 10, 25–39. doi:10.1016/j.jweia.2012.01.004
Li, Z. X., Chan, T. H. T., and Ko, J. M. (2001). Fatigue analysis and life prediction of bridges with structural health monitoring data – part I: methodology and strategy. Int. J. Fatigue 23, 45–53. doi:10.1016/S0142-1123(00)00068-2
Mahendran, M. (2003). Simulation of Cyclonic Wind Forces on Roof Claddings by Random Block Load Testing. Technical Report 0158-8338, No. 38. Townsville, QLD: James Cook University of North Queensland. Cyclone Testing Station.
McCullough, M., and Kareem, A. (2011). “A framework for performance-based engineering in multi-hazard coastal environments,” in Structures Congress 2011, eds D. Ames, T. L. Droessler, and M. Holt (Las Vegas: American Society of Civil Engineers), 1961–1972.
Minor, J. (2005). Lessons learned from failures of the building envelope in windstorms. J. Architect. Eng. 11, 10–13. doi:10.1061/(ASCE)1076-0431(2005)11:1(10)
Morrison, M. (2010). Response of a Two-Story Residential House under Realistic Fluctuating Wind Loads. Ph.D. thesis, The University of Western Ontario, London, ON, Canada.
Oh, J. H. (2004). Wind-Induced Internal Pressure in Low-Rise Building. MS thesis, The University of Western Ontario, London, ON, Canada.
Rosowsky, D., and Schiff, S. (2003). What are our expectations, objectives, and performance requirements for wood structures in high wind regions? Nat. Hazards Rev. 4, 144–148. doi:10.1061/(ASCE)1527-6988(2003)4:3(144)
Sinno, R. R. (2008). Response of Metal Roofs to Uniform Static and True Hurricane Wind Loads. International Specialty Conference on Cold-Formed Steel Structures. Available at: http://scholarsmine.mst.edu/isccss/19iccfss/19iccfss-session5/1
Keywords: hurricane, wind, full-scale, destructive testing, garage door
Citation: Shen SY, Masters FJ, Upjohn HL II and Sinnreich J (2017) Simulation of Time-Varying Spatially Uniform Pressure and Near-Surface Wind Flows on Building Components and Cladding. Front. Built Environ. 3:24. doi: 10.3389/fbuil.2017.00024
Received: 14 October 2016; Accepted: 30 March 2017;
Published: 04 May 2017
Edited by:
Gregory Alan Kopp, University of Western Ontario, CanadaReviewed by:
David James Henderson, James Cook University Townsville, AustraliaE. N. Farsangi, Qazvin Islamic Azad University, Iran
Copyright: © 2017 Shen, Masters, Upjohn and Sinnreich. This is an open-access article distributed under the terms of the Creative Commons Attribution License (CC BY). The use, distribution or reproduction in other forums is permitted, provided the original author(s) or licensor are credited and that the original publication in this journal is cited, in accordance with accepted academic practice. No use, distribution or reproduction is permitted which does not comply with these terms.
*Correspondence: Forrest J. Masters, masters@ce.ufl.edu